AUTOIMMUNITY
20.9K views | +14 today
 
Scooped by Gilbert C FAURE
onto AUTOIMMUNITY
November 8, 2019 1:29 PM
Scoop.it!

JCI - Splicing factor SRSF1 controls T cell hyperactivity and systemic autoimmunity

JCI - Splicing factor SRSF1 controls T cell hyperactivity and systemic autoimmunity | AUTOIMMUNITY | Scoop.it
Research ArticleAutoimmunityImmunology Free access | 10.1172/JCI127949 Splicing factor SRSF1 controls T cell hyperactivity and systemic autoimmunity Takayuki Katsuyama,1 Hao Li,1 Denis Comte,1,2 George C. Tsokos,1 and Vaishali R. Moulton1 First published September 5, 2019 - More info Abstract Systemic lupus erythematosus (SLE) is a devastating autoimmune disease in which hyperactive T cells play a critical role. Understanding molecular mechanisms underlying the T cell hyperactivity will lead to identification of specific therapeutic targets. Serine/arginine-rich splicing factor 1 (SRSF1) is an essential RNA-binding protein that controls posttranscriptional gene expression. We have demonstrated that SRSF1 levels are aberrantly decreased in T cells from patients with SLE and that they correlate with severe disease, yet the role of SRSF1 in T cell physiology and autoimmune disease is largely unknown. Here we show that T cell–restricted Srsf1-deficient mice develop systemic autoimmunity and lupus-nephritis. Mice exhibit increased frequencies of activated/effector T cells producing proinflammatory cytokines, and an elevated T cell activation gene signature. Mechanistically, we noted increased activity of the mechanistic target of rapamycin (mTOR) pathway and reduced expression of its repressor PTEN. The mTOR complex 1 (mTORC1) inhibitor rapamycin suppressed proinflammatory cytokine production by T cells and alleviated autoimmunity in Srsf1-deficient mice. Of direct clinical relevance, PTEN levels correlated with SRSF1 in T cells from patients with SLE, and SRSF1 overexpression rescued PTEN and suppressed mTORC1 activation and proinflammatory cytokine production. Our studies reveal the role of a previously unrecognized molecule, SRSF1, in restraining T cell activation, averting the development of autoimmune disease, and acting as a potential therapeutic target for lupus. Graphical Abstract Introduction Systemic lupus erythematosus (SLE) is a chronic debilitating multi-system autoimmune disease that disproportionately afflicts women, causing significant morbidity and mortality (1, 2). Failure of the immune system to recognize self-antigens leads to inappropriate immune responses, systemic autoimmunity, and organ damage. The identification of novel molecules and mechanisms underlying the pathogenic immune response in SLE will guide the development of appropriate therapeutic targets. While autoreactive B cells, autoantibodies, and immune complexes are important in disease pathogenesis (3), and elevated type I interferons (IFNs) have been implicated in disease (4, 5), therapeutic strategies targeting B cells and type I IFN signaling in SLE have shown limited success. In this regard, the role of T cells in disease pathogenesis is beginning to be understood, and therapeutic strategies targeting T cells are emerging (6). Aberrantly activated effector T (Teff) cells and cytokines that orchestrate not only germinal center B cell responses for autoantibody production (7–9) but also promote inflammatory infiltration in target organs (10, 11), are critical players in disease pathogenesis. These Teff cells and cytokines are found both in lupus-prone mice and in patients with SLE (12–15), and therefore are potential promising therapeutic targets. Yet the molecules and mechanisms which control the activated T cell phenotype in SLE are poorly understood. A key pathway involved in the activation of T cells is the phosphoinositide-3 kinase (PI3K)/AKT/mechanistic target of rapamycin (mTOR) pathway. The mTOR pathway determines cell fate decisions of T cell activation, differentiation, proliferation, and cell death (16). Resting quiescent T cells have low levels of mTOR activity, while mTOR complex 1 (mTORC1) activation leads to increased proportions of activated/effector cells and a decreased pool of naive cells (17). Recently, mTOR activation has emerged as a central regulator of T cell dysfunction in systemic autoimmune diseases and as a promising therapeutic target for SLE (15, 18). Increased activity of the mTORC1 pathway in T cells is known to promote the aberrant production of cytokines IFN-γ, IL-17, and IL-4 (19, 20), and contribute to systemic autoimmunity (9). Furthermore, activation of mTORC1 is associated with altered aberrantly activated T cell responses in patients with SLE (21, 22). The phosphatase and tensin homolog (PTEN), a lipid phosphatase, negatively regulates the PI3K/Akt signaling pathway (23) and inhibits the activity of the mTOR pathway (24). PTEN-deficient T cells are hyperresponsive to TCR stimulation (25), and Pten deletion in T cells in mice leads to autoimmune lymphoproliferative disease and aberrant production of cytokines (26, 27). PTEN expression is decreased in B cells from patients with SLE and contributes to B cell hyperactivity (28). However, it is still unknown whether PTEN is altered in T cells from patients with SLE and whether it contributes to T cell hyperactivity. Serine arginine-rich splicing factor 1 (SRSF1), previously known as splicing factor 2/alternative splicing factor (SF2/ASF), is the prototype member of the highly conserved serine arginine (SR) family of RNA-binding proteins. SRSF1 controls posttranscriptional gene expression via pre-mRNA alternative splicing, mRNA stability, and translation (29). While SRSF1 is an essential ubiquitous molecule that controls genes involved in cell survival and proliferation (30), little is known of its role in the immune system. T cells from patients with SLE display hyperactive T cell receptor (TCR)/CD3+ signaling and proinflammatory cytokine production (1, 31). This overactive lupus T cell phenotype is associated with a reduced expression of the CD3 zeta (ζ) chain (32), attributed in part to defective alternative splicing of its 3′ UTR (33). Using discovery approaches, we found that SRSF1 binds to the 3′ UTR of the CD3ζ mRNA in human T cells (34, 35). We showed that SRSF1 promotes normal expression of CD3ζ by limiting expression of an unstable isoform of its 3′ UTR (35) and that SRSF1 levels decrease upon T cell activation (36). We demonstrated that SRSF1 expression is aberrantly decreased in T cells from patients with SLE and correlates with severe disease (37)(38). In addition, decreased SRSF1 expression levels have been linked to the defective expression of multiple autoantigen transcripts in the organ-specific autoimmune inflammatory myositis (39). Thus, studies in humans suggest that the reduced expression of SRSF1 correlates with an activated T cell phenotype and the expression of autoimmune disease. However, evidence of a causal in vivo relationship among SRSF1, T cell dysfunction, and autoimmune disease is still lacking. Here we show that mice that lack Srsf1 in mature T cells develop systemic autoimmunity and lupus nephritis with increased proportions of activated/effector T cell populations and proinflammatory cytokine-producing T cells. Mechanistically, we show that T cells from Srsf1-deficient mice exhibit increased mTOR activity and reduced expression of its negative regulator PTEN, whereas rapamycin and overexpression of PTEN normalize the inflammatory cytokine production. Importantly, PTEN levels are reduced in patients with SLE with lower SRSF1 expression and SRSF1 rescues PTEN levels, suppresses mTORC1 activity, and reduces proinflammatory cytokine production by T cells from patients with SLE. Our studies demonstrate that SRSF1 is a previously unrecognized molecule that restrains T cell activation and controls the development of autoimmune disease. Results Srsf1-cKO mice developed autoimmunity and lupus nephritis. Because germline Srsf1 deletion is embryonic lethal (40), we generated conditional distal.Lckcre.Srsf1fl/fl (Srsf1-cKO hereafter) mice to study the role of SRSF1 in T cells (Supplemental Figure 1, A and B; supplemental material available online with this article; https://doi.org/10.1172/JCI127949DS1). At birth, Srsf1-cKO mice were viable with normal external features and body weight (Supplemental Figure 1C). As expected (the distal Lck promoter is expressed late in thymic development and mainly in mature T cells), T cell development was normal in Srsf1-cKO mice (Supplemental Figure 1, C–F). We asked whether the Srsf1-cKO mice develop signs of autoimmunity. We measured autoantibodies in the sera of Srsf1-cKO mice using microarray analyses of serum IgG reactivity against a 128-autoantigen panel, which includes the lupus-associated autoantigens dsDNA, histones, and a number of nuclear, membrane, phospholipid, and cytoplasmic protein autoantigens (Figure 1A). Serum from a lupus-prone MRL/lpr mouse, which spontaneously develops an autoimmune lupus-like disease, was included as positive control. We found that Srsf1-cKO mice develop a wide array of lupus-associated autoantibodies at levels comparable to those seen in MRL/lpr mice (Figure 1A). We confirmed by ELISA the presence of antinuclear (ANA) antibodies in sera from Srsf1-cKO mice (Supplemental Figure 2A). In aged mice (12–18 months), we observed a lymphoproliferative phenotype (Figure 1B and Supplemental Figure 2B). We also found that T cells from Srsf1-cKO mice exhibit increased proliferative capacity as assessed by Ki67 staining (Figure 1C). The kidneys of aged Srsf1-cKO mice showed histopathologic evidence of lupus nephritis with glomerulonephritis, mesangial and endocapillary proliferation, and interstitial inflammatory cell infiltration (Figure 1D) with significantly higher histopathology scores compared with control mice (Figure 1E). Immunohistochemistry staining showed T cell infiltration in kidneys of Srsf1-cKO mice (Supplemental Figure 2C). Srsf1-cKO mice developed significant proteinuria compared with WT mice (Figure 1F). These results demonstrate that the loss of SRSF1 in T cells leads to systemic autoimmunity and lupus-like disease. Figure 1 Srsf1-cKO mice develop systemic autoimmunity and lupus nephritis. (A) Heatmaps show autoantibody microarray data from sera of 12-week-old WT and Srsf1-cKO mice (n = 3 each) and 1 MRL/lpr mouse, analyzed for IgG reactivity against a 128-autoantigen panel. (B) Spleen images from aged (12- to 18-month-old) WT and Srsf1-cKO mice. Data are representative of at least 4 independent experiments. (C) Flow cytometry plots and graphs show Ki67 staining on live-gated CD4+ and CD8+ T cells from spleen of WT and Srsf1-cKO mice (2- to 18-month-old, n = 11 [WT], n = 8 [KO]). (D) Representative light microscopy images of H&E-stained paraffin sections of kidneys from aged (9- to 18-month-old) mice. Original magnification ×40. Arrows represent mesangial and endocapillary proliferation (upper) and interstitial inflammatory cell infiltration (lower). (E) Graph shows semiquantitative scores for kidney histopathology (n = 12 [WT], n = 9 [KO]). (F) Graph shows proteinuria from WT and Srsf1-cKO mice (n = 7 each). Mann-Whitney U test (E); unpaired t test (C and F); *P < 0.05, ***P < 0.005. T cells from Srsf1-cKO mice exhibited a hyperactive phenotype and produced proinflammatory cytokines. Examination of peripheral lymphoid T cells from spleen revealed significantly increased proportions of activated CD69hi cells (Figure 2, A and B), and effector/memory CD44hiCD62Llo and CD44hiCD62Lhi populations in the CD4 and CD8 compartments (Figure 2, C and D). In parallel, we recorded a significant reduction in the naive T cell pool in both CD4 and CD8 compartments (Figure 2E). Further, we found increased proportions of IL-17–, IFN-γ–, and IL-4–producing CD4+ T cells, and IFN-γ–producing CD8+ T cells from Srsf1-cKO mice (Figure 2F). In addition, we found that the frequencies of CD4+ CXCR5+PD1+ T follicular helper (Tfh) cells were increased in Srsf1-cKO mice (Figure 2G). We also detected the increased presence of spontaneous germinal centers in the spleens from Srsf1-cKO mice (Supplemental Figure 2D). We found that the frequencies of GL7+Fas+ germinal center B cells were increased in Srsf1-cKO mice (Supplemental Figure 2E). In addition, IgD– memory/plasma B cells were also increased in Srsf1-cKO mice (Supplemental Figure 2F). There was no difference in the frequencies and absolute numbers of B cells, CD11b+ cells, and CD11c+ cells in spleen of control WT and Srsf1-cKO mice (Supplemental Figure 3, A and B). The frequencies of CD4+CD25+FoxP3+ Treg cells in Srsf1-cKO mice were comparable with those of control mice (Supplemental Figure 4, A and B) and suppressed the proliferation of conventional T (Tconv) cells normally in in vitro Treg suppression assays for 3 days (Supplemental Figure 4, C and D). These results show that loss of SRSF1 induces the development of activated, inflammatory cytokine-producing T cells. Figure 2 T cells from Srsf1-cKO mice have a hyperactive phenotype and produce proinflammatory cytokines. Spleen cells were isolated from WT and Srsf1-cKO mice and analyzed by flow cytometry. (A) Plots show CD69 expression gated on live CD4+ T cells. (B) Graph shows percent of CD69+CD4+ T cells (n = 13 [WT], n = 14 [KO]; < 20-week-old mice). (C) Plots show CD62L and CD44 staining gated on live CD4+ and CD8+ T cells in spleen (D) Graphs show percent of activated effector/ memory subsets (CD44hiCD62Lhi and CD44hiCD62Llo) of CD4+ and CD8+ T cells (CD4+: n = 11 [WT], n = 13 [KO]; CD8+: n = 18 [WT], n = 16 [KO]; < 20-week-old mice). (E) Graphs show percentage of naive (CD44loCD62Lhi) CD4+ and CD8+ T cells (CD4+: n = 11 [WT]; n = 13 [KO]; CD8+: n = 18 [WT], n = 16 [KO]; < 20-week-old mice). (F) Spleen cells were stimulated for 4 hours with PMA, ionomycin with monensin followed by surface and intracellular cytokine staining for flow cytometry. Plots show IL-17, IL-4, and IFN-γ staining gated on live CD4+ and CD8+ T cells. Graphs below show percentage of cytokine-producing CD4+ and CD8+ T cells from spleen (IL-17: n = 8 each; IL-4: n = 6–7; CD4+ IFN-γ: n = 13 each; CD8+ IFN-γ: n = 3–4; CD4+: < 20-week-old mice; CD8+: 9- to 40-week-old mice). (G) Splenocytes from WT or Srsf1-cKO mice were stained for PD1 and CXCR5 by flow cytometry. Plots show cells gated on live CD4+ T cells. Graph below shows percentage of Tfh cells (n = 20 [WT]; n = 21 [KO]; 10- to 28-week-old mice). Unpaired t test, *P < 0.05, **P < 0.005. Transcriptomics analysis of CD4+ Teff cells from Srsf1-cKO mice revealed an elevated T cell activation gene signature. Because the Srsf1-cKO mice develop autoimmune inflammatory disease, and exhibit increased proportions of proinflammatory Teff cells, we asked whether SRSF1 controls the genes and pathways involved in T cell activation and differentiation. We performed transcriptomics analysis by RNA-sequencing of CD4+ Teff cells derived by stimulation of naive CD4+ T cells with anti-CD3 and anti-CD28 for 72 hours, from 7-week-old control WT or Srsf1-cKO mice with 3 mice per group (Figure 3 and Table 1). At the fold change greater than 1, and a P value less than 0.05, 890 genes were upregulated and 1021 genes downregulated in Srsf1-cKO mice compared with control mice, whereas at the fold change greater than 2 cutoff, and a P value less than 0.05, 312 genes were upregulated and 300 genes were downregulated in Srsf1-cKO mice compared with normal mice (Figure 3A). Gene Ontology (GO) enrichment and Kyoto Encyclopedia of Genes and Genomes (KEGG) pathway analyses revealed the top pathways to include genes associated with T cell activation, regulation of protein secretion, cytokine-cytokine receptor interaction, cell cycle, Th17 differentiation, and Th1 and Th2 differentiation (Table 1). Cluster analysis revealed predominantly genes involved in T cell activation, protein secretion, cytokine production, ribosome assembly, cell cycle, and chromatin modifications (Figure 3B). The expression levels of multiple cytokines including Ifng, Il17, Il4, and Il21 were found to be increased (Figure 3C). Because IL-21 is known to play important roles in Tfh differentiation, the increased Il21 expression may contribute to the observed increase in Tfh cells in Srsf1-cKO mice. These data indicate that SRSF1 controls genes involved in T cell activation, differentiation, and cytokine production, and the loss of SRSF1 leads to unrestrained activation and proinflammatory phenotype of T cells. Figure 3 Transcriptomics analysis of CD4+ Teff cells from Srsf1-cKO mice reveals an elevated T cell activation gene signature. (A) CD4+ Teff cells were generated as follows. Naive CD4+ T cells were sorted from spleens of WT and Srsf1-cKO mice (n = 3 each), and stimulated with anti-CD3 (0.5 μg/mL) and anti-CD28 (1.0 μg/mL) for 72 hours. RNA-sequencing data analysis shows differentially expressed (DE) genes with fold change (FC) differences at P < 0.05. (B) GO terms enrichment map of DE genes. The size of the red circles indicates the number of genes within a given pathway, and the color represents the P values relative to the other displayed terms. Outlines (added manually) indicate groups of similar GO terms. (C) Heatmap showing average expression of DE cytokine genes in WT and Srsf1-cKO mice. Table 1 Pathway analysis of RNA-sequencing of CD4+ Teff cells from Srsf1-cKO mice T cells from Srsf1-cKO mice displayed increased activation of the mTORC1 pathway and reduced expression of PTEN. It is known that Pten-deficient mice exhibit features of T cell hyperactivity with increased proinflammatory cytokines and autoimmunity (27). Further, activation of the mTOR pathway is associated with hyperactive T cell responses with inflammatory cytokine production in patients with SLE (15, 21, 22). In our transcriptomics analysis from Srsf1-cKO mice, a number of genes of the PI3K/AKT/mTOR pathway were differentially expressed, and the expression of its repressor PTEN was found to be downregulated (Figure 4A). Given these findings, we examined the activity of the mTOR pathway in the Srsf1-cKO mice. We found increased expression of phosphorylated S6 (pS6) protein levels in CD4+ Teff cells derived by stimulation of naive CD4+ T cells with anti-CD3 and anti-CD28 for 72 hours, indicating an increased activity of the mTORC1 pathway (Figure 4B). It was previously reported that SRSF1 regulates the splicing of S6K1, an mTORC1 downstream signaling molecule, and modulates the mTOR pathway in cell lines (41). We found that deletion of Srsf1 in T cells results in the decrease of the short isoform of S6K1 (Supplemental Figure 5), consistent with previous reports. Although this short isoform of S6K1 associates with activation of the mTORC1 pathway (42), in the present study we found that serine-threonine kinase AKT, upstream of S6K1, is activated in CD4+ Teff cells from Srsf1-cKO mice (Figure 4C). Therefore, we hypothesized that decreased PTEN levels result in the activation of mTOR pathway. We confirmed the decreased mRNA (Figure 4D) and protein (Figure 4E) expression levels of PTEN in T cells from Srsf1-cKO mice. Because SRSF1 controls gene expression at the posttranscriptional level, which is frequently mediated through the 3′ UTR, we investigated the effect of SRSF1 on the 3′ UTR activity of PTEN. Cotransfection of a PTEN 3′ UTR–luciferase construct along with an Srsf1-expression vector in HEK293T cells revealed an increase in PTEN 3′ UTR activity (Figure 4F). Transfection of the PTEN 3′ UTR into freshly isolated total T cells from Srsf1-cKO mice led to decreased 3′ UTR activity, which was rescued by the overexpression of SRSF1 (Figure 4G). These results show that SRSF1 controls the expression of PTEN and loss of SRSF1 leads to reduced PTEN expression and increased activity of the mTOR pathway. Figure 4 T cells from Srsf1-cKO mice exhibit increased activation of the mTORC1 pathway and reduced expression of PTEN. (A) Fold expression of the mTOR pathway genes from RNA-sequencing data. (B–D) Naive CD4+ T cells were isolated from spleens of mice, and stimulated with anti-CD3 (0.5 μg/mL) and anti-CD28 (1.0 μg/mL) for 72 hours. (B) Total protein was immunoblotted for pS6 and total S6. Data are from 1 representative of 3 independent experiments. Graph shows relative densitometry quantitation of pS6 and S6 (n = 3 each). (C) After 72 hours, additional stimulation with anti-CD3 (10 μg/mL) and anti-CD28 (10 μg/mL) for 5 minutes was performed. Total protein was immunoblotted for p-AKT and total AKT. Data are from 1 representative of 4 independent experiments. Graph shows relative densitometry quantitation of p-AKT and AKT (n = 4 each). (D) Total RNA was isolated and reverse transcribed. Pten expression was measured by real-time qPCR and normalized to housekeeping gene cyclophilin A (n = 5 each). (E) Total protein was isolated from total T cells and immunoblotted for PTEN and β-actin. Data are from 1 representative of 4 independent experiments. Graph shows densitometric quantitation of PTEN normalized to β-actin (n = 4 each). (F) HEK293T cells were transfected with a pGL3–PTEN 3′ UTR luciferase plasmid and cotransfected with either a pcDNA3.1 empty vector (EV) or an Srsf1 (pSrsf1) plasmid, and included an internal control pRL-TK luciferase plasmid. Cells were lysed and dual luciferase assays performed. Graph shows relative luciferase units normalized to the internal luciferase control from n = 4 in 4 independent experiments. (G) T cells from spleens of mice were transfected with a PTEN-3′ UTR luciferase plasmid and either EV or pSrsf1 plasmid. Twenty-four hours later, cells were lysed and luciferase activity measured as in F (n = 7). Unpaired t test (B–E); 1-way ANOVA with Bonferroni’s correction (F and G); *P < 0.05, **P < 0.005, ***P < 0.0005; mean ± SEM. Rapamycin treatment reduced proinflammatory cytokine production by T cells and alleviated autoimmunity in Srsf1-cKO mice. Recently, hyperactivity of the mTOR pathway has been associated with aberrant T cell responses in SLE (15, 43), and targeted inhibition of this pathway with the lipophilic macrolide antibiotic rapamycin has led to improved T cell function and shown efficacy in a recent clinical trial in patients with active SLE (44). To assess whether the increased mTORC1 activation of T cells from Srsf1-cKO mice contributes to their proinflammatory phenotype and autoimmune phenotype, we examined the effect of rapamycin. Treatment of spleen cells from Srsf1-cKO mice ex vivo with rapamycin reduced the production of proinflammatory cytokines IL-17 (Figure 5, A and B) and IFN-γ (Figure 5, C and D) from CD4+ T cells. Furthermore, to assess the effects of rapamycin on disease in vivo, we treated Srsf1-cKO mice with rapamycin and evaluated the effect on features of autoimmunity. We observed reduced levels of IL-17 cytokine production ex vivo (Figure 5E), and decreased proportions of CD4+ PD1+CXCR5+ Tfh cells in the spleens from cKO mice (Figure 5F). Importantly, we observed a reduction in the levels of serum dsDNA and histone autoantibodies (Figure 5G). In addition, treatment with rapamycin reduced T cell infiltration into the kidneys (Figure 5H). These data indicate that deficiency of SRSF1 leads to increased activation of the mTOR pathway, the ensuing proinflammatory function of T cells, and systemic autoimmunity, which can be corrected by rapamycin. Figure 5 Rapamycin treatment reduces proinflammatory cytokine production by T cells and alleviates autoimmunity in Srsf1-cKO mice. (A–D) Spleen cells from WT or Srsf1-cKO mice were cultured for 4 hours with PMA plus ionomycin in the presence of monensin. Rapamycin (1 nM or 10 nM) was added for the duration of cultures. Cells were collected, surface stained, fixed, and permeabilized for intracellular cytokine staining. (A and C) Plots show IL-17 and IFN-γ intracellular staining gated on live CD4+ T cells. (B) Graphs show data from n = 8 mice in 7 independent experiments. (D) Graph shows data from n = 15 mice each in 10 independent experiments. (E–H) Rapamycin (2 mg/kg) or PBS was administered to WT and Srsf1-cKO mice by intraperitoneal injection once every 2 days for 4 weeks (F and G) or every day for 1 week (E and H). (E) Spleen cells were cultured with anti-CD3 (2 μg/mL) and anti-CD28 (2 μg/mL) for 24 hours and IL-17A measured in the supernatants by ELISA. Data are shown as fold values normalized to controls (n = 5 mice in 2 independent experiments). (F) Spleen cells were analyzed by flow cytometry, and graph shows the frequency of Tfh cells in spleen (n = 5–6 mice in 2 independent experiments). (G) Serum was collected and autoantibodies measured by ELISA (n = 5–6 mice in 2 independent experiments). (H) Cells from kidneys were analyzed by flow cytometry, and graph shows the frequency of T cells in kidneys (n = 5 mice in 2 independent experiments). One-way ANOVA with Bonferroni correction (B, D, E, and F); 2-tailed unpaired t test (G and H); *P < 0.05, **P < 0.005; mean ± SEM. PTEN overexpression reduced proinflammatory cytokine production by T cells from Srsf1-cKO mice. To confirm that SRSF1 modulates T cell activation via regulation of PTEN expression, PTEN was overexpressed by transient transfections in T cells from WT and Srsf1-cKO mice, followed by stimulation with PMA and ionomycin for 4 hours. We confirmed the overexpression of PTEN at the mRNA and protein levels (Supplemental Figure 6, A and B). We found that cytokine production is decreased by PTEN overexpression in T cells from Srsf1-cKO mice but not in WT T cells (Figure 6, A and B). Of note, transfection by electroporation is toxic to cells and accounts for the overall reduced frequencies of IFN-γ–producing cells (Figure 6) compared with untransfected cells (Figure 5C and Supplemental Figure 6C). These data indicate that deficiency of SRSF1 leads to decreased PTEN expression, increased activation of the mTOR pathway and the ensuing proinflammatory function of T cells (Supplemental Figure 7) which contribute to systemic autoimmune disease. Figure 6 PTEN overexpression reduces proinflammatory cytokine production by T cells from Srsf1-cKO mice. (A) T cells were isolated from spleens of WT or Srsf1-cKO mice and transfected by electroporation with empty vector (EV) or PTEN overexpression plasmid (pPTEN). Sixteen hours later, cells were stimulated with PMA plus ionomycin in the presence of monensin for 4 hours and cells were collected, surface stained, fixed, and permeabilized for intracellular cytokine staining. (B) Graphs show average data from n = 9 mice in 5 independent experiments. Two-tailed paired t test, *P < 0.05, mean ± SEM. PTEN is decreased in T cells from patients with SLE with low SRSF1 levels. Although PTEN expression is decreased and contributes to the hyperactivity of B cells in patients with SLE (28), its role in T cells in SLE has not been studied. Given our findings of increased mTOR activity and the decreased expression and regulatory role of PTEN in T cells from the Srsf1-cKO mice (Figure 4, Figure 5, and Figure 6), we asked whether PTEN expression levels are altered in T cells from patients with SLE. Therefore, we assessed PTEN and SRSF1 protein expression levels in T cells from patients with SLE and compared with age-, race-, and sex-matched healthy control individuals. We found that the expression of PTEN was decreased in T cells from patients with SLE who had decreased expression levels of SRSF1, compared with those from healthy individuals (Figure 7A). Importantly, we observed a linear correlation between PTEN and SRSF1 expression levels in T cells from patients with SLE (R2 = 0.226, P = 0.0163, Figure 7B). These results suggest that the low SRSF1 levels may contribute to the reduced expression of PTEN in T cells from patients with SLE. Figure 7 PTEN is decreased in T cells from patients with SLE and correlates with SRSF1 levels. SRSF1 overexpression increases PTEN, suppresses mTORC1 activity, and reduces proinflammatory cytokine production. (A and B) Peripheral blood T cells were isolated from patients with SLE and normal (N) healthy control individuals. Total protein was immunoblotted for PTEN, SRSF1, and β-actin. (A) Data are from 1 representative of 10 independent experiments. Graph shows relative quantitation by densitometry (n = 14 SRSF1 low and n = 12 SRSF1 normal patients). (B) Graph shows a linear correlation between relative PTEN and SRSF1 expression. (C) Peripheral blood T cells were isolated from patients with SLE and transfected with empty vector (EV) or SRSF1 overexpression plasmid (pSrsf1). At 16 to 18 hours after transfections, SLE T cells were stimulated with anti-CD3, anti-CD28, and crosslinker for 5 minutes. Total protein was immunoblotted for PTEN. Data are from 1 representative of 5 independent experiments (n = 10). Graph shows relative quantitation by densitometry. (D) Total protein was immunoblotted for pS6 and total S6 in stimulated SLE T cells after transfection as described in C. Data are from 1 representative of 4 independent experiments (n = 4). Graph shows relative quantitation by densitometry. (E) At 16 to 18 hours after transfection, cells were stimulated with PMA and ionomycin in the presence of monensin. After 4 hours, cytokine production was analyzed by flow cytometry. Graphs show quantitation of cytokine data (n = 8). Paired t test, *P < 0.05, mean ± SEM. The mTOR pathway via the regulation of PTEN expression. In T cells from KO mice and patients with SLE, reduced SRSF1 levels contribute to reduced PTEN levels and increased activity of the mTOR pathway. Rapamycin blocks the mTORC1 pathway and reduces proinflammatory cytokines. SRSF1 overexpression increased PTEN levels, suppressed mTORC1 activity, and reduced proinflammatory cytokine production in T cells from patients with SLE. To assess whether SRSF1 overexpression would increase PTEN expression and reduce mTORC1 activity and the aberrant cytokine production by T cells from patients with SLE, we transiently transfected T cells from patients with SLE with an Srsf1-expression vector followed by stimulation with anti-CD3 and anti-CD28. We found that SRSF1 overexpression increased PTEN protein levels (Figure 7C), reduced activation of the mTORC1 pathway as evidenced by a reduction in pS6 expression levels (Figure 7D), and led to reduced frequencies of IL-17– and IFN-γ–producing CD4+ T cells (Figure 7E). These findings show that decreased SRSF1 expression contributes to mTORC1 activation and proinflammatory cytokine production in T cells from patients with SLE through the control of PTEN. Discussion In this study, we demonstrate that selective deletion of SRSF1 in T cells in mice leads to aberrantly activated proinflammatory cytokine-producing Teff cells, leading to systemic autoimmunity and lupus nephritis (Figure 1 and Figure 2). We report that SRSF1 controls the expression of genes involved in T cell activation, differentiation, and cytokine signaling (Figure 3). At the mechanistic level, we demonstrate that SRSF1 regulates the 3′ UTR of the mRNA of the mTOR inhibitor PTEN and limits its expression, causing increased mTOR activity (Figure 4). Rapamycin treatment corrects proinflammatory cytokine production in T cells and alleviates autoimmunity in Srsf1-deficient mice (Figure 5). Of clinical relevance is our finding that T cells from patients with SLE with low expression levels of SRSF1 had decreased levels of PTEN, which correlate with decreased expression levels of SRSF1 (Figure 7). Further, restitution of SRSF1 levels corrected the proinflammatory cytokine production by hyperactive SLE T cells (Figure 7). Thus, we uncover SRSF1 as what we believe is a novel molecular brake in the control of T cell hyperactivity and the prevention of autoimmune disease. Our findings highlight an important role for SRSF1 in the immune system and in the control of immune-mediated disease. SRSF1 deficiency unrestrains T cell activation, unleashes the production of proinflammatory cytokines IL-17 and IFN-γ by CD4+ Teff cells, and leads to activation of B cells and inflammatory infiltration in target organs, leading to systemic autoimmunity and organ inflammation. Increased activity of the mTOR pathway contributes to the proinflammatory phenotype, which is rescued by rapamycin administration. The mTOR pathway is a recently emerging crucial therapeutic target in autoimmune diseases, including SLE (15, 43). Increased mTORC1 activity has been demonstrated in T cells from patients with SLE and correlates with expansion of proinflammatory cytokine-producing T cells (21, 22). Treatment of lupus-prone MRL/lpr mice with rapamycin, an inhibitor of mTORC1 signaling, improved disease parameters (45). Importantly, a recent clinical trial of rapamycin in patients with SLE has shown efficacy in patients with active SLE (44). Here, we find that SRSF1 deficiency in mice results in increased activation of mTORC1 pathway, which parallels the observed increased mTORC1 activity (15) and the decreased SRSF1 expression in patients with SLE (37). Although PTEN is known to suppress the mTOR pathway and the expression of PTEN is decreased in B cells from patients with SLE (28), the role of PTEN in T cells from patients with SLE remains unknown. We previously showed that the expression levels of SRSF1 are decreased in SLE T cells and inversely correlate with disease activity, suggesting the important role of SRSF1 in SLE T cells (37). Our current study extends this concept with a number of crucial new findings. Here we show a linear correlation between PTEN and SRSF1 in T cells from patients with SLE, and that patients with lupus with low SRSF1 expression levels exhibit lower expression levels of PTEN. Furthermore, the overexpression of SRSF1 rescues PTEN expression in lupus T cells (Figure 7). This is the first evidence showing the reduction of PTEN in T cells in a subset of patients with SLE. Moreover, the overexpression of SRSF1 in lupus T cells reduces mTOR activity and the production of proinflammatory cytokines, suggesting that the SRSF1-PTEN-mTOR pathway may be a novel therapeutic target in patients with SLE. T cell quiescence is enforced by molecules able to restrain T cell activation, and the expression of such molecules generally subsides upon TCR stimulation to enable effector differentiation programs. These genes include, among others, the Kruppel-like factor (KLF) genes, Schlafen-2, Tsc2, and the Forkhead box (Foxo) family (46). T cells from the Srsf1-cKO mice preferentially expressed genes involved in the Foxo1 signaling pathway, cell cycle, T cell activation, cytokine-cytokine receptor interaction, and Th differentiation programs. Therefore, it appears that SRSF1 may be involved in the maintenance of resting T cell quiescence. In agreement with these findings is our previous finding that high SRSF1 protein levels in resting human T cells decreased following TCR stimulation due to degradation by the ubiquitin-proteasome pathway (36). In contrast, deficiency or decreased expression of SRSF1 as recorded in our Srsf1-cKO mice and in patients with SLE, respectively, contributes to T cell activation, loss of tolerance, autoimmunity, and organ inflammation. Of direct clinical relevance is the observation that T cells from patients with SLE exhibit a hyperactive phenotype and functional defects (13), which are linked mechanistically to decreased SRSF1 expression (37). A limitation of our study is that the T cell–restricted deletion of Srsf1 is under the distal Lck promoter, which is expressed late during thymic development, as opposed to the proximal Lck promoter, which is expressed early in the double-negative thymocytes. Therefore, the role of SRSF1 in early thymic development is bypassed, which may differentially influence T cell physiology and function. Also, Srsf1 is absent from birth and does not address the possibility of altering T cell function should its levels decrease later in life. Deletion of Srsf1 in adult mice may result in differential physiological and pathophysiological outcomes. SRSF1 levels are decreased in T cells from patients with SLE but are not completely absent. Therefore, while the homozygous Srsf1-cKO mice are used in proof-of-concept studies here, the heterozygous (distal.Lckcre.Srsf1flox/wt mice) Srsf1-cKO mice, which also develop some features of T cell activation and signs of autoimmune disease (unpublished observations), may serve as a better model for human disease in future studies. Because SRSF1 regulates target genes via various mechanisms, it is possible that other pathways also contribute to T cell activation and autoimmunity. In addition, although the frequency of Tregs and functional results from short-term in vitro suppression assays are comparable between WT and Srsf1-cKO mice, further studies (including generating Treg conditional Srsf1-cKO mice) are required to assess precisely the role of SRSF1 in Tregs. Furthermore, the differences observed in the distribution of activated/memory T cell populations within the CD4 and CD8 compartments imply a potentially differential role of SRSF1 in CD4+ and CD8+ T cells (Figure 2, C–E). Besides these limitations, our patient numbers in the human studies are small, and a larger cohort of patients with SLE is needed to systematically define the clinical characteristics of patients stratified based on molecular levels of SRSF1 and PTEN. In addition, whether T cells from patients with SLE with and without low SRSF1 expression exhibit differential response to rapamycin needs to be examined. Increased activation of the mTOR pathway is associated with altered metabolism in T cells in mice and in patients with SLE (47, 48). It would be interesting to assess whether Srsf1-deficient T cells exhibit such defects. In conclusion, we have uncovered what we believe is a previously unrecognized role of SRSF1 in T cell physiology and demonstrated the impact of its absence on the expression of autoimmune disease. Loss of SRSF1 limits the expression of the mTOR repressor PTEN, leading to aberrant T cell activation and the expression of systemic autoimmunity. Our results suggest that prevention of the loss of SRSF1 should be of therapeutic value to autoimmune diseases. Methods Human subjects. Patients with SLE, all fulfilling the American College of Rheumatology classification criteria (49), were recruited at the rheumatology clinic at Beth Israel Deaconess Medical Center (BIDMC), Boston, MA (Supplemental Table 1). Age-, race-, and sex-matched healthy individuals were recruited as controls. Peripheral blood was drawn from patients by venipuncture. Mice. C57BL/6J (stock 000664), B6.129S4-Srsf1-flox (stock 018020), and B6.dLck.Cre (stock 012837) mice were purchased from The Jackson Laboratory. In most experiments, sex-matched littermates were used as WT controls. All mice were maintained in the specific pathogen–free animal facility at BIDMC. Antibodies and reagents. The following flow cytometry antibodies were from Biolegend: anti–mouse-CD4 (clone GK1.5), CD8a (clone 53-6.7), CD11b (clone M1/70), CD11c (clone N418), CD19 (clone 6D5), CD25 (clone PC61), CD44 (clone IM7), B220 (clone RA3-6B2), CD62L (clone MEL-14), CD69 (clone H1.2F3), CD90.2 (clone 53-2.1), TCR-β (clone H57-597), IgD (clone 11-26c.2a), IL-4 (clone 11B11), IL-17A (clone JC11-18F10.1), IFN-γ (clone XMG1.2), CXCR5 (clone L138D7), Ki67 (clone 16A8), CD127 (clone A019D5), PD-1 (clone 29F.1A12), GL7 (clone GL7), purified anti–mouse-CD3 (clone 145-2C11), CD28 (clone 37.51), CD16/32 (Fc block), anti–human CD3 (clone OKT3), CD4 (clone OKT4), CD8 (clone SK1), and IFN-γ (clone 4S.B1). Brilliant Violet 421–conjugated streptavidin, Zombie Aqua Fixable Viability kit mouse IL-17A ELISA kit, and carboxyfluorescein succinimidyl ester (CFSE) were also from Biolegend. Anti-mouse Foxp3 (clone FJK-16s) antibody, mouse regulatory T cell staining kit, and anti–human IL-17A antibody (clone eBIO64DEC17) were from eBioscience. Anti–mouse Fas (clone Jo2) antibody, Cytofix/Cytoperm, Perm/Wash buffer, and monensin were from BD Biosciences. ACK lysing buffer was from Thermo Fisher Scientific. SRSF1 rabbit polyclonal antibody for flow cytometry was from LifeSpan Biosciences and monoclonal antibody for Western blot (clone 96) was from Thermo Fisher Scientific. Anti-S6 ribosomal protein phospho-Ser 235 and Ser 236 (clone D57.2 2E), anti-S6 ribosomal protein (clone 5G10), anti-PTEN (clone 138G6), anti–phospho-AKT (Ser473; clone D9E), anti–phospho-AKT (Thr308; clone 244F9), and anti-AKT (clone C67E7) antibodies were from Cell Signaling Technology. Phorbol myristic acid (PMA), ionomycin, mitomycin C, and β-actin antibody (clone AC-74) were from Sigma-Aldrich. Goat anti–rabbit IgG horseradish peroxidase (HRP) and goat anti–mouse IgG HRP antibodies were from Thermo Fisher Scientific. Rapamycin and goat anti–mouse IgG were from Millipore. HEK293T cells were purchased from American Type Culture Collection (ATCC). The pcDNA3.1-SRSF1 expression plasmid was a gift from James Manley (Columbia University, NY), and the pGL3-PTEN 3′ UTR plasmid was a gift from Jeffrey Rosen (Addgene plasmid 28104). The pcDNA3-FLAG PTEN plasmid was a gift from Jaewhan Song (Addgene plasmid 78777). Cell isolation and tissue processing. Spleens and lymph nodes were homogenized using a syringe plunger and mesh cell strainer. After perfusion, kidneys were homogenized and digested in HBSS medium with 1.5 mg/mL collagenase B (Boehringer Mannheim) at 37°C for 30 minutes. RBC lysis was performed with ACK lysing buffer. All cell cultures were in RPMI complete medium (RPMI plus 10% FBS plus penicillin and streptomycin antibiotics). Blood samples from mice were collected by tail vein incision and capillary tube collection, and serum was separated by centrifugation. Urine samples were collected from mice in individual metabolic cages and urine protein was measured by Multistix (Siemens). Human T cells from peripheral blood were isolated using the Rosette Sep human T cell enrichment cocktail (STEMCELL Technologies). For histopathology, tissues were immediately fixed in 10% formalin overnight, processed in an automated tissue processor, embedded into paraffin blocks, and sent to the BIDMC histopathology core for sectioning and slide staining with H&E. Slides were evaluated blind for histopathology scoring, utilizing semiquantitative scoring criteria for lupus nephritis (50). Flow cytometry. Zombie aqua viability dye was used for live/dead cell staining. Surface staining was performed in FACS staining buffer (PBS plus 2% FBS) on ice for 20 minutes with Fc block. For cytokine production, cells from mice were stimulated for 4 hours in culture medium with PMA (100 ng/mL), ionomycin (1 μM), and monensin (1 μL/mL). Human T cells were stimulated with PMA (10 ng/mL), ionomycin (400 ng/mL), and monensin (1 μL/mL) for 4 hours. Cells were surface stained followed by fixation and permeabilization. Appropriate antibodies were used for intracellular staining for cytokines or Foxp3 and Ki67. Flow cytometry data were acquired on a BD LSRII or CytoFLEX LX and analyzed with FlowJo software. All procedures were performed according to the manufacturer’s instructions. Autoantibody detection. Sera from 12-week-old WT and Srsf1-cKO mice and one 16-week-old MRL/lpr mouse (as positive control) were analyzed for the presence of autoantibodies using the Autoantigen Microarray Super Panel (128-antigen panel) at the Genomics and Microarray Core facility at the University of Texas, Southwestern Medical Center (Dallas, TX). Heatmaps were prepared using R software. Antinuclear antibody (ANA) in serum was measured using an ELISA kit (Alpha Diagnostic International) following the manufacturer’s instructions. Briefly, the serum was diluted and assayed for antigen reactivity on precoated plates followed by incubation for 60 minutes. Bound IgG was detected with anti–mouse IgG HRP antibody and developed with a tetramethylbenzidine (TMB) substrate. Plates were read at 450 nm on a spectrophotometer. To detect anti–double stranded (ds)DNA and anti–histone antibodies, Immulon II plates (Dynatech) precoated with BSA were coated individually with 50 μg/mL calf thymus DNA (Sigma-Aldrich) or 50 μg/mL calf thymus histone (Sigma-Aldrich). The serum was diluted (1:500) and assayed for autoantigen reactivity against the antigens described above by incubation overnight at 4°C. Bound IgG was detected with a goat polyclonal HRP–anti-mouse IgG detection antibody (SouthernBiotech) and visualized at 450 nm using a TMB substrate (Sigma-Aldrich). mRNA expression and RT-PCR. Total RNA was isolated using the RNeasy mini kit (Qiagen) and reverse-transcribed into cDNA using the RNA to cDNA premix (Clontech). Real-time PCR amplification was carried out with SYBR Green I using a LightCycler 480 (Roche) and the following program: initial denaturation at 95°C for 5 minutes; 40 cycles of amplification (denaturation at 95°C for 15 seconds, annealing at 60°C for 15 seconds, extension at 72°C for 30 seconds); one cycle of melting curves (95°C for 15 seconds, 65°C for 2 minutes, and 97°C continuous), and a final cooling at 37°C. Threshold cycle values were used to calculate relative mRNA expression by the ΔCt relative quantification method. Primer sequences are listed in Supplemental Table 2. RNA sequencing. Naive CD4+ T cells were isolated from spleens of 7-week-old WT and Srsf1-cKO mice (n = 3 each) and stimulated with anti-CD3 (0.5 μg/mL) and anti-CD28 (1 μg/mL) for 72 hours. Cells were restimulated with PMA (100 ng/mL) and ionomycin (1 μM) for 4 hours. Total RNA was extracted using the RNeasy mini kit (Qiagen) and submitted for sequencing to the Molecular Biology Core Facility (MBCF) at the Dana-Farber Cancer Institute (DFCI). Libraries were prepared using Illumina TruSeq Stranded mRNA sample preparation kits according to the manufacturer’s protocols. Samples were sequenced on an Illumina NextSeq500 run with single-end 75-bp reads. Data analyses were performed by the MBCF at DFCI and the Harvard T.H. Chan School of Public Health Biostatistics Core. The data were deposited in the NCBI Gene Expression Omnibus (GEO) database under accession number GSE 136286. Western blot. To detect pS6, naive CD4+ T cells were isolated from spleens of 9- to 10-week-old WT and Srsf1-cKO mice and stimulated with anti-CD3 (0.5 μg/mL) and anti-CD28 (1 μg/mL) for 72 hours. Human T cells were stimulated with soluble anti-CD3 (5 μg/mL), anti-CD28 (2.5 μg/mL) and cross linker goat anti–mouse IgG (10 μg/mL) for 5 minutes. Cells were lysed with radioimmunoprecipitation assay (RIPA) buffer (Boston Bioproducts). Lysates were electrophoresed on NuPAGE 4%–12% Bis-Tris gels (Life Technologies) and transferred to PVDF membrane. Membranes were blocked with 5% (wt/vol) nonfat milk in Tris-buffered saline with 0.05% Tween 20 (TBS-T) for 1 hour, incubated with primary antibody (1:1000, or 1:10,000 for β-actin antibody) in 5% milk in TBS-T or Hikari solution A (Nacalai Tesque) at 4°C overnight or at room temperature for 2 hours for β-actin antibody. Membranes were washed 3 times with TBS-T, incubated with HRP-conjugated secondary antibody (1:2000 for ECL detection reagents or 1:4000 for ECL prime detection reagents; GE Healthcare) for 1 hour, washed 3 times with TBS-T, developed with ECL reagents, and visualized by a Fujifilm LAS-4000 imager or Bio-Rad ChemiDoc imager. Densitometry was performed using Quantity One software (Bio-Rad). Transfections. HEK293T cells were cultured in DMEM complete medium. One day prior to transfection, 0.3 × 10⁶ cells were seeded in a 12-well plate. Cells were cotransfected with the pGL3-PTEN 3′ UTR luciferase plasmid and either pcDNA3.1 empty vector (EV) or pcDNA3.1-Srsf1 vector using Lipofectamine (Invitrogen). All transfections included a pRL-TK Renilla luciferase plasmid as internal control. Human T cells and mouse T cells were transfected using the Amaxa human T cell nucleofector kit and the mouse T cell nucleofector kit, respectively, following the manufacturer’s instructions. Briefly, 3 × 10⁶ to 6 × 10⁶ cells were resuspended in 100 μL nucleofector solution, plasmid DNA was added, and cells were transferred into a cuvette and electroporated using the U-014 program for human cells or the X-001 program for mouse cells in the nucleofector device. Cells were immediately rescued into prewarmed medium and cultured overnight. Luciferase assays. Cells were transfected as described above. After 24 hours in culture, cells were collected, lysed in passive lysis buffer (Promega), and luciferase activity was quantified on a luminometer using the dual-luciferase assay system (Promega) according to the manufacturer’s instructions. Immunofluorescence and immunohistochemistry staining. For immunofluorescence staining, spleens were embedded in OCT tissue media (Tissue-Tek) and frozen on dry ice. Frozen sections (7-μm thickness) were fixed to slides in ice-cold acetone for 15 minutes and air dried for 30 seconds. The sections were blocked with 10% horse serum for 30 minutes at room temperature, then stained for 30 minutes at room temperature in a humidified chamber with fluorescence-conjugated anti-IgD (catalog 405717; Biolegend), anti-CD4 (catalog 100533; Biolegend), anti-B220 (catalog 103207; Biolegend), and biotinylated PNA (catalog B-1075; Vector Laboratories). Biotinylated PNA was detected using by streptavidin–Alexa Fluor 350 (catalog S-11249; Life Technologies). For immunohistochemistry staining, slides of formalin-fixed, paraffin-embedded kidneys were incubated with purified anti–mouse CD3 antibody (clone 100201; Biolegend) overnight at 4°C after antigen retrieval. The primary antibody was detected with rabbit anti–rat HRP secondary antibody (clone ab6734, Abcam). In vitro suppression assays. Total T cells were isolated from spleens by magnetic assisted cell sorting (MACS), using the Pan T cell isolation kit (Miltenyi Biotech). Conventional CD4+ T cells (Tconv) (CD4+CD25–CD127hi) and Treg cells (CD4+CD25+CD127lo) were sorted by flow cytometry (FACSAria II, BD Bioscience). Tconv cells were labeled with CFSE and cocultured with Treg cells at increasing ratios for 3 days in the presence of mitomycin C–treated splenocytes and anti-CD3 and anti-CD28, and proliferation of Tconv was analyzed by flow cytometry. Rapamycin treatment. Rapamycin was dissolved in DMSO and diluted in PBS. For in vitro culture treatment experiments, a final concentration of 1 nM or 10 nM rapamycin was added for the duration of cell cultures. For in vivo treatment experiments, rapamycin (2 mg/kg dissolved in DMSO, diluted in 150 μL PBS) or PBS (equal volume DMSO in 150 μL PBS) was administered to mice by intraperitoneal injection once every 2 days for 4 weeks. After 4 weeks of treatment, mice were euthanized and spleen cells were analyzed by flow cytometry, and sera was collected to measure autoantibodies by ELISA. In some experiments, mice were treated with rapamycin every day for 1 week. Kidneys were collected to analyze T cell infiltration by flow cytometry. Spleen cells were cultured with anti-CD3 (2 μg/mL) and anti-CD28 (2 μg/mL) for 24 hours and IL-17A was measured in supernatants by ELISA (Biolegend). Statistics. Student’s 2-tailed t test, Mann-Whitney U test, and 1-way ANOVA were used to calculate statistical significance among groups. A P value of less than 0.05 was considered significant. In all graphs, data represent mean ± SEM. Study approval. For human studies, written informed consent was obtained from all participants and all studies were approved by the institutional review board (Committee on Clinical Investigations) at BIDMC. All animal studies were approved by the Institutional Animal Care and Use Committee at BIDMC. Author contributions VRM conceptualized the study. TK, HL, DC, and VRM designed and performed the experiments, and analyzed and interpreted data. TK, HL, GCT, and VRM prepared the manuscript. Supplemental material View Supplemental data Acknowledgments We thank Andrew Gillooly, Michael Mosho, and Melissa Carr-Reynolds for excellent technical assistance; Suzanne Krishfield for recruiting patients with SLE and healthy individuals; Donna Farber and Martin Flajnik for critical reading of the manuscript; and Amir Sharabi and Abel Suarez-Fueyo for helpful discussions. This work was funded by NIH grants K01AR060781 and R01AR068974 to VRM, R01AI42269 to GCT, and an SICPA Foundation grant to DC. Footnotes Conflict of interest: The authors have declared that no conflict of interest exists. Copyright: © 2019, American Society for Clinical Investigation. Reference information: J Clin Invest. https://doi.org/10.1172/JCI127949. References Tsokos GC. Systemic lupus erythematosus. N Engl J Med. 2011;365(22):2110–2121. View this article via: PubMed CrossRef Google Scholar Yen EY, Singh RR. Brief report: lupus-an unrecognized leading cause of death in young females: a population-based study using nationwide death certificates, 2000-2015. Arthritis Rheumatol. 2018;70(8):1251–1255. View this article via: PubMed CrossRef Google Scholar Malkiel S, Barlev AN, Atisha-Fregoso Y, Suurmond J, Diamond B. Plasma cell differentiation pathways in systemic lupus erythematosus. Front Immunol. 2018;9:427. View this article via: PubMed Google Scholar Banchereau J, Pascual V. Type I interferon in systemic lupus erythematosus and other autoimmune diseases. Immunity. 2006;25(3):383–392. View this article via: PubMed CrossRef Google Scholar Crow MK, Olferiev M, Kirou KA. Targeting of type I interferon in systemic autoimmune diseases. Transl Res. 2015;165(2):296–305. View this article via: PubMed CrossRef Google Scholar Lo MS, Tsokos GC. Recent developments in systemic lupus erythematosus pathogenesis and applications for therapy. Curr Opin Rheumatol. 2018;30(2):222–228. View this article via: PubMed CrossRef Google Scholar Caielli S, et al. A CD4+ T cell population expanded in lupus blood provides B cell help through interleukin-10 and succinate. Nat Med. 2019;25(1):75–81. View this article via: PubMed CrossRef Google Scholar Hsu HC, et al. Interleukin 17-producing T helper cells and interleukin 17 orchestrate autoreactive germinal center development in autoimmune BXD2 mice. Nat Immunol. 2008;9(2):166–175. View this article via: PubMed CrossRef Google Scholar Yi W, et al. The mTORC1-4E-BP-eIF4E axis controls de novo Bcl6 protein synthesis in T cells and systemic autoimmunity. Nat Commun. 2017;8(1):254. View this article via: PubMed CrossRef Google Scholar Amarilyo G, Lourenço EV, Shi FD, La Cava A. IL-17 promotes murine lupus. J Immunol. 2014;193(2):540–543. View this article via: PubMed CrossRef Google Scholar Koga T, Ichinose K, Tsokos GC. T cells and IL-17 in lupus nephritis. Clin Immunol. 2017;185:95–99. View this article via: PubMed CrossRef Google Scholar Choi SC, Morel L. B cell contribution of the CD4+ T cell inflammatory phenotypes in systemic lupus erythematosus. Autoimmunity. 2017;50(1):37–41. View this article via: PubMed CrossRef Google Scholar Katsuyama T, Tsokos GC, Moulton VR. Aberrant T cell signaling and subsets in systemic lupus erythematosus. Front Immunol. 2018;9:1088. View this article via: PubMed Google Scholar Moulton VR, Suarez-Fueyo A, Meidan E, Li H, Mizui M, Tsokos GC. Pathogenesis of human systemic lupus erythematosus: a cellular perspective. Trends Mol Med. 2017;23(7):615–635. View this article via: PubMed CrossRef Google Scholar Perl A. Activation of mTOR (mechanistic target of rapamycin) in rheumatic diseases. Nat Rev Rheumatol. 2016;12(3):169–182. View this article via: PubMed CrossRef Google Scholar Chapman NM, Chi H. mTOR links environmental signals to T cell fate decisions. Front Immunol. 2014;5:686. View this article via: PubMed Google Scholar Yang K, Neale G, Green DR, He W, Chi H. The tumor suppressor Tsc1 enforces quiescence of naive T cells to promote immune homeostasis and function. Nat Immunol. 2011;12(9):888–897. View this article via: PubMed CrossRef Google Scholar Perl A. mTOR activation is a biomarker and a central pathway to autoimmune disorders, cancer, obesity, and aging. Ann N Y Acad Sci. 2015;1346(1):33–44. View this article via: PubMed CrossRef Google Scholar Delgoffe GM, et al. The kinase mTOR regulates the differentiation of helper T cells through the selective activation of signaling by mTORC1 and mTORC2. Nat Immunol. 2011;12(4):295–303. View this article via: PubMed CrossRef Google Scholar Yang K, et al. T cell exit from quiescence and differentiation into Th2 cells depend on Raptor-mTORC1-mediated metabolic reprogramming. Immunity. 2013;39(6):1043–1056. View this article via: PubMed CrossRef Google Scholar Kato H, Perl A. Mechanistic target of rapamycin complex 1 expands Th17 and IL-4+ CD4-CD8- double-negative T cells and contracts regulatory T cells in systemic lupus erythematosus. J Immunol. 2014;192(9):4134–4144. View this article via: PubMed CrossRef Google Scholar Lai ZW, et al. Mechanistic target of rapamycin activation triggers IL-4 production and necrotic death of double-negative T cells in patients with systemic lupus erythematosus. J Immunol. 2013;191(5):2236–2246. View this article via: PubMed CrossRef Google Scholar et al. Negative regulation of PKB/Akt-dependent cell survival by the tumor suppressor PTEN. Cell. 1998;95(1):29–39. View this article via: PubMed CrossRef Google Scholar Chi H. Regulation and function of mTOR signalling in T cell fate decisions. Nat Rev Immunol. 2012;12(5):325–338. View this article via: PubMed CrossRef Google Scholar Buckler JL, Walsh PT, Porrett PM, Choi Y, Turka LA. Cutting edge: T cell requirement for CD28 costimulation is due to negative regulation of TCR signals by PTEN. J Immunol. 2006;177(7):4262–4266. View this article via: PubMed CrossRef Google Scholar Di Cristofano A, Kotsi P, Peng YF, Cordon-Cardo C, Elkon KB, Pandolfi PP. Impaired Fas response and autoimmunity in Pten+/- mice. Science. 1999;285(5436):2122–2125. View this article via: PubMed CrossRef Google Scholar Suzuki A, et al. T cell-specific loss of Pten leads to defects in central and peripheral tolerance. Immunity. 2001;14(5):523–534. View this article via: PubMed CrossRef Google Scholar Wu XN, et al. Defective PTEN regulation contributes to B cell hyperresponsiveness in systemic lupus erythematosus. Sci Transl Med. 2014;6(246):246ra99. View this article via: PubMed CrossRef Google Scholar Howard JM, Sanford JR. The RNAissance family: SR proteins as multifaceted regulators of gene expression. Wiley Interdiscip Rev RNA. 2015;6(1):93–110. View this article via: PubMed CrossRef Google Scholar Li X, Manley JL. New talents for an old acquaintance: the SR protein splicing factor ASF/SF2 functions in the maintenance of genome stability. Cell Cycle. 2005;4(12):1706–1708. View this article via: PubMed CrossRef Google Scholar Moulton VR, Tsokos GC. T cell signaling abnormalities contribute to aberrant immune cell function and autoimmunity. J Clin Invest. 2015;125(6):2220–2227. View this article via: JCI PubMed CrossRef Google Scholar Nambiar MP, et al. Reconstitution of deficient T cell receptor zeta chain restores T cell signaling and augments T cell receptor/CD3-induced interleukin-2 production in patients with systemic lupus erythematosus. Arthritis Rheum. 2003;48(7):1948–1955. View this article via: PubMed CrossRef Google Scholar Chowdhury B, et al. Stability and translation of TCR zeta mRNA are regulated by the adenosine-uridine-rich elements in splice-deleted 3’ untranslated region of zeta-chain. J Immunol. 2006;177(11):8248–8257. View this article via: PubMed CrossRef Google Scholar Moulton VR, Kyttaris VC, Juang YT, Chowdhury B, Tsokos GC. The RNA-stabilizing protein HuR regulates the expre
No comment yet.
AUTOIMMUNITY
Pathology, Diagnosis and Therapies
Your new post is loading...
Scooped by Gilbert C FAURE
December 27, 2013 5:57 AM
Scoop.it!

Autoimmunity

Pathology, Diagnosis and Therapy

Gilbert C FAURE's insight:

Autoimmunity is indeed one of the biggest challenge of Immunology!

Understanding the mechanisms of this physiological immune phenomenon inducing such a diverse array of diseases, joint and muscular, digestive, endocrinological, neurological, cutaneous..


Among covered diseases

Lupus (>550 posts)

https://www.scoop.it/topic/autoimmunity?q=lupus

Scleroderma

https://www.scoop.it/topic/autoimmunity?q=scleroderma

Polymyositis

Sjögren's (>150)

https://www.scoop.it/topic/autoimmunity?q=sjogren


Diabetes (>400 posts)

https://www.scoop.it/topic/autoimmunity?q=diabetes

Mutiple sclerosis (>100 posts)

https://www.scoop.it/topic/autoimmunity?q=multiple+sclerosis

Thyroid disorders

https://www.scoop.it/topic/autoimmunity?q=thyroid


Improving the molecular and cellular tools in use for a few decades for diagnosis and follow-up of patients, perhaps screening in the future

Autoantibodies

https://www.scoop.it/topic/autoimmunity?q=autoantibody


Mastering the molecular and cellular mechanisms to treat patients.

Tregs

https://www.scoop.it/topic/autoimmunity?q=tregs


You can also find relevant informations on some other topics curated  here such as

Rheumatology

http://www.scoop.it/t/rheumatology-rhumatologie

Immunology and biotherapies

http://www.scoop.it/t/immunology-and-biotherapies

No comment yet.
Scooped by Gilbert C FAURE
November 7, 5:28 AM
Scoop.it!

Autoimmune and inflammatory diseases arise from a breakdown of immune tolerance driven by hyperactivation of effector lymphocytes and dysfunction of regulatory T (Treg) cells. Interleukin-2 (IL-2)…...

Autoimmune and inflammatory diseases arise from a breakdown of immune tolerance driven by hyperactivation of effector lymphocytes and dysfunction of regulatory T (Treg) cells. Interleukin-2 (IL-2)…... | AUTOIMMUNITY | Scoop.it
Autoimmune and inflammatory diseases arise from a breakdown of immune tolerance driven by hyperactivation of effector lymphocytes and dysfunction of regulatory T (Treg) cells. Interleukin-2 (IL-2) supports both Treg maintenance and effector cell responses, necessitating careful dose optimization for selective immune regulation.

Here, we report an immunoconjugate strategy that integrates Treg-selective cytokine signaling with localized pharmacological suppression by coupling a site-specifically PEGylated IL-2 variant (Y31-20K) to immunosuppressive small molecules. Through systematic screening, we identify Y31-20K-KU as the lead construct, which restores immune homeostasis in patient-derived lymphocytes and ameliorates pathology in mouse models of chronic colitis and collagen-induced arthritis.

Mechanistically, Y31-20K-KU selectively expands Tregs while concurrently suppressing effector cells and exhibited favorable safety with minimal immunogenicity, thereby overcoming limitations of cytokine- and small-molecule-based monotherapies.

These findings establish IL-2–drug immunoconjugates as a clinically tractable strategy for bidirectional immune modulation, providing a versatile platform for reprogramming cytokine signaling in inflammatory diseases.


Paper and research by @Jing Li and larger team. The excerpt above is from the author's manuscript.
No comment yet.
Scooped by Gilbert C FAURE
October 15, 11:50 AM
Scoop.it!

From Bench to Bedside: New Approaches to Treating Autoimmune diseases | Marion Brunck

From Bench to Bedside: New Approaches to Treating Autoimmune diseases | Marion Brunck | AUTOIMMUNITY | Scoop.it
🔬 Want to hear about FOXP3 and novel autoimmune diseases treatments from a Nobel Prize, and hear his take on resilience in science?

Dr. Fred Ramsdell, The Nobel Prize Laureate in Physiology or Medicine in 2025, shares not only fascinating insights into his scientific discoveries, but also where he was when he received the life-changing news of the Prize (you won't guess!)🌟

Joining the IUIS Junior Community Leadership Academy #webinar series, Dr. Fred Ramsdell generously shared his time in an engaging Q and A, offering invaluable perspectives.

🎥 Watch this inspiring webinar: https://lnkd.in/eQcH5-pB

#IUIS International Union of Immunological Societies (IUIS) Sociedad Mexicana de Inmunología A. C.#LeadershipAcademy #Immunology #NobelPrize #FOXP3 #EarlyCareerResearchers #ScientificLeadership
No comment yet.
Scooped by Gilbert C FAURE
October 8, 8:43 AM
Scoop.it!

🩺Check the hot Review... - Journal of Clinical Medicine MDPI

🩺Check the hot Review... - Journal of Clinical Medicine MDPI | AUTOIMMUNITY | Scoop.it
No comment yet.
Scooped by Gilbert C FAURE
October 6, 10:25 AM
Scoop.it!

Antiphospholipid syndrome: epidemiology and outcomes in the evolving criteria era | Nature Reviews Rheumatology

Antiphospholipid syndrome: epidemiology and outcomes in the evolving criteria era | Nature Reviews Rheumatology | AUTOIMMUNITY | Scoop.it
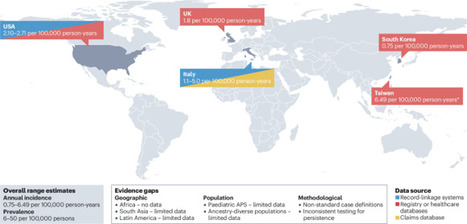
This Review provides a comprehensive overview of available evidence on the epidemiology of antiphospholipid syndrome (APS). The authors highlight the challenges associated with defining APS and its clinical heterogeneity and emphasize key areas that require further research to improve...
No comment yet.
Scooped by Gilbert C FAURE
August 17, 6:53 AM
Scoop.it!

#lupus #rcts #sle #noai | Laurent ARNAUD

#lupus #rcts #sle #noai | Laurent ARNAUD | AUTOIMMUNITY | Scoop.it
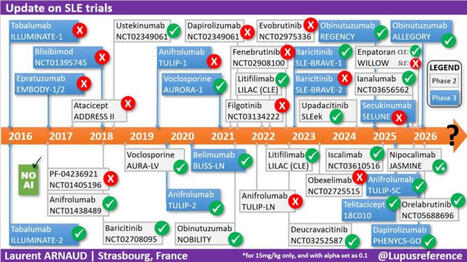
✅ 10 YEARS of RANDOMIZED TRIALS in #LUPUS ⏲️summarized on a single slide!!!! With a specific focus on phase 2(b) and 3 #RCTs, as well as whether the main endpoint was reached or not 👍 The least we can say, is that we have collectively put A LOT OF EFFORT in the development of new treatments 💊 in #SLE. As always I used only my natural intelligence (#NoAI) so please let me know if I have forgotten a trial or if something needs to be corrected.
No comment yet.
Scooped by Gilbert C FAURE
August 10, 7:36 AM
Scoop.it!

Autoimmune Disease Misdiagnosis: A Medical Paradigm Shift | Julie Martineau posted on the topic

Autoimmune Disease Misdiagnosis: A Medical Paradigm Shift | Julie Martineau posted on the topic | AUTOIMMUNITY | Scoop.it
Why "Autoimmune Disease" is a Diagnostic Dead End 🔬

Here is a summary of the main points from the article written by Dr. Kenneth P. Stoller, which discusses his book Incurable Us:

The Main Idea: The author deeply questions the concept of "autoimmune disease." According to him, the idea that the immune system inexplicably turns against its own body is one of the most misleading concepts in modern medicine. The immune system is not the disease; it is merely reacting to a threat.

Key Points of His Argument:

A label born of ignorance: Historically, when medicine failed to find the cause of certain diseases, it ended up grouping them under the "autoimmune" label. The problem with this diagnosis is that it often puts an end to the search for the true cause of the disease.
The wrong medical question: Instead of looking for the root cause by asking, "What is triggering this immune response?", modern medicine has settled for asking, "How do we suppress this response?" (often using immunosuppressants).
Autoantibodies are just a symptom: The author does not deny the existence of autoantibodies or the damage they cause to healthy tissues. However, he asserts that they are proof that a battle is taking place, but do not indicate who started the war. Factors such as a persistent infection, molecular mimicry, or chronic injury can produce these autoantibodies.
The example of Crohn's disease: The article highlights a link between Crohn's disease (often considered autoimmune) and Johne's disease (a known bacterial infection in animals, caused by MAP bacteria). This illustrates his point: what is labeled "autoimmune" often hides an undiagnosed underlying infection.

In Conclusion: This reflection, which is at the heart of his book Incurable Us, calls for a medical paradigm shift: we must stop blaming the patients' immune systems and start hunting down the true external and infectious causes of these complex diseases again.

To read the article: https://lnkd.in/g2hSWvqg

Short video: https://lnkd.in/gGqWcsdV

#medicine #health #disease #autoimmune #diagnostics #IncurableUs #curable #kennethpstoller #docstoller
No comment yet.
Scooped by Gilbert C FAURE
August 4, 10:55 AM
Scoop.it!

JCI Insight - Mapping the plasma proteomic architecture of systemic lupus erythematosus

JCI Insight - Mapping the plasma proteomic architecture of systemic lupus erythematosus | AUTOIMMUNITY | Scoop.it
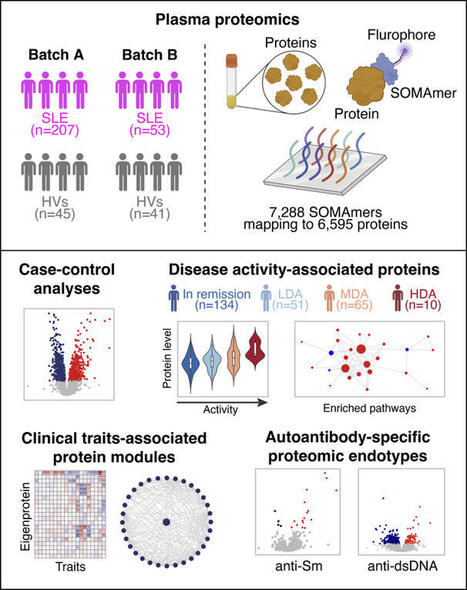
Plasma proteomic profiles of SLE. We recruited 268 patients with SLE and 86 HVs. The cohort encompassed a wide range of disease duration and disease activity (Table 1). Positivity for autoantibodies was as follows: anti-dsDNA n = 70 patients (28%), anti-Sm n = 63 (24.6%), anti-Ro60 n = 120...
No comment yet.
Scooped by Gilbert C FAURE
June 28, 4:46 AM
Scoop.it!

Lupus patients in England in remission after pioneering NHS trial of GM therapy | George Niles Mekeel

Lupus patients in England in remission after pioneering NHS trial of GM therapy | George Niles Mekeel | AUTOIMMUNITY | Scoop.it
Wonderful news!

Five lupus patients in England are in remission after being treated with a revolutionary therapy that genetically modifies their own cells, in a medical breakthrough that could offer people a cure, doctors have said.

CAR (chimeric antigen receptor) T-cell therapy involves removing a type of white blood cell also called T lymphocytes, which are crucial for hunting out infected or damaged cells, and engineering them to spot and destroy disease. The T-cells are then fed back into the patient via an infusion to reset their immune system.

The therapy is already revolutionising cancer treatment. Now medics in London have successfully used the technique to effectively cure five NHS patients with severe lupus aged between 19 and 50.

CAR T-cell therapy, which patients only need to have once, could transform lupus treatment and remove the need for lifelong medication, doctors said.
No comment yet.
Scooped by Gilbert C FAURE
June 19, 1:19 PM
Scoop.it!

Systems serology identifies FcR-related autoantibody signatures and functions for Sjögren’s syndrome | EMBO Molecular Medicine | Springer Nature Link

Systems serology identifies FcR-related autoantibody signatures and functions for Sjögren’s syndrome | EMBO Molecular Medicine | Springer Nature Link | AUTOIMMUNITY | Scoop.it
Sjögren’s Syndrome (SjS) has historically been associated with classical anti-Ro60/SSA, Ro52/SSA and La/SSB, however they are lacking in one third of the patients, which induces delays in diagnosis, and their disease-contributing role is debated. Here we have applied a SjS-tailored Systems Serology approach to a cohort of 58 SjS and 16 non-SjS sicca syndrome patients, and 40 healthy individuals, involving a multiplex assay measuring antibody isotype, subclass, Fc Receptor and complement engagement to 14 SjS-related autoantigens, an antibody-glycosylation profiling assay and a phagocytosis cell-based assay. Via a machine learning approach, we have identified unique autoantibody signatures, including classical and non-classical autoantigens-related features especially involving autoantigen-specific Fc Receptor binding, with apparent functional consequences. These findings provide interesting insights into the autoantibody responses in SjS, possibly paving the way for improved diagnostics, especially in difficult-to-diagnose patients (e.g., seronegative SjS and non-SjS sicca syndrome patients), and novel therapeutic options targeting autoantibody-specific Fc/Fc Receptor-related effector functions.
No comment yet.
Scooped by Gilbert C FAURE
June 8, 4:10 AM
Scoop.it!

🎾 Dimanche, Alexander Zverev a soulevé la Coupe des Mousquetaires 🏆. Ce que les caméras n’ont pas filmé, c’est le deuxième match qu’il jouait en même temps. Celui contre sa propre… | Dr Riadh Ca...

🎾 Dimanche, Alexander Zverev a soulevé la Coupe des Mousquetaires 🏆. Ce que les caméras n’ont pas filmé, c’est le deuxième match qu’il jouait en même temps. Celui contre sa propre… | Dr Riadh Ca... | AUTOIMMUNITY | Scoop.it
🎾 Dimanche, Alexander Zverev a soulevé la Coupe des Mousquetaires 🏆.

Ce que les caméras n’ont pas filmé, c’est le deuxième match qu’il jouait en même temps. Celui contre sa propre glycémie.

Zverev est diabétique de type 1 depuis l’âge de 3 ans et demi. Une maladie auto-immune qui détruit les cellules du pancréas produisant l’insuline.

Résultat : son corps n’en fabrique plus une seule goutte. Sans injection, ce n’est pas une gêne,c’est un pronostic vital engagé.

Alors imaginez gérer cela pendant une finale de plus de 4 heures.

L’effort prolongé fait chuter la glycémie : le muscle consomme le glucose, la sensibilité à l’insuline grimpe. Mais le stress, l’adrénaline et le cortisol de la compétition la font, eux, remonter. Ajoutez la chaleur de juin sur l’ocre parisienne, qui accélère l’absorption de l’insuline et peut fausser les capteurs. La glycémie part dans les deux sens, sans prévenir.

Comment fait-il ?

Pas de pompe dernier cri. Zverev gère avec un capteur de glycémie en continu,qu’il consulte à chaque changement de côté et un simple stylo à insuline qu’il dégaine sur le court. Il a d’ailleurs dû batailler pour en obtenir le droit à Roland-Garros, qui le lui refusait au départ. « Si je ne le fais pas, ma vie est en danger », a-t-il répondu.

On lui avait pourtant dit, enfant, qu’une carrière de haut niveau serait impossible. Des médecins, « derrière leur bureau ». Ils avaient tort.

Et c’est là que la science a rattrapé le dogme. À condition de maintenir la glycémie dans la cible, une personne diabétique de type 1 peut atteindre une capacité aérobie comparable à celle d’une personne non diabétique. Le consensus international de référence (Riddell, The Lancet Diabetes & Endocrinology, 2017) en donne la recette :
- réduire l’insuline avant l’effort sans jamais la couper
- apporter 30 à 60 g de glucides par heure
- lire non pas le chiffre, mais la tendance 📈.

Team Novo Nordisk, équipe cycliste professionnelle composée exclusivement de diabétiques de type 1, le prouve chaque saison dans le peloton international.

Soyons clairs, en cardiologie/diabétologie : on ne « gagne » pas contre un diabète de type 1. La maladie est là le lendemain matin. Elle reste un facteur de risque cardiovasculaire majeur, à surveiller toute une vie.

Ce que Zverev démontre, ce n’est pas que la volonté guérit. C’est que la technologie et la discipline déplacent le plafond,celui que des décennies de prudence médicale avaient fixé bien trop bas.

Aujourd’hui, on gère le diabète de type 1. Demain, en guérira-t-on ?

Les avancées en cours méritent un post à part,j’y reviens bientôt.

À 9 ans, on lui a listé tout ce qu’il ne ferait jamais.

Dimanche, pendant que le public suivait le score, lui suivait une autre courbe,sur son capteur, entre deux jeux.

Les deux ont fini dans le vert.

Hôpital Américain de Paris
No comment yet.
Scooped by Gilbert C FAURE
May 13, 3:29 AM
Scoop.it!

Antiphospholipid antibodies and cardiovascular thrombosis | Nature Reviews Cardiology

Antiphospholipid antibodies (aPL) are directed against phospholipids and phospholipid-binding proteins. Laboratory assays used to detect aPL include serological tests for aPL against β2-glycoprotein 1, cardiolipin and other molecules, as well as functional assays for lupus anticoagulant. The presence of aPL can lead to endothelial dysfunction or a hypercoagulable state through prothrombotic and antifibrinolytic mechanisms. These processes, often in conjunction with a ‘second hit’, such as trauma, surgery, or other causes of hypercoagulability or stasis, can lead to venous or arterial thrombosis. The thrombotic risk associated with aPL is best recognized in thrombotic antiphospholipid syndrome, characterized by a persistently positive test for lupus anticoagulant or seropositivity for aPL associated with venous, arterial or microvascular thrombosis. However, aPL seropositivity and its clinical effect on thrombotic events have been increasingly recognized in a broader group of individuals who do not meet traditional research criteria for thrombotic antiphospholipid syndrome. In this Review, we provide an overview of the evidence related to aPL seropositivity in individuals with or without previous thrombosis and the clinical relevance of aPL seropositivity in predicting the risk of thrombotic cardiovascular events. We discuss potential management strategies and identify key knowledge gaps that warrant further research. Antiphospholipid antibodies (aPL) are associated with an elevated risk of thromboembolic events in patients with antiphospholipid syndrome and, increasingly, in those without previous thrombosis. In this Review, Bikdeli and colleagues discuss the clinical relevance of aPL seropositivity in predicting the risk of thrombotic cardiovascular events, summarize potential management strategies and identify key knowledge gaps that warrant further research.
No comment yet.
Scooped by Gilbert C FAURE
May 9, 5:28 AM
Scoop.it!

#pwme #myalgice #millionsmissing #severeme #mecfsconf2026 | Anil van der Zee

#pwme #myalgice #millionsmissing #severeme #mecfsconf2026 | Anil van der Zee | AUTOIMMUNITY | Scoop.it
Help!! They're attacking our balls!!

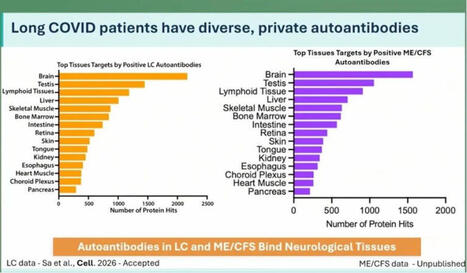
At the ME/CFS conference in Berlin today, Keyla Sá from the Akiko Iwasaki group at Yale showed that Long Covid patients have more autoantibodies targeting neurological tissue. This was apparently tested in both human and mouse tissue.

In ME there are even more autoantibodies than in Long Covid, but number 2 on the list are the cojones.

Interesting. 🍒

Maybe this helps explain why some men develop ME even though the disease is normally more common in women?

Testosterone seems to actually protect against this kind of immune misfire. We see this in research on trans men: https://lnkd.in/ewjxZsRZ

If that protection drops for any reason, the immune system can start attacking your own tissues?

Including your balls?

That’s bullocks!!

https://lnkd.in/eE-giXTv

#pwme #myalgicE #millionsmissing #severeME #MECFSConf2026
No comment yet.
Scooped by Gilbert C FAURE
November 10, 11:15 AM
Scoop.it!

#rheumatology #autoimmunediseases #healtheconomics #publichealth #healthcareexpenditure #realworlddata #france | Laurent ARNAUD

#rheumatology #autoimmunediseases #healtheconomics #publichealth #healthcareexpenditure #realworlddata #france | Laurent ARNAUD | AUTOIMMUNITY | Scoop.it
📊 Are we underestimating the true economic burden of systemic autoimmune diseases?
More patients. Higher expenditures. And a growing indirect burden +++
Our latest nationwide study, covering nearly the entire French population from 2015 to 2023, reveals some striking trends:
🔹 +30% in the number of patients with systemic autoimmune diseases.
🔹 +61.8% in total reimbursed expenditures, reaching €628.5 million in 2023.
🔹 +98.9% in medication costs, the main driver of expenditure growth.
🔹 +74.4% in indirect financial support, reflecting the growing impact on work capacity and productivity.
Behind these figures lies an important message: the economic burden of autoimmune diseases extends far beyond healthcare spending.
As treatments evolve and patient numbers increase, understanding the full economic impact of these diseases becomes more important than ever — for researchers, clinicians and policymakers alike.
📖 Curious to explore the findings?
Discover our latest publication:
Evolution of direct and indirect costs of chronic systemic auto-immune and inflammatory rheumatic diseases in France: a 2015–2023 nationwide population-based study
🔗 DOI: https://lnkd.in/eWfVHqnF
#Rheumatology #AutoimmuneDiseases #HealthEconomics #PublicHealth #HealthcareExpenditure #RealWorldData #France
No comment yet.
Scooped by Gilbert C FAURE
October 17, 9:18 AM
Scoop.it!

JCI - Identification of a systemic lupus erythematosus disease signature in resting naive B cells

JCI - Identification of a systemic lupus erythematosus disease signature in resting naive B cells | AUTOIMMUNITY | Scoop.it
Resting and activated B cell subtypes are altered by SLE disease and disease activity. The frequency of total naive B cells has been shown to inversely correlate with SLE disease activity in studies that did not exclude the aN fraction (2, 10). Additionally, there is a direct correlation between disease activity and increased numbers of aN cells as well as the DN2 progeny of aN cells (2). These B cell abnormalities were present in the individuals assessed herein as determined by multiparameter flow cytometry analysis of isolated peripheral blood PBMCs (Supplemental Figure 1A; supplemental material available online with this article; https://doi.org/10.1172/JCI199528DS1) from a cohort of 14 healthy individuals treated as controls (HCs), 46 with inactive SLE (SELENA-SLEDAI ≤ 4), and 22 with active SLE (SELENA-SLEDAI ≥ 5) (Supplemental Tables 1 and 2). On average, transitional B cells were increased (P = 0.0500) in both SLE cohorts as previously described (Supplemental Figure 1B) (11). The frequency and total number of rN cells were decreased in active disease compared with HC subjects and negatively correlated with SLEDAI (Supplemental Figure 1, C and D). The frequency and number of rN cells were similar between inactive disease and HC. As expected, the aN population was expanded as a fraction of total CD19+ cells and as a fraction of total naive B cells in active SLE (Supplemental Figure 1E). Within the IgD–CD27– DN compartment, we confirmed the expansion of DN2 cells (CD19+CD27–IgD–CD21–CD11c+) in active disease (2) and to a lesser but still significant degree in individuals with low-disease activity (Supplemental Figure 1F). A similar profile was observed for the DN3 cells (CD19+CD27–IgD–CD21–CD11c–), previously described in severe COVID-19 infection (12) and in IgG4-related disease (13). Combined, SLE cohorts displayed an increase of the DN2/DN1 and DN3/DN1 ratios, reflecting a reversal of the DN1 dominance within the DN B cell compartment characteristic of physiological B cell homeostasis (Supplemental Figure 1G). This effect was also seen in antibody-secreting cells (CD19+CD27++CD38++) (Supplemental Figure 1H). Reduced frequencies of unswitched memory B cells (CD19+CD27+IgD–) were observed in both SLE conditions (Supplemental Figure 1I), whereas switched memory B cells (SWM; CD19+CD27+IgD+) were unchanged by SLE diagnosis or disease activity (Supplemental Figure 1J). Overall, the B cell profiles of this SLE cohort align with our earlier findings (2, 3, 10). Principal component analysis (PCA) using all gated B cell populations revealed that the samples from HCs were enriched in rN and unswitched memory B cells according to the principal component loadings, with considerable overlap with inactive SLE, while active individuals separated by PC1, reflecting their increased aN/DN2/antibody-secreting cell populations (Supplemental Figure 1K). The inactive SLE cohort was spread between SWM/DN1, T1/T2, and active disease–associated areas. Collectively, the B cell profiles of most inactive SLE showed more heterogeneity than those individuals with active disease. Importantly, inactive disease B cell profiles did not completely overlap with those from HC samples, a finding consistent with the hypothesis that B cells in inactive SLE may have unique molecular determinants. SLE rN B cells express an abnormal transcriptome in patients with low disease activity. Our previous work demonstrated the presence of an SLE-specific transcriptome and epigenome in several B cell subsets of individuals with high disease activity, including rN (5, 6). To determine whether this transcriptome reflected a disease-determined regulatory program or was instead secondary to disease activity, RNA-seq was performed on cells isolated from PBMCs derived from an additional 17 HC, 15 inactive SLE (SELENA-SLEDAI ≤ 4), and 12 active SLE (SELENA-SLEDAI ≥ 5) individuals using a previously developed sorting strategy (14, 15) to rigorously sort rN B cells (CD19+CD27–IgD+MTG–CD24+CD38+) (5) and T1/T2 cells (CD19+CD27–IgD+MTG+CD24+CD38+) (Supplemental Table 1 and Supplemental Figure 2A). Here, the inactive disease cohort represented a longitudinal blend of individuals who were inactive and flare free from 1.6 to 107.3 months (Supplemental Figure 2B). PCA performed on the differentially expressed genes (DEGs) detected from pairwise comparisons of inactive SLE, active SLE, and HC, showed separation of each group of rN cells (Figure 1A). PC1 distinguished active SLE from both HC and inactive SLE and was positively correlated with SLEDAI (Figure 1B), whereas PC2 separated SLE samples from HC. Principal components were also analyzed with respect to other covariates, including age and medications, and revealed that these covariates were not correlated with the major PCs (Supplemental Figure 2, C and D). Thus, the data reflect that disease state and activity account for the dominant sources of variance in the data. Figure 1The distinct transcriptomes of active and inactive SLE B cells. (A) PCA plot of DEGs in rN B cells. Contours represent high-density regions calculated at probabilities (Prob). (B) Scatterplot of PC1 score by SLEDAI for SLE samples. P value and correlation were calculated by Pearson’s correlation test. (C–E). MA plots showing mean normalized expression (RPKM) for each gene by log2FC. Colors represent –log10 of P value derived from differential testing. (F) GSVA plot showing IFN-α response gene set. P values were calculated using 2-way ANOVA. Post hoc tests were performed across samples within the same cell type using Tukey’s honestly significant difference test and showed significance (adjusted P value < 0.05) in SLE versus HC comparisons but not between active and inactive SLE groups. Differential expression analysis of rN B cells showed hundreds of DEGs between both disease activity groups and HCs and each other (Figure 1, C–E, Supplemental Figure 3A, and Supplemental Dataset 1). In general, both rN and T1/T2 B cells from individuals with active SLE displayed greater numbers of DEGs than their inactive SLE counterparts compared with HCs (Supplemental Figure 3A). PCA of T1/T2 cells also showed a similar separation, albeit with greater overlap between inactive and active SLE, as relatively few genes met FDR significance for differential expression between these 2 groups (Supplemental Figure 3, B and C). Thus, both rN and newly emerging T1/T2 B cells in inactive disease display hallmarks of an SLE disease state with a greater effect of disease activity on the transcriptome of rN cells. This pattern is consistent with the existence of a disease program initiated during early development, as reflected by T1/T2 B cells that expand during maturation into naive B cells and are modified during naive B cell activation. Additionally, many of the DEGs that are unique to either active or inactive SLE rN cells could dictate the properties of these cells in the different phases of the disease. For example, the upregulation in active disease of TNFRSF13B (TACI) (Supplemental Figure 3D), which binds BAFF and APRIL, could lead to alterations in tolerance (16). Upregulation of FCRL5 in active disease (Supplemental Figure 3D) could inhibit anergy and facilitate TLR signaling, as suggested from mouse models (17). In contrast, inactive disease rN cells overexpressed SPI1, which encodes the ETS transcription factor (TF) PU.1, and the epigenetic regulator EZH2 (Figure 1, D and E), a pattern consistent with preferential differentiation of inactive disease naive B cells through germinal centers (GCs) (18, 19). Type I IFN response, TLR, and BCR signaling genes differentiate rN B cells in active SLE. A hallmark transcriptional feature of SLE is the upregulation of type I IFN response in multiple B cell populations (5, 20). Indeed, gene set variation analysis (GSVA) showed that the IFN-α response gene signature was present in the majority of individuals with SLE in this study (Figure 1F). Importantly, 2-way ANOVA of the GSVA results showed that the IFN-α response in rN cells was significantly different across HC and SLE samples but not between active and inactive disease. A combined analysis of all cell types and activity levels highlighted limited DEG overlap between the groups (Figure 2A). The exceptions to this were primarily a core set of IFN response genes (N = 25) upregulated in all SLE groups (Figure 2B). In addition, 76 DEGs were shared only among the active disease rN and T1/T2 cells (Figure 2C). These genes were either upregulated or downregulated in active disease cells, while remaining at HC levels in inactive SLE. Of the genes upregulated (Figure 2D), ISG15, an IFN-induced antiviral response gene, has been associated with SLE disease activity (21). NLRP6, also overexpressed in active disease, encodes a key pattern recognition sensor component of inflammasome-mediated innate immunity and can be upregulated via type I IFN in some infections (22). The IFN regulatory factor 7 TF, encoded by IRF7, was more highly expressed in active disease B cells. IRF7 is a key regulator of the interferon response gene program (23) and genetic susceptibility to severe SLE (24). Of note, IRF7 mediates TLR7 signaling, a central SLE activation pathway (4). Finally, although THEMIS2 expression was significantly enriched in active versus HC, some inactive disease rN and T1/T2 samples also expressed high levels of THEMIS2 (Figure 2D). THEMIS2 encodes a protein known to interact with PLCγ2 to lower B cell activation thresholds to low-avidity antigens, a function of particular relevance to naive B cells (25). THEMIS2 is also of interest for SLE pathogenesis, as it is required to induce the expression of TBET and the production of IFN-γ (26), factors of major significance in the activation and differentiation of SLE naive B cells. Figure 2Shared and distinct gene expression signatures in active and inactive SLE. (A) Venn diagram showing the number of DEGs shared and distinct across groups. (B) Heatmap of the 25 DEGs shared across all 4 groups from A. Normalized expression values (RPKM) were averaged by group and z scored. (C) Heatmap as in B showing the 76 DEGs overlapping between the indicated cell types. (D and E) Box-and-whisker plots showing normalized gene expression for indicated genes and groups with higher or lower expression, respectively, in active SLE. Dots represent individual samples and are colored according to log transformation of SLEDAI score. The box-and-whisker plots depict the minimum and maximum values (whiskers), the upper and lower quartiles, and the median. Downregulation was also observed for PI3K family members, including the catalytic subunits PIK3CD and PIK3CG, as well as the regulatory subunit PIK3R5 and the TF FOXO1, which regulates PIK3R5 (27) (Figure 2, C and E). The PI3K/FOXO1 axis is an important regulator of B cell activation and homing to the lymph nodes, and its attenuation may enhance class switch recombination in primary B cells (28). Other examples of modulators of lymphocyte activation gene sets downregulated in active disease included FCRL3 and FCER2 (encoding CD23), although there appears to be a downward trend in inactive disease (Figure 2E). FCRL3 is an inhibitor of BCR signaling, and stimulation through FCRL3 enhances TLR9-mediated B cell activation but suppresses further differentiation to plasma cells (29). CD23 is induced by stimulation of B cells with IL-4, while being reduced by IFN stimulation. Human CD23 expression is strongly downregulated in SLE aN B cells (3). Also downregulated in B cells within the active SLE cohort was the expression of MEF2C (Figure 2, C and E), a TF involved in B cell development and GC formation (30, 31). Inactive SLE has a unique transcriptional program. To better understand the nature of a SLE disease-state signature in the absence of disease activity, all pairwise DEGs were hierarchically clustered resulting in 4 distinct gene clusters (Figure 3A). In parallel, the samples were K-means clustered into 3 groups based on gene expression patterns. This approach resulted in a clear group of high SLEDAI active SLE samples that also displayed the largest transcriptional distance from HCs. Although heterogeneity exists, the majority of inactive individuals formed a distinct cluster. Cluster 1 contained DEGs highly expressed in both SLE groups and was enriched for IFN response genes (Figure 3), many of which were shared between rN and T1/T2 cells (Figure 2B). This cluster also included the gene for STAT4, a TF induced by type I interferons that participates in IL-12 signaling, promoting IFN-γ production (32, 33). Polymorphisms in STAT4 are associated with severe SLE (34), and its expression was elevated in rN cells from both disease activity levels, although to a greater extent in active SLE (Supplemental Figure 3D). Genes in cluster 2 were most highly expressed in active SLE, as exemplified by THEMIS2, also overexpressed in active transitional cells (Figure 2E). Cluster 2 also contained overexpressed members of the TNF superfamily, including TNFRSF10A (Death Receptor 4 or TRAIL receptor), which activates NF-κB inflammatory pathways. This cluster also contains the gene for STAG3, a protein critical for functionality of meiotic cohesin complexes, previously found as one of the top overexpressed genes in unfractionated CD19+ SLE B cells (35). Figure 3Cytokine and CD40 signaling gene expression in rN inactive SLE. (A) Heatmap showing DEGs in rN B cells with respect to disease activity. Normalized expression (RPKM) of DEGs were z scored and clustered using hierarchical clustering into 4 clusters by row, whereas columns were K-means clustered using a K = 3. (B) Bubble plot showing Gene Ontology enrichment of clusters from A. Bubbles are colored by the overlapped (k) genes normalized by each gene set size (K) and are presented as percentages. (C) Bar plots of normalized gene expression (RPKM) for indicated genes in rN cells. (D) Bubble plot showing GSEA. Bubbles are colored by normalized enrichment score (NES) and sized according to enrichment P value. Gene set descriptions are provided in Supplemental Table 3. A, active SLE; I, inactive SLE. (E) GSEA plots and NES for inactive or active SLE versus HC rN B cells. Dotted lines indicated enrichment that did not meet significance (FDR < 0.05). (F) Heatmap showing leading-edge genes from the CD40 signaling GSEA gene set in E. Normalized expression (RPKM) of DEGs were z scored. (G) GSEA plots for indicated gene sets for rN cells. (H) Bar plots of normalized gene expression (RPKM) for indicated genes from rN cells. In C and H, data are presented as the mean ±1 SD. Asterisks indicate significance in DESeq2 differential expression testing (Wald test with Benjamini-Hochberg correction), FDR < 0.05. The remaining 2 clusters (3 and 4) contained genes that were down- and upregulated in inactive disease compared with HCs, respectively, and included gene sets broadly associated with cytokine responses, proliferation, and regulation of cell activation pathways (Figure 3, A and B). Cluster 3 comprised genes most severely repressed in active SLE and to a lesser extent in inactive SLE. Notably, it included IL4R, which counteracts the ability of IFN-γ to induce a TBET program in pathogenic SLE B cells as well as the differentiation of TLR7-activated naive B cells into pathogenic DN2 B cells (36–38). Cluster 3 also included downmodulated genes associated with B cell activation, naive B cell identity, and BCR signaling inhibition, including PIK3R5, MEF2C, and FCRL3 discussed above (29, 30) as well as NFAT1 (NFATC2), which is important for B cell anergy in a mouse self-tolerance model (39, 40). Cluster 4 contained genes highly expressed by inactive SLE rN B cells, including BCL6, which is required for the early stage of GC formation (Figure 3C) (41). Cluster 4 also contained genes associated with B cell activation and TNF-α/NF-κB signaling gene sets (Figure 3B), which suggests the potential for dysregulation of additional cytokine pathways in inactive SLE. To test this, we curated a library of gene sets representing various forms of B cell activation and cytokine signaling (Supplemental Table 3). In addition to enrichment of type I and II IFN gene sets in all SLE cell types and activity levels (Figure 3D), significant enrichment in inactive SLE rN B cells was found for CD40 signaling and several cytokine pathways, including TNF-α, IL-12, and IL-10, compared with HC and active SLE (Figure 3G and Supplemental Figure 3E). TNF-α/NF-κB and CD40 signaling pathways showed the greatest number of gene set members upregulated (FDR < 0.05) in inactive SLE (Figure 3E). It is important to note that many of these pathways have common overlapping genes and that all genes in a pathway may not be expressed in a given comparison. We next interrogated the leading-edge subset of genes driving the association with CD40 signaling. That gene subset, with the greatest expression in inactive SLE, included members of not only the B cell CD40 response but also NF-κB signaling and GC B cell expressed genes (Figure 3F). Direct gene expression comparison between active and inactive SLE showed enrichment in inactive SLE for CD40 signaling, IL-4 response, and light zone GC B cell–expressed genes (Figure 3G). Compared with active disease, transcripts for GC B cell genes BCL6 (Figure 3C) and ITGB2 (Figure 3H) were significantly elevated in inactive SLE, suggesting that inactive SLE rN cells may be predisposed to interact with T cells and to follow distinct differentiation paths when activated. Alternatively, increased GC genes could restrict the differentiation potential of these B cells. Other significantly elevated transcripts in this comparison included CD44, a cell adhesion molecule with maximal expression in preactivated naive B cells and the TF BHLHE40, which is often associated with B cell activation and may restrict GC formation (Figure 3H) (42, 43). Increased expression of TNIP2, which encodes a modulator of NF-κB signaling, was observed in inactive SLE compared with HC (Figure 3H). Intriguingly, reduced expression of TRAF5 (a signaling mediator of CD40 signaling) (44, 45) in inactive SLE compared with HC suggested that this activation pathway may be dysfunctional to some extent (Supplemental Figure 3D). Overall, these data suggest an increased role of abnormal CD40, NF-κB, IL-4, and TNF-α cytokine signaling events in inactive disease rN B cells. Epigenetic alterations to IFN-α response and TLR regulation loci remain accessible during disease remission. To characterize the epigenetic state of rN B cells during active and inactive SLE, we performed the assay for transposase-accessible chromatin with sequencing (ATAC-seq) (46) on a subset of the same SLE and HC samples that were profiled by RNA-seq above (Supplemental Table 1). A total of 24,793 differentially accessible regions (DARs) were found after comparing both disease groups and HCs in all pairwise combinations (Supplemental Dataset 2). Similar to the RNA-seq data, correlation analysis of the major principal components to other covariates revealed PC1 correlated with disease activity and SLEDAI and not to medications or other covariates (Supplemental Figure 2D). Both inactive (Figure 4A) and active SLE (Figure 4B) exhibited thousands of DARs (FDR < 0.05) when compared with HCs. On average, DARs present only in inactive disease exhibited small changes in accessibility, whereas those that overlapped both disease groups and active disease had higher absolute differential accessibility levels (Figure 4C). When assessing a 2-fold change, one-third of DARs from active disease rN cells overlapped with those occurring in inactive rN cells (Figure 4D). This collection of loci reflecting inactive and active disease-specific DARs, as well as those that overlapped, was used for gene pathway enrichment analysis (Figure 4E). Figure 4Chromatin accessibility changes in inactive SLE partially overlap those in active SLE. (A and B) MA plots showing mean normalized accessibility (reads per peak million [rppm]) for each locus by log2FC compared between the indicated groups. Dotted lines represent ± 0.5 log2FC cutoff. (C) Whisker-and-box plot showing absolute value of log2FC for loci in A and B separated by whether they occur in the indicated groups or overlap. (D) Venn diagram showing number of DARs in either disease activity compared with HCs using a log2FC cutoff of > 1. (E) Lollipop chart showing gene pathway enrichment of DARs (log2 of number observed [Obs]/number expected [Exp]) in the indicated groups. (F) Genome track plots. Black boxes represent DARs. (G) Whisker-and-box plots showing log2FC in gene expression in rN for each SLE group compared with HCs that have ≥ 1 shared accessible DAR. Lines connect individual genes. The box-and-whisker plots depict the minimum and maximum values (whiskers), the upper and lower quartiles, and the median. P value was calculated by paired 2-tailed Student’s t test. This analysis showed significant enrichment for overlapping and nonoverlapping pathways in each disease group. A subset of regions was significantly changed in accessibility only in inactive SLE. Consistent with the reduced effect size for this set of DARs, subtle increases in accessibility in DARs within the NOTCH3, ETS1, and DGKD loci were observed for inactive SLE rN cells (Supplemental Figure 4A). NOTCH3 and ETS1 encode transcriptional regulators, and DGKD encodes a diacylglycerol kinase. DARs specifically associated with active SLE were enriched around genes in several signaling cascades and in the positive regulation of lymphocyte activation, including SOCS1, which encodes a suppressor of IFN signaling (47) and a direct regulator of IRF7 degradation (48). DARs at CLEC16A, which functions in autophagy and intracellular trafficking, were enriched in active SLE (Supplemental Figure 4B). CLEC16A is associated with susceptibility to autoimmune disease and inflammation (49, 50) and is located at an autoimmunity risk locus (51) that includes the MHC-II master regulators CIITA and SOCS1. The HKDC1 and SUPV3L1 genes, which encode a hexokinase and a mitochondrial double-stranded RNA helicase, respectively, contain DARs found only in active SLE (Supplemental Figure 4B). Importantly, DARs in both disease activities (when compared with HCs) included regions with increased accessibility around several IFN response genes, such as IFI44/IFI44L and RSAD2 (Figure 4F and Supplemental Figure 4C). To determine whether these changes to chromatin accessibility were correlated with gene expression changes in SLE, expression was queried for those genes found at loci with at least 1 shared DAR in both active and inactive SLE. Many of these genes showed continued differential expression from HCs in both disease activity groups; however, a significant increase in the magnitude of expression changes was observed in active SLE individuals (Figure 4G). These data suggest that inactive disease rN B cells maintain accessible regions of chromatin around important loci, such as type I IFN response genes, indicating that either durable epigenetic memory, persistent inflammatory signaling, or both is occurring. The increase in overall gene expression at these shared loci suggests that additional events/factors are present/augmented in the active disease state. Unique and shared TF motifs in inactive and active SLE epigenomes. To determine which TFs may play a role in regulating genes with differential accessibility in inactive and active SLE, enrichment analysis of known TF-binding motifs was performed on all DARs. Ranking the magnitude of enrichment of motifs over genomically matched background regions using HOMER (52) identified specific TF families that were enriched in each of the above categories of DARs. TF binding motifs for EBF1, p63, and TCF4, which contribute to mature B cell identity, homeostasis, and GC formation (53–56), were enriched in DARs with increased accessibility in inactive disease (Figure 5A). DARs in both disease activity groups (but not HCs) were enriched for ETS and IRF family motifs. Regions that became less accessible only in active SLE were enriched for NF-κB, FOXO1, and SPIB motifs, whereas inactive-specific DARs with less accessibility were enriched for EGR family motifs (Figure 5B). EGR motifs were previously shown to drive a network of genes in rN cells of active SLE (5). The enrichment for IRF family motifs, including IFN-stimulated response elements, was found within regions that remained accessible in both disease activity levels. However, additional enrichment of IRF and IFN-stimulated response element motifs was also found in DARs that were accessible only in active SLE (Figure 5C). Basic helix-loop-helix (bHLH) family motifs, such as those for TCF4, E2A (TCF3), and n-MYC, were also enriched with the highest ranking in the DARs specific to inactive SLE (Figure 5D). Intriguingly, significant enrichment of IRF8 motifs was found in regions both losing and gaining accessibility compared with HCs, particularly in active disease DARs, but also in those shared with inactive disease (Figure 5E). As above, NF-κB motifs were only enriched in DARs that lose accessibility in SLE (Down DAR), most significantly in active disease rN (Figure 5E). Together, these data suggest roles for ETS, IRF, bHLH, EGR, and NF-κB TF families in establishing or maintaining SLE disease activity–associated epigenetic changes. Figure 5IRF and NFAT family factor motifs are enriched in shared elements of inactive and active SLE chromatin. (A and B) Heatmaps showing z scored ranking of HOMER motif enrichment from DARs with positive (A) or negative (B) log2FC compared with HCs ranked by effect size within each column. Columns represent specificity to active, inactive, or overlapped (those found in both disease states) DARs. (C and D) Heatmap of ranking for IRF (C) or bHLH (D) family factors after log10 transformation. (E) Bar plots showing percentage of regions containing indicated target motif (red) versus selected genomic background (blue). Act, active SLE; Inact, inactive SLE. MEF2C and E2A/E2-2 factors likely regulate inactive SLE-specific gene sets. RNA expression and chromatin accessibility assay data were integrated into a gene regulatory network with the Taiji tool (57), which uses the PageRank algorithm to reveal the factors most implicated in coordinated regulation of RNA expression based on chromatin accessibility (Figure 6A). Similar to previous results (5), ATF3 was enriched in both active and inactive rN datasets, suggesting a role in driving the common SLE signature. PAX5 and RUNX1 had higher PageRank values in inactive disease for both rN and T1/T2 cells, while EGR1 and IKZF1 values were highest for the T1/T2 cell type within inactive SLE. TCF4, TCF3, and TCF12, which encode the TFs E2-2, E2A, and HEB, respectively, along with MEF2C and MEF2D showed the highest PageRank score in rN cells from inactive disease samples. In contrast, the factors NFATC2 and NFATC3 showed reduced importance in inactive disease rN cells compared with healthy or active counterparts (Figure 6A). This reduced importance correlated with lowered expression of the NFAT genes themselves (Figure 6B). A comparison of PageRank scores between active versus inactive disease showed that TFs such as TCF3, MEF2D, and CEBPB were predicted to be more important in inactive disease rN cells. Other PageRank scores were likely less driven by changes in their own transcript expression, but more by their influence on target genes. For example, BCL6 was more highly expressed in inactive disease but appears to have a lower impact on its target genes, as assessed by PageRank. Figure 6MEF2 and E2A/E2-2 regulate inactive SLE gene expression programs. (A) Heatmap showing log2FC of PageRank network importance score for SLE conditions (rN and T1/T2) versus HCs. (B) Scatterplots showing PageRank score (x axis) versus RNA expression. (C) Heatmap representing significance of overlap between TF target list and relevant B cell gene pathways. Color represents FDR P value of Fisher’s exact tests transformed using –log10. To test this, TF gene targets in inactive rN cells, as determined by accessibility of motifs at predicted enhancer regions, were cross-referenced across the B cell activation and cytokine-signaling gene set libraries used in Figure 3. Fisher’s exact tests showed significant enrichments of target genes of PageRank-implicated TFs (Figure 6C). For example, IRF3 and IRF7 regulatory targets were most significantly enriched for IFN response genes, supporting their known role in TLR-mediated type I IFN response gene expression pathways (58). Targets of MEF2C/D and NR3C2, as well as to a lesser extent RUNX1 and NF-κB factors, were enriched for elements of the CD40 signaling gene set, which was expressed more highly by inactive rN B cells. MEF2C expression was significantly decreased from HCs in active SLE only (Supplemental Figure 3D). NFATC1 and NFATC2 target genes were enriched for B cell receptor and TLR signaling genes, suggesting alterations in the potential for these cells to respond to future antigen, cytokine, or stimulation challenges. The regulatory targets of E2A (TCF3), HEB (TCF12), PRDM1, and the glucocorticoid receptor NR3C1 were enriched for a gene set consisting of the DEGs from active versus inactive SLE in rN cells (Figure 6C). Thus, these data connect epigenetic changes in DARs with their associated TF motifs and alterations in gene expression pathways regulated in inactive SLE.
No comment yet.
Scooped by Gilbert C FAURE
October 14, 6:49 AM
Scoop.it!

https://www.thelancet.com/journals/landia/article/PIIS2213-8587(26)00189-0/abstract?dgcid=facebook_organic_clinical_green_landia

No comment yet.
Scooped by Gilbert C FAURE
October 8, 8:19 AM
Scoop.it!

𝗦𝘁𝗿𝗲𝘀𝘀 + 𝗹𝗼𝘀𝘁 𝘁𝗼𝗹𝗲𝗿𝗮𝗻𝗰𝗲 = 𝗔𝘂𝘁𝗼𝗶𝗺𝗺𝘂𝗻𝗲 𝗵𝗮𝗶𝗿 𝗹𝗼𝘀𝘀 𝘚𝘵𝘳𝘦𝘴𝘴, 𝘦𝘯𝘥𝘰𝘨𝘦𝘯𝘰𝘶𝘴 𝘳𝘦𝘵𝘳𝘰𝘷𝘪𝘳𝘶𝘴𝘦𝘴 𝘢𝘯𝘥 𝘭𝘰𝘴𝘵 𝘛𝘳𝘦𝘨 𝘵𝘰𝘭𝘦𝘳𝘢𝘯𝘤𝘦… | Andrea...

𝗦𝘁𝗿𝗲𝘀𝘀 + 𝗹𝗼𝘀𝘁 𝘁𝗼𝗹𝗲𝗿𝗮𝗻𝗰𝗲 = 𝗔𝘂𝘁𝗼𝗶𝗺𝗺𝘂𝗻𝗲 𝗵𝗮𝗶𝗿 𝗹𝗼𝘀𝘀 𝘚𝘵𝘳𝘦𝘴𝘴, 𝘦𝘯𝘥𝘰𝘨𝘦𝘯𝘰𝘶𝘴 𝘳𝘦𝘵𝘳𝘰𝘷𝘪𝘳𝘶𝘴𝘦𝘴 𝘢𝘯𝘥 𝘭𝘰𝘴𝘵 𝘛𝘳𝘦𝘨 𝘵𝘰𝘭𝘦𝘳𝘢𝘯𝘤𝘦… | Andrea... | AUTOIMMUNITY | Scoop.it
𝗦𝘁𝗿𝗲𝘀𝘀 + 𝗹𝗼𝘀𝘁 𝘁𝗼𝗹𝗲𝗿𝗮𝗻𝗰𝗲 = 𝗔𝘂𝘁𝗼𝗶𝗺𝗺𝘂𝗻𝗲 𝗵𝗮𝗶𝗿 𝗹𝗼𝘀𝘀
𝘚𝘵𝘳𝘦𝘴𝘴, 𝘦𝘯𝘥𝘰𝘨𝘦𝘯𝘰𝘶𝘴 𝘳𝘦𝘵𝘳𝘰𝘷𝘪𝘳𝘶𝘴𝘦𝘴 𝘢𝘯𝘥 𝘭𝘰𝘴𝘵 𝘛𝘳𝘦𝘨 𝘵𝘰𝘭𝘦𝘳𝘢𝘯𝘤𝘦 𝘤𝘰𝘯𝘷𝘦𝘳𝘨𝘦 𝘵𝘰 𝘵𝘳𝘪𝘨𝘨𝘦𝘳 𝘊𝘋8+ 𝘛-𝘤𝘦𝘭𝘭-𝘮𝘦𝘥𝘪𝘢𝘵𝘦𝘥 𝘢𝘶𝘵𝘰𝘪𝘮𝘮𝘶𝘯𝘦 𝘩𝘢𝘪𝘳 𝘭𝘰𝘴𝘴.

🧠 𝗔 𝗽𝗮𝗽𝗲𝗿 𝗮 𝗱𝗮𝘆 𝗸𝗲𝗲𝗽𝘀 𝗯𝗿𝗮𝗶𝗻 𝗱𝗲𝗰𝗮𝘆 𝗮𝘄𝗮𝘆 🧠
Wednesday, 7 October 2026

𝘏𝘢𝘪𝘳 𝘧𝘰𝘭𝘭𝘪𝘤𝘭𝘦 𝘴𝘵𝘦𝘮 𝘤𝘦𝘭𝘭𝘴 𝘢𝘳𝘦 𝘯𝘰𝘳𝘮𝘢𝘭𝘭𝘺 𝘱𝘳𝘰𝘵𝘦𝘤𝘵𝘦𝘥 𝘧𝘳𝘰𝘮 𝘪𝘮𝘮𝘶𝘯𝘦 𝘢𝘵𝘵𝘢𝘤𝘬. 𝘊𝘶𝘪, 𝘞𝘶 𝘦𝘵 𝘢𝘭. 𝘴𝘩𝘰𝘸 𝘪𝘯 𝘮𝘪𝘤𝘦 𝘵𝘩𝘢𝘵 𝘢𝘯𝘢𝘨𝘦𝘯-𝘭𝘪𝘯𝘬𝘦𝘥 𝘴𝘺𝘮𝘱𝘢𝘵𝘩𝘦𝘵𝘪𝘤 𝘯𝘰𝘳𝘢𝘥𝘳𝘦𝘯𝘢𝘭𝘪𝘯𝘦 𝘴𝘪𝘨𝘯𝘢𝘭𝘭𝘪𝘯𝘨 𝘵𝘩𝘳𝘰𝘶𝘨𝘩 𝘈𝘋𝘙𝘉2 𝘤𝘳𝘦𝘢𝘵𝘦𝘴 𝘢 𝘵𝘳𝘢𝘯𝘴𝘪𝘦𝘯𝘵𝘭𝘺 𝘷𝘶𝘭𝘯𝘦𝘳𝘢𝘣𝘭𝘦 𝘧𝘰𝘭𝘭𝘪𝘤𝘶𝘭𝘢𝘳 𝘴𝘵𝘢𝘵𝘦 𝘵𝘩𝘢𝘵 𝘱𝘳𝘰𝘨𝘳𝘦𝘴𝘴𝘦𝘴 𝘵𝘰 𝘢𝘶𝘵𝘰𝘪𝘮𝘮𝘶𝘯𝘦 𝘥𝘦𝘴𝘵𝘳𝘶𝘤𝘵𝘪𝘰𝘯 𝘸𝘩𝘦𝘯 𝘳𝘦𝘨𝘶𝘭𝘢𝘵𝘰𝘳𝘺 𝘛-𝘤𝘦𝘭𝘭 𝘤𝘰𝘯𝘵𝘳𝘰𝘭 𝘪𝘴 𝘭𝘰𝘴𝘵.

💡 𝗧𝗮𝗸𝗲 𝗵𝗼𝗺𝗲 𝗺𝗲𝘀𝘀𝗮𝗴𝗲
 • During anagen, sympathetic noradrenaline signals through the β2-adrenergic receptor in hair follicle stem cells, physiologically reactivating endogenous retroviruses before overt inflammation.
 • Loss of regulatory T-cell restraint converts this normally tolerated state into autoimmunity. Psychological stress or optogenetic sympathetic activation also renders normally resistant telogen follicles susceptible.
 • Endogenous retroviral activity engages absent in melanoma 2 and type 1 conventional dendritic-cell-dependent CD8+ T-cell responses. Reverse-transcriptase inhibition or Aim2 deletion protects follicles from destruction.

🔥 𝗜𝗺𝗽𝗮𝗰𝘁
 • Autoimmune hair loss emerges from the convergence of immune dysregulation with a transient physiological tissue state, nominating adrenergic signalling and endogenous retroviral activity for translational testing.

❓ 𝗢𝗽𝗲𝗻 𝗾𝘂𝗲𝘀𝘁𝗶𝗼𝗻𝘀
 • Do well-staged human alopecia areata lesions reproduce the sympathetic–β2-adrenergic receptor–endogenous retrovirus axis?
 • Which endogenous retroviral nucleic acids and responding cell populations drive absent in melanoma 2 activation in vivo?
 • Would reverse-transcriptase inhibition or selective follicular β2-adrenergic receptor blockade prevent or reverse established human disease?

𝗔 𝘁𝘄𝗼-𝗵𝗶𝘁 𝗺𝗲𝗰𝗵𝗮𝗻𝗶𝘀𝗺 𝘁𝗿𝗶𝗴𝗴𝗲𝗿𝘀 𝗮𝘂𝘁𝗼𝗶𝗺𝗺𝘂𝗻𝗲 𝗵𝗮𝗶𝗿 𝗹𝗼𝘀𝘀
Jun Cui, Peng Wu et al.
Nature, September 2026
Corresponding author: Ting Chen

🔗 𝘓𝘪𝘯𝘬 𝘵𝘰 𝘵𝘩𝘦 𝘱𝘶𝘣𝘭𝘪𝘤𝘢𝘵𝘪𝘰𝘯 𝘪𝘯 𝘤𝘰𝘮𝘮𝘦𝘯𝘵𝘴
𝘐𝘭𝘭𝘶𝘴𝘵𝘳𝘢𝘵𝘪𝘰𝘯 𝘨𝘦𝘯𝘦𝘳𝘢𝘵𝘦𝘥 𝘸𝘪𝘵𝘩 𝘊𝘩𝘢𝘵𝘎𝘗𝘛.
𝘛𝘩𝘦 𝘰𝘱𝘪𝘯𝘪𝘰𝘯𝘴 𝘴𝘩𝘢𝘳𝘦𝘥 𝘰𝘯 𝘓𝘪𝘯𝘬𝘦𝘥𝘐𝘯 𝘢𝘳𝘦 𝘮𝘺 𝘰𝘸𝘯.
No comment yet.
Scooped by Gilbert C FAURE
August 25, 9:14 AM
Scoop.it!

Autoantibodies neutralizing type I interferons underlie a third of cases of Chikungunya virus encephalitis or myelitis | PNAS | Jean-Laurent Casanova

Autoantibodies neutralizing type I interferons underlie a third of cases of Chikungunya virus encephalitis or myelitis | PNAS | Jean-Laurent Casanova | AUTOIMMUNITY | Scoop.it
We are excited to report in PNAST-Proceedings Of The National Acad... that autoantibodies neutralizing type I interferons underlie 35% of cases of Chikungunya virus (CHIKV) encephalitis or myelitis from a multiple cohort study (https://lnkd.in/gxux4e6e).

Chikungunya virus (CHIKV), an arthropod-borne virus, has caused many outbreaks. While most patients experience fever and joint pain, in rare cases, it invades the brain or spinal cord, causing fatal complications. Our new paper shows why only some develop these complications.

We studied 245 confirmed CHIKV cases from Martinique and Brazil, including 20 with severe CNS disease (encephalitis, myelitis, encephalomyelitis). In 35% of CNS cases, patients had autoantibodies that neutralize their own type I interferons, the body's frontline antiviral defense.

These autoantibodies were undetectable in all 225 patients with mild infection. However, patients who had these antibodies before infection had approximately 850 times the risk of developing severe CNS disease compared to the general population.

Our data support a mechanism where these autoantibodies block the activity of IFN-I during CHIKV infection. This disruption of the host's normal antiviral responses allows the virus to replicate unchecked and cross into the central nervous system, leading to fatal diseases.

This paper is the latest chapter of a six-year-long story that our lab has been writing. In 2020, we showed that these IFN-I autoantibodies underlie at least 10% of life-threatening COVID-19 pneumonia. This discovery was a glimpse of a larger picture (https://lnkd.in/gU3tERpW).

Since then, our studies have consistently identified the same mechanism in various viruses. Approximately 20% of COVID-19 deaths are attributed to antibodies that are already present in about 4% of individuals over the age of 70 (https://lnkd.in/gMwk9tmm)
Additionally, the Yellow fever vaccine can cause encephalitis, while the West Nile virus can cause encephalitis in about 40% of cases (https://lnkd.in/gFNU-Wzt).

Tick-borne encephalitis can cause encephalitis in about 10% of cases, and Powassan, Usutu, Ross River virus disease, and Chikungunya vaccine (VLA1553) can also cause encephalitis. (Figure: Groen & Hale Curr. Opin. Virol. 2026; https://lnkd.in/gsgXa_ME).
No comment yet.
Scooped by Gilbert C FAURE
August 12, 3:56 AM
Scoop.it!

Do autoantibodies shape cancer immunosurveillance? | Alper Tunga Özdemir

Do autoantibodies shape cancer immunosurveillance? | Alper Tunga Özdemir | AUTOIMMUNITY | Scoop.it
It seems that autoimmunity and cancer have finally found common ground 🧐
No comment yet.
Scooped by Gilbert C FAURE
August 7, 10:04 AM
Scoop.it!

Challenges and solutions to standardization in immunoassays for... - Presenters F - - Aug 26 2026

Challenges and solutions to standardization in immunoassays for... - Presenters F - - Aug 26 2026 | AUTOIMMUNITY | Scoop.it
Access educational materials, eLearning activities, accredited Live webinar sessions with polls and chat on this fast Digital Library and Hybrid Virtual Event Platform powered by MULTILEARNING LMS.
No comment yet.
Scooped by Gilbert C FAURE
July 16, 10:22 AM
Scoop.it!

JCI Insight - Macrophage signaling associates with fibrogenic program activation in periductal fibroblasts in pediatric primary sclerosing cholangitis

JCI Insight - Macrophage signaling associates with fibrogenic program activation in periductal fibroblasts in pediatric primary sclerosing cholangitis | AUTOIMMUNITY | Scoop.it
Macrophage activity is correlated with advanced fibrosis in AILD. To investigate the association between macrophage activation and fibrosis-associated transcriptional programs across AILD, we performed RNA-Seq of cryopreserved tissue samples from 64 clinically indicated liver biopsies of pediatric...
No comment yet.
Scooped by Gilbert C FAURE
June 22, 10:42 AM
Scoop.it!

JCI Insight - Longitudinal clinical proteomics reveals pneumonia type–specific protein biomarkers and autoantibodies

JCI Insight - Longitudinal clinical proteomics reveals pneumonia type–specific protein biomarkers and autoantibodies | AUTOIMMUNITY | Scoop.it
Mass spectrometry reveals pneumonia type–specific protein signatures in bronchoalveolar fluid. To identify pneumonia type–specific biomarkers, we sampled BALF and plasma from individuals enrolled in the Successful Clinical Response in Pneumonia Therapy (SCRIPT) study at Northwestern Memorial...
No comment yet.
Scooped by Gilbert C FAURE
June 11, 1:45 PM
Scoop.it!

Autoantibodies against Cytokines — From Infection to Inflammation

No comment yet.
Scooped by Gilbert C FAURE
May 26, 3:59 AM
Scoop.it!

Inflammatory Myopathies and Autoantibodies Impact Diagnosis and Prognosis | NEJM Group posted on the topic

Inflammatory Myopathies and Autoantibodies Impact Diagnosis and Prognosis | NEJM Group posted on the topic | AUTOIMMUNITY | Scoop.it
Inflammatory myopathies are typically associated with a myositis-specific autoantibody that determines the diagnosis and prognosis. Myositis subgroups have distinct pathomechanisms that now allow for targeted therapies. 👉 https://nej.md/49Iy9Oo

Inflammatory myopathies are a heterogeneous group of autoimmune diseases characterized by immune-mediated damage to skeletal muscle. They are classified into five major subtypes: inclusion-body myositis, immune-mediated necrotizing myopathies, antisynthetase syndrome, overlapping myositis, and dermatomyositis, each with distinct clinical features and outcomes.

Inclusion-body myositis and immune-mediated necrotizing myopathies primarily affect muscle, with prognosis largely determined by functional impairment, whereas antisynthetase syndrome, overlapping myositis, and dermatomyositis are systemic diseases that can involve the skin, joints, and lungs and may be life-threatening.

The majority of inflammatory myopathies are associated with myositis-specific autoantibodies, which inform diagnosis, subtype classification, and prognosis. Advances in understanding the distinct pathomechanisms underlying each subgroup now enable increasingly targeted therapeutic approaches.

Learn more in the Review Article “Inflammatory Myopathies” by Yves Allenbach, MD, PhD, and Olivier Benveniste, MD, PhD: https://nej.md/49Iy9Oo

#Neurology #Rheumatology
No comment yet.
Scooped by Gilbert C FAURE
May 13, 3:28 AM
Scoop.it!

Germinal-centre and extrafollicular B cell pathways in systemic lupus erythematosus | Nature Reviews Rheumatology

Germinal-centre and extrafollicular B cell pathways in systemic lupus erythematosus | Nature Reviews Rheumatology | AUTOIMMUNITY | Scoop.it
Autoantibody flares are important drivers of pathology in systemic lupus erythematosus (SLE), highlighting the pivotal role of B cells in initiating and propagating chronic autoimmunity. Although autoreactive specificities are a normal feature of the naive B cell repertoire, these cells are normally suppressed by layered tolerance checkpoints that limit inappropriate activation. Autoimmune-prone environments can lower these tolerance thresholds, rendering naive autoreactive B cells more sensitive to aberrant cues. Cytokines and other microenvironmental signals shape tissue niches that direct autoreactive B cells towards either germinal-centre or extrafollicular differentiation pathways. Germinal centres support the entry, selection and diversification of autoreactive B cells, with T cell help sustaining these repertoires. By contrast, naive autoreactive B cells entering the extrafollicular pathway exhibit an attenuated requirement for cognate T cell help and strong dependence on complement and TLR signalling. Emerging evidence continues to refine our understanding of germinal-centre and extrafollicular responses as complementary sources of autoreactive effector cells. With this progress, investigations into the origin, development, longevity and tissue dynamics of autoreactive memory B cells as chronic sources of autoantibodies are warranted. Although broad B cell depletion therapies have yielded benefit, a key challenge now is developing precision strategies that selectively target pathogenic B cell subsets. Autoreactive B cells normally held in check by tolerance checkpoints can be driven towards germinal-centre or extrafollicular differentiation in autoimmune environments. This Review examines the cellular, molecular and contextual cues that shape these pathways and considers their implications for systemic lupus erythematosus pathogenesis and therapy.
No comment yet.
Scooped by Gilbert C FAURE
April 22, 9:47 AM
Scoop.it!

Antiphospholipid syndrome classification - Rheumatology Notebooks | Podcast on

Listen to this episode from Rheumatology Notebooks on Spotify. Podcast on "2023 ACR/EULAR antiphospholipid syndromeclassification criteria".Created with NotebookLM.Intro and outro music created with Suno.Link to the paper: http:// dx.doi. org/ 10. 1136/ ard- 2023-224609
No comment yet.