Your new post is loading...

|
Scooped by
Gilbert C FAURE
December 11, 2025 4:06 AM
|
Autoantibody-triggered podocyte membrane budding drives autoimmune kidney disease
- Chronic kidney disease affects 1 in 10 people worldwide, with damage to specialized blood filter cells of the kidney, called podocytes, playing a critical role.
- In membranous nephropathy (MN), a major cause of nephrotic syndrome, circulating autoantibodies attack proteins on podocyte foot processes (FPs), damaging the kidney’s filtration barrier.
- This study shows that these autoantibodies trigger the formation of antigen-autoantibody aggregates on the podocyte FP plasma membrane.
- These aggregates bud off as stalked vesicles, termed autoimmunoglobulin-triggered extracellular vesicles (AIT-EVs), which are released into the urine.
- AIT-EVs carry disease-causing autoantibodies, their target antigens, essential FP proteins, and disease-associated stressors representing a mechanism for removing immune complexes (ICs) and waste. However, their excessive release leads to podocyte dysfunction and injury.
- The discovery of AIT-EVs bridges the gap between circulating autoantibodies and podocyte responses and can be harnessed in MN patients.
- Clinically, analysis of urinary AIT-EVs represents a novel non-invasive diagnostic tool to sensitively detect and monitor renal autoimmune activity in patients.
https://lnkd.in/ePD3_xDA
#autoimmunity #kidney #kidneydisease #biomarkers
|
|
Scooped by
Gilbert C FAURE
November 29, 2024 10:33 AM
|
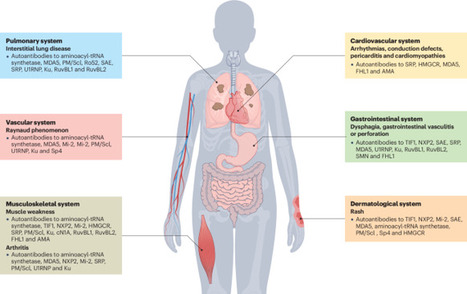
Myositis-specific autoantibodies (MSAs) have become pivotal biomarkers for idiopathic inflammatory myopathies and have revolutionized understanding of the heterogeneous disease spectrum that affects both adults and children. The discovery and characterization of MSAs have substantially enhanced patient stratification based on clinical phenotype, thereby facilitating more precise diagnosis and ultimately improving management strategies. Advances in immunoassay technologies in the past 20 years have further propelled the field forward, enabling the detection of a growing repertoire of autoantibodies with high specificity and sensitivity; however, evolving research over the past decade has revealed that even within antibody-defined subsets, considerable clinical diversity exists, suggesting a broader spectrum of disease manifestations than previously acknowledged. Challenges persist, particularly among patients who are seronegative, where the failure to identify certain rare MSAs stems from the use of diverse detection methodologies and inadequate consensus-guided standardization and validation protocols. Bridging these diagnostic gaps is crucial for optimizing patient care and refining prognostic stratification in idiopathic inflammatory myopathies. This Review provides an update on autoantibodies associated with idiopathic inflammatory myopathies in both adults and children. The authors also discuss methods of autoantibody detection and the advantages and limitations of each technique.
|
|
Scooped by
Gilbert C FAURE
October 1, 2023 5:30 AM
|
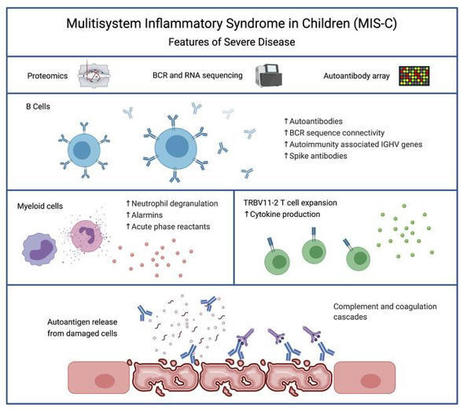
Severe MIS-C patients exhibit hyperinflammation and cytokine storm. Our MIS-C cohort was composed of 7 patients with mild MIS-C and 20 patients with severe MIS-C (Table 1). MIS-C diagnosis was performed according to CDC guidelines, and patients who required treatment in the pediatric ICU were defined as severe MIS-C patients. We first compared circulating biomarkers of inflammation and heart failure, and cytokine profiles of severe and mild MIS-C patients. Both mild and severe MIS-C patients showed elevated levels of C-reactive protein (CRP), ferritin, fibrinogen, pro–B-type natriuretic peptide (proBNP), aspartate transaminase, alanine transaminase (ALT), D-dimers, and creatine compared with normal reference ranges (Supplemental Figure 1A; supplemental material available online with this article; https://doi.org/10.1172/JCI151520DS1). Severe MIS-C cases showed significantly higher levels of ferritin, proBNP, D-dimers, and creatine, and a trend toward increased levels of CRP, ALT, and fibrinogen compared with mild MIS-C patients (Supplemental Figure 1A). Table 1Patient demographics We next assessed and compared the circulating cytokine profiles of healthy controls, mild MIS-C, and severe MIS-C patients. MIS-C patients showed increased levels of IFN-γ, TNF-α, IL-6, IL-8, IL-10, and IL-1β, with severely ill patients showing stronger dysregulation than those with milder courses (Supplemental Figure 1B). Since some of the clinical symptoms of MIS-C, such as erythematous rashes, conjunctivitis, and inflammatory changes in the oral mucosa are suggestive of Kawasaki disease (KD), we also characterized the cytokine profiles of 7 KD patients who were recruited before the COVID-19 pandemic (Supplemental Figure 1B). KD diagnosis was performed according to the established American Heart Association guidelines (20). Except for IL-8, which appeared less dysregulated in KD, the overall cytokine pattern was similar in MIS-C and KD (Supplemental Figure 1B). Proteomic analysis identifies a highly inflammatory proteomics profile in MIS-C. To assist in the elucidation of the pathogenesis of MIS-C and to identify proteins associated with the severe form of the disease, we performed proteomics analysis of serum or plasma samples from our study cohort (Figure 1A). We collected serum from healthy children (n = 20), mild MIS-C patients (non-ICU, n = 5), and severe MIS-C patients who required ICU treatment (n = 20). We also included analysis of plasma samples from KD patients that were collected prior to the pandemic (n = 7; Table 1). Healthy adult serum (n = 4) was used for reference range quality control. To obtain a high resolution of protein expression we performed discovery proteomics analysis on native and depleted (top 14 most abundant proteins) serum or plasma samples (ref. 21, Figure 1B, and Supplemental Figure 2A). Both data sets were integrated at the transition, peptide, and protein level. As plasma was used for KD samples, clotting factors (Supplemental Figure 2B) were removed from the data set for any downstream analysis involving the KD group. Principal component analysis (PCA) (Figure 1B) and hierarchical clustering (Figure 1C) showed that the MIS-C and KD proteomes clustered separately from healthy controls. Similar to our cytokine analysis, MIS-C and KD showed similar protein profiles, indicating that shared pathological pathways likely exist between the diseases (Figure 1, B and C). The major proteins contributing to dimension 1 of the PCA plot, which separates disease samples (MIS-C and KD) from the healthy controls, included inflammatory markers and alarmins such as SERPINA3, CRP, haptoglobin (HP)/zonulin, LPS-binding protein (LBP), CD14, S100A8 and S100A9 (Figure 1B and Supplemental 2C). Figure 1Proteomic profiling of MIS-C cases. (A) Experimental design of native and depleted serum proteomics profiling of healthy controls (n = 20), mild MIS-C (n = 5), severe MIS-C (n = 20), and KD (n = 7) patients. (B) PCA of proteomics data and top proteins contributing to dimension 1 of the PCA plot. (C) Heatmap and hierarchical clustering of proteomics expression data revealed 3 protein sets (C1, C2, and C3) driving separation between 3 clades of MIS-C and KD patients (sample clusters S1, S2, and S3). (D) ClueGO ontology analysis via PINE (Protein Interaction Network Extractor) for visualization of pathways and functional categories significantly enriched within each of the 3 protein sets (C1, C2, and C3) revealed by hierarchical clustering analysis in panel C. The x axis denotes the negative decimal logarithm of the FDR of enrichment (term P value corrected with Bonferroni’s test). Size of the node denotes number of proteins within each term. Protein Interaction Network Extractor (PINE; ref. 22) analysis of differentially expressed proteins between the groups revealed an enrichment of protein networks involved in multiple inflammatory processes and pathways, including neutrophil degranulation, platelet activation, complement and coagulation cascades, phagocytosis, angiogenesis, acute-phase responses, oxidative stress, metabolism, and cell migration and adhesion (Supplemental Figure 2D). Hierarchical clustering analysis led to the identification of 3 main clusters of disease samples, sample clusters S1, S2, and S3 (Figure 1C). A large set of proteins (protein cluster 1, C1) were upregulated in both KD and MIS-C, most strikingly in sample clusters S1 and S2, compared with healthy controls (Figure 1C). Functional annotation analysis revealed that this cluster was enriched with proteins involved in leukocyte-mediated immunity, neutrophil-mediated immunity, humoral immune responses, and extracellular matrix (Figure 1D and Supplemental Figure 3A). Functional annotation analyses revealed that a second set of proteins (C2) enriched in sample cluster S2 included proteins associated with platelet activation and aggregation, myofibrils, and smooth muscle cell contraction (Figure 1D and Supplemental Figure 3B). Proteins in C3 were upregulated exclusively in sample cluster S1, mostly severe MIS-C patients, and included heavy and light chain immunoglobins (Igs), as well as components of the classical complement cascade, C1qA, C1qB, and C1qC (Figure 1D and Supplemental Figure 3C). Proteomic characterization reveals biomarkers that differentiate severe MIS-C from mild disease and from KD. We next sought to identify proteins and associated pathways upregulated or downregulated in severe MIS-C and mild MIS-C patients compared with healthy controls (Figure 2 and Supplemental Figure 4). We identified 244 proteins increased and 135 proteins decreased in quantity in severe MIS-C compared with healthy controls (top 25 modulated proteins; Figure 2, A and B). Network and pathway analysis of significantly increased (Figure 2, C and D) or decreased (Figure 2, E and F) proteins revealed that humoral immune responses and complement pathways were highly enriched in severe MIS-C, including various Igs and C1q proteins, C1qA, C1qB, and C1qC (Supplemental Figure 5, A and B). The expression of proteins associated with platelet activation and coagulation pathways, including von Willebrand factor (VWF), F5, F9, F11, fibrinogen α and β chains (FGA and FGB), and SERPINF2, was also increased in severe MIS-C compared with healthy controls (Supplemental Figure 5, A and B). Fc receptor signaling, neutrophil-mediated responses, and phagocytosis pathways were also enriched in severe MIS-C. These include FCGR3A (CD16a), IgGFc-binding protein (FCGBP), calprotectin (S100A8 and S100A9), tissue inhibitor of metalloproteinases 1 (TIMP1), SERPINA1, SERPINA3, and acute-phase-reactant leucine-rich α2-glycoprotein 1 (LRG1) (Supplemental Figure 6, A and B, and Supplemental Figure 2C). Proteins involved in VEGF signaling and smooth muscle cell contraction were increased in severe MIS-C, including ICAM1, tropomyosin 4 (TPM4), p21-activated kinase (PAK2), FGA, FGB, and filamin B (FLNB) (Supplemental Figure 6C and Supplemental Figure 5B). As these proteins are highly expressed in vascular smooth muscle cells, their presence in the serum may reflect release from damaged blood vessels. Overall, the proteins and pathways increased in severe MIS-C indicate Ig-mediated inflammatory responses and endothelial dysfunction. Figure 2Characterization of severe MIS-C. Protein expression was compared between severe MIS-C (n = 20) and healthy controls (n = 20). Proteins were considered significantly changed when FDR was less than 0.05, as determined by mapDIA statistical software for protein differential expression using MS/MS fragment-level quantitative data. (A) Top proteins enhanced in severe MIS-C, ranked by fold change. (B) Top proteins reduced in severe MIS-C, ranked by fold change. (C) ClueGO Ontology analysis via PINE visualized a network of pathways and functional annotation terms enriched in a set of proteins significantly increased in severe MIS-C population when compared with healthy controls. (D) Selected pathways and functional annotation terms from PINE analysis of proteins increased in severe MIS-C when compared with healthy controls. (E) Network plots visualized via PINE analysis of proteins reduced in severe MIS-C group when compared with healthy controls. (F) Selected pathways and functional annotation terms from protein functional enrichment analysis of proteins reduced in severe MIS-C group when compared with healthy controls. Networks of proteins reduced in severe MIS-C revealed pathways involved in regulation of lipid transport, lipid metabolic processes, and lipoprotein clearance, including APOA1, APOA2, APOA4, APOC1, and APOM (Figure 2, E and F, and Supplemental Figure 6D). Some components of clotting and coagulation pathways were also downregulated in severe MIS-C compared with healthy controls (Figure 2, E and F, and Supplemental Figure 5A). Furthermore, there was downregulation of proteins involved in the regulation of body fluids and relaxation of cardiac muscle, including CAMK2D, which aligns with the increase in proBNP and the cardiovascular manifestations and shock observed in MIS-C (Figure 2, E and F, and Supplemental Figure 6E). To determine factors contributing to severe disease, we compared severe MIS-C with mild MIS-C (Figure 3). We found that the expression of 75 proteins was significantly enhanced in severe MIS-C, while 61 proteins were significantly reduced when compared with mild MIS-C. Selected proteins differentially expressed between MIS-C severity groups are presented in Figure 3A. Compared with mild MIS-C, severe MIS-C patients had increased levels of proteins involved in pathways that included proteolysis, classical complement cascade, coagulation, acute-phase response, and inflammation (Figure 3, A and B, and Supplemental Figure 7). These included CRP, S100A9, SAA1, SAA2, STAT3, FCGR3A, LBP, CD163, ORM1, SERPINA1, SERPINA3, TIMP1, TLN-1, VWF, various Igs, and components of the C1 complex of the complement system (C1qA, C1qB, and C1qC) (Supplemental Figures 2C, 5B, 6B, and 7). In contrast, severe MIS-C patients had reduced expression of proteins in pathways, including negative regulators of peptidase activity, extracellular matrix proteoglycans, complement and coagulation cascades, and high-density lipid protein remodeling (Supplemental Figure 8, A and B). Figure 3Proteins distinguishing severe MIS-C from mild disease and KD. Protein differential expression analysis was performed between severe MIS-C (n = 20) and mild MIS-C (n = 5) groups. Proteins were considered significantly changed when FDR was less than 0.05 as calculated by mapDIA statistical software. (A) Bar graphs show top increased and top decreased proteins in severe MIS-C when compared with mild, ranked by fold change and excluding Igs. (B) Selected pathways and functional annotation terms from protein functional enrichment analysis facilitated by PINE software using proteins increased (top panel) and decreased (bottom panel) in severe MIS-C compared with mild MIS-C. (C) Venn diagram of proteins differentially regulated between severe MIS-C, mild MIS-C, and KD. (D) Heatmap of selected proteins distinguishing severe MIS-C from mild MIS-C and KD. (E) Box-and-whisker plots of selected proteins found increased in severe MIS-C compared with mild MIS-C and KD. For improved visualization purposes, box-and-whisker plots show scaled protein expression values. Scaling was performed by mean centering and division by SD of each protein variable. For box-and-whisker plots, the bounds of the boxes represent IQR (Q1 to Q3) and the whiskers represent the nonoutlier minimum and maximum values, 1.5 × IQR. The median values are marked with a horizontal line in the boxes, and outliers are marked with black centered points outside the whiskers. Statistical analysis was calculated by mapDIA statistical software for protein differential expression using MS/MS fragment-level quantitative data. **P < 0.01, ***P < 0.001. NS, not significant. Next, we aimed to determine which proteins distinguished severe MIS-C from mild MIS-C and KD (Figure 3, C–E), excluding clotting factors. Among proteins of interest, ferritin light chain (FTL) was highly expressed in severe MIS-C, as were proteins involved in Ig-mediated immune activation, including FCGR3A and components of the classical complement cascade, C1qA, C1qB, and C1qC (Figure 3E). Proteins that have been associated with heart failure were also identified as enhanced in severe MIS-C, including tenascin C (TNC; ref. 23) and QSOX1 (24) (Figure 3, D and E). Proteins with reduced expression in severe MIS-C were also identified and included histidine-rich glycoprotein (HRG), sex hormone–binding globulin (SHBG), and complement component 7 (C7) (Figure 3, D and E). Overall, the proteomic profiles of MIS-C and KD were similar, indicating shared pathogenic pathways. However, distinguishing proteins indicate MIS-C may be mediated more so by immune complexes, and have greater heart muscle involvement than KD. These proteins have potential to act as biomarkers to distinguish severe MIS-C from mild MIS-C or KD. RNA-seq reveals a subgroup of hyperinflammatory MIS-C patients with enhanced myeloid responses, TRBV11-2 expansion, and SARS-CoV-2–specific antibodies. We performed RNA-seq analysis using RNA isolated from whole blood of febrile controls (n = 13), mild MIS-C (n = 4), and severe MIS-C patients (n = 8; Figure 4A). Hierarchical clustering and PCA demonstrated 2 subsets of MIS-C patients (Figure 4B and Supplemental Figure 9A). The first subset of MIS-C patients clustered separately (cluster 1) from febrile controls, while the other overlapped with febrile controls (cluster 2; Figure 4B). Cluster 1 consisted predominantly of severe MIS-C patients (5 severe and 1 mild), while cluster 2 contained an equal number of severe and mild MIS-C patients (3 severe and 3 mild; Figure 4B). Analyses revealed a large set of genes differentially expressed between the 2 MIS-C clusters (2895 genes upregulated and 2921 genes downregulated in cluster 1, FDR < 0.05, fold change [FC] > 2). The top 20 genes up- and downregulated in cluster 1 are presented in Figure 4C. Functional annotation analysis revealed that genes with increased expression in cluster 1 were involved in macrophage activation, neutrophil chemotaxis, innate signaling pathways, T cell activation, cytokine signaling, complement pathways, response to wounding, and apoptosis (Figure 4D and Supplemental Figure 9B). Cell deconvolution analysis identified increased relative abundance of neutrophils in cluster 1 MIS-C samples (Figure 4E). Genes with reduced expression in cluster 1 were involved in adaptive immune responses, as well as ribonucleoprotein complexes and RNA processing (Figure 4, C and D, and Supplemental Figure 9C). In line with these findings, cell deconvolution analysis revealed a reduction in adaptive immune cells in cluster 1, most strikingly a reduction in naive B cells, which may reflect lymphopenia that is observed in MIS-C (Figure 4E). Figure 4RNA-seq analysis of MIS-C. RNA-seq was performed using whole-blood RNA isolated from febrile controls (n = 13), mild MIS-C (n = 4), and severe MIS-C (n = 8) patients. (A) Experimental design of RNA-seq analysis and patient groups. (B) PCA of RNA-seq profiles. (C) Genes up- or downregulated in cluster 1 vs. cluster 2 MIS-C patients (FDR < 0.05). (D) Selected pathways and functional annotation terms from gene functional enrichment analysis performed with PINE software using significantly up- and downregulated (FDR < 0.01, log2[FC] > 1.5 and < –1.25) genes in cluster 1 vs. cluster 2 MIS-C patients. (E) Cell deconvolution analysis of RNA-seq data by CIBERSORT. (F) Top proteins increased in cluster 1 vs. cluster 2, based on proteomics data. (G) Enriched pathways and functional annotation terms based on protein expression changes significantly (FDR < 0.05) upregulated in cluster 1 with respect to cluster 2. (H) TRBV11-2 expansion of RNA-seq samples (17). (I) IgG titers against Spike protein receptor binding domain (RBD). Data are presented as mean ± SEM. Statistical significance was determined by Mann-Whitney test (H and I). We next compared the proteomes of cluster 1 with cluster 2 patients (Figure 4, F and G, and Supplemental Figure 9, D and E). Cluster 1, which was primarily severe MIS-C cases, was characterized by significantly enhanced expression of inflammatory markers, including CRP, SAA1, and SAA2, as well as proteins associated with neutrophil activation, including myeloperoxidase (MPO), lipocalin 2 (LCN2), cathepsin B (CATB), ICAM1, granulin (GRN), and LBP (Figure 4F). In line with this, pathway analysis of protein expression in cluster 1 identified an enrichment of neutrophil-mediated responses (Figure 4G). Analysis of proteins and pathways downregulated in cluster 1 identified lipoprotein-particle proteins, including APOA1 and APOA4 (Supplemental Figure 9, D and E), which were also observed as downregulated in severe MIS-C compared with mild MIS-C or healthy controls (Supplemental Figure 6D). Interestingly, we found a reduction in complement and coagulation cascade protein pathways in cluster 1 compared with cluster 2 (Supplemental Figure 9, D and E). Since complement pathways were identified as increased in cluster 1 by transcriptomics (Figure 4D), we analyzed the correlation between the direction of protein expression and gene expression changes when comparing cluster 1 with cluster 2 (Supplemental Figure 10A). We did not find a significant correlation between protein and gene expression changes, likely because for a subset, the gene expression and protein expression changes occurred in opposite directions (increased by gene expression yet decreased by protein expression in cluster 1). Functional annotation analysis showed that these genes/proteins, including C5, C3, C4BP, HP, F12, F5, and PF4, were enriched in complement and coagulation cascades (Supplemental Figure 10B). The increased gene expression but decreased protein expression of this subset may indicate excessive activation and consumption of these molecules. Interestingly, a reduction in C3 protein has also been observed in COVID-19 nonsurvivors compared with survivors (25). We previously identified TRBV11-2 skewing in MIS-C patients, which correlated with disease severity and cytokine storm (17). As this study utilizes the same patient samples, we compared TRBV11-2 usage between the 2 MIS-C clusters identified by RNA-seq analysis (Figure 4B). The patients with TRBV11-2 expansion were restricted to cluster 1, which contained primarily severe MIS-C patients (Figure 4H). We also examined titers of antibodies against Spike protein between the 2 groups and found that cluster 1 MIS-C patients had higher levels of anti-Spike IgG antibodies than patients in cluster 2 (Figure 4I). This is similar to observations in adult COVID-19 patients, in which increased antibody titers against SARS-CoV-2 are associated with disease severity (26). Overall, these data indicate that the patients in MIS-C cluster 1 exhibited increased inflammatory makers, increased neutrophil responses, reduced lymphocytes, increased SARS-CoV-2 antibodies, and TRBV11-2 T cell expansion. MIS-C autoantibodies are targeted to a diverse set of intracellular autoantigens and are enhanced in MIS-C cluster 1 patients. We next sought to characterize the levels of autoantibodies in our patient cohort and determine how these relate to the hyperinflammatory cluster 1 identified by RNA-seq analysis. Autoantibody analysis was performed using the HuProt array (CDI Labs) with serum from febrile controls (n = 5) and MIS-C patients (n = 11: 3 mild and 8 severe). The MIS-C patient group included 6 samples identified by RNA-seq as belonging to cluster 1, and 5 MIS-C samples from cluster 2 (Figure 5A). Candidate autoantibody targets were identified (P < 0.05, FC > 2) based on differential expression analysis of MIS-C samples, or RNA clusters, compared with febrile controls (Figure 5, B and C). Figure 5Autoantibody analysis of MIS-C. (A) Autoantibody analysis was performed on serum from febrile controls (n = 5) and MIS-C patients (n = 11) using HuProt array. MIS-C samples correspond to RNA cluster 1 (n = 6) and RNA cluster 2 (n = 5) identified in Figure 4. (B) Venn diagram of candidate IgG autoantibody targets in MIS-C and RNA clusters (P < 0.05, FC > 2). (C) Venn diagram of candidate IgA autoantibody targets in MIS-C and RNA clusters (P < 0.05, FC > 2). (D) IgG autoantibody targets identified in MIS-C (n = 11) compared with febrile controls (n = 5). The bar represents log2(FC). Each symbol represents 1 MIS-C patient presented as log2(FC) above the mean of febrile controls. (E) IgA autoantibody targets identified in MIS-C (n = 11) compared with febrile controls (n = 5). The bar represents log2(FC). Each symbol represents 1 MIS-C patient presented as log2(FC) above the mean of febrile controls. (F) IgG autoantibody targets separated based on RNA cluster 1 (n = 6) and RNA cluster 2 (n = 5). Data are presented as log2(FC) above the mean of febrile controls. (G) IgA autoantibody targets separated based on RNA cluster 1 (n = 6) and RNA cluster 2 (n = 5). Data are presented as log2(FC) above the mean of febrile controls. For box-and-whisker plots, the bounds of the boxes represent the interquartile range (IQR, Q1 to Q3) and the whiskers represent the minimum and maximum values. The median values are marked with a horizontal line within the box. *FDR < 0.05 compared with febrile controls. While the majority of IgG autoantibodies that significantly increased in MIS-C compared with febrile controls were targeted to ubiquitously expressed antigens, we identified a number of tissue-specific antigens from the GI tract and cardiovascular, skeletal muscle, and brain tissues, reflecting the systemic nature of MIS-C and the involvement of specific organs in clinical presentation of disease (Figure 5D). GI tract autoantigens included ATPase H+/K+-transporting α subunit (ATP4A), SRY-box 6 (SOX6), family with sequence similarity 84 member A (FAM84A), and RAB11 family interacting protein 1 (RAB11FIP1) (Figure 5D). Cardiovascular autoantigens included PDZ and LIM domain 5 (PDLIM5) and eukaryotic translation initiation factor 1A, Y linked (EIF1AY) (Figure 5D). Skeletal muscle autoantigens included RNA-binding motif protein 38 (RBM38) and skeletal troponin C2 (TNNC2) (Figure 5D). Brain autoantigens included microtubule-associated protein 9 (MAP9) and NSF attachment protein β (NAPB). Interestingly, several antigens highly expressed in neutrophils were identified, including endothelin-converting enzyme 1 (ECE1), SOX6, and RAB11FIP1 (Figure 5D). Autoantibodies were predominantly targeted to intracellular antigens, suggesting they may result from a secondary immune response to cell damage. We identified 3 IgA autoantibodies that were significantly increased in MIS-C compared with febrile controls, namely FAM84A, which is highly expressed in GI tissues, TNNC2, which, as mentioned above is highly expressed in skeletal muscle, and guanylate-binding protein family member 6 (GBP6) (Figure 5E). FAM84A and TNNC2 were significantly increased in RNA cluster 1, but not RNA cluster 2, compared with febrile controls. We next examined how the 2 RNA clusters differed in autoantibody responses (Figure 5, F and G). Overall, patients in RNA cluster 1 had greater autoantibody responses than those in RNA cluster 2 (Figure 5, B and C), with the largest differences identified in IgG autoantibodies against ATP4A, UBE3A, FOXK2, SATB1, and MAOA (Figure 5F), and in IgA autoantibodies against FAM84A (Figure 5G). Overall, our data suggest systemic tissue damage and cell death may contribute to excessive antigenic drive against a diverse set of tissue-specific and ubiquitously expressed antigens. The enhanced levels of autoantibodies in RNA cluster 1 link autoantibody development to hyperinflammation, myeloid cell activation, lymphopenia, increased SARS-CoV-2 antibodies, and TRBV11-2 T cell expansion. Patients belonging to RNA cluster 1 show BCR repertoires with highly connected networks of CDR3 sequences. To further study B cell repertoire metrics and antigenic selection in our cohort, we performed BCR-seq on extracted RNA from blood samples of patients with mild (n = 4) or severe (n = 8) MIS-C, and age-matched febrile control patients (n = 15). We found a trend toward higher richness and a lower fraction of antigen-experienced B cells with somatic hypermutation in MIS-C patients than in febrile control patients. However, repertoire richness was distributed quite heterogeneously across patients, and the high richness pattern appeared to apply more to the small group of individuals with mild MIS-C without reaching statistical significance due to the small group size (Supplemental Figure 11). These distinct immune metrics were observable in all Ig chains — heavy chain (IGH) as well as κ (IGK) and λ (IGL) light chains — arguing in favor of the specificity of this finding. These findings were also consistent with the previously reported increased richness in T cell receptor repertoires in patients with mild MIS-C (17). Since our RNA-seq analysis revealed 2 clusters of MIS-C patients, with cluster 1 correlated with high levels of SARS-CoV-2 antibodies and autoantibodies as well as TRBV11-2 T cell expansion, we subdivided our MIS-C cohort into these clusters for the following analyses of BCR repertoires. Our aim was to determine imprints of (auto)antigenic selection or other B cell repertoire features that discriminate cluster 1 from cluster 2. MIS-C patients from cluster 1 showed lower B cell richness than febrile control patients and cluster 2 (Figure 6A), consistent with the contracted B cell compartment suggested by the transcriptome analysis of this cluster. Interestingly, although no differences in the level of somatic hypermutation were detectable between MIS-C patients of RNA cluster 1 and 2, the BCRs of all cluster 1 patients converged toward networks of highly similar CDR3 amino acid sequences (Figure 6B). The degree of connected sequences was significantly enriched in cluster 1 repertoires and comprised up to 99% of BCR clones when Levenshtein distances of 1 and 3 were used for network construction (Figure 6B). Thus, MIS-C patients in cluster 1 showed strong imprints of antigenic selection in their B cell repertoires. Figure 6B cell repertoire metrics, connectivity characteristics, and skewing of IGHV-J usage of MIS-C patients in RNA clusters 1 and 2. (A) Richness and somatic hypermutation of productive IGH repertoires of MIS-C patients of RNA cluster 1 (n = 5) and RNA cluster 2 (n = 6) compared with age-matched febrile control patients (n = 15). Bars indicate mean ± SD. Statistical analysis: ordinary 1-way ANOVA for global analysis and unpaired Student’s t test for paired comparison. (B) Petri dish plots of IGH repertoire networks of MIS-C patients of RNA cluster 1 and 2. A sample of 1000 unique CDR3 amino acid clones per repertoire were subjected to imNet network analysis (75). Petri dish plots are shown for Levenshtein distance 1. Percentages of connected sequences of MIS-C patients of RNA cluster 1 and 2 obtained from networks with Levenshtein distance 1 and 3 are shown as bar plots. Bars indicate mean ± SD. Statistical analysis: unpaired Student’s t test. (C) PCA of differential IGHV-J gene usage in MIS-C patients of RNA cluster 1 (n = 5) versus cluster 2 (n = 6) versus age-matched febrile controls (n = 15). Statistical analysis: Pillai-Bartlett test of MANOVA of all principal components. Frequencies per repertoire of the 10 most skewed IGHV genes in MIS-C and febrile control patients are shown as box-and-whisker plots. The boxes extend from the 25th to 75th percentiles, whiskers from minimum to maximum, and the line within the box indicates the median. (D) BAFF expression in MIS-C cluster 1 and cluster 2, using the RNA-seq data in Figure 5. Data are presented as mean ± SEM. (E) IL-6 and IL-10 levels in serum of MIS-C cluster 1 and cluster 2 patients, using cytokine data from Supplemental Figure 1. Data are presented as mean ± SEM. Statistical analysis: Mann-Whitney test (D and E). **P < 0.01. Higher frequency of autoantibody-associated IGHV genes IGHV4-34 and IGHV4-39 in MIS-C. The higher autoantibody levels in RNA cluster 1 patients prompted us to investigate whether specific IGHV sequences known to be involved in the formation of autoantibodies are overrepresented in this cluster. To globally investigate IGHV-J gene usage in RNA cluster 1 versus cluster 2, we studied the repertoires by PCA. This revealed a significant skewing of IGHV-J gene usage between cluster 1 and cluster 2 (Figure 6C). Among the genes preferentially used in B cell repertoires of patients from RNA cluster 1 was IGHV4-39, which has been previously reported to be used by autoreactive lymphocytes in multiple sclerosis (27, 28). Moreover, IGHV4-34, a gene extensively studied for its usage in autoreactive B cells (29), was preferentially used in B cells from MIS-C patients in general, with a numerically higher expansion in cluster 1 repertoires. Furthermore, IGHV1-69, which is preferentially used in autoreactive B cells (30, 31), was also overrepresented in cluster 1 (Figure 6C). We next asked which factors drive B lineage repertoires in MIS-C patients toward autoreactivity. The majority of patients from RNA cluster 1, where imprints of antigenic selection beyond SARS-CoV-2 reactivity were most obvious, showed superantigenic T cell interactions, which could be one driver promoting autoreactive B lymphocytes. The RNA transcriptomics data pointed to increased BAFF expression in RNA cluster 1, and cytokine analysis pointed to increased IL-6 and IL-10 levels in the serum (Figure 6, D and E). These results indicated that B cell dysregulation in MIS-C patients from RNA cluster 1 may not only be driven by superantigenic T cell interactions, but also by soluble factors derived from the pronounced myeloid/innate cell compartment in these patients.
|
|
Scooped by
Gilbert C FAURE
February 17, 2023 3:24 AM
|
Background: To assess the serum autoantibody profile in patients with dry and exudative age-related macular degeneration compared with healthy volunteers to detect potential biomarkers, e.g., markers for progression of the disease.
|
|
Scooped by
Gilbert C FAURE
April 19, 2022 3:19 AM
|
Background SLE is a complex disease characterized by autoimmunity towards apoptotic cells, excessive amounts of circulating immune complexes and complement activation. Decreased platelet size has been observed in SLE and their non-hemostatic functions may play an active role in the disease.
|
|
Scooped by
Gilbert C FAURE
February 17, 2022 2:23 PM
|
BackgroundThat Epstein–Barr virus (EBV) infection is associated with systemic lupus erythematosus (SLE) is established. The challenge is to explain mechanistic roles EBV has in SLE pathogenesis. Previous studies identify four examples of autoantibody cross-reactions between SLE autoantigens and...
|
|
Scooped by
Gilbert C FAURE
October 8, 2021 1:20 PM
|
Pemphigus encompasses a heterogeneous group of autoimmune blistering diseases, which affect both mucous membranes and the skin. The disease usually runs a chronic-relapsing course, with a potentially devastating impact on the patients' quality of life. Pemphigus pathogenesis is related to IgG autoantibodies targeting various adhesion molecules in the epidermis, including desmoglein (Dsg) 1 and 3, major components of desmosomes. The pathogenic relevance of such autoantibodies has been largely demonstrated experimentally. IgG autoantibody binding to Dsg results in loss of epidermal keratinocyte adhesion, a phenomenon referred to as acantholysis. This in turn causes intra-epidermal blistering and the clinical appearance of flaccid blisters and erosions at involved sites. Since the advent of glucocorticoids, the overall prognosis of pemphigus has largely improved. However, mortality persists elevated, since long-term use of high dose corticosteroids and adjuvant steroid-sparing immunosuppressants portend a high risk of serious adverse events, especially infections. Recently, rituximab, a chimeric anti CD20 monoclonal antibody which induces B-cell depletion, has been shown to improve patients' survival, as early rituximab use results in higher disease remission rates, long term clinical response and faster prednisone tapering compared to conventional immunosuppressive therapies, leading to its approval as a first line therapy in pemphigus. Other anti B-cell therapies targetin

|
Suggested by
LIGHTING
May 19, 2021 2:08 PM
|
COVID-19 manifests with a wide spectrum of clinical phenotypes that are characterized by exaggerated and misdirected host immune responses1–6. While pathological innate immune activation is well documented in severe disease1, the impact of autoantibodies on disease progression is less defined. Here, we used a high-throughput autoantibody (AAb) discovery technique called Rapid Extracellular Antigen Profiling (REAP)7 to screen a cohort of 194 SARS-CoV-2 infected COVID-19 patients and healthcare workers for autoantibodies against 2,770 extracellular and secreted proteins (the “exoproteome”). We found that COVID-19 patients exhibit dramatic increases in autoantibody reactivities compared to uninfected controls, with a high prevalence of autoantibodies against immunomodulatory proteins including cytokines, chemokines, complement components, and cell surface proteins. We established that these autoantibodies perturb immune function and impair virological control by inhibiting immunoreceptor signaling and by altering peripheral immune cell composition, and found that murine surrogates of these autoantibodies exacerbate disease severity in a mouse model of SARS-CoV-2 infection. Analysis of autoantibodies against tissue-associated antigens revealed associations with specific clinical characteristics and disease severity. In summary, these findings implicate a pathological role for exoproteome-directed autoantibodies in COVID-19 with diverse impacts on immune functionality and associations with clinical outcomes.
|
|
Scooped by
Gilbert C FAURE
April 19, 2021 2:32 PM
|
Ann Arthritis Clin Rheumatol | Volume 2, Issue 2 | Research Article | Open Access Autoantibodies against Autonomic Nerve Receptors in Adolescent Japanese Girls after Immunization with Human Papillomavirus Vaccine Akiyo Hineno1,2, Shu-ichi Ikeda1*, Carmen Scheibenbogen3,4, Harald Heidecke5, Kai Schulze- Forster5, Juliane Junker5, Gabriela Riemekasten6, Ralf Dechend8, Duska Dragun9 and Yehuda Shoenfeld10 1Intractable Disease Care Center, Shinshu University Hospital, Japan 2Department of Medicine (Neurology and Rheumatology), Shinshu University School of Medicine, Japan 3Department of Medicine, Institute for Medical Immunology, Germany 4Berlin-Brandenburg Center for Regenerative Therapies (BCRT), Germany 5Cell Trend GmbH, Germany 6Department of Rheumatology, Universitätsklinikum Schleswig-Holstein, Germany 7Experimental and Clinical Research Center, Charité-Universitätsmedizin Berlin Germany 8Department of Cardiology and Nephrology, HELIOS-Klinikum, Germany 9Department of Nephrology and Intensive Care Medicine, Charité-Universitätsmedizin Berlin, Germany 10Zabludowicz Center for Autoimmune Diseases, Sheba Medical Center, Israel *Correspondance to: Shu-ichi Ikeda Fulltext PDF Abstract In Japan a significant number of adolescent girls complain of unusual symptoms after human papillomavirus (HPV) vaccination, and these symptoms, composed of orthostatic dysregulation, chronic regional pain syndrome (CRPS) and cognitive dysfunction are considered adverse effects of HPV vaccination. However, a causal link between HPV vaccination and these adverse effects has not been demonstrated. In the present study, we investigated autoantibodies against diverse Gprotein coupled receptors in the serum of girls who complained of possible adverse effects after HPV vaccination. Fifty five girls with HPV vaccination and 57 girls without HPV immunization were enrolled in the study. The serum levels of autoantibodies against the adrenergic receptors α1, α2, β1and β2, muscarinic acetylcholine receptors 1, 2, 3, 4, 5; and endothelin receptor A was significantly elevated in girls with HPV vaccination, compared with those in the controls. The serum levels of these autoantibodies tended to decrease with the time course of the illness, but there was no statistically meaningful association between the clinical symptoms and elevated serum levels of these autoantibodies. This preliminary study provides evidence that post-vaccination abnormal autoimmunity plays an important role in the development of unique symptoms after HPV vaccination. Keywords: Autonomic nerve dysfunction; Autoantibody; Autoimmune disorder; Chronic regional pain syndrome; HPV; Human papilloma vaccination; Chronic regional pain syndrome Citation: Hineno A, Shu-ichi Ikeda, Scheibenbogen C, Heidecke H, Schulze- Forster K, Junker, et al. Autoantibodies against Autonomic Nerve Receptors in Adolescent Japanese Girls after Immunization with Human Papillomavirus Vaccine. Ann Arthritis Clin Rheumatol. 2019; 2(2): 1014.
|
|
Scooped by
Gilbert C FAURE
March 27, 2021 4:14 AM
|
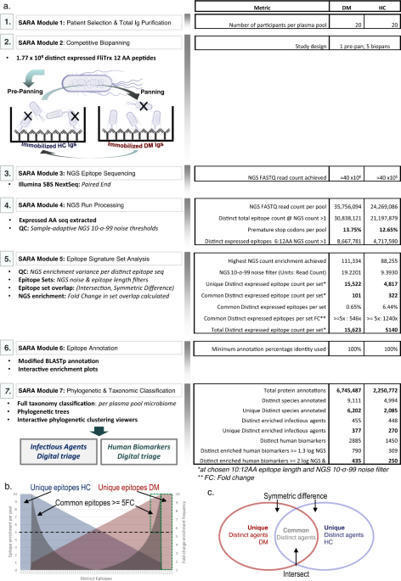
Megremis, Walker at al. identify immunogenic epitopes in dermatomyositis patients. They identify antibodies recognizing a wider diversity of microbial antigens including poxviruses, and autoantibodies recognizing a large portion of the human proteome.
|
|
Scooped by
Gilbert C FAURE
January 20, 2021 4:35 AM
|
A rare kind of antibody, known as anti-glutamic acid decarboxylase (GAD) autoantibody, is found in some patients. The antibody works against the GAD enzyme, which is essential in the formation of gamma aminobutyric acid (GABA), an inhibitory neurotransmitter ...
|
|
Scooped by
Gilbert C FAURE
December 15, 2020 1:52 AM
|
Nowadays, few evidences have shown the possible involvement of autoimmunity in patients affected by Coronavirus disease 2019 (COVID-19). In this study, we elucidate whether severe acute respiratory syndrome (SARS-CoV-2) stimulates autoantibody production and contributes to autoimmunity activation. W …
KEY POINTS
A focused hepatic BCR repertoire is generated during cholestatic liver disease.
Blockade of BAFF reshapes BCR repertoire and reduces autoantibody production.
Depletion of B cells reduces both the hepatic fibrosis and autoantibody production.
Abstract
Defects in biliary transport proteins, MDR3 in humans and Mdr2 in mice, can lead to a spectrum of cholestatic liver disorders. Although B cell disorders and the aberrant Ab production are the leading extrahepatic manifestations of cholestatic liver diseases, the mechanism underlying this phenomenon is incompletely understood. Using mice with deficiency of Mdr2 that progressively develop cholestatic liver disease, we investigated the contributions of BAFF to aberrant IgG autoantibody production and hepatic fibrosis. In Mdr2−/− mice, hepatic B lymphocytes constitutively produced IgG during fibrosis progression, which correlated with elevated serum levels of BAFF, antinuclear Abs (ANA) and immune complexes. The elevated BAFF and ANA titers were also detected in human patients with primary sclerosing cholangitis and hepatobiliary cholangiopathies. Consistent with the higher BAFF levels, liver-specific selection of the focused BCR IgH repertoire was found on hepatic B cells in Mdr2−/− mice. Interestingly, the administration of anti-BAFF mAb in Mdr2−/− mice altered the BCR repertoire on hepatic B lymphocytes and resulted in reduced ANA and immune complex titers. However, anti-BAFF treatment did not attenuate hepatic fibrosis as measured by collagen deposition, hepatic expressions of collagen-1a, α-smooth muscle actin, and mononuclear cell infiltration (CD11b+ Ly-6chi monocytes and CD11b+ Gr1+ neutrophils). Importantly, depletion of B cells by anti-CD20 mAb reduced both hepatic fibrosis and serum levels of ANA and immune complexes. Our findings implicate B cells as the potential therapeutic targets for hepatic fibrosis and targeting BAFF specifically for attenuating the autoantibody production associated with cholestatic liver disease.
Via Krishan Maggon
|
|
|
Scooped by
Gilbert C FAURE
June 12, 2025 11:13 AM
|
Great review from Aurore Collet & Sylvain Dubuquoi from our INFINITE - Lille Institute for Translational Research in Inflammation team on "Autoreactive #Bcells in autoimmune diseases: Mechanisms, functions and clinical implications" !
Highlights :
• Autoreactive B cells drive key mechanisms in autoimmune diseases pathophysiology.
• Autoreactive B cells identification is allowed by ELISpot and flow cytometry.
• Autoreactive B cells features are highly heterogeneous between autoimmune diseases.
• Autoreactive B cells fuel autoimmunity beyond autoantibody production.
• New therapeutic approaches are developed to specifically target autoreactive B cells.
You can hace access to the full article here : https://lnkd.in/eV49cS5j
Recherche - Université de Lille UFR3S - Université de Lille CHU de Lille Inserm Nord Ouest CPER ResistOmics Vincent Sobanski
|
|
Scooped by
Gilbert C FAURE
April 15, 2024 4:49 AM
|
Article Text Article menu PDF Recent advances in basic science Coeliac disease: the paradox of diagnosing a food hypersensitivity disorder with autoantibodies http://orcid.org/0000-0001-9231-643XM Fleur du Pre1,2, http://orcid.org/0000-0002-3292-1766Rasmus Iversen1,2, http://orcid.org/0000-0001-8860-704XLudvig M Sollid1,2 Norwegian Coeliac Disease Research Centre, Institute of Clinical Medicine, University of Oslo, Oslo, Norway Department of Immunology, Oslo University Hosptial - Rikshospitalet, Oslo, Norway Correspondence to Dr Ludvig M Sollid, Department of Immunology, Oslo University Hospital - Rikshospitalet, Oslo, Norway; l.m.sollid{at}medisin.uio.no AbstractSerum antibodies to the autoantigen transglutaminase 2 (TG2) are increasingly harnessed to diagnose coeliac disease. Diagnostic guidelines for children give recommendation for a no-biopsy-based diagnosis through detection of high amounts of IgA anti-TG2 antibodies in serum with confirmation of positivity in a separate blood sample by characteristic autoantibody-staining of tissue. While measurement of IgA anti-TG2 also is important in the diagnostic workup of adults, the adult guidelines still mandate examination of gut biopsies. This requirement might well change in the future, as might the necessity for confirming autoantibody positivity by tissue staining. The key role of autoantibody serology for diagnosis of coeliac disease is paradoxical. Coeliac disease was considered, and still can be considered, a food intolerance disorder where autoantibodies at face value are out of place. The immunological mechanisms underlying the formation of autoantibodies in response to gluten exposure have been dissected. This review presents the current insights demonstrating that the autoantibodies in coeliac disease are intimately integrated in the maladapted immune response to gluten. https://doi.org/10.1136/gutjnl-2023-331595 Statistics from Altmetric.com Request Permissions If you wish to reuse any or all of this article please use the link below which will take you to the Copyright Clearance Center’s RightsLink service. You will be able to get a quick price and instant permission to reuse the content in many different ways. View Full Text FootnotesContributors MFdP wrote the review; RI wrote the review; LMS conceived and wrote the review and made the figures.Funding This work is funded by grants from Stiftelsen KG Jebsen (project SKGJ- MED-017), the University of Oslo World-leading research program on human immunology (WL-IMMUNOLOGY), the Research Council of Norway (projects 333380, 324302, 295844, 287234) and the South-Eastern Norway Regional Health Authority (projects 2016113, 2018068, 2020027, 2023075).Competing interests LMS has been a consultant during the last 3 years for BMS, GSK, Mozart Therapeutics, Ono Pharmaceutical, Precigen ActoBio, Sanofi, SQZ Biotech, Takeda and Topas Therapeutics. The other authors declare no competing interests.Provenance and peer review Commissioned; externally peer reviewed. Read the full text or download the PDF: Subscribe Log in
|
|
Scooped by
Gilbert C FAURE
June 17, 2023 5:43 AM
|
High-throughput MOG CDC and ADCP assays. We developed effector function assays modeled on flow cytometry cell-based assays (CBA) using live human embryonic kidney 293T (HEK) cells. The cells were transiently transfected to induce expression of full-length human MOG-GFP in its native conformation. Approximately 50%–60% of the HEK cells expressed MOG following transfection, providing the opportunity to observe effects on both MOG+ and MOG– cells. The assays involved incubation of antibodies with the transfected HEK cells to allow for binding. Then, normal human serum (NHS), as a source of human complement, or THP-1 macrophages were added (Figure 1A). In the CDC assay, we observed marked membrane attack complex (MAC) formation and death of MOG+ cells (using a live/dead stain) in the presence of a MOG mAb (subclass of all mAbs is IgG1 unless otherwise specified) but not a control acetylcholine receptor (AChR) mAb (Figure 1, B and C). In the presence of the MOG mAb, the macrophages phagocytose MOG+ cells, as indicated by GFP in the macrophages (Figure 1D). Moreover, the frequency of MOG+ cells out of the total HEK cell population was diminished, demonstrating their elimination (Figure 1E). MAC deposition and death of MOG+ cells, but not MOG– cells, further confirmed the MOG specificity of the CDC assay (Figure 1, F and G). Figure 1MOG IgG1 mAb induces CDC and ADCP of live MOG-expressing cells in vitro. (A) Schematic of CDC and ADCP assays utilizing live HEK cells partially transfected with full-length human MOG-GFP, incubated with 1 μg/mL MOG or control AChR mAbs, followed by the addition of NHS for CDC or macrophages for ADCP induction. MAC formation and cell death for CDC and phagocytosis and loss of MOG+ cells for ADCP were quantified by flow cytometry. (B and C) Contour plots depict (B) MAC formation and (C) death of HEK cells based on MOG expression upon incubation with MOG versus AChR mAbs in the CDC assay. (D and E) Macrophage phagocytosis of MOG+ cells is shown by (D) dot plots depicting the frequency of GFP+ macrophages, and (E) histograms of MOG+ cells out of the total HEK cell population, upon incubation with MOG versus AChR mAbs in the ADCP assay. (F and G) Histograms show (F) MAC formation and (G) death of MOG– versus MOG+ HEK cells upon incubation with MOG versus AChR mAbs in the CDC assay. All graphs are representative. Each experiment was performed at least 3 times in duplicate. Frequencies of indicated gates depicted on plots. MOG IgG1 and IgG3 subclass autoantibodies induce CDC, while all IgG subclasses are capable of ADCP. While all MOG-IgG+ patients harbor MOG IgG1 antibodies, MOG IgG2, IgG3, and IgG4 antibodies have also been detected in some patients (38, 39). Considering that antibody Fc mediates effector functions, we were curious about the differential ability of the 4 IgG subclasses to mediate damage to MOG-expressing cells. Thus, we generated recombinant MOG mAbs with varied Fc by subcloning the variable region of the MOG mAb into IgG2, IgG3, and IgG4 subclass expression vectors as well as an IgG1 Fc mutant (FcMt) vector that cannot induce CDC or ADCC (40). We expressed and purified these mAbs and validated IgG subclass expression using sandwich ELISAs (Figure 2A). Then, we confirmed binding to MOG in a CBA. Binding was calculated as the difference (Δ) in mean fluorescence intensity (MFI) of IgG on MOG+ cells minus that of MOG– cells (ΔMFI = MFIMOG+ – MFIMOG–), in order to eliminate the contribution of nonspecific IgG binding to HEK cells. When we performed the CBA with serial dilutions of the mAbs, all 5 MOG mAbs exhibited similar binding to MOG, while the AChR mAb did not (Figure 2B). As expected, the CDC assay showed that IgG1 and IgG3 MOG mAbs were capable of inducing CDC, both MAC deposition and death, of MOG-expressing cells, while MOG IgG2, IgG4, FcMt mAbs, and the AChR mAb were not (Figure 2, C and D). CDC induction by MOG IgG1 and IgG3 was specific for MOG; they did not induce MAC deposition or cell death of MOG– cells (Figure 2, E and F). However, all 5 mAbs induced ADCP, including the FcMt that had abrogated CDC (Figure 2, G and H). Figure 2MOG IgG1 and IgG3 induce CDC while all IgG subclasses induce ADCP. The MOG mAb variable region was subcloned into Fc vectors to recombinantly produce MOG IgG1, IgG2, IgG3, IgG4, and Fc mutant (FcMt) mAbs. (A) Sandwich ELISAs indicate binding of MOG IgG1, IgG2, IgG3, and IgG4 mAbs at 10 μg/mL to commensurate subclass-specific antibodies. Serial dilutions of the 4 MOG subclass mAbs, the MOG FcMt mAb, and the AChR IgG1 mAb were tested for MOG binding and effector functions. (B) MAb binding to MOG was quantified as ΔMFI using a live flow cytometry MOG-CBA. (C–F) MAC formation and death of (C and D) MOG+ and (E and F) MOG– cells in the CDC assay. (G and H) Phagocytosis and MOG+ cells out of total HEK cells in the ADCP assay. Each experiment was performed at least 2 times in duplicate. In B–H, each dot represents the average of duplicates. MOGAD serum induces bimodal CDC and ADCP of live MOG-expressing cells. After confirming the functional performance of the assays using mAbs, we then evaluated the ability of MOGAD patient serum to induce these effector functions. All serum samples were heat inactivated (HI) to abolish activity by endogenous complement proteins, allowing for assessment of autoantibody function only. We assessed CDC in a cohort of 17 clinically diagnosed patients with MOGAD, 11 healthy donors (HD), and autoimmune neurologic disease controls consisting of 15 patients with NMOSD and 13 with myasthenia gravis (MG) (summary cohort characteristics in Table 1, detailed MOGAD patient characteristics in Supplemental Table 1; supplemental material available online with this article; https://doi.org/10.1172/jci.insight.165373DS1). Serum from patients with MOGAD mediated MOG-specific complement deposition, while control serum did not (Figure 3, A and B). Specifically, MOGAD serum induced MAC formation on 25% (mean, normalized to media alone) of the MOG+ population, significantly more than HD (mean 1.2%), MG (mean 1.8%), and NMOSD (mean 0.93%) serum. No difference in the frequency of MAC+MOG– cells between the conditions was observed (Figure 3C), indicating MOG-specific complement deposition; however, we did identify an outlier MOGAD sample that induced MAC formation on 19% of the MOG– cell population. Figure 3MOGAD patient serum induces CDC and ADCP of live MOG-expressing cells while HD, MG, and NMOSD serum do not.(A–L) HI serum from patients with MOGAD (nCDC = 17, nADCP = 19), MG (nCDC = 13, nADCP = 12), and NMOSD (nCDC = 15, nADCP = 10) and HD (nCDC = 11, nADCP = 7) were evaluated for CDC (A–I) and ADCP induction (J–L), normalized to that of media alone (no antibodies or donor serum). (A) Representative histograms depict MAC deposition on MOG+ cells by MOGAD versus HD serum in the CDC assay. (B and C) Comparative MAC formation on (B) MOG+ and (C) MOG– cells by condition. (D) Representative histogram depicts dead MOG+ cells by MOGAD versus HD serum. (E and F) Comparative dead (E) MOG+ and (F) MOG– cells by condition. (G) Resultant frequency of MOG+ cells out of total HEK cells. (H) Comparison of frequency of MAC formation versus death of MOG+ cells per sample. (I) Linear regression of MOGAD samples only (goodness of fit, R2, and significance of nonzero slope, P value, shown on graph). (J) Representative dot plot depicts frequency of phagocytosing macrophages (GFP+) upon incubation with MOGAD versus HD serum in ADCP assay. (K and L) Frequency of (K) phagocytosing macrophages and (L) MOG+ cells out of total HEK cells by condition. Each dot represents a patient (average of duplicates), normalized to media-only control, and bars depict mean ± SEM. Normality test followed by Kruskal-Wallis for B (P = 2.3 × 10⁻⁴), C (P = 0.22), E (P = 5.6 × 10⁻³), and K (P = 1.4 × 10⁻⁵) and 1-way ANOVA for G (P = 1.2 × 10⁻⁵) and L (P = 1.1 × 10⁻⁵). For P ≤ 0.05, multiple comparisons were corrected with FDR of 0.05 and depicted on graph (*P ≤ 0.05, **P ≤ 0.01, ***P ≤ 0.005, #P ≤ 0.0005, ##P ≤ 0.0001, ###P ≤ 0.00005, +P ≤ 0.00001). Table 1Summary clinical and demographic characteristics in CDC and CA assay cohort Similarly, CDC of MOG+ cells was mediated by MOGAD serum but not control serum (Figure 3D). MOGAD serum induced a mean 34% MOG+ cell death, significantly more than HD (mean 12%), MG (mean 10%), or NMOSD (mean 13%) serum (Figure 3E). No difference in CDC was observed among MOG– cells (Figure 3F). However, the same sample that induced MAC formation on MOG– cells caused 46% MOG– cell death. As a result of directed MOG+ cell death by CDC, the frequency of MOG+ cells out of total HEK cells was also reduced by MOGAD serum (Figure 3G). We then evaluated the relationship between MAC formation and cell death (Figure 3H) and found that linear regression on the MOGAD cohort fit a slope of 0.74 with an R2 of 0.74 (P = 8.3 × 10⁻⁶), demonstrating a positive association (Figure 3I). Collectively, we observed heterogeneity in the extent of CDC induced by MOGAD serum, both MAC deposition and cell death. A bimodal distribution for both metrics was observed; for example, 12 of 18 (67%) MOGAD serum samples induced robust MOG+ MAC deposition, while 6 of 18 (33%) induced negligible MOG+ MAC deposition with similar values as the controls. The signal/noise ratio (SNR) of MOGAD/HD serum CDC was 14 for MAC+MOG+ and 2.0 for dead MOG+ detection. When factor B–depleted NHS was used as the complement source to induce the classical complement cascade while preventing the alternative pathway, MOGAD patient serum still mediated MAC deposition and death of MOG+ cells, unlike control sera (Supplemental Figure 1, A and B). When a complement source was omitted, MAC deposition and CDC were not detected, exemplifying that the assays capture autoantibody characteristics alone (Supplemental Figure 1, C and D). In the ADCP assay, we observed that MOGAD patient serum induced phagocytosis of MOG+ cells, while HD serum did not (Figure 3J). We assayed ADCP in a cohort of 19 MOGAD, 7 HD, 10 NMOSD, and 12 MG participants (Table 2 and Supplemental Table 1), the majority of whom overlapped with the CDC cohort. We observed ADCP by 17% (mean) of macrophages with MOGAD serum, and that was significantly more than HD (mean 1.1%), MG (mean 1.3%), or NMOSD (mean 1.6%) serum (Figure 3K). As a result, ADCP resulted in a reduction in the percentage of MOG+ cells out of total HEK cells (Figure 3L). Notably, while MOGAD serum-induced phagocytosis exhibited bimodal distribution, the resultant fraction of MOG+ cells was normally distributed. The SNR of MOGAD to HD serum ADCP was 5.5 for GFP+ THP-1 and 4.3 for frequency of MOG+ HEK detection. Collectively, these data show that MOGAD serum autoantibodies are capable of both CDC and ADCP, and these mechanisms specifically destroy cells that express MOG and spare those that do not. Table 2Summary clinical and demographic characteristics in ADCP assay cohort MOGAD patient serum effector functions recapitulate neuropathology. We next investigated whether effector mechanisms of serum biospecimens, in our in vitro assays, reflect neuropathological findings in a relapsing MOGAD case. A man in his 40s initially developed an upper respiratory tract infection followed by subacute onset of ADEM that progressed to coma and severe quadriparesis, requiring intubation and mechanical ventilation within 1 month. Diagnostic CSF and MRI findings can be found in Supplemental Figure 2. After 1 day of i.v. methylpredisone, a biopsy of the right frontal lobe was undertaken (Supplemental Figure 2A, arrowhead). Histology of the biopsy revealed active white matter demyelination, with loss of myelin-associated glycoprotein (MAG; Figure 4A), MOG (Figure 4B), and proteolipid protein (PLP; Figure 4C). C9 neoantigen (C9neo; Figure 4, D and E), marked CD68+ macrophage/microglia infiltration (Figure 4F), and myelin-laden macrophages (Figure 4G) illustrated complement deposition and phagocytosis. Subsequently, the patient’s serum tested positive for MOG-IgG in a live CBA at a high titer of 1:1,000 (normal < 1:20). After 3 months, the patient returned to normal, for the most part, with mild residual erectile, bladder, and bowel sequelae. However, 15 months following initial disease onset, the patient experienced a relapse consisting of bilateral optic neuritis and recovered after i.v. methylprednisone treatment. His MOG-IgG has remained persistently positive at high titer (1:100). Over this course, a total of 4 serum samples were taken, 2 in proximity to the first attack and 2 during remission following the second attack (Table 3). CDC and ADCP assays were performed on these serum samples along with 4 HD serum samples (50% male, mean age 41, SD 13). All 4 serum samples from the patient with MOGAD exhibited high levels of MOG-IgG (Figure 4H), MAC deposition on 50%–61%, and death of 60%–69% MOG+ cells in the CDC assay (Figure 4, I and J), 14%–22% macrophages that phagocytosed MOG+ cells, and a resultant loss in MOG+ cells in the ADCP assay (Figure 4, K and L). Thus, all 4 samples were capable of robust CDC and ADCP of MOG-expressing cells. These data suggest that myelin phagocytosis by infiltrating macrophages and microglia in lesions may reflect autoantibody-directed destruction of MOG-expressing cells. Moreover, serum autoantibody effector function assays may recapitulate pathology at the site of disease. Figure 4Neuropathology in frontal lobe biopsy of patient with MOGAD with paired serum effector functions. Right frontal lobe biopsy was undertaken in a symptomatic patient with MOGAD based on MRI findings. (A–C) Histology was performed and indicated active demyelinating lesions with loss of (A) MAG, (B) MOG, and (C) PLP. (D and E) Complement deposition in lesions indicated by (D) C9neo (red), with higher magnification on right (E). (F and G) CD68+ (brown) macrophage/microglia infiltration detected in lesions and (G) macrophages appear foamy and myelin-laden upon higher magnification of MOG staining. Scale bar: 500 μm (A–D and F) and 50 μm (E and G). (H) The patient’s serum was collected at 4 time points: during relapse (MOG t1), 2 days thereafter (MOG t2), and twice during remission (MOG t3, t4). The serum was tested for MOG binding IgG in comparison to serum from 4 HD in a live MOG-CBA. These samples were then tested for induction of CDC and ADCP effector functions. (I–L) Resultant (I) MAC formation and (J) dead MOG+ cells in CDC assay and (K) phagocytosis and (L) MOG+ out of total HEK cells in ADCP assay. Experiments shown in H–L were performed in duplicate, shown as dots, with bar showing their mean. Table 3Clinical characteristics at serum biospecimen donation in neuropathology case Magnitude of CDC and ADCP correlate with MOG-IgG. Given the congruence between serum autoantibody functions and neuropathology, we then investigated factors influencing effector functions. First, we employed CBA to quantify MOG-IgG in sera to assess their magnitude as a possible correlative factor. We observed that MAC formation only resulted from samples with a positive ΔMFI, as expected (Figure 5A). To determine the relationship between binding and MAC formation, we tested 4 nonlinear regression models and linear regression for fit, compared by Akaike’s Information Criterion (AICc) (41–43). Out of dose-response, 1-site specific binding, exponential plateau, Gompertz curve (44), and linear regression, the Gompertz curve fit best with an R2 of 0.86. We selected these models based on qualitative characteristics of the curves as well as antibody-antigen binding kinetics (45, 46). Death of MOG+ cells as a result of CDC was also best fit by the Gompertz curve with a R2 of 0.62 (Figure 5B). The Gompertz curve also best models these metrics for MOGAD samples only, when omitting control samples (Supplemental Figure 3, A and B). Figure 5Magnitude of effector functions is associated with MOG-binding IgG in serum. A live MOG-CBA was used to quantify serum MOG-binding IgG and compared with CDC and ADCP induction of HI serum from patients with MOGAD (nCDC = 17, nADCP = 19), MG (nCDC = 13, nADCP = 12), and NMOSD (nCDC = 15, nADCP = 10) and HD (nCDC = 11, nADCP = 7). (A and B) MAC deposition and dead MOG+ cells upon CDC assay versus binding to MOG, fit with Gompertz model. (C) Frequency of MOG+ cells out of total HEK cells upon CDC assay versus binding to MOG, fit with linear regression model. (D and E) Phagocytosing macrophages and frequency of MOG+ cells out of total HEK cells upon ADCP assay versus binding to MOG, fit with linear regression model. Each dot represents a patient (average of duplicates). Gompertz models show 95% CI indicated by dotted lines. All models show goodness of fit, R2, on graph. Linear models show significance of nonzero slope, P value, on graph. The Gompertz model (44) suggests that a threshold of autoantibody binding to MOG-expressing cells must be exceeded for large relative increases in CDC; at lower autoantibody binding and at very high autoantibody binding, there is little difference in the change in CDC with changes in autoantibody binding. Linear regression models indicate positive associations between binding and MAC formation (P = 2.9 × 10⁻⁶) and binding and CDC (P = 3.6 × 10⁻¹⁰). Linear modeling was the best fit for the percentage of MOG+ cells out of total HEK after CDC but had low goodness of fit at R2 of 0.48 (Figure 5C). Nonetheless, binding was shown to induce a reduction in the frequency of MOG+ cells (P = 3.1 × 10⁻⁹). Linear models still exhibited a correlation when omitting control samples and evaluating MOGAD samples alone (Supplemental Figure 3C). Thus, despite interpatient heterogeneity, these regression analyses depict a correlation between the quantity of MOG-IgG and CDC. The relationships between MOG-IgG and percentage of phagocytosing macrophages and of MOG+ cells, as a result of ADCP, were best modeled by linear regression, with fits of R2 = 0.64 and 0.66, respectively (Figure 5, D and E). They reveal associations between binding and phagocytosis (P = 5.4 × 10⁻¹²) and resultant loss in MOG+ cells (P = 1.1 × 10⁻¹⁴). These findings are recapitulated when evaluating the results of MOGAD patient serum samples alone without HD, MG, or NMOSD serum controls (Supplemental Figure 3, D and E). As observed with CDC, there is interpatient heterogeneity in ADCP that cannot be attributed to autoantibody quantity alone, given samples with similar binding but differential phagocystosis. Time from relapse correlates better with CDC and ADCP than the quantity of MOG-IgG. Next, we explored whether serum effector functions correlate with relapse. Relapse dates for 15 of the MOGAD samples used in the CDC assay were available and used to evaluate the association between CDC and the days between most recent prior relapse and sample collection. We compared exponential decay and linear models. First, we found that exponential decay best fit days from relapse versus MAC+ and dead MOG+ cells with a goodness of fit of R2 = 0.39 and 0.66, respectively (Figure 6, A and B). Linear regression modeling indicated a reduction in MAC formation further from relapse (P = 0.0069) and showed a trend in a reduction in CDC further from relapse (P = 0.058) (Figure 6, C and D). However, neither linear regression nor exponential decay modeling fit days from relapse versus MOG binding, with R2 = 0.054 for both (Figure 6E). Moreover, no association was found between these metrics (P = 0.40). Considering that patients further from relapse may be undergoing different treatment regimens, we stratified samples that were untreated or undergoing steroid treatment from those undergoing more rigorous treatment, such as rituximab, mycophenolate mofetil, or i.v. immunoglobulin. We observed no differences in CDC (MAC formation or death) in relation to days between relapse and collection based on treatment (P ≤ 0.5). Figure 6Effector functions better correlate with relapse than do the quantity of MOG-IgG. Regression models were used to assess associations between proximity to relapse and magnitude of CDC, ADCP, and IgG binding to MOG per MOGAD serum sample (nCDC = 15, nADCP = 18). (A and B) MAC formation and dead MOG+ cells in CDC assay plotted against days from relapse and fit with exponential decay model (95% CI indicated by dotted lines; goodness of fit, R2, shown on graphs). (C and D) MAC formation and dead MOG+ cells in CDC assay. (E) MOG-IgG binding compared with days from relapse and fit with linear model. (F and G) Phagocytosing macrophages and percent MOG+ cells out of total HEK cells measured in the ADCP assay. (H) MOG-IgG binding plotted against days from relapse and fit with linear model. Each dot represents a patient (average of duplicates). For linear models, goodness of fit, R2, and significance of nonzero slope, P value, are shown on graph. Linear regression modeling of ADCP measured with phagocytosing macrophages or percent change in MOG+ cells, versus days from relapse, had a goodness of fit of R2 = 0.34 and 0.359, respectively, for the 18 MOGAD samples with relapse dates (Figure 6, F and G). ADCP decreased further from relapse, exemplified by reduced phagocytosing macrophages (P = 0.011) and loss of MOG+ cells (P = 0.0087). However, like CDC, regression modeling did not fit binding versus relapse for these samples (R2 = 0.038), and no association was found between these metrics (P = 0.44) (Figure 6H). We observed no differences in phagocytosis (P = 0.5), days from relapse (P = 0.5), or percent MOG+ cells (P = 0.071) upon stratification by treatment. Therefore, while our serum cohorts exhibited reduced CDC and ADCP capability further from relapse, we did not observe a correlation between the quantity of MOG-IgG and relapse. This exemplifies the potential elevated cytotoxic capabilities of MOG-IgG closer to disease manifestation. MOGAD serum initiates CA when cell death is experimentally prevented. We considered the possibility that death of MOG+ cells in the CDC assay might result in the underestimation of CA. Thus, we wished to evaluate whether a more sensitive assay could be designed by preventing completion of the complement cascade. Thus, we employed NHS depleted of C8, a requirement for MAC formation, as a source of human complement. Then, we measured CA using an antibody specific for C3d (47), which covalently attaches to target cells upon complement initiation. We observed elevated C3d deposition on MOG+ cells in the presence of MOG mAb or MOGAD patient serum in comparison with AChR mAb or HD serum, respectively (Figure 7, A and B), indicating that MOG autoantibody–mediated CA had occurred. Moreover, death of MOG+ cells was not detected by the MOG or AChR mAbs in the CA assay, despite C3d deposition, indicating effective abrogation of CDC (Supplemental Figure 4, A–C). However, a sizable population (over half) of the MOG+ cells exhibited C3d deposition in the presence of negative controls, including AChR mAb, no antibody source (media alone), or HD serum. This implies nonspecific or autoantibody-independent C3d deposition or C3d antibody binding. Figure 7MOGAD patient serum induces CA on live MOG-expressing cells. The CA assay utilizes C8-depleted NHS as the complement source to prevent MAC formation and CDC. Thus, C3d deposition can be monitored without loss of MOG+ cells. (A) Histograms depict C3d deposition on MOG+ cells in the presence of 1 μg/mL MOG mAb in comparison with AChR mAb. Each experiment was performed at least twice in duplicate. Frequencies of indicated gates depicted on plots. (B) Representative histograms depict C3d+MOG+ cells by MOGAD versus HD HI serum. (C and D) Comparative C3d deposition on (C) MOG+ and (D) MOG– cells by HI serum from patients with MOGAD (nCDC = 17), MG (nCDC = 13), and NMOSD (nCDC = 15) and HD (nCDC = 11). Each dot represents a patient (average of duplicates), normalized to media-only control, and bars depict mean ± SEM. Normality test followed by 1-way ANOVA for C (P = 1.2 × 10⁻³) and D (P = 0.12). For P ≤ 0.05, multiple comparisons were corrected with FDR of 0.05 and depicted on graph (**P ≤ 0.01, ****P ≤ 0.001). (E) C3d+MOG+ cells upon CA assay versus binding to MOG, fit with Gompertz model (95% cCI indicated by dotted lines; goodness of fit, R2, shown on graph). (F and G) C3d deposition on MOG+ cells in CA assay plotted against days from relapse for MOGAD samples (nCDC = 15) and fit with (F) linear model and (G) exponential decay model (goodness of fit, R2, shown on graphs; significance of nonzero slope, P value, is shown for linear model). Collectively, MOGAD serum (Table 1 and Supplemental Table 1) resulted in a mean 11% C3d+MOG+ cells (normalized to media alone), greater than that of HD (mean, –1.5%), MG (mean, –0.62%), and NMOSD (mean, 2.5%) (Figure 7C). CA was specific to MOG, as there was no difference in frequency of C3d+MOG– cells (Figure 7D; P = 0.12). However, this assay exhibited an SNR of MOGAD/HD serum of 1.0. We observed that the same MOGAD outlier that induced MAC formation and death of MOG– cells caused elevated C3d deposition on MOG– cells of 65%. A direct comparison of CA and CDC induction showed that 3 MOGAD samples exhibited an elevated frequency of C3d+ over MAC+MOG+ cells, while the rest induced a similar or elevated MAC formation compared with C3d (Supplemental Figure 4D). Linear modeling of C3d deposition versus MAC formation indicated a positive correlation (P = 0.0024; Supplemental Figure 4E). Like the CDC assay metrics, the correlation between C3d and binding was best modeled by the Gompertz curve, but the fit was not as good (R2 = 0.34) (Figure 7E). However, linear regression showed a positive association between binding and C3d (P = 0.0015). Both linear regression and exponential decay fit days from relapse versus C3d poorly (R2 < 0.35), and linear regression did not depict an association (P = 0.08) (Figure 7, F and G). Therefore, MAC formation and CDC correlate better with the quantity of MOG autoantibodies and days from relapse than does C3d deposition. Given that 1 MOGAD sample induced CDC and CA of both MOG+ and MOG– cells, we explored whether this sample exhibited nonspecific IgG reactivity; however, this sample did not exhibit significant IgG binding to MOG– cells (Supplemental Figure 5A, red arrow). This sample also induced CDC of AQP4+ and AQP4– cells (not shown). Finally, we performed a MOG CBA, using an anti-IgM secondary antibody rather than anti-IgG. In this assay, we found that this sample harbored significant IgM binding to MOG– cells, suggesting direct binding to the HEK cells (Supplemental Figure 5, B and C; red arrows); this explains the nonspecific CA and CDC of HEK cells. This patient had not been diagnosed with other autoimmune conditions, and no other explanatory clinical or demographic characteristics were identified. Of note, 1 other sample exhibited high MOG– IgG and also MOG+ IgM (Supplemental Figure 5, A and C, blue arrows); this is the sample in the aforementioned assays with the highest MOG-IgG ΔMFI (Figure 5), and it induced the second highest nonspecific death of MOG– cells in the CDC assay (Figure 3F). MOGAD serum induces ADCC of MOG-expressing cells. While histologic studies have not yet identified NK cells — mediators of ADCC — in MOGAD lesions, MOG-IgG from a cohort of pediatric patients were shown to mediate ADCC (33). Thus, we sought to evaluate ADCC as an additional pathogenic mechanism mediated by MOGAD patient autoantibodies by developing a MOG ADCC assay combining the CBA and established flow cytometry ADCC assays (48, 49). This assay only differed from the ADCP assay in that pooled HD NK cells were utilized as the effector source rather than macrophages. Then, HEK cell death was evaluated using a live/dead stain. We observed ADCC of MOG+ cells in the presence of MOG mAb but not in the presence of an AChR mAb (Figure 8A). We analyzed a set of specimens composed of 8 MOGAD patient serum samples and 13 control serum samples, including HD and patients with MG and NMOSD (Table 4 and Supplemental Table 1). We observed NK cell–mediated ADCC of MOG+ cells but not MOG– cells, resulting from incubation with MOGAD patient serum (Figure 8, B and C). In particular, MOGAD serum resulted in a mean 18% MOG+ cell death, significantly more than HD (mean 10%), MG (mean 6.0%), and NMOSD (mean 9.2%). There was no difference in the frequency of MOG– cell death between groups (Figure 8D). Importantly, not all MOGAD samples mediated cell death, similar to what we observed in the CDC assay. Three of the 8 (38%) MOGAD samples resulted in less than 10% cell death. The SNR of MOGAD/HD serum ADCC was 4.2. Linear regression indicated that samples with greater MOG-binding IgG induced greater death of MOG+ cells, suggesting that increased autoantibody binding to MOG is positively associated with ADCC (R2 = 0.62, P = 0.000024; Figure 8E). Figure 8MOGAD patient serum induces ADCC of live MOG-expressing cells. The ADCC assay was performed similarly to the ADCP assay with pooled HD NK cells to mediate cytotoxicity rather than macrophages for phagocytosis. A live/dead stain was used to identify killed HEK cells. (A) Histograms depict dead MOG– and MOG+ cells with 1 μg/mL MOG versus AChR mAb in the ADCC assay. Each experiment was performed at least 3 times in duplicate. Frequencies of indicated gates depicted on plots. (B) Representative histograms depict dead MOG– and MOG+ cells by HI MOGAD versus HD serum. (C and D) Comparative ADCC of (C) MOG+ and (D) MOG– cells by HI serum from patients with MOGAD (nADCC = 8), MG (nADCC = 4), and NMOSD (nADCC = 5) and HD (nADCC = 4). Each dot represents a patient (average of duplicates), and bars depict mean ± SEM. Normality test followed by 1-way ANOVA for C (P = 0.0075) and D (P = 0.68). For P ≤ 0.05, multiple comparisons were corrected with FDR of 0.05 and depicted on graph (*P ≤ 0.05, **P ≤ 0.01). (E) Frequency of MOG+ cells out of total HEK in the ADCC assay versus IgG binding to MOG, fit with linear regression model (goodness of fit, R2, and significance of nonzero slope, P value, shown on graph). Flow cytometry was then used to identify the presence of NK cells (CD56+CD3–CD19–CD14– lymphocytes) in the CSF of 3 relapsing patients with MOGAD. (F and G) Representative gating of NK cells out of lymphocytes in (F) CSF and (G) blood from 1 patient. (H) Frequency of NK cells out of lymphocytes in CSF versus blood in patients with MOGAD. Table 4Summary clinical and demographic characteristics in ADCC assay cohort In order to evaluate whether NK cells migrate to the CNS in MOGAD, we performed flow cytometry on fresh cerebrospinal fluid (CSF) from 3 patients with MOGAD during a relapse (Supplemental Table 1). NK cells, defined as CD56+CD3–CD19–CD14– lymphocytes, were distinctly detected in all 3 CSF samples (Figure 8, F–H). Fresh peripheral blood mononuclear cell (PBMC) samples were available for 2 of these patients; both showed the presence of NK cells at slightly higher frequencies than in the CSF. Differences in the frequency of NK cells in the CSF and blood, lack of RBCs in CSF, as well as skewing of phenotype (higher CD56 expression by CSF NK cells) suggest that the presence of NK cells in the CSF is not a product of blood contamination. Given the presence of NK cells intrathecally and the demonstrated ADCC capability of MOGAD serum autoantibodies, it is possible that NK cells contribute to damage of MOG-expressing cells through ADCC in patients.
|
|
Scooped by
Gilbert C FAURE
September 19, 2022 6:10 AM
|
Severe cases of COVID-19 are characterized by an inflammatory burst, which is accompanied by multiorgan failure. The elderly population has higher risk for severe or fatal outcome for COVID-19. Inflammatory mediators facilitate the immune system to combat viral infection by producing antibodies against viral antigens. Several studies reported that the pro-inflammatory state and tissue damage in COVID-19 also promotes autoimmunity by autoantibody generation. We hypothesized that a subset of these autoantibodies targets cardiac antigens. Here we aimed to detect anti-cardiac autoantibodies in severe COVID-19 patients during hospitalization. For this purpose, 104 COVID-19 patients were recruited, while 40 heart failure patients with dilated cardiomyopathy and 20 patients with severe aortic stenosis served as controls. Patients were tested for anti-cardiac autoantibodies, using human heart homogenate as a bait. Follow-up samples were available in 29 COVID-19 patients. Anti-cardiac autoantibodies were detected in 68% (71 out of 104) of severe COVID-19 patients. Overall, 39% of COVID-19 patients had anti-cardiac IgG autoantibodies, while 51% had anti-cardiac autoantibodies of IgM isotype. Both IgG and IgM anti-cardiac autoantibodies were observed in 22% of cases, and multiple cardiac antigens were targeted in 38% of COVID-19 patients. These anti-cardiac autoantibodies targeted a diverse set of myocardial proteins, without apparent selectivity. As controls, heart failure patients (with dilated cardiomyopathy) had similar occurrence of IgG (45%, p = 0.57) autoantibodies, while significantly lower occurrence of IgM autoantibodies (30%, p = 0.03). Patients with advanced aortic stenosis had significantly lower number of both IgG (11%, p = 0.03) and IgM (10%, p < 0.01) type anti-cardiac autoantibodies than that in COVID-19 patients. Furthermore, we detected changes in the anti-cardiac autoantibody profile in 7 COVID-19 patients during hospital treatment. Surprisingly, the presence of these anti-cardiac autoantibodies did not affect the clinical outcome and the prevalence of the autoantibodies did not differ between the elderly (over 65 years) and the patients younger than 65 years of age. Our results demonstrate that the majority of hospitalized COVID-19 patients produce novel anti-cardiac IgM autoantibodies. COVID-19 also reactivates resident IgG autoantibodies. These autoantibodies may promote autoimmune reactions, which can complicate post-COVID recuperation, contributing to post-acute sequelae of COVID-19 (long COVID).
|
|
Scooped by
Gilbert C FAURE
April 11, 2022 2:04 PM
|
Immunoglobulin A (IgA) is generally considered as a non-inflammatory regulator of mucosal immunity, and its importance in diversifying the gut microbiota is increasingly appreciated.IgA autoantibodies have been found in several autoimmune or chronic inflammatory diseases, but their role in pathophy...
|
|
Scooped by
Gilbert C FAURE
January 7, 2022 3:27 AM
|
Abstract Inflammatory processes, such as an infection or drug reaction, can cause antineutrophil cytoplasmic autoantibody (ANCA)-associated vasculitis (AAV). Although quite rare, AAV may occur with...
|
|
Scooped by
Gilbert C FAURE
October 1, 2021 5:41 AM
|
Abstract Patients with systemic lupus erythematosus (SLE) often develop glomerulonephritis (i.e., inflammation in the glomeruli of the kidney), commonly referred to as lupus nephritis. Patients with lupus nephritis typically have autoantibodies to the complement classical pathway protein C1q. Whether these anti-C1q antibodies play any role in the development of lupus nephritis has been unclear. In this issue of the JCI, a new study demonstrates that anti-C1q antibodies can amplify glomerular injury but only when they are bound within the glomerulus to C1q that has been already brought to that site by other types of glomerular-reactive autoantibodies . These studies are the first, to our knowledge, to provide a causal link between anti-C1q antibodies and target organ damage in SLE. The complement system is a central component of innate immunity that exhibits three pathways of activation: classical, alternative, and lectin-mediated. C1, a key component of the classical pathway, is actually a complex of three proteins: C1q, C1r, and C1s (1). C1q is a collagen-like component that is able to bind antibodies but only after the antibody has been bound to a foreign or self antigen. Once C1q is bound to the Fc antibody domain, C1r and C1s are sequentially cleaved and released, after which the rest of the classical pathway is activated. Immune complexes normally contain C1q bound via its “head” domains to Fc regions of IgG as part of the activation function of C1q within the classical pathway (1) (Figure 1). An alternate means of binding C1q, though, has also been described; it occurs when high-affinity autoantibodies directly recognize the collagenous “tail” portion of C1q through the antibody F(ab) antigen-combining sites rather than via the Fc domain. Since they were first described (2, 3), anti-C1q autoantibodies have been commonly identified in patients with autoimmune diseases such as systemic lupus erythematosus (SLE) and hypocomplementemic urticarial vasculitis. Although anti-C1q antibodies are associated with the presence of lupus nephritis — indeed probably serving as a biomarker for the presence of renal disease (4) — and anti-C1q antibodies are also preferentially localized in the glomeruli of patients with SLE (5), their pathophysiologic importance has remained undefined. Specifically, whether this class of acquired autoantibodies is merely an epiphenomenon or is truly pathogenic, and if so how and under what clinical circumstances, has remained an unanswered question. Figure 1 Roles of anti-C1q antibodies in the development of glomerular injury and antinuclear antibodies. (A) Anti-C1q antibodies (in yellow) such as JL-1 recognize the collagen-like “tails” of C1q in much the same manner as they would recognize any antigen through the F(ab) antigen-recognition domain. The administration of C1q and anti-C1q is not sufficient to cause glomerular injury as shown by Trouw et al. (6). However, when C1q-fixing anti-glomerular basement membrane (GBM) antibodies (in green) are first administered to mice, then C1q is able to bind to the Fc domain as it normally does. This brings anti-C1q antibodies into the glomerulus, resulting in sufficient complement activation to result in the generation of C3a, C5a, and MAC and the development of glomerulonephritis (B). As an alternate means by which anti-C1q antibodies could promote lupus-like autoimmunity, these antibodies could interfere with the normal ability of C1q to recognize apoptotic bodies containing DNA and other nuclear autoantigens (C). In this scenario, impaired clearance of apoptotic bodies, or clearance in a proinflammatory setting due to complement activation caused by the anti-C1q antibodies, could promote the development of autoantibodies that target DNA and other nuclear antigens, which is similar to what occurs when C1q is absent due to a genetic deficiency. Anti-C1q autoantibodies are pathogenic In this issue of the JCI, Trouw et al. (6) have now solved an important piece of this puzzle by first developing a murine mAb, JL-1, which was identified by ELISA based on its ability to recognize the tail domain of mouse C1q. When anti-C1q JL-1 was administered alone, it was bound in the glomerulus to C1q, which is normally present there at low levels; however, this interaction was insufficient to induce significant glomerular damage (Figure 1A). However, when JL-1 was administered to mice in which C1q levels in the glomerulus were greatly elevated as a consequence of its interaction with other antibodies with specificity for glomerular antigens, mice then exhibited significant glomerular injury as shown by decreased renal function and elevated “leakage” of protein into the urine (6) (Figure 1B). The combination of the first glomerular-binding antibody and JL-1 caused glomerular injury in a complement C4–, C3–, and Fc–dependent manner, reflecting a key role of the classical pathway itself in the generation of C3a, C5a, and the membrane attack complex (MAC). These downstream complement activation fragments are key mediators of complement-catalyzed autoimmune renal injury (7) (Figure 1B). In the setting described by Trouw et al., these complement mediators were probably generated by both types of antibodies, the initial glomerular-targeting antibodies as well as mAb JL-1. Together, the two types of antibodies generated enough mediators to be clinically important and cause glomerular injury in vivo. What do these results tell us about the role of C1q in SLE and also about this intriguing class of acquired autoantibodies? First, one has to ask whether the lone monoclonal antibody, JL-1, utilized in this study (6) to amplify glomerular injury is representative of the polyclonal population of C1q-reactive antibodies in human patients. It could be argued, as is well known in murine models, that placement of a “planted antigen” (herein possibly C1q) in the glomerulus followed by administration of a complement-fixing antibody that targets the antigen in situ readily leads to complement-dependent injury (8). The model system utilized by Trouw et al. (6) simply recapitulates this phenotype but in a clinically unrelated fashion. In addition, as pointed out by the authors, previous experiments in mice using glomerular-targeting antibodies also demonstrate dose-dependent “windows,” in which the injurious effects of complement activation are more prominent than at higher or lower doses of antibody (9). In this light, the use by the authors of a broad range of doses (of each reagent, the C1q-fixing anti-glomerular basement membrane antibody, and JL-1) would show how narrow the effect of the addition of monoclonal anti-C1q antibody on the development of glomerular injury is. However, in support of a close relationship between these findings in mice and SLE-associated lupus nephritis in humans, JL-1 is reported to recognize the same collagen-like domain of C1q as do human anti-C1q antibodies (2, 3, 6). In addition, previous studies in which C1q and polyclonal anti-C1q antibodies were both transferred into mice resulted in glomerular targeting of anti-C1q antibodies (10) as well as modest glomerular damage (11) similar to that caused by mAb JL-1 alone in the study by Trouw et al. (6). Nevertheless, a stronger link with human disease may be provided by a more careful comparison of the specific epitope reactivity of JL-1 and authentic autoantibodies from patients with glomerulonephritis. For example, is there evidence of cross-competition for C1q epitopes between human polyclonal anti-C1q autoantibodies and JL-1? Anti-C1q antibodies increase complement activation in a relatively uncontrolled fashion The complement system itself is regulated positively by amplification mechanisms (12) and negatively by regulatory proteins (13). At each activation step, a small amount of activated product can lead to the generation of from four to several thousand activated components derived from the immediate downstream target (1). The alternative pathway demonstrates an “amplification loop” effect, where C3b generated from the classical pathway can serve to bind factor B and initiate further C3 activation through formation of the C3 convertase C3bBb (12) (Figure 2). Although often thought of as a minor contributor to total complement activation — which is true if one considers only serum activation — amplification of injury in a target organ through engagement of the alternative pathway, amplifying injury in a target organ, is absolutely essential to the generation of local C5a- and MAC-dependent injury (14, 15). Figure 2 Simplified schematic demonstrating mechanisms of activation of classical and alternative pathways and generation of C3 convertases (light blue). The alternative pathway C3 convertase (green box) can be generated by the activity of the classical pathway C3 convertase C4b2a (yellow box) on C3, which results in C3b formation. This is called the alternative pathway amplification loop. In patients with C4 nephritic factors, autoantibodies react with the complex of C4b2a and keep it from being inactivated, thus generating more C3b than would normally occur. C3b* in the alternative pathway can originate from C3b generated by the classical pathway C3 convertase C4b2a. This concept is relevant to anti-C1q antibodies because the studies of Trouw et al. (6) strongly suggest that these autoantibodies likewise serve as an acquired mechanism of classical pathway amplification. Previously, the only means to amplify the classical pathway beyond what is possible through endogenous classical pathway components has been with C4-nephritic factor. This type of autoantibody, occasionally found in patients, stabilizes the classical pathway C3 convertase C4b2a and allows this convertase to generate far more activated C3 molecules than it normally would (16). Trouw et al. demonstrate that anti-C1q autoantibodies can result in a similarly amplified biologic effect of complement in vivo locally in the kidney, presumably by generating additional C3 through the classical pathway. In this light, it would be of some interest to determine the exact mechanism by which the classical pathway is amplified by JL-1 and whether this antibody interferes with other classical pathway regulatory mechanisms. Additional deleterious roles potentially played by anti-C1q autoantibodies In the larger context of lupus-like autoimmunity, C1q has taken on an increasingly important role and is necessary not only for classical pathway–dependent complement activation in target organs, as focused upon by Trouw et al. in this issue (6), but is also required to directly recognize and help to clear potentially dangerous nuclear autoantigens from apoptotic cells (17). Thus, in patients (18) and in certain autoimmune mouse strains (19), the absence of C1q leads to the development of anti-DNA antibodies and SLE. Of interest, C1q-deficient patients commonly exhibit severe renal disease (18), the cause of which has been ascribed to non–complement-dependent mechanisms, as C3 is not required in mice to develop glomerular injury in the absence of C1q (20). In this context of multiple roles for C1q, one could hypothesize that anti-C1q autoantibodies not only affect patients with SLE by injuring the kidney, as suggested by Trouw et al. (6), but also by enhancing the development of anti-DNA and other glomerular-targeting nuclear autoantibodies, because there is too little C1q available for effective clearance of these dangerous antigens (Figure 1C). Thus, these autoantibodies would not only amplify local injury but also potentially accelerate the development of antinuclear autoantibodies by interfering with C1q clearance functions (21). Alternatively, if these autoantibodies also lead to enhanced complement activation at sites where C1q is recognizing nuclear antigens, this could in principle switch noninflammatory recognition of apoptotic bodies by C1q and its receptors to inflammatory recognition when C5a and other complement activation fragments are also generated, and their receptors are engaged on cells clearing these antigens. In sum, acquired anti-C1q autoantibodies could utilize several possible mechanisms by which they could increase the severity of an autoimmune response and glomerulonephritis. The studies by Trouw et al. (6) provide an important conceptual advance in this area and open up the possibility of determining how inhibiting C1q or modulating its effects leads to severe SLE. In particular, the use of JL-1 and similar monoclonal antibodies in mouse models should allow these and other investigators to better understand the molecular mechanisms that lead both to increased development of anti-DNA antibodies and to tissue injury. Footnotes See the related article beginning on page 679. Nonstandard abbreviations used: MAC, membrane attack complex; SLE, systemic lupus erythematosus. Conflict of interest: The author has declared that no conflict of interest exists. References Lachmann, PJ, Hughes-Jones, NC. Initiation of complement activation. Springer Semin. Immunopathol. 1984. 7:143-162. View this article via: PubMed CrossRef Google Scholar Uwatoko, S, Mannik, M. Low-molecular weight C1q-binding immunoglobulin G in patients with systemic lupus erythematosus consists of autoantibodies to the collagen-like region of C1q. J. Clin. Invest. 1988. 82:816-824. View this article via: JCI PubMed CrossRef Google Scholar Wisnieski, JJ, Naff, GB. Serum IgG antibodies to C1q in hypocomplementemic urticarial vasculitis syndrome. Arthritis Rheum. 1989. 32:1119-1127. View this article via: PubMed CrossRef Google Scholar Coremans, IEM, et al. Changes in antibodies to C1q predict renal relapses in systemic lupus erythematosus. Am. J. Kidney Dis. 1995. 26:595-601. View this article via: PubMed CrossRef Google Scholar Mannik, M, Wener, MH. Deposition of antibodies to the collagen-like region of C1q in renal glomeruli of patients with proliferative lupus glomerulonephritis. Arthritis Rheum. 1997. 40:1504-1511. View this article via: PubMed CrossRef Google Scholar Trouw, LA, et al. Anti-C1q autoantibodies deposit in glomeruli but are only pathogenic in combination with glomerular C1q-containing immune complexes. J. Clin. Invest. 2004. 114:679-688.doi:10.1172/JCI200421075. View this article via: JCI PubMed Google Scholar Quigg, RJ. Complement and autoimmune glomerular diseases. Curr. Dir. Autoimmun. 2004. 7:165-180. View this article via: PubMed Google Scholar Feintzeig, ID, Dittmer, JE, Cybulski, AV, Salant, DJ. Antibody, antigen, and glomerular capillary wall charge interactions: influence of antigen location on in situ immune complex formation. Kidney Int. 1986. 29:649-657. View this article via: PubMed CrossRef Google Scholar Quigg, RJ, et al. Blockade of antibody-induced glomerulonephritis with Crry-Ig, a soluble murine complement inhibitor. J. Immunol. 1998. 160:4553-4560. View this article via: PubMed Google Scholar Uwatoko, S, Gauthier, VJ, Mannik, M. Autoantibodies to the collagen-like region of C1Q deposit in glomeruli via C1Q in immune deposits. Clin. Immunol. Immunopathol. 1991. 61:268-273. View this article via: PubMed CrossRef Google Scholar Trouw, LA, et al. Glomerular deposition of C1q and anti-C1q antibodies in mice following injection of antimouse C1q antibodies. Clin. Exp. Immunol. 2003. 132:32-39. View this article via: PubMed CrossRef Google Scholar Muller-Eberhard, HJ. Molecular organization and function of the complement system. Ann. Rev. Biochem. 1988. 57:321-347. View this article via: PubMed CrossRef Google Scholar Liszewski, MK, Farries, TC, Lublin, DM, Rooney, IA, Atkinson, JP. Control of the complement system. Adv. Immunol. 1996. 61:201-283. View this article via: PubMed CrossRef Google Scholar Girardi, G, et al. Complement C5a receptors and neutrophils mediate fetal injury in the antiphospholipid syndrome. J. Clin. Invest. 2003. 112:1644-1654. doi:10.1172/JCI200318817. View this article via: JCI PubMed Google Scholar Holers, VM, Thurman, JM. The alternative pathway of complement in disease: opportunities for therapeutic targeting. Mol. Immunol. 2004. 41:147-152. View this article via: PubMed CrossRef Google Scholar Gigli, I, Sorvillo, J, Mecarelli-Halbwachs, L, Leibowitch, J. Mechanism of action of the C4 nephritic factor. Deregulation of the classical pathway of C3 convertase. J. Exp. Med. 1981. 154:1-12. View this article via: PubMed CrossRef Google Scholar Botto, M, et al. Homozygous C1q deficiency causes glomerulonephritis associated with multiple apoptotic bodies. Nat. Genet. 1998. 19:56-59. View this article via: PubMed CrossRef Google Scholar Bowness, P, et al. Hereditary C1q deficiency and systemic lupus erythematosus. Q. J. Med. 1994. 87:455-464. Mitchell, DA, et al. C1q deficiency and autoimmunity: the effects of genetic background on disease expression. J. Immunol. 2002. 168:2538-2543. View this article via: PubMed Google Scholar Mitchell, DA, et al. C1q protects against the development of glomerulonephritis independently of C3 activation. J. Immunol. 1999. 162:5676-5679. View this article via: PubMed Google Scholar Botto, M, Walport, MJ. C1q, autoimmunity and apoptosis. Immunobiology. 2002. 205:395-406. View this article via: PubMed CrossRef Google Scholar
|
|
Scooped by
Gilbert C FAURE
April 29, 2021 10:25 AM
|
B lymphocytes have a central role in autoimmune diseases, which are often defined by specific autoantibody patterns and feature a loss of B cell tolerance. A prototypic disease associated with B cell hyperactivity is systemic lupus erythematosus (SLE). In patients with SLE, the loss of B cell tolerance to autoantigens is controlled in a cell-intrinsic manner by Toll-like receptors (TLRs), which sense nucleic acids in endosomes. TLR7 drives the extrafollicular B cell response and the germinal centre reaction that are involved in autoantibody production and disease pathogenesis. Surprisingly, TLR9 seems to protect against SLE, even though it is required for the production of autoantibodies recognizing double-stranded DNA-associated antigens, which are abundant in SLE and are a hallmark of this disease. The protective function of TLR9 is at least partly mediated by its capacity to limit the stimulatory activity of TLR7. The roles of TLR7 and TLR9 in the effector function of B cells in lupus-like disease and in patients with SLE, and the unique features of TLR signalling in B cells, suggest that targeting TLR signalling in SLE might be therapeutically beneficial. Loss of B cell tolerance to autoantigens in systemic lupus erythematosus (SLE) is driven by TLR7, whereas TLR9 appears to protect against SLE by limiting the stimulatory activity of TLR7. The unique features of Toll-like receptor signalling in B cells implicate it as a therapeutic target in SLE.
|
|
Scooped by
Gilbert C FAURE
April 10, 2021 11:37 AM
|
autoantibody anti-interferons
|
|
Rescooped by
Gilbert C FAURE
from Virus World
January 21, 2021 2:23 AM
|
Evidence is growing that self-attacking ‘autoantibodies’ could be the key to understanding some of the worst cases of SARS-CoV-2 infection. More than a year after COVID-19 emerged, many mysteries persist about the disease: why do some people get so much sicker than others? Why does lung damage sometimes continue to worsen well after the body seems to have cleared the SARS-CoV-2 virus? And what is behind the extended, multi-organ illness that lasts for months in people with ‘long COVID’? A growing number of studies suggest that some of these questions might be explained by the immune system mistakenly turning against the body — a phenomenon known as autoimmunity. “This is a rapidly evolving area, but all the evidence is converging,” says Aaron Ring, an immunologist at the Yale School of Medicine in New Haven, Connecticut. Early in the pandemic, researchers suggested that some people have an overactive immune response to COVID infection. Immune-system signalling proteins called cytokines can ramp up to dangerous levels, leading to ‘cytokine storms’ and damage to the body’s own cells. Clinical trials have now shown that some drugs that broadly dampen immune activity seem to reduce death rates in critically ill people, if administered at the right time. But scientists studying COVID are increasingly also highlighting the role of autoantibodies: rogue antibodies that attack either elements of the body’s immune defences or specific proteins in organs such as the heart. In contrast to cytokine storms, which tend to cause systemic, short-duration problems, autoantibodies are thought to result in targeted, longer-term damage, says immunologist Akiko Iwasaki, a colleague of Ring’s at Yale. Even healthy people make autoantibodies, but not generally in large amounts, and the molecules don’t usually seem to cause damage or attack the immune system. Yet researchers also have evidence that nefarious autoantibodies do have a role in many infectious diseases. There are several theories to explain how autoimmunity might emerge from COVID and other infections. Some people might be predisposed to producing autoantibodies that can then wreak havoc during an infection. Alternatively, infections could even trigger the production of autoantibodies. If researchers can establish the link, they might be able to come up with avenues for treatment, both for the repercussions of COVID and for other diseases caused by viruses. Finding autoantibodies In late September, a group led by Jean-Laurent Casanova at the Rockefeller University in New York City reported that more than 10% of 987 individuals with severe COVID-19 had antibodies that attacked and blocked the action of type 1 interferon molecules, which normally help to bolster the immune response against foreign pathogens1. That was a striking proportion, the researchers say, because people’s antibody repertoires are normally very dissimilar, and no one in a control group for the study had these antibodies. The researchers also saw the antibodies in people before their COVID-19 infection, so Casanova thinks that some people could be genetically predisposed to produce them. And the autoantibodies were more common in men than women — a possible factor in why COVID seems to hit men harder. The first evidence suggesting that autoantibodies against interferon might put people at higher risk of infectious disease was published in 1984, and evidence has accumulated since then, Casanova says. But now COVID is drawing more attention to the connection. “Now people understand the problem,” he says, “and all of a sudden they realize that what my lab has been doing for 25 years is actually pretty meaningful.” Casanova is now screening 40,000 people to see how many have pre-existing autoantibodies and determine whether their distribution by age, ancestry and gender matches that of severe COVID. Other research groups have supported Casanova’s autoantibody connection. Iwasaki, Ring and others screened 194 patients and hospital workers with varying severities of COVID for a wide range of autoantibodies. Their study, which was posted online in December and has not yet been peer reviewed, found a higher prevalence of autoantibodies against the immune system in infected individuals than in uninfected people. They found autoantibodies that attacked B cells, as well as some that attacked interferon..... Published in Nature (Jan. 19, 2021): https://doi.org/10.1038/d41586-021-00149-1
Via Juan Lama
|
|
Scooped by
Gilbert C FAURE
January 15, 2021 10:57 AM
|
INTRODUCTION Autoimmune hepatitis (AIH) is an immune-mediated inflammatory liver disease of non-self-limiting clinical course for which immunosuppressive agents are necessary in the majority of affected patients. The concept of the immunopathogenesis of AIH relies on autoreactive CD4 and CD8 T cells, whose emergence is induced after the break of self-tolerance by environmental triggers [1]. As the inflammation that AIH presents is likely to be characterized by a dynamic transition of the milieu of multiple effector immune cells in the liver, clinicians should take into consideration the chronological dynamics of disease manifestations or of distinct subtypes of disease, e.g., ranging from acute-onset, acute on chronic, and chronic insidious manifestation. The appropriate diagnosis and proper treatment strategy with special attention to the clinical subtypes of AIH must be considered to ensure favorable short- and long-term survival. In 2019, the American Association of the Study of Liver Disease (AASLD) published very comprehensive practice guidance and guidelines for AIH that updated the previous version published in 2010 [1]. The progress in our understanding of AIH is apparent in these guidelines, including their detailed description of a first-line treatment strategy based on the patient’s clinical manifestations. In this review, we summarize the recent updates regarding the management of AIH, focusing on the disease manifestations (Fig. 1) and the time frame of treatment and responses to treatment. EPIDEMIOLOGY AIH affects individuals of all ages from children to the very elderly, but it is most commonly identified in middle-aged women [2,3] in all ethnic groups. In 2016, a nationwide, hospital-based, epidemiological survey to approximate the prevalence of AIH was carried out in Japan. The estimated number of patients was 30,330 (95% confidence interval [CI], 29,592–31,069) and the calculated point prevalence of AIH per 100,000 population was 23.9 (95% CI, 23.3–24.5) [4]. Compared to the previous survey in 2004, the data revealed an almost threefold increase in the prevalence of AIH [4]. Among the widely varying nation-based prevalence data for adult AIH reported after 2000, e.g., from 4.0 (Singapore) [5] to 42.9 (Alaska) [6], a trend of increasing prevalence has been observed worldwide; for instance, from 10.7 in 2003 [7] to 17.3 in 2009 [8] in Sweden. The prevalence of AIH in Korea increased gradually from 2009 to 2013, although the incidence remained stable [2]. Alterations of environmental factors, including changes in lifestyle, might trigger the development of AIH, and environmental factors are likely to be linked to the increased male to female ratio of AIH in Japan from 1:6.9 in 2004 to 1:4.3 in 2016 as shown by the aforementioned survey [4]. Improved awareness of AIH among clinicians worldwide might also have contributed to the trend of increased prevalence, possibly resulting in a reduction of the number of otherwise undiagnosed patients, including adult male patients. DIAGNOSIS General considerations AIH is a disease without signature diagnostic features. The diagnosis of AIH requires 1) histological abnormalities (interface hepatitis), 2) characteristic laboratory findings (elevated serum hepatic enzymes, aspartate aminotransferase [AST] and alanine aminotransferase [ALT], and increased serum immunoglobulin G [IgG]), and 3) positive results of disease-defining autoantibodies, coupled with 4) the exclusion of other liver diseases that may resemble AIH, including viral hepatitis, hereditary, metabolic, cholestatic, or drug-induced liver injury (DILI). Anti-nuclear antibodies (ANA) and anti-smooth muscle antibodies should be tested in patients of all ages, and an additional test of anti-liver kidney microsomal type 1 is necessary in children for the characterization of type 2 AIH [1]. The clinical judgement is straightforward in typical AIH patients with the above-mentioned hallmarks, but atypical cases should be diagnosed with the aid of diagnostic scoring systems that were originally developed by the International AIH Group (IAIHG) in 1993 for the identification of patients with AIH for clinical research [9]. The revised IAIHG criteria reported in 1999 [10] and the simplified criteria proposed in 2008 [11] are commonly implemented in clinical practice, and they emphasize distinct diagnostic values. As the simplified scoring has superior specificity (90% vs. 73%) and accuracy (92% vs. 82%) compared to the revised scoring system [12], the former is preferable for the diagnosis of typical AIH cases. On the other hand, the revised scoring system is suitable for the reassessment of atypical cases with a low score in the simplified system, including cases of autoantibody-negative hepatitis and acute-onset AIH with normal IgG values [1]. Limitations to both scoring systems are evident (due to the lack of accuracy) for a diagnosis of AIH that is overlapped with a primary biliary cholangitis (PBC) [13], primary sclerosing cholangitis (PSC), or non-alcoholic fatty liver disease (NAFLD) [14], or fulminant liver failure. Histological findings The diagnosis of AIH requires liver biopsy results presenting compatible histological abnormalities. Typical histological features are indicative of (chronic) active hepatitis, comprising lymphoplasmacytic interface hepatitis, emperipolesis (intrusion of one intact lymphocyte into a hepatocyte), and hepatocyte rosettes. Gurung et al. [15] recently hypothesized that typical histological features are related to the severity of disease, but not to the etiology itself, and they reported the following as AIH-specific histological features: 1) Kupffer cell hyaline granules, 2) prominence of plasma cells in portal tracts, and 3) the relative predominance of plasma cells over lymphocytic inflammation. After Gurung et al. [15] adjusted the analysis results for the inflammatory grade, emperipolesis and rosette formation were similarly found in the disease control, chronic hepatitis C (CHC). The Kupffer cell hyaline granules were well-circumscribed, eosinophilic periodic acid-Schiff diastase-resistant deposits within Kupffer cells, and they were originally proposed as a specific histology in pediatric AIH [16]. Centrilobular necrosis is another histological AIH feature, presenting in a rather disease manifestation-specific manner in acute-onset AIH [17] and in acute liver failure (ALF). In ALF, central perivenulitis, plasma cell-enriched inflammatory infiltrate, and lymphoid follicles on a background of massive hepatic necrosis are the principle findings [18]. In clinical practice, the differential diagnosis of AIH in liver histology is routinely focused on DILI, including drug-induced AIH (DIAIH)-like liver injury. Though the rare presence of bridging fibrosis and the absence of advanced fibrosis are clues suggesting DILI, this is not the case for the differential diagnosis of acute-onset AIH over DILI. Histological findings of NAFLD and non-alcoholic steatohepatitis (NASH) are reported to be present in 17–30% of adult AIH patients [19,20]. These overlapping findings are indicative of patients who are at increased risk of liver-related mortality [19]. Conversely, characteristic laboratory findings with positive autoantibodies (especially in female patients) are sometimes refuted by the mere histology of NAFLD or NASH in the liver. Signature diagnostics for discriminating NASH with prominent periportal hepatitis from chronic active AIH are greatly anticipated. Noninvasive assessment of fibrosis The long-term outcome of AIH is associated with the stage of fibrosis. Since the evaluation of liver fibrosis by biopsy during the course of disease management is not feasible, noninvasive assessments have been conducted in clinical hepatology by using serum biomarkers, including the serum AST/platelet ratio index (APRI) and the fibrosis-4 (FIB-4) index [21]. However, a recent systemic review of the diagnostic accuracy of APRI and FIB-4 demonstrated their poor performance for detecting advanced fibrosis and cirrhosis in AIH [22]. Noninvasive assessment by liver stiffness has been shown to identify advanced fibrosis and cirrhosis in AIH with reasonable accuracy. The performance levels of vibration-controlled transient elastography (VCTE) and magnetic resonance elastography were indicated to be superior to those of the APRI and FIB-4, and VCTE was validated in a systemic review as providing good performance [22]. Considering that liver inflammation affects liver stiffness, the stiffness value at the initial diagnosis before the initiation of treatment with immunosuppressive agents is confounded by disease activity. In fact, the value of VCTE within 3 months after the start of treatment was significantly correlated with histological grading, but not with the fibrosis stage [23]. Thereafter, at least 6 months after the successful treatment of AIH, the area under the receiver operating curve of VCTE reached 1.0 [23]. Sustaining biochemical remission (normal ALT and normal IgG) and the use of VCTE help monitor and manage the disease course of AIH. A novel serum fibrosis marker, i.e., Mac-2 binding protein glycosylation isomer (M2BPGi), which was originally reported to be associated with the fibrosis stage in CHC patients [24], is likely to become an alternative to the use of VCTE; the M2BPGi value is influenced by both inflammation and fibrosis in AIH patients, in a similar way to VCTE [25]. A ‘one-serum parameter fits all’ approach to the evaluations of disease activity and fibrosis could be achievable with serum M2BPGi, but further studies are necessary to validate its utility. CLINICAL MANIFESTAIONS WITH SPECIAL ATTENTION TO DISEASE SUBTYPES Acute-onset AIH Acute-onset AIH is a clinically challenging disease subtype because a delayed diagnosis and delayed treatment, especially in the absence of typical serological findings, may lead to a poorer short-term prognosis. The prevalence of acute-onset AIH has been obtained in several cross-sectional studies worldwide. The 2019 AASLD practice guidance and guidelines state that 25–75% of individuals with AIH in western countries present with an acute onset and a disease duration <30 days [1,26]. A Korean study reported the prevalence 46.4%, using almost the same definition [27]. An Italian multicenter cohort applied arbitrary criteria, i.e., >10× the upper limit of normal (ULN) of transaminases and >5 mg/mL of bilirubin, and the study’s authors reported that 43% of their series of AIH patients were acute-onset [28]; among the patients who underwent liver biopsy, 64.8% fulfilled the histological criteria for acute-onset AIH, with the fibrosis stage lower than Ishak F2. In a Japanese nationwide cross-sectional study of AIH patients diagnosed in 2009–2013, the frequency of acute hepatitis without fibrosis (F0) was, on the other hand, almost 11% [3]. Acute-onset AIH may encompass two distinct clinical subgroups: 1) ‘genuine’ acute AIH with no chronic liver pathology (portal, followed by bridging fibrosis) and 2) acute exacerbation of chronic AIH. Even among the group of genuine acute AIH cases, dynamic histological changes—especially in the extent of portal fibrosis—are anticipated. As a trend, the median duration between disease onset and liver biopsy among Japanese AIH patients with acute presentation was longer in the F1–2 patients than in the F0 patients (29 vs. 15 days, P=0.052) [29]. Nevertheless, there were no significant differences between these two groups in laboratory data, AIH-related pathological findings, or disease outcomes after the introduction of prednisolone. Typical serological hallmarks of AIH (e.g., positive autoantibody or elevated serum IgG) are frequently absent in acute-onset AIH; in the above-mentioned Japanese cohort, 27% of the patients were ANA-negative (<×40) and >50% of them had normal serum IgG values [29]. As the absence of ANA and normal serum IgG were not associated with disease outcomes in that cohort, the prompt initiation of treatment with immunosuppressive agents was necessary to prevent progression to acute severe AIH (AS-AIH), and eventually ALF. AS-AIH is defined by the AASLD as AIH with jaundice, a prothrombin time (PT) international normalized ratio (INR) ≥1.5, and neither encephalopathy nor previously recognized liver disease (Table 1) [1]. A thorough diagnosis protocol that includes a transjugular liver biopsy is needed to differentiate AS-AIH from acute severe hepatitis with multiple other etiologies. In a cohort from the UK and France, 69% [30] and 59% [31] of the AS-AIH cases were reported to progress to ALF-AIH, respectively. A continuum of treatment strategies that are based on the benefit-to-risk ratio of glucocorticoid therapy should thus be seriously considered (Fig. 2). In the 2019 AASLD practice guidance, prednisone or prednisolone monotherapy (60 mg/day in adults) is recommended for AS-AIH [1], because no association with an increase in sepsis was demonstrated [32]. A short-term treatment response (within 1–2 weeks) in AS-AIH is indeed crucial to prevent disease progression. Zachou et al. [33] recently observed that high-dose intravenous (iv.) corticosteroids (either 1 g methylprednisolone for 3 consecutive days followed by iv. 1 mg/kg/day prednisolone, or iv. 1.5 mg/kg/day prednisolone) was safe and effective to treat AS-AIH patients (n=34; all were F0–2, and transaminases were >10× ULN). The complete response rate was higher than that in the non-AS-AIH group, with no case requiring liver transplantation (LT). ALF and acute on chronic liver failure (ACLF) AS-AIH with encephalopathy is defined as ALF caused by AIH (ALF-AIH) (Table 1). With regard to noninvasive diagnoses, heterogenous hypo-attenuated regions within the liver as visualized by unenhanced computed tomography (CT) is useful to differentiate patients with AS/ALF-AIH from those with viral-associated ALF [34]. The volumetric measurement of the liver on CT is also valuable, because the size of the liver was reported to be significantly reduced in non-acetaminophen cases of acute liver injury/ALF compared to the acetaminophen-induced cases [35]. A direct evaluation of indications for LT is recommended in ALF-AIH, because glucocorticoid therapy has not been associated with improved overall survival and is even harmful to patients with a model for end-stage liver disease (MELD) score >40 [36]. ACLF is caused by an AIH flare in previously diagnosed or undiagnosed chronic liver disease/cirrhosis (AIH-ACLF) patients. The Asian Pacific Association for the Study of Liver ACLF Consortium defines ACLF as patients with jaundice (bilirubin >5 mg/dL) and coagulopathy (PT [INR] ≥1.5), complicated by ascites and/or encephalopathy within 4 weeks after diagnosis. The consortium reported that 2.9% (n=82) of the ACLF cases diagnosed in 2012–2017 in nine Asian countries were regarded as having developed AIH as an acute insult; 97% of the patients exhibited IgG elevation (>1.1× ULN), whereas 49% were seronegative for autoantibodies [37]. Although 34% of the patients (n=28) being treated with a corticosteroid showed a significantly improved 90-day survival rate compared to those without treatment (75% vs. 48.1%, P=0.02), early stratification to corticosteroid therapy or LT is necessary [37]; predictors of an unfavorable response to corticosteroids were revealed to include a MELD score >27 and hepatic encephalopathy in advanced fibrosis (≥F3). DIAIH-like injury DILI can occasionally be diagnosed based on increased serum IgG and positive ANA. Even after the cessation of suspected drugs, such ‘AIH-mimic’ patients whose ALT elevation is persistent or progressive are indicated for treatment with immunosuppressive agents to prevent ALF. Remarkably, the short-term (1 week) response to corticosteroids was demonstrated to be more pronounced in the patients with AIH-mimic DILI compared to those with pure AIH [38]. AIH-mimic DILI and pathogenically DIAIH are difficult to differentiate by liver pathology, including the intensity of inflammatory infiltrates, the type of the predominant inflammatory cells, and the grade of fibrosis. In the 2019 AASLD practice guidance and guidelines, the term “DIAIH-like injury” was introduced as an alternative to DIAIH [1]. The majority of patients with DIAIH-like injury are acute-onset, and up to 30% of the cases are accompanied by hypersensitivity reaction [39]; the latency periods of minocycline and nitrofurantoin (the two most commonly implicated drugs) can exceed 12 months [40]. HLA-DR3 or -DR4 and cirrhosis at presentation are unusual [41]. Fulfilling Hy’s law, serum aminotransferase levels >3× ULN and total serum bilirubin >2× ULN as a predictor of ALF in patients with DILI [42], or failures of improvement in laboratory tests after medication discontinuation are the reasons for the implementation of glucocorticoids. The outcome of DIAIH-like injury has been shown to be excellent, and relapse after glucocorticoid withdrawal is rare [43]. Emerging liver injury that is related to the use of immune checkpoint inhibitors is distinct from DIAIH-like injury, as it lacks the typical serological and histological features of AIH [44,45]. Overlap manifestation with cholestatic liver disease or viral hepatitis The concurrences of AIH and PBC or AIH and PSC are not confirmed as specific pathological entities, but the identification of clinical ‘overlap’ among AIH patients is of importance, as these patients may not obtain sufficient benefit with only conventional AIH treatment. Concerning the AIH-PBC overlap, it should be noted that 5–35% of AIH patients, even in the absence of bile duct lesions, are reported to be positive for the serological hallmark of PBC, i.e., anti-mitochondrial antibodies (AMAs) [46]. Simultaneous and sequential AIH-PBC overlaps should be considered separately; the former is suspected in the presence of destructive cholangitis at the initial diagnosis, and the latter is suspected based on the occasional elevation of cholestatic enzymes after biochemical remission. The ‘Paris criteria’ for the identification of AIH-PBC overlap is valuable for apparent cases [47], but this criteria may miss cases with less severe cholestatic features [48,49]. The IAIHG’s position statement did not endorse the Paris criteria or even the revised AIH criteria regarding the diagnosis of AIH-PBC overlap [13]. Nevertheless, the reevaluation of suspected AIH-PBC overlap patients in light of their responses to immunosuppressive agents is likely practical and necessary. AIH-PSC overlap is diagnosed based on the following: 1) the typical features of AIH, 2) the absence of AMA, and 3) evidence of large-duct PSC by endoscopy or magnetic resonance imaging or of small-duct PSC, confirmed by ‘onion-skinning’ periductal fibrosis in a liver biopsy [49]. Concurrent ulcerative colitis with AIH is a critical indication for AIH-PSC overlap, especially in pediatric patients. The cases of hepatitis C virus-infected patients are occasionally accompanied by positive serum and histological markers of AIH, making a differential diagnosis of CHC-AIH overlap syndrome necessary. Direct-acting antiviral (DAA) therapy for CHC patients with AIH features was shown to significantly decrease ALT into the normal range, and serum markers of AIH in those patients began decreasing by 6 months post-treatment; >50% of the patients achieved complete resolution [50]. The CHC-AIH overlap syndrome may be a historical disease entity that is not likely to be diagnosed after the era of DAA. TREATMENT General considerations The purposes of the treatment of AIH are to first relieve symptoms, and then to achieve a biochemical response, control hepatic inflammation toward histological remission, prevent disease progression, and promote the regression of fibrosis. The ideal biochemical response, regarded as biochemical remission by the AASLD, is the normalization of the patient’s serum AST, ALT, and IgG levels to within the ULN (Table 1) [1]. A favorable treatment response in AIH patients assures overall survival that is comparable to that of general populations [51]. Due to the heterogenous manifestations of AIH, short- and long-term treatment responses with regard to liver-related adverse events should be defined in a personalized manner (Figs. 2, 3). Among AS-AIH, ALF, and ACLF patients, estimation of the early biochemical response within 7–14 days is necessary (Fig. 2) [1,32]. In contrast, the midterm biochemical response of patients with nonsevere acute-onset AIH or chronic insidious AIH, even with cirrhosis, can be evaluated at 4–8 weeks (Fig. 3) [1]. Biochemical remission is followed by a histological remission of disease activity. Sustaining biochemical remission for a long term (>1 year from treatment initiation) is thereafter a surrogate for favorable overall long-term survival [52]. Decreasing values of VCTE are favorable, even for the regression of fibrosis. First-line treatments The long-term outcome of patients with AIH has been shown to be improved with immunosuppressive treatment, both with corticosteroids alone and with a combination of a lower dose of corticosteroids and azathioprine (AZA) [53]; those regimens are consistently endorsed as a first-line treatment for AIH. The 2019 AASLD practice guidance and guidelines updated their recommended first-line treatment: either prednisone monotherapy (40–60 mg/day) or a combination of prednisone (20–40 mg/day) or budesonide (9 mg/day) and AZA (50–100 mg/day) [1]. The 2015 European Association for the Study of the Liver (EASL) guidelines propose 0.5–1 mg/kg/day predniso(lo)ne as the initial treatment, followed by a 50 mg/day AZA add-on [54]. The AASLD similarly indicates the appropriateness of a 2-week observation before the AZA is initiated, to confirm the patient’s steroid responsiveness and to evaluate his or her thiopurine-S methyl transferase (TPMT) status for the prevention of AZA-induced hepatitis. TPMT is an anabolizing enzyme for thiopurines, including AZA, and single nucleotide polymorphisms of TPMT genes that cause loss of enzymatic activity predispose patients, in particular European and African descendants, to thiopurine-related toxicity [1,55]. In Japan, AZA was finally approved for AIH treatment in 2018. Accordingly, the practice guidelines for AIH published by the Intractable Hepato-Biliary Diseases Study Group in Japan very recently added the recommendation to evaluate NUDT15 variant (but not TPMT) in patients who are to be treated with AZA, in order to exclude the possibility of thiopurine-induced early severe leukopenia and hair loss [55]. NUDT15 is a recently characterized nucleotide phosphatase that inactivates thiopurines. As the low- or intermediate activity diplotype was reported to be common in East Asian countries (22.6%) [55], the integration of NUDT15 variants in the dosing algorithm for AZA is regarded as most informative. Concerning the relevance of the starting dose of predniso(lo)ne to ensure remission, a retrospective observational study from nine centers in five European countries was performed and the results revealed no significant difference in the rate of normalization of transaminases at 6 months between groups with a higher (≥0.5 mg/kg/day) and lower (<0.5 mg/kg/day) initial dose of predniso(lo)ne [56]. With the aid of AZA as a maintenance therapy in the majority of patients (>85%), an initial lower dose significantly decreased the unnecessary exposure to predniso(lo)ne in patients with AIH. A synthetic steroid, i.e., budesonide has been shown to cause less systemic adverse effects, due to a 90% first-pass hepatic clearance rate. The AASLD investigated whether prednisone or predniso(lo)ne alone or in combination with AZA was superior to a combination of budesonide and AZA as the first-line treatment for patients with newly diagnosed AIH [1]. With an accompanying systemic review and meta-analysis, the AASLD demonstrated a higher rate of biochemical remission in the budesonide + AZA group compared to the prednisone + AZA group (odds ratio, 2.19; 95% CI, 1.30–3.67), and they described this finding as high-grade evidence [57]. Accordingly, the AASLD suggests budesonide in combination with AZA as a first-line therapy for child and adult AIH patients who do not have cirrhosis or acute severe AIH [1]; patients with cirrhosis are contraindicated for budesonide because portosystemic shunting may reduce the drug’s efficacy. The combination of AZA and either predniso(lo)ne or budesonide is now regarded as the most standard first-line therapy in western countries. Prednisone monotherapy, on the other hand, is likely to be appropriate for patients including those with DIAIH-like injury in whom the treatment duration is expected to be <6 months [1]. As corticosteroids are still the mainstay of the first-line treatment of AIH, the maintenance of bone during treatment is needed to limit treatment-related osteoporosis in patients with ongoing risk factors [58]. Bone mineral densitometry should be completed at baseline in those patients with repeated check-up every 2–3 years and supplementation with elemental calcium (1,000–1,200 mg/day) and vitamin D (400–800 IU/day) are recommended for all patients on glucocorticoid therapy [1,59]. Simultaneous bisphosphonate therapy is indeed indicated for patients with documented osteoporosis [60]. The determination of serum levels of 25-hydroxyvitamine D at diagnosis is justifiable, because vitamin D insufficiency (≤29 ng/mL) occurs frequently in patients with AIH (68–81%) [61,62] and even severe deficiency (<20 ng/mL) was reported to be documented in 20% of patients [62]. Second line-treatments The aims of second-line treatments for AIH are to manage refractoriness, incomplete biochemical response, and drug intolerance to first-line treatments (Figs. 2, 3). Anecdotally, second-line treatments have been performed with mycophenolate mofetil (MMF), calcineurin inhibitors (cyclosporin A, tacrolimus [TAC]), mercaptopurine, and biologics (e.g., infliximab). MMF is a DNA synthesis inhibitor and is indicated for immunosuppression after organ transplant or lupus nephritis. In a meta-analysis, the combination of MMF + prednisone was shown to be the most widely prescribed second-line treatment, achieving histological remission in 89% of the patients [63]. A recent report confirmed the effectiveness of MMF as a second-line therapy for patients who have failed standard therapy; the rate of induction of biochemical remission was 60% [64]. The AASLD performed a systemic review to compare the efficacies of MMF and TAC for treatment failure or incomplete biochemical response in adults and children: the AASLD 2019 conditional recommendation with low certainty suggests the use of MMP or TAC to achieve and maintain biochemical remission [1]. Exacerbation, recrudescence, and relapse During the course of maintenance therapy with corticosteroids/AZA, a substantial number of AIH patients spontaneously and asymptomatically experience biochemical exacerbation or recrudescence, i.e., an elevation of ALT coupled with or without an increase in IgG. The 2019 AASLD practice guidance and guidelines strictly define “relapse” as disease exacerbation that occurs after remission and drug withdrawal or by nonadherence [1]. Multiple relapses have been shown to be associated with worse outcomes [51], but the definitions of relapse in the literature differ from that issued by the AASLD, including the concept that biochemical remission may not have proceeded relapse. Following the AASLD rules regarding biochemical remission-induction with first-line or even second-line drugs could result in fewer exacerbations. Relapse after drug withdrawal (which usually occurs within 12 months) and exacerbation should be managed appropriately to induce re-(biochemical) remission with an increase in dosage or the reinstitution of immunosuppressive agents, or with the add-on of second-line drugs. In a case-control study, psychological stress was associated with relapse after drug taper-off or recrudescence [65]. Treatment withdrawal If AIH is a curable disease, the cessation of immunosuppressive agents is desirable. Could the cure for AIH be diagnosed based on serum biochemistry and liver histology, or both? Is the cure achievable in specific subgroups of patients? The answers to these clinical questions involve the feasibility of treatment withdrawal and simultaneously pursuing the lowest risk of drug-induced complications. Clinically, the duration and the degree of remission are the initial keys to the success of treatment withdrawal. A sustained biochemical remission of ≥2 years was proposed by the AASLD as the eligibility criterion for attempting a treatment withdrawal (Fig. 3) [1], in part because the inclusion of patients with only normalized ALT for 2 years resulted in almost universal relapse [66]. A further patient selection step should be included based on liver biochemistry, and/or on liver histology. Lower ALT and IgG values within the normal range were reported to be negative predictors of relapse; patients who achieved sustained remission for >1 year after drug withdrawal were all characterized by ALT values ≤0.5× ULN and IgG values ≤1,200 mg/dL [67]. Maintenance therapy before withdrawal was not associated with relapse: >80% of the patients were treated with AZA alone. A single-center study demonstrated that only 10% of their patients were eligible for treatment withdrawal and 5% reached sustained remission without treatment [67], highlighting AIH as generally a chronic disease demanding life-long maintenance therapy. Stringent biochemical remission for >2 years along with sustained low values of VCTE measured with an appropriate cut-off, may identify the patients who are at low risk of decompensation even when relapse occurs after treatment withdrawal. LT AIH with decompensated cirrhosis or ALF is indicated for LT. Among the listing of the Scientific Registry of Transplant Recipients (2002–2019) in the USA, 3.3% had AIH as the primary etiology [68]. In the trend analysis of the etiology of the Registry’s non-hepatocellular carcinoma LT listings, the rate of AIH during that period was stable. In the prospective multicenter European Liver Transplant Registry (1998–2017), the overall survival of patients after AIH-LT was reported to be similar to that of patients after alcohol-related cirrhosis-LT, but worse than that after PBC-LT and PSC-LT [69]; the 5- and 10-year patient and graft survival rates after AIH-LT were 79.4% and 70.8% and 73.25% and 63.4%, respectively. Compared to all of the other groups, the AIH-LT patients were at higher risk for infections—especially lethal fungal infections resulting in death and graft loss [69]. In AIH, living donor transplantation provided worse survival than that by donated LT after brain death [69]. The appropriateness of long-term glucocorticoid therapy after LT remains a matter of debate, in part because acute, steroid-resistant, and chronic rejection occurred more frequently in adult AIH patients who underwent LT compared to patients with other liver diseases [70], and also because of the chance of recurrence after LT [71]. A systemic review and meta-analysis of continuous glucocorticoid therapy in AIH-LT patients by the AASLD suggests that a gradual cessation of glucocorticoids could be considered after LT, with very low certainty [1]. UNMET NEEDS AND FUTURE PERSPERSPECTIVES The topics not addressed in this review include genetics, potential therapeutics based on the current understanding of the immune-pathogenesis of AIH, the inequity of AIH disease management worldwide, and patient-reported outcomes highlighted by the health-related quality of life. For example, the marked disparity in the prevalence of cirrhosis around the world, exemplified by the very high rate in South Asia [72], should be evaluated based on determinations of the patients’ genetic backgrounds and managed by the standardization of diagnosis and treatment. Improvements are anticipated regarding the accessibility to the flowchart of AIH diagnosis, with special attention to the differential diagnosis from emerging pandemic NASH. At the same time, the health-related quality of life of AIH patients, which was reported to be severely impaired [73-75], must be evaluated for future improvement from the standpoint of personalized management including appropriate first-line therapy even with potential therapeutics, and by the prediction of the success of treatment withdrawal. Using a multifaceted approach, we hepatologists are encouraged to achieve AIH patients’ total wellness.
|
|
Scooped by
Gilbert C FAURE
December 14, 2020 2:50 PM
|
In 2020 a number of clinical trials have provided insights into therapeutic approaches for the treatment of anti-neutrophil cytoplasmic autoantibody (ANCA)-associated vasculitis and lupus nephritis. Moreover, mechanistic insights have potential to open new therapeutic strategies in the future.
|