Your new post is loading...

|
Rescooped by
Gilbert C FAURE
from Virus World
January 5, 5:31 AM
|
Aberrant immune responses to viral pathogens contribute to pathogenesis, but our understanding of pathological immune responses caused by viruses within the human virome, especially at a population scale, remains limited. We analyzed whole-genome sequencing datasets of 6,321 Japanese individuals, including patients with autoimmune diseases (psoriasis vulgaris, rheumatoid arthritis (RA), systemic lupus erythematosus (SLE), pulmonary alveolar proteinosis (PAP) or multiple sclerosis) and coronavirus disease 2019 (COVID-19), or healthy controls. We systematically quantified two constituents of the blood DNA virome, endogenous HHV-6 (eHHV-6) and anellovirus. Participants with eHHV-6B had higher risks of SLE and PAP; the former was validated in All of Us. eHHV-6B-positivity and high SLE disease activity index scores had strong correlations. Genome-wide association study and long-read sequencing mapped the integration of the HHV-6B genome to a locus on chromosome 22q. Epitope mapping and single-cell RNA sequencing revealed distinctive immune induction by eHHV-6B in patients with SLE. In addition, high anellovirus load correlated strongly with SLE, RA and COVID-19 status. Our analyses unveil relationships between the human virome and autoimmune and infectious diseases. Analysis of the blood DNA virome in patients with COVID-19 and autoimmune disease associates endogenous HHV-6 (eHHV-6) and high anellovirus load with increased disease risk, most notably for systemic lupus erythematosus. eHHV-6 carriers show a distinct immune response. Published in NAt. Genetics (Jan. 3, 2025): https://doi.org/10.1038/s41588-024-02022-z
Via Juan Lama
|
|
Scooped by
Gilbert C FAURE
February 20, 2024 4:50 AM
|
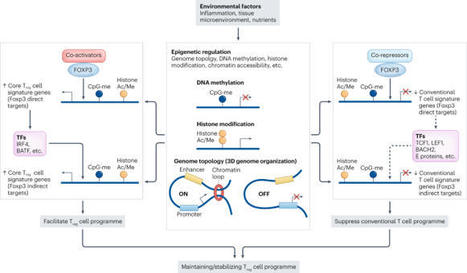
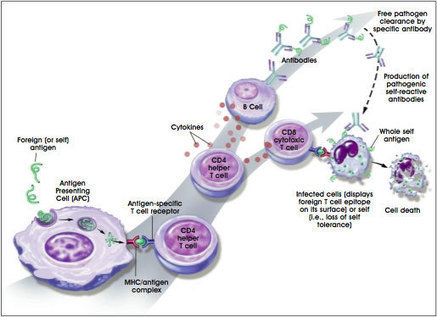
The discovery of FOXP3+ regulatory T (Treg) cells as a distinct cell lineage with a central role in regulating immune responses provided a deeper understanding of self-tolerance. The transcription factor FOXP3 serves a key role in Treg cell lineage determination and maintenance, but is not sufficient to enable the full potential of Treg cell suppression, indicating that other factors orchestrate the fine-tuning of Treg cell function. Moreover, FOXP3-independent mechanisms have recently been shown to contribute to Treg cell dysfunction. FOXP3 mutations in humans cause lethal fulminant systemic autoinflammation (IPEX syndrome). However, it remains unclear to what degree Treg cell dysfunction is contributing to the pathophysiology of common autoimmune diseases. In this Review, we discuss the origins of Treg cells in the periphery and the multilayered mechanisms by which Treg cells are induced, as well as the FOXP3-dependent and FOXP3-independent cellular programmes that maintain the suppressive function of Treg cells in humans and mice. Further, we examine evidence for Treg cell dysfunction in the context of common autoimmune diseases such as multiple sclerosis, inflammatory bowel disease, systemic lupus erythematosus and rheumatoid arthritis. In this Review, the authors discuss the origins of regulatory T (Treg) cells in the periphery and the mechanisms by which Treg cells are induced, as well as the regulation of the suppressive function of these cells. Moreover, they examine evidence for and mechanisms of Treg cell dysfunction in common autoimmune diseases such as multiple sclerosis, inflammatory bowel disease, systemic lupus erythematosus and rheumatoid arthritis.
|
|
Scooped by
Gilbert C FAURE
October 1, 2023 5:30 AM
|
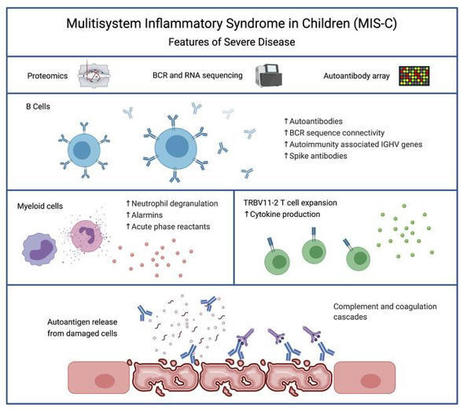
Severe MIS-C patients exhibit hyperinflammation and cytokine storm. Our MIS-C cohort was composed of 7 patients with mild MIS-C and 20 patients with severe MIS-C (Table 1). MIS-C diagnosis was performed according to CDC guidelines, and patients who required treatment in the pediatric ICU were defined as severe MIS-C patients. We first compared circulating biomarkers of inflammation and heart failure, and cytokine profiles of severe and mild MIS-C patients. Both mild and severe MIS-C patients showed elevated levels of C-reactive protein (CRP), ferritin, fibrinogen, pro–B-type natriuretic peptide (proBNP), aspartate transaminase, alanine transaminase (ALT), D-dimers, and creatine compared with normal reference ranges (Supplemental Figure 1A; supplemental material available online with this article; https://doi.org/10.1172/JCI151520DS1). Severe MIS-C cases showed significantly higher levels of ferritin, proBNP, D-dimers, and creatine, and a trend toward increased levels of CRP, ALT, and fibrinogen compared with mild MIS-C patients (Supplemental Figure 1A). Table 1Patient demographics We next assessed and compared the circulating cytokine profiles of healthy controls, mild MIS-C, and severe MIS-C patients. MIS-C patients showed increased levels of IFN-γ, TNF-α, IL-6, IL-8, IL-10, and IL-1β, with severely ill patients showing stronger dysregulation than those with milder courses (Supplemental Figure 1B). Since some of the clinical symptoms of MIS-C, such as erythematous rashes, conjunctivitis, and inflammatory changes in the oral mucosa are suggestive of Kawasaki disease (KD), we also characterized the cytokine profiles of 7 KD patients who were recruited before the COVID-19 pandemic (Supplemental Figure 1B). KD diagnosis was performed according to the established American Heart Association guidelines (20). Except for IL-8, which appeared less dysregulated in KD, the overall cytokine pattern was similar in MIS-C and KD (Supplemental Figure 1B). Proteomic analysis identifies a highly inflammatory proteomics profile in MIS-C. To assist in the elucidation of the pathogenesis of MIS-C and to identify proteins associated with the severe form of the disease, we performed proteomics analysis of serum or plasma samples from our study cohort (Figure 1A). We collected serum from healthy children (n = 20), mild MIS-C patients (non-ICU, n = 5), and severe MIS-C patients who required ICU treatment (n = 20). We also included analysis of plasma samples from KD patients that were collected prior to the pandemic (n = 7; Table 1). Healthy adult serum (n = 4) was used for reference range quality control. To obtain a high resolution of protein expression we performed discovery proteomics analysis on native and depleted (top 14 most abundant proteins) serum or plasma samples (ref. 21, Figure 1B, and Supplemental Figure 2A). Both data sets were integrated at the transition, peptide, and protein level. As plasma was used for KD samples, clotting factors (Supplemental Figure 2B) were removed from the data set for any downstream analysis involving the KD group. Principal component analysis (PCA) (Figure 1B) and hierarchical clustering (Figure 1C) showed that the MIS-C and KD proteomes clustered separately from healthy controls. Similar to our cytokine analysis, MIS-C and KD showed similar protein profiles, indicating that shared pathological pathways likely exist between the diseases (Figure 1, B and C). The major proteins contributing to dimension 1 of the PCA plot, which separates disease samples (MIS-C and KD) from the healthy controls, included inflammatory markers and alarmins such as SERPINA3, CRP, haptoglobin (HP)/zonulin, LPS-binding protein (LBP), CD14, S100A8 and S100A9 (Figure 1B and Supplemental 2C). Figure 1Proteomic profiling of MIS-C cases. (A) Experimental design of native and depleted serum proteomics profiling of healthy controls (n = 20), mild MIS-C (n = 5), severe MIS-C (n = 20), and KD (n = 7) patients. (B) PCA of proteomics data and top proteins contributing to dimension 1 of the PCA plot. (C) Heatmap and hierarchical clustering of proteomics expression data revealed 3 protein sets (C1, C2, and C3) driving separation between 3 clades of MIS-C and KD patients (sample clusters S1, S2, and S3). (D) ClueGO ontology analysis via PINE (Protein Interaction Network Extractor) for visualization of pathways and functional categories significantly enriched within each of the 3 protein sets (C1, C2, and C3) revealed by hierarchical clustering analysis in panel C. The x axis denotes the negative decimal logarithm of the FDR of enrichment (term P value corrected with Bonferroni’s test). Size of the node denotes number of proteins within each term. Protein Interaction Network Extractor (PINE; ref. 22) analysis of differentially expressed proteins between the groups revealed an enrichment of protein networks involved in multiple inflammatory processes and pathways, including neutrophil degranulation, platelet activation, complement and coagulation cascades, phagocytosis, angiogenesis, acute-phase responses, oxidative stress, metabolism, and cell migration and adhesion (Supplemental Figure 2D). Hierarchical clustering analysis led to the identification of 3 main clusters of disease samples, sample clusters S1, S2, and S3 (Figure 1C). A large set of proteins (protein cluster 1, C1) were upregulated in both KD and MIS-C, most strikingly in sample clusters S1 and S2, compared with healthy controls (Figure 1C). Functional annotation analysis revealed that this cluster was enriched with proteins involved in leukocyte-mediated immunity, neutrophil-mediated immunity, humoral immune responses, and extracellular matrix (Figure 1D and Supplemental Figure 3A). Functional annotation analyses revealed that a second set of proteins (C2) enriched in sample cluster S2 included proteins associated with platelet activation and aggregation, myofibrils, and smooth muscle cell contraction (Figure 1D and Supplemental Figure 3B). Proteins in C3 were upregulated exclusively in sample cluster S1, mostly severe MIS-C patients, and included heavy and light chain immunoglobins (Igs), as well as components of the classical complement cascade, C1qA, C1qB, and C1qC (Figure 1D and Supplemental Figure 3C). Proteomic characterization reveals biomarkers that differentiate severe MIS-C from mild disease and from KD. We next sought to identify proteins and associated pathways upregulated or downregulated in severe MIS-C and mild MIS-C patients compared with healthy controls (Figure 2 and Supplemental Figure 4). We identified 244 proteins increased and 135 proteins decreased in quantity in severe MIS-C compared with healthy controls (top 25 modulated proteins; Figure 2, A and B). Network and pathway analysis of significantly increased (Figure 2, C and D) or decreased (Figure 2, E and F) proteins revealed that humoral immune responses and complement pathways were highly enriched in severe MIS-C, including various Igs and C1q proteins, C1qA, C1qB, and C1qC (Supplemental Figure 5, A and B). The expression of proteins associated with platelet activation and coagulation pathways, including von Willebrand factor (VWF), F5, F9, F11, fibrinogen α and β chains (FGA and FGB), and SERPINF2, was also increased in severe MIS-C compared with healthy controls (Supplemental Figure 5, A and B). Fc receptor signaling, neutrophil-mediated responses, and phagocytosis pathways were also enriched in severe MIS-C. These include FCGR3A (CD16a), IgGFc-binding protein (FCGBP), calprotectin (S100A8 and S100A9), tissue inhibitor of metalloproteinases 1 (TIMP1), SERPINA1, SERPINA3, and acute-phase-reactant leucine-rich α2-glycoprotein 1 (LRG1) (Supplemental Figure 6, A and B, and Supplemental Figure 2C). Proteins involved in VEGF signaling and smooth muscle cell contraction were increased in severe MIS-C, including ICAM1, tropomyosin 4 (TPM4), p21-activated kinase (PAK2), FGA, FGB, and filamin B (FLNB) (Supplemental Figure 6C and Supplemental Figure 5B). As these proteins are highly expressed in vascular smooth muscle cells, their presence in the serum may reflect release from damaged blood vessels. Overall, the proteins and pathways increased in severe MIS-C indicate Ig-mediated inflammatory responses and endothelial dysfunction. Figure 2Characterization of severe MIS-C. Protein expression was compared between severe MIS-C (n = 20) and healthy controls (n = 20). Proteins were considered significantly changed when FDR was less than 0.05, as determined by mapDIA statistical software for protein differential expression using MS/MS fragment-level quantitative data. (A) Top proteins enhanced in severe MIS-C, ranked by fold change. (B) Top proteins reduced in severe MIS-C, ranked by fold change. (C) ClueGO Ontology analysis via PINE visualized a network of pathways and functional annotation terms enriched in a set of proteins significantly increased in severe MIS-C population when compared with healthy controls. (D) Selected pathways and functional annotation terms from PINE analysis of proteins increased in severe MIS-C when compared with healthy controls. (E) Network plots visualized via PINE analysis of proteins reduced in severe MIS-C group when compared with healthy controls. (F) Selected pathways and functional annotation terms from protein functional enrichment analysis of proteins reduced in severe MIS-C group when compared with healthy controls. Networks of proteins reduced in severe MIS-C revealed pathways involved in regulation of lipid transport, lipid metabolic processes, and lipoprotein clearance, including APOA1, APOA2, APOA4, APOC1, and APOM (Figure 2, E and F, and Supplemental Figure 6D). Some components of clotting and coagulation pathways were also downregulated in severe MIS-C compared with healthy controls (Figure 2, E and F, and Supplemental Figure 5A). Furthermore, there was downregulation of proteins involved in the regulation of body fluids and relaxation of cardiac muscle, including CAMK2D, which aligns with the increase in proBNP and the cardiovascular manifestations and shock observed in MIS-C (Figure 2, E and F, and Supplemental Figure 6E). To determine factors contributing to severe disease, we compared severe MIS-C with mild MIS-C (Figure 3). We found that the expression of 75 proteins was significantly enhanced in severe MIS-C, while 61 proteins were significantly reduced when compared with mild MIS-C. Selected proteins differentially expressed between MIS-C severity groups are presented in Figure 3A. Compared with mild MIS-C, severe MIS-C patients had increased levels of proteins involved in pathways that included proteolysis, classical complement cascade, coagulation, acute-phase response, and inflammation (Figure 3, A and B, and Supplemental Figure 7). These included CRP, S100A9, SAA1, SAA2, STAT3, FCGR3A, LBP, CD163, ORM1, SERPINA1, SERPINA3, TIMP1, TLN-1, VWF, various Igs, and components of the C1 complex of the complement system (C1qA, C1qB, and C1qC) (Supplemental Figures 2C, 5B, 6B, and 7). In contrast, severe MIS-C patients had reduced expression of proteins in pathways, including negative regulators of peptidase activity, extracellular matrix proteoglycans, complement and coagulation cascades, and high-density lipid protein remodeling (Supplemental Figure 8, A and B). Figure 3Proteins distinguishing severe MIS-C from mild disease and KD. Protein differential expression analysis was performed between severe MIS-C (n = 20) and mild MIS-C (n = 5) groups. Proteins were considered significantly changed when FDR was less than 0.05 as calculated by mapDIA statistical software. (A) Bar graphs show top increased and top decreased proteins in severe MIS-C when compared with mild, ranked by fold change and excluding Igs. (B) Selected pathways and functional annotation terms from protein functional enrichment analysis facilitated by PINE software using proteins increased (top panel) and decreased (bottom panel) in severe MIS-C compared with mild MIS-C. (C) Venn diagram of proteins differentially regulated between severe MIS-C, mild MIS-C, and KD. (D) Heatmap of selected proteins distinguishing severe MIS-C from mild MIS-C and KD. (E) Box-and-whisker plots of selected proteins found increased in severe MIS-C compared with mild MIS-C and KD. For improved visualization purposes, box-and-whisker plots show scaled protein expression values. Scaling was performed by mean centering and division by SD of each protein variable. For box-and-whisker plots, the bounds of the boxes represent IQR (Q1 to Q3) and the whiskers represent the nonoutlier minimum and maximum values, 1.5 × IQR. The median values are marked with a horizontal line in the boxes, and outliers are marked with black centered points outside the whiskers. Statistical analysis was calculated by mapDIA statistical software for protein differential expression using MS/MS fragment-level quantitative data. **P < 0.01, ***P < 0.001. NS, not significant. Next, we aimed to determine which proteins distinguished severe MIS-C from mild MIS-C and KD (Figure 3, C–E), excluding clotting factors. Among proteins of interest, ferritin light chain (FTL) was highly expressed in severe MIS-C, as were proteins involved in Ig-mediated immune activation, including FCGR3A and components of the classical complement cascade, C1qA, C1qB, and C1qC (Figure 3E). Proteins that have been associated with heart failure were also identified as enhanced in severe MIS-C, including tenascin C (TNC; ref. 23) and QSOX1 (24) (Figure 3, D and E). Proteins with reduced expression in severe MIS-C were also identified and included histidine-rich glycoprotein (HRG), sex hormone–binding globulin (SHBG), and complement component 7 (C7) (Figure 3, D and E). Overall, the proteomic profiles of MIS-C and KD were similar, indicating shared pathogenic pathways. However, distinguishing proteins indicate MIS-C may be mediated more so by immune complexes, and have greater heart muscle involvement than KD. These proteins have potential to act as biomarkers to distinguish severe MIS-C from mild MIS-C or KD. RNA-seq reveals a subgroup of hyperinflammatory MIS-C patients with enhanced myeloid responses, TRBV11-2 expansion, and SARS-CoV-2–specific antibodies. We performed RNA-seq analysis using RNA isolated from whole blood of febrile controls (n = 13), mild MIS-C (n = 4), and severe MIS-C patients (n = 8; Figure 4A). Hierarchical clustering and PCA demonstrated 2 subsets of MIS-C patients (Figure 4B and Supplemental Figure 9A). The first subset of MIS-C patients clustered separately (cluster 1) from febrile controls, while the other overlapped with febrile controls (cluster 2; Figure 4B). Cluster 1 consisted predominantly of severe MIS-C patients (5 severe and 1 mild), while cluster 2 contained an equal number of severe and mild MIS-C patients (3 severe and 3 mild; Figure 4B). Analyses revealed a large set of genes differentially expressed between the 2 MIS-C clusters (2895 genes upregulated and 2921 genes downregulated in cluster 1, FDR < 0.05, fold change [FC] > 2). The top 20 genes up- and downregulated in cluster 1 are presented in Figure 4C. Functional annotation analysis revealed that genes with increased expression in cluster 1 were involved in macrophage activation, neutrophil chemotaxis, innate signaling pathways, T cell activation, cytokine signaling, complement pathways, response to wounding, and apoptosis (Figure 4D and Supplemental Figure 9B). Cell deconvolution analysis identified increased relative abundance of neutrophils in cluster 1 MIS-C samples (Figure 4E). Genes with reduced expression in cluster 1 were involved in adaptive immune responses, as well as ribonucleoprotein complexes and RNA processing (Figure 4, C and D, and Supplemental Figure 9C). In line with these findings, cell deconvolution analysis revealed a reduction in adaptive immune cells in cluster 1, most strikingly a reduction in naive B cells, which may reflect lymphopenia that is observed in MIS-C (Figure 4E). Figure 4RNA-seq analysis of MIS-C. RNA-seq was performed using whole-blood RNA isolated from febrile controls (n = 13), mild MIS-C (n = 4), and severe MIS-C (n = 8) patients. (A) Experimental design of RNA-seq analysis and patient groups. (B) PCA of RNA-seq profiles. (C) Genes up- or downregulated in cluster 1 vs. cluster 2 MIS-C patients (FDR < 0.05). (D) Selected pathways and functional annotation terms from gene functional enrichment analysis performed with PINE software using significantly up- and downregulated (FDR < 0.01, log2[FC] > 1.5 and < –1.25) genes in cluster 1 vs. cluster 2 MIS-C patients. (E) Cell deconvolution analysis of RNA-seq data by CIBERSORT. (F) Top proteins increased in cluster 1 vs. cluster 2, based on proteomics data. (G) Enriched pathways and functional annotation terms based on protein expression changes significantly (FDR < 0.05) upregulated in cluster 1 with respect to cluster 2. (H) TRBV11-2 expansion of RNA-seq samples (17). (I) IgG titers against Spike protein receptor binding domain (RBD). Data are presented as mean ± SEM. Statistical significance was determined by Mann-Whitney test (H and I). We next compared the proteomes of cluster 1 with cluster 2 patients (Figure 4, F and G, and Supplemental Figure 9, D and E). Cluster 1, which was primarily severe MIS-C cases, was characterized by significantly enhanced expression of inflammatory markers, including CRP, SAA1, and SAA2, as well as proteins associated with neutrophil activation, including myeloperoxidase (MPO), lipocalin 2 (LCN2), cathepsin B (CATB), ICAM1, granulin (GRN), and LBP (Figure 4F). In line with this, pathway analysis of protein expression in cluster 1 identified an enrichment of neutrophil-mediated responses (Figure 4G). Analysis of proteins and pathways downregulated in cluster 1 identified lipoprotein-particle proteins, including APOA1 and APOA4 (Supplemental Figure 9, D and E), which were also observed as downregulated in severe MIS-C compared with mild MIS-C or healthy controls (Supplemental Figure 6D). Interestingly, we found a reduction in complement and coagulation cascade protein pathways in cluster 1 compared with cluster 2 (Supplemental Figure 9, D and E). Since complement pathways were identified as increased in cluster 1 by transcriptomics (Figure 4D), we analyzed the correlation between the direction of protein expression and gene expression changes when comparing cluster 1 with cluster 2 (Supplemental Figure 10A). We did not find a significant correlation between protein and gene expression changes, likely because for a subset, the gene expression and protein expression changes occurred in opposite directions (increased by gene expression yet decreased by protein expression in cluster 1). Functional annotation analysis showed that these genes/proteins, including C5, C3, C4BP, HP, F12, F5, and PF4, were enriched in complement and coagulation cascades (Supplemental Figure 10B). The increased gene expression but decreased protein expression of this subset may indicate excessive activation and consumption of these molecules. Interestingly, a reduction in C3 protein has also been observed in COVID-19 nonsurvivors compared with survivors (25). We previously identified TRBV11-2 skewing in MIS-C patients, which correlated with disease severity and cytokine storm (17). As this study utilizes the same patient samples, we compared TRBV11-2 usage between the 2 MIS-C clusters identified by RNA-seq analysis (Figure 4B). The patients with TRBV11-2 expansion were restricted to cluster 1, which contained primarily severe MIS-C patients (Figure 4H). We also examined titers of antibodies against Spike protein between the 2 groups and found that cluster 1 MIS-C patients had higher levels of anti-Spike IgG antibodies than patients in cluster 2 (Figure 4I). This is similar to observations in adult COVID-19 patients, in which increased antibody titers against SARS-CoV-2 are associated with disease severity (26). Overall, these data indicate that the patients in MIS-C cluster 1 exhibited increased inflammatory makers, increased neutrophil responses, reduced lymphocytes, increased SARS-CoV-2 antibodies, and TRBV11-2 T cell expansion. MIS-C autoantibodies are targeted to a diverse set of intracellular autoantigens and are enhanced in MIS-C cluster 1 patients. We next sought to characterize the levels of autoantibodies in our patient cohort and determine how these relate to the hyperinflammatory cluster 1 identified by RNA-seq analysis. Autoantibody analysis was performed using the HuProt array (CDI Labs) with serum from febrile controls (n = 5) and MIS-C patients (n = 11: 3 mild and 8 severe). The MIS-C patient group included 6 samples identified by RNA-seq as belonging to cluster 1, and 5 MIS-C samples from cluster 2 (Figure 5A). Candidate autoantibody targets were identified (P < 0.05, FC > 2) based on differential expression analysis of MIS-C samples, or RNA clusters, compared with febrile controls (Figure 5, B and C). Figure 5Autoantibody analysis of MIS-C. (A) Autoantibody analysis was performed on serum from febrile controls (n = 5) and MIS-C patients (n = 11) using HuProt array. MIS-C samples correspond to RNA cluster 1 (n = 6) and RNA cluster 2 (n = 5) identified in Figure 4. (B) Venn diagram of candidate IgG autoantibody targets in MIS-C and RNA clusters (P < 0.05, FC > 2). (C) Venn diagram of candidate IgA autoantibody targets in MIS-C and RNA clusters (P < 0.05, FC > 2). (D) IgG autoantibody targets identified in MIS-C (n = 11) compared with febrile controls (n = 5). The bar represents log2(FC). Each symbol represents 1 MIS-C patient presented as log2(FC) above the mean of febrile controls. (E) IgA autoantibody targets identified in MIS-C (n = 11) compared with febrile controls (n = 5). The bar represents log2(FC). Each symbol represents 1 MIS-C patient presented as log2(FC) above the mean of febrile controls. (F) IgG autoantibody targets separated based on RNA cluster 1 (n = 6) and RNA cluster 2 (n = 5). Data are presented as log2(FC) above the mean of febrile controls. (G) IgA autoantibody targets separated based on RNA cluster 1 (n = 6) and RNA cluster 2 (n = 5). Data are presented as log2(FC) above the mean of febrile controls. For box-and-whisker plots, the bounds of the boxes represent the interquartile range (IQR, Q1 to Q3) and the whiskers represent the minimum and maximum values. The median values are marked with a horizontal line within the box. *FDR < 0.05 compared with febrile controls. While the majority of IgG autoantibodies that significantly increased in MIS-C compared with febrile controls were targeted to ubiquitously expressed antigens, we identified a number of tissue-specific antigens from the GI tract and cardiovascular, skeletal muscle, and brain tissues, reflecting the systemic nature of MIS-C and the involvement of specific organs in clinical presentation of disease (Figure 5D). GI tract autoantigens included ATPase H+/K+-transporting α subunit (ATP4A), SRY-box 6 (SOX6), family with sequence similarity 84 member A (FAM84A), and RAB11 family interacting protein 1 (RAB11FIP1) (Figure 5D). Cardiovascular autoantigens included PDZ and LIM domain 5 (PDLIM5) and eukaryotic translation initiation factor 1A, Y linked (EIF1AY) (Figure 5D). Skeletal muscle autoantigens included RNA-binding motif protein 38 (RBM38) and skeletal troponin C2 (TNNC2) (Figure 5D). Brain autoantigens included microtubule-associated protein 9 (MAP9) and NSF attachment protein β (NAPB). Interestingly, several antigens highly expressed in neutrophils were identified, including endothelin-converting enzyme 1 (ECE1), SOX6, and RAB11FIP1 (Figure 5D). Autoantibodies were predominantly targeted to intracellular antigens, suggesting they may result from a secondary immune response to cell damage. We identified 3 IgA autoantibodies that were significantly increased in MIS-C compared with febrile controls, namely FAM84A, which is highly expressed in GI tissues, TNNC2, which, as mentioned above is highly expressed in skeletal muscle, and guanylate-binding protein family member 6 (GBP6) (Figure 5E). FAM84A and TNNC2 were significantly increased in RNA cluster 1, but not RNA cluster 2, compared with febrile controls. We next examined how the 2 RNA clusters differed in autoantibody responses (Figure 5, F and G). Overall, patients in RNA cluster 1 had greater autoantibody responses than those in RNA cluster 2 (Figure 5, B and C), with the largest differences identified in IgG autoantibodies against ATP4A, UBE3A, FOXK2, SATB1, and MAOA (Figure 5F), and in IgA autoantibodies against FAM84A (Figure 5G). Overall, our data suggest systemic tissue damage and cell death may contribute to excessive antigenic drive against a diverse set of tissue-specific and ubiquitously expressed antigens. The enhanced levels of autoantibodies in RNA cluster 1 link autoantibody development to hyperinflammation, myeloid cell activation, lymphopenia, increased SARS-CoV-2 antibodies, and TRBV11-2 T cell expansion. Patients belonging to RNA cluster 1 show BCR repertoires with highly connected networks of CDR3 sequences. To further study B cell repertoire metrics and antigenic selection in our cohort, we performed BCR-seq on extracted RNA from blood samples of patients with mild (n = 4) or severe (n = 8) MIS-C, and age-matched febrile control patients (n = 15). We found a trend toward higher richness and a lower fraction of antigen-experienced B cells with somatic hypermutation in MIS-C patients than in febrile control patients. However, repertoire richness was distributed quite heterogeneously across patients, and the high richness pattern appeared to apply more to the small group of individuals with mild MIS-C without reaching statistical significance due to the small group size (Supplemental Figure 11). These distinct immune metrics were observable in all Ig chains — heavy chain (IGH) as well as κ (IGK) and λ (IGL) light chains — arguing in favor of the specificity of this finding. These findings were also consistent with the previously reported increased richness in T cell receptor repertoires in patients with mild MIS-C (17). Since our RNA-seq analysis revealed 2 clusters of MIS-C patients, with cluster 1 correlated with high levels of SARS-CoV-2 antibodies and autoantibodies as well as TRBV11-2 T cell expansion, we subdivided our MIS-C cohort into these clusters for the following analyses of BCR repertoires. Our aim was to determine imprints of (auto)antigenic selection or other B cell repertoire features that discriminate cluster 1 from cluster 2. MIS-C patients from cluster 1 showed lower B cell richness than febrile control patients and cluster 2 (Figure 6A), consistent with the contracted B cell compartment suggested by the transcriptome analysis of this cluster. Interestingly, although no differences in the level of somatic hypermutation were detectable between MIS-C patients of RNA cluster 1 and 2, the BCRs of all cluster 1 patients converged toward networks of highly similar CDR3 amino acid sequences (Figure 6B). The degree of connected sequences was significantly enriched in cluster 1 repertoires and comprised up to 99% of BCR clones when Levenshtein distances of 1 and 3 were used for network construction (Figure 6B). Thus, MIS-C patients in cluster 1 showed strong imprints of antigenic selection in their B cell repertoires. Figure 6B cell repertoire metrics, connectivity characteristics, and skewing of IGHV-J usage of MIS-C patients in RNA clusters 1 and 2. (A) Richness and somatic hypermutation of productive IGH repertoires of MIS-C patients of RNA cluster 1 (n = 5) and RNA cluster 2 (n = 6) compared with age-matched febrile control patients (n = 15). Bars indicate mean ± SD. Statistical analysis: ordinary 1-way ANOVA for global analysis and unpaired Student’s t test for paired comparison. (B) Petri dish plots of IGH repertoire networks of MIS-C patients of RNA cluster 1 and 2. A sample of 1000 unique CDR3 amino acid clones per repertoire were subjected to imNet network analysis (75). Petri dish plots are shown for Levenshtein distance 1. Percentages of connected sequences of MIS-C patients of RNA cluster 1 and 2 obtained from networks with Levenshtein distance 1 and 3 are shown as bar plots. Bars indicate mean ± SD. Statistical analysis: unpaired Student’s t test. (C) PCA of differential IGHV-J gene usage in MIS-C patients of RNA cluster 1 (n = 5) versus cluster 2 (n = 6) versus age-matched febrile controls (n = 15). Statistical analysis: Pillai-Bartlett test of MANOVA of all principal components. Frequencies per repertoire of the 10 most skewed IGHV genes in MIS-C and febrile control patients are shown as box-and-whisker plots. The boxes extend from the 25th to 75th percentiles, whiskers from minimum to maximum, and the line within the box indicates the median. (D) BAFF expression in MIS-C cluster 1 and cluster 2, using the RNA-seq data in Figure 5. Data are presented as mean ± SEM. (E) IL-6 and IL-10 levels in serum of MIS-C cluster 1 and cluster 2 patients, using cytokine data from Supplemental Figure 1. Data are presented as mean ± SEM. Statistical analysis: Mann-Whitney test (D and E). **P < 0.01. Higher frequency of autoantibody-associated IGHV genes IGHV4-34 and IGHV4-39 in MIS-C. The higher autoantibody levels in RNA cluster 1 patients prompted us to investigate whether specific IGHV sequences known to be involved in the formation of autoantibodies are overrepresented in this cluster. To globally investigate IGHV-J gene usage in RNA cluster 1 versus cluster 2, we studied the repertoires by PCA. This revealed a significant skewing of IGHV-J gene usage between cluster 1 and cluster 2 (Figure 6C). Among the genes preferentially used in B cell repertoires of patients from RNA cluster 1 was IGHV4-39, which has been previously reported to be used by autoreactive lymphocytes in multiple sclerosis (27, 28). Moreover, IGHV4-34, a gene extensively studied for its usage in autoreactive B cells (29), was preferentially used in B cells from MIS-C patients in general, with a numerically higher expansion in cluster 1 repertoires. Furthermore, IGHV1-69, which is preferentially used in autoreactive B cells (30, 31), was also overrepresented in cluster 1 (Figure 6C). We next asked which factors drive B lineage repertoires in MIS-C patients toward autoreactivity. The majority of patients from RNA cluster 1, where imprints of antigenic selection beyond SARS-CoV-2 reactivity were most obvious, showed superantigenic T cell interactions, which could be one driver promoting autoreactive B lymphocytes. The RNA transcriptomics data pointed to increased BAFF expression in RNA cluster 1, and cytokine analysis pointed to increased IL-6 and IL-10 levels in the serum (Figure 6, D and E). These results indicated that B cell dysregulation in MIS-C patients from RNA cluster 1 may not only be driven by superantigenic T cell interactions, but also by soluble factors derived from the pronounced myeloid/innate cell compartment in these patients.
|
|
Scooped by
Gilbert C FAURE
November 18, 2020 1:18 PM
|
Multiple sclerosis (MS) is a chronic autoimmune disease of the central nervous system (CNS), with characteristic inflammatory lesions and demyelination. The clinical benefit of cell-depleting therapies targeting CD20 has emphasized the role of B cells and autoantibodies in MS pathogenesis.
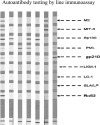
Abnormal liver function tests are frequently seen in patients with multiple sclerosis (MS) and their origin at times is attributed to the possible co-occurrence or the de novo induction of autoimmune liver diseases (AILD), namely autoimmune hepatitis (AIH) and primary biliary cholangitis (PBC), but comprehensive analysis of AILD-related autoantibody has not been carried out. To assess the presence of AILD-related autoantibodies in a well-defined cohort of MS patients, and to assess their clinical significance. 133 MS (93 female) patients (102 RRMS, 27 SPMS, and 5 PPMS), mean age 42.7 ± 11.9 SD years, mean duration of disease 11.2 ± 7.2 years were studied. 150 age and sex-matched healthy individuals were tested as normal controls (NCs).Autoantibody testing was performed by indirect immunofluorescence (IF) using triple tissue and HEp-2, a multiparametric line immunoassay detecting anti-LKM1(anti-CYP2D6), anti-LC1(anti-FTCD), soluble liver antigen/liver-pancreas(anti-SLA/LP), AMA-M2, and AMA-MIT3 (BPO), PBC-specific ANA (anti-gp210, anti-sp100 and anti-PML), and ELISA for anti-F-actin SMA and anti-dsDNA antibodies. Reactivity to at least one autoantibody was more frequent in MS patients compared to NCs (30/133, 22.6% vs 12/150, 8%) NCs (p = 0.00058). SMAs by IIF were more frequent in MS patients (18/133, 13.53%) compared to NCs (6/150, 4%, p = 0.002%). The AIH-1 related anti-F-actin SMA by ELISA were present in 21 (15.8%), at relatively low titres (all but three of the SMA-VG pattern by IF); anti-dsDNA in 3 (2.3%), and anti-SLA/LP in none; AIH-2 anti-LKM1 autoantibodies in 1 (0.8%, negative by IF), and anti-LC1 in none; PBC-specific AMA-M2 in 2 (1.5%, both negative for AMA-MIT3 and AMA by IF) and PBC-specific ANA anti-PML in 6 (4.5%), anti-sp100 in 1 (0.8%) and anti-gp210 in 1 (0.8%). Amongst the 30 MS patients with at least one autoantibody positivity, only 4 (3%) had overt AILD (2 AIH-1 and 2 PBC). Autoantibody positivity did not differ between naïve MS patients and patients under treatment. Despite the relatively frequent presence of liver autoantibodies, tested either by IF or molecular assays, overt AILD is rather infrequent discouraging autoantibody screening strategies of MS patients in the absence of clinical suspicion.
Via Krishan Maggon
|
|
Scooped by
Gilbert C FAURE
December 13, 2019 1:58 PM
|
Research ArticleAutoimmunityImmunology Free access | 10.1172/JCI126595 Autoreactive CD8+ T cell exhaustion distinguishes subjects with slow type 1 diabetes progression Alice E. Wiedeman,1 Virginia S. Muir,2 Mario G. Rosasco,2 Hannah A. DeBerg,2 Scott Presnell,2 Bertrand Haas,2 Matthew J. Dufort,2 Cate Speake,3 Carla J. Greenbaum,3 Elisavet Serti,4 Gerald T. Nepom,1,4 Gabriele Blahnik,1 Anna M. Kus,1 Eddie A. James,1 Peter S. Linsley,2 and S. Alice Long1 First published December 9, 2019 - More info Related video: CD8+ T cell function may predict type 1 diabetes progression Author's Take In this episode, Alice Long and colleagues demonstrate a link between disease outcome in type 1 diabetes and the phenotype and function of autoreactive CD8+ T cells. Abstract Although most patients with type 1 diabetes (T1D) retain some functional insulin-producing islet β cells at the time of diagnosis, the rate of further β cell loss varies across individuals. It is not clear what drives this differential progression rate. CD8+ T cells have been implicated in the autoimmune destruction of β cells. Here, we addressed whether the phenotype and function of autoreactive CD8+ T cells influence disease progression. We identified islet-specific CD8+ T cells using high-content, single-cell mass cytometry in combination with peptide-loaded MHC tetramer staining. We applied a new analytical method, DISCOV-R, to characterize these rare subsets. Autoreactive T cells were phenotypically heterogeneous, and their phenotype differed by rate of disease progression. Activated islet-specific CD8+ memory T cells were prevalent in subjects with T1D who experienced rapid loss of C-peptide; in contrast, slow disease progression was associated with an exhaustion-like profile, with expression of multiple inhibitory receptors, limited cytokine production, and reduced proliferative capacity. This relationship between properties of autoreactive CD8+ T cells and the rate of T1D disease progression after onset make these phenotypes attractive putative biomarkers of disease trajectory and treatment response and reveal potential targets for therapeutic intervention. Introduction Type 1 diabetes (T1D) is an organ-specific autoimmune disease that leads to the destruction of pancreatic islet β cells, resulting in glucose dysregulation and a life-long dependence on exogenous insulin treatment. This autoimmune process typically begins years prior to clinical diagnosis (stages 1–2) and involves humoral and cellular immune responses (1). Upon diagnosis (stage 3), most individuals with T1D retain some level of functioning β cells, as indicated by the presence of circulating C-peptide, a byproduct of endogenous insulin processing (2), and the preservation of these functional β cells is associated with fewer clinical complications (3). Yet, the rate of functional β cell loss following diagnosis varies among individuals (4, 5). A key question for the prediction and prevention of T1D and other autoimmune diseases is what factors contribute to the rate of disease progression. The character of the immune response probably plays a role in the rate of functional β cell loss following T1D diagnosis, as treatment with immune-modulating therapies results in short-term preservation of β cell function in some individuals (6). CD8+ T cells in particular influence T1D susceptibility and progression as clearly shown in mouse models (7–10), and islet-specific CD8+ T cells are detectable in the peripheral blood of individuals with T1D (11–15). Within the pancreas, CD8+ T cells are the most abundant lymphocyte of insulitic islets (16), and both polyclonal and islet-specific CD8+ T cells are more prevalent in the pancreas of individuals with T1D than in at-risk or healthy controls (HCs) (15, 17–19). In addition, some clues have emerged from responder analyses of immunotherapy clinical trials that implicate a role for CD8+ T cells. Partial exhaustion and central memory signatures of CD8+ T cells define responders in clinical trials of anti-CD3 (teplizumab) (20–23), and the frequency of memory islet-specific CD8+ T cells in peripheral blood increases with treatment (24, 25). Thus, islet-specific CD8+ T cells probably play an important role in T1D progression and outcome. However, these autoantigen-targeting cells remain poorly defined due in part to the technical difficulty of identifying and extensively phenotyping rare, low-affinity autoreactive T cells. Here, we took advantage of high-content, single-cell mass cytometry, or cytometry by time of flight (CyTOF), along with a combinatorial pooled peptide–loaded MHC tetramer (Tmr) staining approach (26) to identify and extensively phenotype antigen-specific CD8+ T cells. We also introduce DISCOV-R, an analytical solution for phenotypic classification of rare subpopulations. Leveraging these technologies and analytical tools in HCs and individuals with T1D allowed us to (a) assess the phenotypic heterogeneity of rare islet-specific cells in individual subjects, (b) define common phenotypes of islet-specific CD8+ T cells across subjects, and (c) relate islet-specific phenotypes to the disease progression rate. We found that islet-specific CD8+ T cells exhibited heterogeneous phenotypes in both HCs and subjects with T1D. The rate of disease progression in T1D subjects was linked to 2 shared phenotypes: an activated memory phenotype was more frequent among islet-specific cells of rapid progressors, whereas an exhaustion phenotype was more prevalent in slow progressors. The exhaustion phenotype was confirmed functionally and was not merely a consequence of more advanced age, disease state, or disease duration. Together, these data implicate the phenotype and function of autoreactive CD8+ T cells as key mechanisms underlying the rate of disease progression. Results In spite of the complex phenotypes and heterogeneity within autoreactive CD8+ T cells, approaches to analyze these rare T cell subsets in T1D typically utilize a small number of single-parameter values (11–15, 27). To address this issue, we generated a high-content CyTOF panel incorporating HLA class I tetramers to identify antigen-specific CD8+ T cells and additional markers of differentiation, activation, and exhaustion (Supplemental Table 1; supplemental material available online with this article; https://doi.org/10.1172/JCI126595DS1). Tmrs contained a pooled set of HLA-A*0201–restricted peptides derived from known islet-associated autoantigens (Supplemental Table 2). We tested an insulin peptide separately from other islet antigens, as the phenotype of reactive cells might be expected to differ in individuals with T1D exposed to exogenous insulin. For comparison, we also included Tmrs containing 2 epitopes associated with chronic viral infection (12). We identified antigen-specific CD8+ T cells using a modified combinatorial Tmr staining approach based on the method described by Newell et al. (26) (Supplemental Figure 1). In verifying Tmr staining by CyTOF, we found that the intensity of Tmr staining was generally greater for the virus-specific pool than for the islet-specific pool (Supplemental Figure 1D and Figure 1A) and that both the Tmr+ frequencies and the intensities of markers were highly reproducible (Supplemental Figure 2), as previously described with flow cytometric Tmr analysis (11–15). Figure 1 Islet-specific CD8+ T cells are dominated by three CXCR3+ memory phenotypes across subjects with T1D. The DISCOV-R analysis method was applied to total CD8+ and islet-specific T cells from subjects with T1D (n = 46); the T cells had been assayed with the Tmr-CyTOF panel. (A) Schematic of the DISCOV-R method (see Methods and Supplemental Figure 3 for details) for 1 individual. (B and C) Distribution of islet-specific cells across the 12 aligned clusters for subjects with at least 5 Tmr+ cells (n = 39). (B) Data are displayed as a stacked bar graph for each subject, colored by cluster. The 3 clusters that are most dominant among islet-specific cells across subjects (clusters 1, 11, and 12) have heavy outlining and are stacked at the bottom. (C) Clusters containing more than 20% islet-specific cells for an individual are indicated in black. Arrows indicate clusters predominant in at least 25% of the samples; the detached bottom row indicates the mean frequency of cells within a cluster for all individuals on a scale from 0% (white) to 20% or higher (black). (D) Heatmap of Z scores using arcsinh-transformed expression of 22 consistent markers (rows) for all individual clusters (columns) from all T1D subjects (n = 46), grouped into 12 aligned clusters (annotated with numbers and colors). Negative Z scores (aqua) represent underexpression, and positive Z scores (yellow) represent overexpression of markers in an individual cluster compared with the mean of expression intensity on total CD8+ T cells within a subject. Frequency of islet-specific (Tmr+) cells within an individual cluster is annotated above (white = 0%, black = 20%+). (E) Heatmap of the mean absolute arcsinh-transformed expression of 24 markers for the 3 islet-specific clusters and total CD8+ T cells. Expression intensity ranges from 0 (dark purple) to 4+ (yellow). We detected low numbers of autoantigen-specific events for Tmr+ cells analyzed by CyTOF in both HCs and individuals with T1D. We used a computational strategy called DISCOV-R (distribution analysis across clusters of a parent population overlaid with a rare subpopulation) (Figure 1A), in which total CD8+ T cells from each individual were clustered, in this case using Phenograph (28). Next, these individual clusters were aligned with CD8+ T cell clusters from other samples by hierarchical metaclustering to generate a common phenotypic landscape. Finally, Tmr+ cells were overlaid onto the CD8+ T cell landscapes for analysis of their distribution, as described in detail in Supplemental Figure 3. DISCOV-R facilitates direct comparisons of complex phenotypes between subjects while minimizing (a) skew introduced by disparate sample sizes, (b) sensitivity to outliers, and (c) homogenization resulting from the pooling of cells or subjects. This in turn enabled an unbiased assessment of the phenotypic distribution of rare, autoreactive cells both within and across subjects without masking individual heterogeneity. Islet-specific CD8+ T cells are composed of 3 predominant CXCR3+ memory phenotypes. For an extensive characterization of islet-specific CD8+ T cells, we applied our CyTOF panel and DISCOV-R to PBMCs from individuals with T1D (n = 46) (Table 1 and Supplemental Table 3). For characterization of the antigen-specific Tmr+ cell phenotype, we restricted analysis to samples that contained 5 or more Tmr+ cell events. We found heterogeneity of islet-specific CD8+ T cells within individual subjects and common phenotypes across subjects. Specifically, of the 12 shared phenotypes (clusters) we defined among total CD8+ T cells across all individuals, islet-specific Tmr+ cells were identified in more than 1 cluster for most subjects. However, no individual subject had more than 10 of the 12 clusters containing islet-specific Tmr+ cells (Figure 1B and Supplemental Figure 4). Three common clusters (labeled 1, 11, and 12 in Figure 1) contained the largest representation of islet-specific Tmr+ cells, accounting for greater than 20% of the islet-specific Tmr+ cells in more than 25% of the subjects (Figure 1C). Table 1 Cohort demographics To define these 3 common islet-specific T cell phenotypes, we assessed the expression levels of phenotypic markers on all individual clusters of total CD8+ T cells (Figure 1D and Supplemental Figure 5) and the 3 aligned islet-specific clusters (Figure 1E). Cluster 11, which was dominant only among islet-specific cells (Supplemental Figure 6), had an activated transitional memory phenotype with high expression of HELIOS and CD27. Cluster 12 was also unique to islet-specific cells and had a transitional memory phenotype with high CD27 expression, but lacked HELIOS expression. Cluster 1 dominated among insulin- and virus-specific cells in addition to islet-specific cells (Supplemental Figure 6) and had a memory exhausted–like phenotype with high EOMES expression, intermediate TBET expression, and elevated expression of the multiple inhibitory receptors 2B4 (CD244), PD1, TIGIT, and CD160. All 3 islet-specific clusters were CXCR3+, consistent with previous reports (29). Thus, islet-specific CD8+ T cells are heterogeneous and dominated by 3 distinct CXCR3+ memory subsets: an exhaustion-like subset that was also dominant for insulin- and chronic virus–specific cells and 2 transitional memory phenotypes unique to islet-specific cells, 1 of which was HELIOS+. Although inclusion of multiple antigen specificities within a pool of islet-specific Tmrs may account for the phenotypic heterogeneity, several lines of evidence argue against this. Antigen-specific cells identified by a single specificity (insulin) or only 2 pooled Tmrs (virus) occupied 2 or more prominent clusters in the majority of individuals (Supplemental Figure 6). Moreover, the number of predominant phenotypes of islet-specific cells from a given individual was not correlated with the number of positive islet antigen specificities determined by flow cytometry (Supplemental Figure 7). We performed cluster distribution analyses on all subjects with at least 5 Tmr+ events, resulting in exclusion of 7 of 46 subjects. Yet, when we only analyzed subjects with at least 25 Tmr+ events (n = 27), we found similar prominence of 3 clusters, suggesting that outliers were not skewing our results. Last, our finding of phenotypic heterogeneity within islet-specific cells is consistent with others’ recent reports (30, 31). Therefore, islet-specific CD8+ T cells were phenotypically heterogeneous at both the individual and population levels, and a core set of 3 predominant CXCR3+ memory phenotypes was conserved among islet-specific cells across subjects. We also detected islet-specific CXCR3+ memory CD8+ T cells in PBMCs from nondiabetic HLA-A2+ HCs (Supplemental Figure 8). As illustrated in Figure 2, most HCs displayed similar frequencies and phenotypes of antigen-specific cells compared with the T1D subjects in this study (Supplemental Figures 6 and 8). In both HCs and individuals with T1D, the transitional memory phenotypes enriched for islet-specific cells (clusters 11 and 12) were not consistently represented among insulin- or chronic virus–specific cells, whereas the exhaustion phenotype (cluster 1) was prevalent in both virus- and insulin-specific cells. Thus, islet-specific cells are phenotypically heterogeneous and exhibit some unique phenotypes not consistently seen in other antigen-specific CD8+ T cells that are expected to have recurrent exposure to antigen. Figure 2 Islet-specific CD8+ T cell frequency and phenotype do not differ between HCs and individuals with T1D. HCs (n = 20) were assayed with our Tmr-CyTOF panel and included in the DISCOV-R analysis as in Figure 1. (A) Frequency of islet-specific (Tmr+) cells within total CD8+ T cells was assessed and compared for HCs (n = 20) and T1D subjects (n = 46) using a Mann-Whitney U test. (B) Frequency of islet-specific CD8+ T cells among the 3 common islet-specific clusters was assessed for HCs (n = 13) and individuals with T1D (n = 39) with 5 or more Tmr+ events using 2-way ANOVA with Sidak’s test for multiple comparisons. Data represent the mean ± SD. TM, transitional memory. Activated memory and exhaustion phenotypes discriminate subjects with rapid and slow T1D progression. To address whether the phenotypes of autoreactive CD8+ T cells influence the rate of disease progression after onset in T1D, we stratified subjects by their rate of loss of β cell function. Subjects with rapid progression were less than 5 years from diagnosis but showed no detectable insulin secretion (<0.05 ng/mL) (C-peptide); subjects categorized as slow progressors were 5 or more years from diagnosis with >0.1 ng/mL C-peptide (Table 1 and Supplemental Table 3). We found no significant difference in the frequency of islet-specific CD8+ T cells between rapid and slow progressors (Figure 3A), even when outliers were excluded (data not shown); however, the proportion of exhausted (cluster 1) and HELIOS+ transitional memory (cluster 11) phenotypes among islet-specific cells differed significantly when comparing rapid and slow progressors, whereas the cluster 12 phenotype did not (Figure 3B). No other clusters differed among islet-specific cells between the rapid and slow progressors. On an individual basis, approximately half of the islet-specific CD8+ T cells in each cohort were of the common CXCR3+ memory phenotypes, and islet-specific cells from the majority of rapid progressors were enriched for cluster 11, whereas the majority of islet-specific cells of slow progressors were enriched for exhausted cluster 1 (Figure 3C). We also observed an increased frequency of the cluster 1 exhaustion phenotype in slow progressors among total CD8+ T cells (Figure 3D). These differences in the frequency of cluster 1 islet-specific cells were also seen when applying more stringent C-peptide cutoffs for rapid (<0.02 ng/mL, n = 9) and slow (>0.2 ng/mL, n = 12) rates of progression (P < 0.04, by 2-way ANOVA with Sidak’s test for multiple comparisons). A cutoff of 25% for the frequency of islet-specific cells residing in cluster 1 identified slow progressors with 70% sensitivity and 91% selectivity. Discrimination of disease progression by these phenotypes was particular to islet-specific cells, as we found no differences between their frequencies among virus- or insulin-specific CD8+ T cells (Supplemental Figure 9). Figure 3 Phenotype, not frequency, of islet-specific CD8+ T cells is associated with the rate of disease progression in T1D. The frequency of (A) islet-specific (Tmr+) cells within total CD8+ T cells was assessed for rapid (n = 14) and slow (n = 23) T1D progressors using a Mann-Whitney U test. The frequency of (B) islet Tmr+ or (D) total CD8+ T cells among the 3 common islet-specific clusters was assessed for rapid (n = 11, red solid triangles) and slow (n = 20, blue open squares) T1D progressors with 5 or more Tmr+ events using 2-way ANOVA with Sidak’s test for multiple comparisons. Data represent the mean ± SD. *P < 0.05 and ***P < 0.001. (C) Distribution of islet Tmr+ cells in clusters for individual samples; rapid progressors (n = 11) and slow progressors (n = 20) were organized by decreasing frequency of cluster 11 and increasing frequency of clusters 1 and 12 within each group. Simplified gating for CXCR3, EOMES, and HELIOS, based on DISCOV-R clusters, approximated the phenotype of clusters 1, 11, and 12, with similar trends seen between rapid and slow progressors, though such comparisons were not consistently statistically significant (Supplemental Figure 10). Thus, multidimensional definitions beyond a few well-defined markers are required to fully distinguish these disease-associated phenotypes, which included an activated transitional memory phenotype linked to rapid progression (cluster 11) and an exhausted memory phenotype linked to slow progression (cluster 1), whereas none of the other clusters were associated with outcome. The association between the exhaustion-like phenotype and T1D outcomes remains after accounting for disease duration and age. Factors beyond the rate of disease progression may contribute to the observed differential islet-specific CD8+ T cell phenotypes. Rapid and slow progressors were matched for sex and mean age at diagnosis. However, since slow progressors tended to be older in this cohort, and T cell exhaustion and memory are associated with more advanced age (32), we adjusted for age at sampling; yet, the differential phenotypes between rapid and slow progressors among islet-specific and total CD8+ T cells remained (Supplemental Figure 11). Furthermore, the 3 islet-specific phenotypes did not correlate with age in HCs (Figure 4A). Thus, exhaustion is not solely driven by the presence of disease or age but is instead related to disease outcome. Figure 4 Age and disease duration do not determine islet-specific CD8+ T cell exhaustion. The frequency of islet-specific phenotypes among islet-specific CD8+ T cells was assessed for subjects with 5 or more Tmr+ events. (A) Frequencies in HCs (n = 13) as a function of age based on DISCOV-R results from Figure 2. Statistical significance was determined by Spearman’s correlation. (B) Frequencies in T1D subjects who were not classified as rapid or slow progressors, grouped by disease duration (<5 years, n = 3, solid orange circles; ≥5 years, n = 5, open purple diamonds) on the basis of DISCOV-R results from Figure 1. A 2-way ANOVA with Sidak’s test for multiple comparisons revealed no statistically significant differences between the groups. Data represent the mean ± SD. (C) Frequencies in T1D subjects (n = 4) with samples drawn at 2 time points following disease onset, shown as paired, stacked bar graphs. The time points of the first draw were 3.2, 3.8, 4.8, and 5.5 years after disease onset, respectively. By definition, slow and rapid progressors differed by their disease duration. Thus, we assayed an independent cohort of T1D subjects stratified by disease duration but not distinguished by their disease progression rate (Table 1 and Supplemental Table 3); we found no difference in the frequency of the 3 common islet-specific clusters by disease duration (Figure 4B). To further test the influence of disease duration on exhaustion cluster 1, we performed longitudinal analyses on a subset of subjects for whom the disease duration was relatively similar, yet the frequency of the exhausted islet-specific cells was divergent. We did not observe major fluctuations in exhausted cluster 1 frequencies in islet-specific CD8+ T cells over time, and those with a lower proportion of exhausted cells did not gain this phenotype with longer disease duration (Figure 4C). Together, these data indicate that islet-specific CD8+ T cell phenotypes differ by disease progression rate, and not age or disease duration. Islet-specific CD8+ T cells from slow T1D progressors are functionally more exhausted. To confirm that cells in cluster 1 exhibited functional features of exhaustion, we tested the proliferation and cytokine production of islet-specific CD8+ T cells. Consistent with their more exhausted phenotype, islet-specific cells that were most dominated by cluster 1 were less proliferative in response to T cell receptor stimulation (Figure 5, A and B). By comparison, the frequencies of clusters 11 and 12 were positively correlated with proliferation (Supplemental Figure 12). Additionally, islet-specific cells maintained only a limited ability to produce the cytokines IL-2 and IFN-γ, irrespective of the abundance of cluster 1 (Figure 5, C and D). Taken together, these findings support an exhausted-like phenotype (33) of cluster 1, which dominates islet-specific cells from slow progressors, exhibits low production of cytokine, and is marked by elevated expression of multiple inhibitory receptors and reduced proliferative capacity compared with islet-specific cells from rapid progressors lacking cluster 1. Figure 5 Islet-specific CD8+ T cells with an abundant cluster 1 (exhausted) phenotype are hypoproliferative and produce limited levels of the cytokines IL-2 and IFN-γ. PBMCs from individuals with T1D (n = 11) with varying frequencies of cluster 1 among their islet-specific cells were stimulated with anti-CD3 plus anti-CD28. Cells were assayed by flow cytometry to identify islet-specific (Tmr+) CD8+ T cells (Supplemental Figure 13). Examples of gating for proliferation and cytokine production are shown for a rapid progressor (T1D-02) and a slow progressor (T1D-34) with low (4%) and high (60%) frequencies of cluster 1, respectively. (A) Representative examples of the frequency of proliferated cells on day 5 among stimulated (black line) islet Tmr+ cells as measured by CellTrace dye dilution, using unstimulated (solid gray) cells as a gating control. (B) Frequency of proliferated cells among islet Tmr+ cells after 5 days of stimulation, plotted against the frequency of cluster 1 determined by mass cytometry for each individual (n = 11). (C) Representative examples of IL-2 and IFN-γ production assessed at 6 hours among islet Tmr+ (black) or Tmr– CD8+ T cells (gray). (D) Frequency of IL-2+ and IFN-γ+ cells among islet Tmr+ cells after 6 hours of stimulation, plotted against the frequency of cluster 1 determined by mass cytometry for each individual (n = 10); no substantial cytokine production (<1%) was observed in the absence of stimulation. Statistical significance was determined by Spearman’s correlation. The difference in proliferation between islet-specific cells of rapid progressors (triangles, n = 3) and slow progressors (squares, n = 4) was not significant (P = 0.057), nor was cytokine production (P > 0.05) by Mann-Whitney U test. Discussion Although islet-autoreactive CD8+ T cells were present in both HCs and individuals with diabetes, we found that characteristic phenotypes of these cells reflect the rate of disease progression in T1D. Ample evidence indicates that islet-specific CD8+ T cells are a significant driver of β cell destruction in T1D (34). However, across numerous studies involving individuals with T1D, the frequencies of islet-specific CD8+ T cells in peripheral blood have been neither consistently altered nor strongly correlated with disease progression (11–15, 35). Here, through an unbiased and multidimensional approach, we demonstrate that islet-specific CD8+ T cells of HCs and T1D subjects comprise 3 dominant phenotypes that display characteristics of transitional memory or exhausted memory cells. Crucially, however, autoreactive CD8+ T cell phenotypes in T1D subjects predicted outcome after onset of disease, an activated transitional memory phenotype with high proliferative potential was associated with rapid progression, and a more functionally exhausted phenotype corresponded with slow disease progression. Detection of these phenotypes may be used to more precisely classify patients and to select therapies that promote the maintenance of β cell health. The phenotype of autoreactive CD8+ T cells was not uniform. CD8+ T cells have various functions associated with distinct activation and differentiation states (36, 37). For example, following vaccination, viral antigen–specific cells exhibit a defined phenotype during the effector and memory phases of the immune response (38). Using the analytical tool DISCOV-R, we were able to define variable phenotypes of CD8+ T cells in multiple dimensions and subsequently assess the phenotypes of rare antigen-specific cells. In contrast to temporal vaccine-induced, virus-specific cells and antigen-elicited gluten-specific CD4+ T cells (39), we found that chronic and latent virus-specific CD8+ T cells had substantial phenotypic heterogeneity. Our findings were consistent with another report (26) and indicate the variable nature of the immune response to recurring antigen exposure (40). Importantly, we found that islet-specific cells were also phenotypically heterogeneous within an individual (30, 31), suggestive of variability in islet-specific cell immune history and thus having potential consequences for autoimmune disease progression. Three predominant CXCR3+ memory phenotypes of islet-specific cells were common across both HCs and subjects with T1D. An exhaustion-like phenotype was broadly shared among chronic virus–, insulin-, and islet-specific CD8+ T cells, consistent with repeated antigen exposure in all 3 settings (41). However, there are several states of exhaustion (42). The islet-specific exhaustion cluster 1 differed from other clusters that also share features of exhaustion and were enriched in virus- and insulin-specific cells. Unlike islet-enriched exhaustion cluster 1, clusters 2, 6, and 10 lacked CXCR3, expressed late differentiation or senescence markers, and were less abundant in both islet-specific and total CD8+ T cells. These more terminally exhausted cells were more prominent among insulin-specific cells, even within the same individual. The CXCR3+ and less terminal phenotype of the islet-specific cluster 1 suggests a precursor exhausted population (42). Two other phenotypes we identified were unique to islet-specific cells (clusters 11 and 12) and not dominant among insulin- and virus-specific cells, indicating a different fate and function associated with exposure to native autoantigens from the pancreas as opposed to those seen for repeated viral antigen or abundant exogenous autoantigen as with insulin administration. These findings confirm and expand reports by other groups which have shown in a more focused manner that not all islet-specific cells exhibit the same differentiation state (19, 24, 27, 30, 31, 35, 43–45) and that the phenotype of islet-specific cells partially overlaps with chronic virus–specific cells (24, 30, 43, 45). Despite differential expression of most markers, a unifying feature of the 3 islet-specific phenotypes was the high level of expression of CXCR3, whose ligand, CXCL10, is upregulated in the pancreas in T1D (46) and could therefore promote islet-specific T cell migration to that site. Although CXCR3 expression is greatest in these 3 islet-specific phenotypes, we also observed a CXCR3-expressing naive subset that dominated in polyclonal and virus-specific cells. Naive CD8+ T cells have been reported in the pancreas of subjects with recent-onset T1D (18). The potential for this subset to be recruited to the pancreas along with autoreactive cells has important implications, because the presence of nonspecific bystander CD8+ T cells in the pancreas in a mouse model of diabetes was found to be associated with attenuated effector functions of islet-specific cells and protection from disease (47). Thus, the phenotype and function of the migrating cells that are not autoreactive may also contribute to disease progression. Autoimmune disease progression may be modulated by functional responses of CD8+ T cells. For example, inflammatory CD8+ T cells are associated with disease severity in systemic lupus erythematosus (SLE) (48) and multiple sclerosis (49). By contrast, increased CD8+ T cell exhaustion is associated with a beneficial response to therapy in recent-onset T1D (20, 50) as well as slower disease progression or a better prognosis in Crohn’s disease, SLE, and vasculitis (51, 52). Comparisons of phenotypes of autoreactive CD8+ T cells in health and disease have yielded mixed results. Some groups have found increased memory and CD57+ cells in individuals with T1D compared with HCs (27, 43), whereas others found no difference (15, 19). We found that the comprehensively defined islet-specific phenotypes, though variable across individuals, did not significantly differ by disease status and, indeed, were also present in HCs. Using established markers of CD8+ T cell differentiation, Yeo et al. described a positive correlation between changes in C-peptide and changes in effector memory CD57+ β cell–specific CD8+ T cells among young individuals who were newly diagnosed with T1D, implicating antigen load as a driver of differentiation and peripheral migration of this T cell subset (53). However, the relationship of autoreactive CD8+ T cell function and rate of progression in established T1D remains relatively unexplored. Here, we found no differences in the frequency of total islet-specific CD8+ T cells between rapid and slow progressors, but T1D subjects with rapid disease progression had a significantly greater proportion of islet-specific CD8+ T cells with a HELIOS+ transitional memory phenotype that is consistent with activation and proliferation (54) as well as exacerbated autoimmunity (55). Transitional memory cells are highly proliferative and polyfunctional, and this subset is transiently expanded in acute but not chronic HIV infection (56), suggestive of a more aggressive disease state. For the first time to our knowledge, we clearly associate this islet-specific transitional memory phenotype with a rapid rate of disease progression, opening the possibility for selective targeting of these cells therapeutically in patients with established T1D. Individuals with T1D with slow disease progression showed enrichment for islet-specific cells with functional features of exhaustion, regardless of disease duration and after accounting for age. T cell exhaustion plays opposing roles; it is deleterious in tumor and chronic viral infection (42, 57) but, as recently appreciated, beneficial in autoimmunity (58). Interestingly, we also observed the association of the exhaustion phenotype with slow disease progression among the polyclonal CD8+ T cell population within the same subjects, which suggests that intrinsic factors may promote exhaustion of islet-specific and total CD8+ T cells in slow progressors. However, we observed that the phenotype is present in HCs and that not all specificities reflect this bias. Virus- and insulin-specific exhausted cells were not preferentially increased in slow progressors, indicating an additional role for antigen exposure. In chronic viral infections and cancer, it is known that exposure to antigen in the absence of costimulation leads to exhaustion, typically within a few weeks (33). Our findings suggest that increasing the exhaustion phenotype could have a beneficial effect on outcome. Indeed, in T1D, therapeutic manipulation of the T cell receptor alone correlated with a more exhausted-like CD8+ phenotype in responders to treatment (20, 25). Whether exhaustion among islet-specific cells of slow progressors precedes disease or is merely a consequence of time and disease duration has important implications for disease mechanisms, monitoring, and therapy. Here, we found that the exhausted-like islet-specific phenotype was clearly not transient. Instead, we show in longitudinal analyses of a subset of subjects with a range of exhausted cells that exhaustion is relatively maintained over time within an individual. Also, the exhaustion phenotype was found at a similar range of frequencies in HCs. Stability of the exhausted phenotype has also been demonstrated in the setting of long-term, chronic HIV infection (59), consistent with preserved epigenetic and transcriptional programming (33, 42, 60). This contrasts with the dynamic changes in exhaustion features associated with disease severity in rheumatoid arthritis (61). Future longitudinal assessments of phenotype, function, and epigenetics across a range of disease stages will help further dissect mechanisms underlying this apparent stability. These results also indicate that early intervention to augment islet-specific T cell exhaustion may prevent or delay further disease progression. In summary, using high-dimensional mass cytometry with a new analytical method, DISCOV-R, we revealed phenotypic heterogeneity among circulating autoreactive CD8+ T cells in HCs and individuals with T1D. We linked an activated memory phenotype with rapid disease progression after T1D onset and an exhausted phenotype with slow disease progression. Future studies may address whether this reflects islet-specific CD8+ T cell composition in the pancreas. Although our current studies focused on 4 well-defined islet antigens, many new and altered islet-specific epitopes have been discovered recently (62). Determining whether these new specificities express similar phenotypic markers may elucidate the role of specific antigens and their associated phenotypes in the T1D disease course. The finding that islet-specific CD8+ T cells from slow progressors were enriched for an exhausted phenotype indicates that therapies that augment and establish their exhaustion could be effective in preserving residual β cell function after onset and makes the phenotype an attractive putative biomarker to predict disease trajectory and monitor therapeutic efficacy. Methods Study design and samples. On average, one-third of individuals diagnosed with T1D will lose detectable C-peptide within 5 years of disease onset (<0.017 nmol/L, or 0.05 ng/mL) (5, 63). Conversely, approximately one-third of individuals will retain C-peptide at levels 0.1 ng/mL or higher (0.03 nmol/L) 5 years after diagnosis (64). In this study, we sought to assess these ends of the disease spectrum cross-sectionally, using 5 years after onset and these C-peptide levels as cutoffs for distinguishing the rate of disease progression. Using our newly developed 35-parameter CyTOF panel with pooled Tmrs (Supplemental Table 2) in combination with 24 phenotyping markers (Supplemental Table 1) and applying a new analytical method for phenotyping rare subpopulations, DISCOV-R, we characterized antigen-specific CD8+ T cells from cryopreserved PBMCs from 20 HLA-A2+ HCs and 46 HLA-A2+ T1D subjects, a subset of which was stratified by rapid (n = 14, <0.05 ng/mL C-peptide within 5 years of diagnosis) and slow (n = 23, >0.1 ng/mL C-peptide at 5 or more years into disease) rate of disease progression following diagnosis. Because age at onset is a known predictor of disease progression, these groups were matched for this feature (Table 1 and Supplemental Table 3). All assays were run and analyzed in a blinded manner, and staining batches included an internal control of a single HLA-A2– individual with or without a consistent low frequency of spiked preproinsulin- or CMV-specific clone that was used to set gates for Tmr+ cells. Peptide-MHC Tmr generation. A biotinylated monomer of HLA-A2 (2 mg/mL) loaded with peptides (Supplemental Table 2) chosen for their demonstrated presence in T1D (12) was obtained from the NIH Tetramer Core Facility. Metal-conjugated avidin (0.5 mg/mL) was provided by Fluidigm prior to commercial availability; premium-grade phycoerythrin-conjugated (PE-conjugated) streptavidin (1 mg/mL) was obtained from Thermo Fisher Scientific. Each monomer was diluted in PBS, and then multimerized by 6 additions (each followed by a 10-minute incubation at 4°C) of 1/36th molar equivalents of 1 avidin, such that the final preparation contained a monomer at 0.16 mg/mL (2.4 mM) with a 6:1 molar ratio to avidin in 1% BSA, which was stored at 4°C for up to 1 month. CyTOF staining, acquisition, and subset identification. Thawed cryopreserved PBMCs (1.5 × 10⁶ to 2.5 × 10⁶ per stain) were first stained for viability using 100 μL cisplatin (100 μM, Enzo Life Sciences) in PBS for 1 minute at room temperature (RT), followed by quenching and washing with protein-containing media. Cells were then pretreated with 250 μL dasatinib (50 nM, LC Laboratories) for 8–10 minutes at 37°C and washed prior to staining with 50 μL solution containing 1 μL of each Tmr (Supplemental Table 2) in running buffer (RB) (PBS with 0.5% BSA and 2 mM EDTA) for 15 minutes at 37°C. Without washing, 50 μL 2× surface antibody cocktail (Supplemental Table 1) in RB was added, and the sample was incubated for an additional 30 minutes at 4°C. Samples were washed, fixed using the Maxpar Nuclear Antigen Staining Buffer (Fluidigm) for 20 minutes at RT, and stained with an intracellular antibody cocktail in Staining Perm Buffer (Fluidigm) for 30 minutes at 4°C. Samples were then washed, resuspended with 125 nM MaxPar Intercalator-Ir (Fluidigm) in Fix and Perm Buffer (Fluidigm), and stored at 4°C overnight or for up to 1 week prior to acquisition. On the day of acquisition, cells were washed and resuspended in cold ultrapure water containing one-fifth EQ Four Element Calibration Beads (Fluidigm) by volume to a cell concentration of less than 0.5 × 10⁶/mL. Samples were acquired at a rate of 300–500 events per second on a CyTOF 1.5 with upgrades (Fluidigm), running CyTOF Software, version 6.0.626 and using a Super Sampler system (Victorian Airship & Scientific Apparatus). Files were converted to flow cytometry standard (FCS) format and then randomized and normalized for EQ bead intensity using CyTOF software. FlowJo software, version 10.4, was used to manually gate and export the FCS files for CD8+ T cell and Tmr+ populations (Supplemental Figure 1), guided by control samples. DISCOV-R computational analyses. The FCS files prepared above were analyzed using custom R scripts (https://github.com/BenaroyaResearch/Wiedeman_Long_DISCOV-R) based on the flowCore (65), Rtsne (66–68), and cytofkit (28, 69–71) packages. Tmr+ events were concatenated to total CD8+ T cell FCS files for each sample prior to arcsinh transformation using the following parameters: a = 0 and b = 1/5. Subsequently, t-distributed stochastic neighbor embedding (t-SNE) analysis and Rphenograph clustering were performed for each sample using the following 22 phenotypic markers: KLRG1, HELIOS, TIM3, CD25, PD1, CCR7, CD45RO, CD57, CD45RA, CD38, CD127, TIGIT, CD27, CD161, TBET, CD95, NKG2D, CD122, EOMES, CXCR3, CD244, and CD56; granzyme B and CD160 intensities were less reproducible (>20% coefficient of variation), and were excluded from clustering. To align phenotypically similar clusters across individuals, hierarchical metaclustering of individual Phenograph clusters with higher than 1% frequency was performed across individuals using the Z score values of expression compared with each subject’s total CD8+ T cells, with Euclidean distance and Ward’s method used to assess phenotypic similarity. Heatmaps were generated in R using the ComplexHeatmap package (72). The dendrogram was cut into 12 segments using “cutree” from the stats R package (73), and the resulting cluster assignments were applied to the individual samples. To summarize the absolute expression values for each cluster, a weighted average of arcsinh-transformed intensities was calculated on the basis of the proportion of a subject’s total CD8+ T cells represented within a given cluster. This approach reduced bias due to varying sampling depths and PhenoGraph under-/overclustering for an individual. Tmr+ cells were overlaid on the t-SNE plot using the ggplot2 package (74) in R. Total CD8+ and Tmr+ T cells were counted for each cluster in each subject, and their frequency was calculated for samples with at least 5 Tmr+ events. Clusters were considered dominant if they contained more than 20% of the Tmr+ T cells, as this cutoff required more than 1 cell to be present, and the false-positive rate (proportion of Tmr+ T cells when randomly assigned to a cluster exceeded the observed value) dropped off considerably at this threshold. In our validation of the DISCOV-R method, we found that individual clustering and cluster alignment were both highly reproducible (<25% CV for clusters of at least 3% frequency), as was the number of dominant islet-specific clusters present in an individual (mean 2 ± 1). Flow cytometric assays of cytokine production and proliferation. Thawed cryopreserved PBMCs were cultured at 37°C with and without stimulation with plate-bound anti-CD3 (OKT3, 1 μg/mL, BioLegend) and soluble anti-CD28 (CD28.2, 2 μg/mL, BioLegend). For the cytokine production assay, cells were cultured for 6 hours, and brefeldin A and monensin (BioLegend) were each added at 1× for the last 4 hours. For the proliferation assay, cells were loaded with CellTrace Violet (Invitrogen, Thermo Fisher Scientific), according to the manufacturer’s instructions, prior to culturing for 5 days. Following culturing, cells were harvested; stained for viability using Zombie NIR (BioLegend) according to the manufacturer’s instructions; stained with pooled islet-specific Tmrs, as in the CyTOF staining, acquisition, and subset identification section; and subsequently stained with the surface antibodies anti-CD14-BUV737 (M5E2), anti–CD19-FITC (HIB19), anti–CD56-PE-Cy7 (NCAM16.2), anti-CD3-BUV395 (UCHT1), anti–CD4-BV605 (RPA-T4), and anti-CD8-BV786 (RPA-T8) in Brilliant Stain Buffer (all from BD Biosciences) to identify CD8+ T cells (Supplemental Figure 13). For the cytokine production assay, cells were further fixed and permeabilized using the Foxp3 Transcription Factor Staining Buffer Set (Invitrogen, Thermo Fisher Scientific) and stained with anti–IL-2-BB700 (MQ1-17H12), anti–TNF-α-BV650 (MAb11), and anti–IFN-γ-BV421 (B27) (all from BD Biosciences). Cells were acquired on an LSRFortessa (BD Biosciences) and analyzed using FlowJo software. Statistics. Beyond that which was described in DISCOV-R computational analyses, GraphPad Prism (version 7.05, GraphPad Software) was used to generate graphs and to perform either a Mann-Whitney U test to compare antigen-specific cell frequency or a 2-way ANOVA with Sidak’s test for multiple comparisons of the frequencies of the 3 islet-specific clusters between 2 groups. Spearman’s correlation was used for assessment of bivariate data. All statistical tests were 2 sided. Study approval. All samples were collected from the BRI’s Immune Mediated Disease Registry and Repository. Written informed consent was obtained from all subjects according to protocols approved by the BRI’s institutional review board (protocol number IRB07109). Author contributions AEW and SAL conceptualized the study. CS, CJG, ES, and GTN provided input on sample selection and clinical interpretation. EAJ gave guidance on Tmr staining methodology. AEW, GB, and AMK conducted the experiments. VSM, MGR, HAD, SP, BH, MJD and PSL performed computational and statistical analysis and provided consultation. AEW and SAL wrote the manuscript. All authors reviewed and edited the manuscript. SAL obtained funding and supervised the study. Supplemental material View Supplemental data Acknowledgments Development of the CyTOF panel was supported by the ITN and sponsored by the National Institute of Allergy and Infectious Diseases (NIAID) subaward (to SAL) under award number UM1AI109565 (NIH grant, awarded to GTN). Funding from the JDRF (3-SRA-2014-315-M-R, to EAJ and SAL) supported all remaining components of the study. We are grateful to T.S. Nguyen and the Diabetes Clinical Research team for expert management of clinical samples and associated data; A. Hocking, K. Cerosaletti, B. Khor, J.L. Blanchfield, R. LaFond, and J. Calise for review, feedback, and editing of the manuscript; and Fluidigm for providing metal-conjugated avidin. Footnotes Conflict of interest: CJG has consulted for Bristol-Myers Squibb. Copyright: © 2019, American Society for Clinical Investigation. Reference information: J Clin Invest. https://doi.org/10.1172/JCI126595. References Insel RA, et al. Staging presymptomatic type 1 diabetes: a scientific statement of JDRF, the Endocrine Society, and the American Diabetes Association. Diabetes Care. 2015;38(10):1964–1974. View this article via: PubMed CrossRef Google Scholar Ziegler AG, Nepom GT. Prediction and pathogenesis in type 1 diabetes. Immunity. 2010;32(4):468–478. View this article via: PubMed CrossRef Google Scholar Leighton E, Sainsbury CA, Jones GC. A practical review of C-peptide testing in diabetes. Diabetes Ther. 2017;8(3):475–487. View this article via: PubMed CrossRef Google Scholar Greenbaum CJ, et al. Fall in C-peptide during first 2 years from diagnosis: evidence of at least two distinct phases from composite type 1 diabetes TrialNet data. Diabetes. 2012;61(8):2066–2073. View this article via: PubMed CrossRef Google Scholar Davis AK, et al. Prevalence of detectable C-peptide according to age at diagnosis and duration of type 1 diabetes. Diabetes Care. 2015;38(3):476–481. View this article via: PubMed CrossRef Google Scholar Ehlers MR. Immune interventions to preserve β cell function in type 1 diabetes. J Investig Med. 2016;64(1):7–13. View this article via: PubMed CrossRef Google Scholar Serreze DV, Leiter EH, Christianson GJ, Greiner D, Roopenian DC. Major histocompatibility complex class I-deficient NOD-B2mnull mice are diabetes and insulitis resistant. Diabetes. 1994;43(3):505–509. View this article via: PubMed Google Scholar Wicker LS, et al. Beta 2-microglobulin-deficient NOD mice do not develop insulitis or diabetes. Diabetes. 1994;43(3):500–504. View this article via: PubMed Google Scholar Wong FS, Visintin I, Wen L, Flavell RA, Janeway CA. CD8 T cell clones from young nonobese diabetic (NOD) islets can transfer rapid onset of diabetes in NOD mice in the absence of CD4 cells. J Exp Med. 1996;183(1):67–76. View this article via: PubMed CrossRef Google Scholar DiLorenzo TP, et al. Major histocompatibility complex class I-restricted T cells are required for all but the end stages of diabetes development in nonobese diabetic mice and use a prevalent T cell receptor alpha chain gene rearrangement. Proc Natl Acad Sci U S A. 1998;95(21):12538–12543. View this article via: PubMed CrossRef Google Scholar Martinuzzi E, et al. The frequency and immunodominance of islet-specific CD8+ T-cell responses change after type 1 diabetes diagnosis and treatment. Diabetes. 2008;57(5):1312–1320. View this article via: PubMed CrossRef Google Scholar Velthuis JH, et al. Simultaneous detection of circulating autoreactive CD8+ T-cells specific for different islet cell-associated epitopes using combinatorial MHC multimers. Diabetes. 2010;59(7):1721–1730. View this article via: PubMed CrossRef Google Scholar James EA, et al. Combinatorial detection of autoreactive CD8+ T cells with HLA-A2 multimers: a multi-centre study by the Immunology of Diabetes Society T Cell Workshop. Diabetologia. 2018;61(3):658–670. View this article via: PubMed CrossRef Google Scholar Sarikonda G, et al. CD8 T-cell reactivity to islet antigens is unique to type 1 while CD4 T-cell reactivity exists in both type 1 and type 2 diabetes. J Autoimmun. 2014;50:77–82. View this article via: PubMed CrossRef Google Scholar Culina S, et al. Islet-reactive CD8+ T cell frequencies in the pancreas, but not in blood, distinguish type 1 diabetic patients from healthy donors. Sci Immunol. 2018;3(20):eaao4013. View this article via: PubMed CrossRef Google Scholar Willcox A, Richardson SJ, Bone AJ, Foulis AK, Morgan NG. Analysis of islet inflammation in human type 1 diabetes. Clin Exp Immunol. 2009;155(2):173–181. View this article via: PubMed CrossRef Google Scholar Wang YJ, et al. Multiplexed in situ imaging mass cytometry analysis of the human endocrine pancreas and immune system in type 1 diabetes. Cell Metab. 2019;29(3):769–783.e4. View this article via: PubMed CrossRef Google Scholar Damond N, et al. A map of human type 1 diabetes progression by imaging mass cytometry. Cell Metab. 2019;29(3):755–768.e5. View this article via: PubMed CrossRef Google Scholar Gonzalez-Duque S, et al. Conventional and neo-antigenic peptides presented by β cells are targeted by circulating naïve CD8+ T cells in type 1 diabetic and healthy donors. Cell Metab. 2018;28(6):946–960.e6. View this article via: PubMed CrossRef Google Scholar Long SA, et al. Partial exhaustion of CD8 T cells and clinical response to teplizumab in new-onset type 1 diabetes. Sci Immunol. 2016;1(5):eaai7793. View this article via: PubMed CrossRef Google Scholar Tooley JE, et al. Changes in T-cell subsets identify responders to FcR-nonbinding anti-CD3 mAb (teplizumab) in patients with type 1 diabetes. Eur J Immunol. 2016;46(1):230–241. View this article via: PubMed CrossRef Google Scholar Herold KC, et al. Teplizumab treatment may improve C-peptide responses in participants with type 1 diabetes after the new-onset period: a randomised controlled trial. Diabetologia. 2013;56(2):391–400. View this article via: PubMed CrossRef Google Scholar Herold KC, et al. An anti-CD3 antibody, teplizumab, in relatives at risk for type 1 diabetes. N Engl J Med. 2019;381(7):603–613. View this article via: PubMed CrossRef Google Scholar Cernea S, Herold KC. Monitoring of antigen-specific CD8 T cells in patients with type 1 diabetes treated with antiCD3 monoclonal antibodies. Clin Immunol. 2010;134(2):121–129. View this article via: PubMed CrossRef Google Scholar Alhadj Ali M, et al. Metabolic and immune effects of immunotherapy with proinsulin peptide in human new-onset type 1 diabetes. Sci Transl Med. 2017;9(402):eaaf7779. View this article via: PubMed CrossRef Google Scholar Newell EW, Sigal N, Nair N, Kidd BA, Greenberg HB, Davis MM. Combinatorial tetramer staining and mass cytometry analysis facilitate T-cell epitope mapping and characterization. Nat Biotechnol. 2013;31(7):623–629. View this article via: PubMed CrossRef Google Scholar Vignali D, et al. Detection and characterization of CD8+ autoreactive memory stem T cells in patients with type 1 diabetes. Diabetes. 2018;67(5):936–945. View this article via: PubMed CrossRef Google Scholar Levine JH, et al. Data-driven phenotypic dissection of AML reveals progenitor-like cells that correlate with prognosis. Cell. 2015;162(1):184–197. View this article via: PubMed CrossRef Google Scholar Garyu JW, et al. Characterization of diabetogenic CD8+ T cells: immune therapy with metabolic blockade. J Biol Chem. 2016;291(21):11230–11240. View this article via: PubMed CrossRef Google Scholar Laban S, et al. Heterogeneity of circulating CD8 T-cells specific to islet, neo-antigen and virus in patients with type 1 diabetes mellitus. PLoS ONE. 2018;13(8):e0200818. View this article via: PubMed CrossRef Google Scholar Ogura H, et al. Identification and analysis of islet antigen-specific CD8+ T cells with T cell libraries. J Immunol. 2018;201(6):1662–1670. View this article via: PubMed CrossRef Google Scholar Song Y, et al. T-cell immunoglobulin and ITIM domain contributes to CD8+ T-cell immunosenescence. Aging Cell. 2018;17(2):e12716. View this article via: PubMed Google Scholar Wherry EJ, Kurachi M. Molecular and cellular insights into T cell exhaustion. Nat Rev Immunol. 2015;15(8):486–499. View this article via: PubMed CrossRef Google Scholar Faustman DL, Davis M. The primacy of CD8 T lymphocytes in type 1 diabetes and implications for therapies. J Mol Med. 2009;87(12):1173–1178. View this article via: PubMed CrossRef Google Scholar Paul M, et al. Pathophysiological characteristics of preproinsulin-specific CD8+ T cells in subjects with juvenile-onset and adult-onset type 1 diabetes: A 1-year follow-up study. Pediatr Diabetes. 2018;19(1):68–79. View this article via: PubMed CrossRef Google Scholar Klebanoff CA, Gattinoni L, Restifo NP. Sorting through subsets: which T-cell populations mediate highly effective adoptive immunotherapy? J Immunother. 2012;35(9):651–660. View this article via: PubMed CrossRef Google Scholar Henning AN, Roychoudhuri R, Restifo NP. Epigenetic control of CD8+ T cell differentiation. Nat Rev Immunol. 2018;18(5):340–356. View this article via: PubMed CrossRef Google Scholar Wrammert J, Miller J, Akondy R, Ahmed R. Human immune memory to yellow fever and smallpox vaccination. J Clin Immunol. 2009;29(2):151–157. View this article via: PubMed CrossRef Google Scholar Christophersen A, et al. Distinct phenotype of CD4+ T cells driving celiac disease identified in multiple autoimmune conditions. Nat Med. 2019;25(5):734–737. View this article via: PubMed CrossRef Google Scholar Sallusto F, Geginat J, Lanzavecchia A. Central memory and effector memory T cell subsets: function, generation, and maintenance. Annu Rev Immunol. 2004;22:745–763. View this article via: PubMed CrossRef Google Scholar Wherry EJ. T cell exhaustion. Nat Immunol. 2011;12(6):492–499. View this article via: PubMed CrossRef Google Scholar McLane LM, Abdel-Hakeem MS, Wherry EJ. CD8 T cell exhaustion during chronic viral infection and cancer. Annu Rev Immunol. 2019;37:457–495. View this article via: PubMed CrossRef Google Scholar Skowera A, et al. β-cell-specific CD8 T cell phenotype in type 1 diabetes reflects chronic autoantigen exposure. Diabetes. 2015;64(3):916–925. View this article via: PubMed CrossRef Google Scholar Sachdeva N, et al. Preproinsulin specific CD8+ T cells in subjects with latent autoimmune diabetes show lower frequency and different pathophysiological characteristics than those with type 1 diabetes. Clin Immunol. 2015;157(1):78–90. View this article via: PubMed CrossRef Google Scholar Luce S, et al. Single insulin-specific CD8+ T cells show characteristic gene expression profiles in human type 1 diabetes. Diabetes. 2011;60(12):3289–3299. View this article via: PubMed CrossRef Google Scholar Antonelli A, Ferrari SM, Corrado A, Ferrannini E, Fallahi P. CXCR3, CXCL10 and type 1 diabetes. Cytokine Growth Factor Rev. 2014;25(1):57–65. View this article via: PubMed CrossRef Google Scholar Christoffersson G, Chodaczek G, Ratliff SS, Coppieters K, von Herrath MG. Suppression of diabetes by accumulation of non-islet-specific CD8+ effector T cells in pancreatic islets. Sci Immunol. 2018;3(21):eaam6533. View this article via: PubMed CrossRef Google Scholar Blanco P, Pitard V, Viallard JF, Taupin JL, Pellegrin JL, Moreau JF. Increase in activated CD8+ T lymphocytes expressing perforin and granzyme B correlates with disease activity in patients with systemic lupus erythematosus. Arthritis Rheum. 2005;52(1):201–211. View this article via: PubMed CrossRef Google Scholar Malmeström C, et al. Relapses in multiple sclerosis are associated with increased CD8+ T-cell mediated cytotoxicity in CSF. J Neuroimmunol. 2008;196(1-2):159–165. View this article via: PubMed CrossRef Google Scholar Long SA, et al. Remodeling T cell compartments during anti-CD3 immunotherapy of type 1 diabetes. Cell Immunol. 2017;319:3–9. View this article via: PubMed CrossRef Google Scholar McKinney EF, et al. A CD8+ T cell transcription signature predicts prognosis in autoimmune disease. Nat Med. 2010;16(5):586–591, 1p following 591. View this article via: PubMed Google Scholar McKinney EF, Lee JC, Jayne DR, Lyons PA, Smith KG. T-cell exhaustion, co-stimulation and clinical outcome in autoimmunity and infection. Nature. 2015;523(7562):612–616. View this article via: PubMed CrossRef Google Scholar Yeo L, et al. Autoreactive T effector memory differentiation mirrors β cell function in type 1 diabetes. J Clin Invest. 2018;128(8):3460–3474. View this article via: JCI PubMed CrossRef Google Scholar Akimova T, Beier UH, Wang L, Levine MH, Hancock WW. Helios expression is a marker of T cell activation and proliferation. PLoS ONE. 2011;6(8):e24226. View this article via: PubMed CrossRef Google Scholar Digre A, et al. Overexpression of heparanase enhances T lymphocyte activities and intensifies the inflammatory response in a model of murine rheumatoid arthritis. Sci Rep. 2017;7:46229. View this article via: PubMed Google Scholar Breton G, et al. Programmed death-1 is a marker for abnormal distribution of naive/memory T cell subsets in HIV-1 infection. J Immunol. 2013;191(5):2194–2204. View this article via: PubMed CrossRef Google Scholar Linsley PS, Long SA. Enforcing the checkpoints: harnessing T-cell exhaustion for therapy of T1D. Curr Opin Endocrinol Diabetes Obes. 2019;26(4):213–218. View this article via: PubMed CrossRef Google Scholar McKinney EF, Smith KG. T cell exhaustion and immune-mediated disease-the potential for therapeutic exhaustion. Curr Opin Immunol. 2016;43:74–80. View this article via: PubMed CrossRef Google Scholar Buggert M, et al. T-bet and Eomes are differentially linked to the exhauste
|
|
Scooped by
Gilbert C FAURE
August 14, 2019 4:23 AM
|
Identifying the factors driving disease disparities between males and females with multiple sclerosis (MS) holds great promise for deciphering immunopathogenic disease mechanisms. In this issue of JCI, Itoh et al. explore the basis for sexual dimorphism in autoimmunity, specifically in MS. Using the experimental autoimmune encephalomyelitis (EAE) model of MS, which recapitulates CD4+ T cell–dependent disease, the authors examined the contribution of Kdm6a, a histone demethylase gene known to escape X inactivation. Conditional knockout in CD4+ T cells revealed Kdm6a involvement with a collection of immunologic processes having the potential to skew immunity toward inflammatory responses. This study concisely shows the value of X chromosome gene expression in T cell regulation of autoimmunity and the relevance of Kdm6a in the pathogenesis of EAE as a model of MS.

|
Suggested by
Société Francaise d'Immunologie
July 25, 2019 2:25 AM
|
Significance B cells have important antibody-independent functions and are now recognized as key players in autoimmune diseases traditionally thought to be T cell-mediated. The role of B cells as antigen-presenting cells, however, is not well understood. By studying the autoantibody response against the enzyme transglutaminase 2 in celiac disease, we have shown that B cells targeting particular epitopes are selectively activated and that this epitope bias reflects efficient presentation of gluten antigen to T cells. Production of antibodies against the preferred epitope coincided with clinical onset of disease, suggesting that B cells with this specificity can be main antigen-presenting cells for pathogenic gluten-specific T cells. Our study thus provides insight into the mechanisms controlling initiation of a T cell-mediated autoimmune condition. Abstract B cells play important roles in autoimmune diseases through autoantibody production, cytokine secretion, or antigen presentation to T cells. In most cases, the contribution of B cells as antigen-presenting cells is not well understood. We have studied the autoantibody response against the enzyme transglutaminase 2 (TG2) in celiac disease patients by generating recombinant antibodies from single gut plasma cells reactive with discrete antigen domains and by undertaking proteomic analysis of anti-TG2 serum antibodies. The majority of the cells recognized epitopes in the N-terminal domain of TG2. Antibodies recognizing C-terminal epitopes interfered with TG2 cross-linking activity, and B cells specific for C-terminal epitopes were inefficient at taking up TG2-gluten complexes for presentation to gluten-specific T cells. The bias toward N-terminal epitopes hence reflects efficient T-B collaboration. Production of antibodies against N-terminal epitopes coincided with clinical onset of disease, suggesting that TG2-reactive B cells with certain epitope specificities could be the main antigen-presenting cells for pathogenic, gluten-specific T cells. The link between B cell epitopes, antigen presentation, and disease onset provides insight into the pathogenic mechanisms of a T cell-mediated autoimmune condition. Footnotes ↵1To whom correspondence may be addressed. Email: rasmus.iversen{at}medisin.uio.no or l.m.sollid{at}medisin.uio.no. ↵2Present address: Symbiosis School of Biological Sciences, Symbiosis International (Deemed University), Lavale, Mulshi, 412115 Pune, India. Author contributions: R.I., B.R., and L.M.S. designed research; R.I., B.R., J.S., L.S.H., and K.H. performed research; I.R.K.-S. and K.E.A.L. contributed new reagents/analytic tools; R.I., B.R., J.S., L.S.H., K.H., and R.S.N. analyzed data; and R.I. and L.M.S. wrote the paper. The authors declare no conflict of interest. This article is a PNAS Direct Submission. Data deposition: Sequence data have been deposited at the European Genome-phenome Archive, https://www.ebi.ac.uk/ega/home (accession no. EGAS00001003658). Proteomics data have been deposited to the ProteomeXchange Consortium, http://www.proteomexchange.org/ (data set identifier PXD013777). This article contains supporting information online at www.pnas.org/lookup/suppl/doi:10.1073/pnas.1901561116/-/DCSupplemental. Published under the PNAS license. References ↵ O. Chan, M. J. Shlomchik, A new role for B cells in systemic autoimmunity: B cells promote spontaneous T cell activation in MRL-lpr/lpr mice. J. Immunol. 160, 51–59 (1998). ↵ N. Molnarfi et al., MHC class II-dependent B cell APC function is required for induction of CNS autoimmunity independent of myelin-specific antibodies. J. Exp. Med. 210, 2921–2937 (2013). ↵ I. Jelcic et al., Memory B cells activate brain-homing, autoreactive CD4+ T cells in multiple sclerosis. Cell 175, 85–100.e23 (2018).OpenUrlCrossRef ↵ S. Hong et al., B cells are the dominant antigen-presenting cells that activate naive CD4+ T cells upon immunization with a virus-derived nanoparticle antigen. Immunity 49, 695–708.e4 (2018).OpenUrl ↵ L. S. Hoydahl et al., Plasma cells are the most abundant gluten peptide MHC-expressing cells in inflamed intestinal tissues from patients with celiac disease. Gastroenterology 156, 1428–1439.e10 (2019).OpenUrl ↵ W. Dieterich et al., Identification of tissue transglutaminase as the autoantigen of celiac disease. Nat. Med. 3, 797–801 (1997).OpenUrlCrossRefPubMed ↵ L. M. Sollid, O. Molberg, S. McAdam, K. E. Lundin, Autoantibodies in coeliac disease: Tissue transglutaminase: Guilt by association? Gut 41, 851–852 (1997).OpenUrlFREE Full Text ↵ L. W. Vader et al., Specificity of tissue transglutaminase explains cereal toxicity in celiac disease. J. Exp. Med. 195, 643–649 (2002). ↵ B. Fleckenstein et al., Gliadin T cell epitope selection by tissue transglutaminase in celiac disease. Role of enzyme specificity and pH influence on the transamidation versus deamidation process. J. Biol. Chem. 277, 34109–34116 (2002). ↵ O. Molberg et al., Tissue transglutaminase selectively modifies gliadin peptides that are recognized by gut-derived T cells in celiac disease. Nat. Med. 4, 713–717 (1998).OpenUrlCrossRefPubMed ↵ Y. van de Wal et al., Selective deamidation by tissue transglutaminase strongly enhances gliadin-specific T cell reactivity. J. Immunol. 161, 1585–1588 (1998). ↵ L. M. Sollid, S. W. Qiao, R. P. Anderson, C. Gianfrani, F. Koning, Nomenclature and listing of celiac disease relevant gluten T-cell epitopes restricted by HLA-DQ molecules. Immunogenetics 64, 455–460 (2012).OpenUrlCrossRefPubMed ↵ D. M. Pinkas, P. Strop, A. T. Brunger, C. Khosla, Transglutaminase 2 undergoes a large conformational change upon activation. PLoS Biol. 5, e327 (2007).OpenUrlCrossRefPubMed ↵ S. Liu, R. A. Cerione, J. Clardy, Structural basis for the guanine nucleotide-binding activity of tissue transglutaminase and its regulation of transamidation activity. Proc. Natl. Acad. Sci. U.S.A. 99, 2743–2747 (2002). ↵ R. Iversen et al., Transglutaminase 2-specific autoantibodies in celiac disease target clustered, N-terminal epitopes not displayed on the surface of cells. J. Immunol. 190, 5981–5991 (2013). ↵ R. Iversen et al., Strong clonal relatedness between serum and gut IgA despite different plasma cell origins. Cell Rep. 20, 2357–2367 (2017).OpenUrl ↵ R. Iversen, S. Mysling, K. Hnida, T. J. Jørgensen, L. M. Sollid, Activity-regulating structural changes and autoantibody epitopes in transglutaminase 2 assessed by hydrogen/deuterium exchange. Proc. Natl. Acad. Sci. U.S.A. 111, 17146–17151 (2014). ↵ R. Di Niro et al., High abundance of plasma cells secreting transglutaminase 2-specific IgA autoantibodies with limited somatic hypermutation in celiac disease intestinal lesions. Nat. Med. 18, 441–445 (2012).OpenUrlCrossRefPubMed ↵ J. Stamnaes, I. Cardoso, R. Iversen, L. M. Sollid, Transglutaminase 2 strongly binds to an extracellular matrix component other than fibronectin via its second C-terminal beta-barrel domain. FEBS J. 283, 3994–4010 (2016).OpenUrlCrossRef ↵ J. Stamnaes, R. Iversen, M. F. du Pré, X. Chen, L. M. Sollid, Enhanced B-cell receptor recognition of the autoantigen transglutaminase 2 by efficient catalytic self-multimerization. PLoS One 10, e0134922 (2015).OpenUrlCrossRefPubMed ↵ K. Hnida et al., Epitope-dependent functional effects of celiac disease autoantibodies on transglutaminase 2. J. Biol. Chem. 291, 25542–25552 (2016). ↵ M. R. Arbuckle et al., Development of autoantibodies before the clinical onset of systemic lupus erythematosus. N. Engl. J. Med. 349, 1526–1533 (2003).OpenUrlCrossRefPubMed ↵ S. Rantapää-Dahlqvist et al., Antibodies against cyclic citrullinated peptide and IgA rheumatoid factor predict the development of rheumatoid arthritis. Arthritis Rheum. 48, 2741–2749 (2003).OpenUrlCrossRefPubMed ↵ T. T. Salmi et al., Immunoglobulin A autoantibodies against transglutaminase 2 in the small intestinal mucosa predict forthcoming coeliac disease. Aliment. Pharmacol. Ther. 24, 541–552 (2006).OpenUrlCrossRefPubMed ↵ G. Oberhuber, G. Granditsch, H. Vogelsang, The histopathology of coeliac disease: Time for a standardized report scheme for pathologists. Eur. J. Gastroenterol. Hepatol. 11, 1185–1194 (1999).OpenUrlPubMed ↵ O. Snir et al., Analysis of celiac disease autoreactive gut plasma cells and their corresponding memory compartment in peripheral blood using high-throughput sequencing. J. Immunol. 194, 5703–5712 (2015). ↵ R. Li, K. R. Patterson, A. Bar-Or, Reassessing B cell contributions in multiple sclerosis. Nat. Immunol. 19, 696–707 (2018).OpenUrl ↵ J. R. Giles, M. Kashgarian, P. A. Koni, M. J. Shlomchik, B cell-specific MHC class II deletion reveals multiple nonredundant roles for B cell antigen presentation in murine lupus. J. Immunol. 195, 2571–2579 (2015). ↵ J. William, C. Euler, S. Christensen, M. J. Shlomchik, Evolution of autoantibody responses via somatic hypermutation outside of germinal centers. Science 297, 2066–2070 (2002). ↵ M. J. Shlomchik, F. Weisel, Germinal center selection and the development of memory B and plasma cells. Immunol. Rev. 247, 52–63 (2012).OpenUrlCrossRefPubMed ↵ S. Sulkanen et al., Tissue transglutaminase autoantibody enzyme-linked immunosorbent assay in detecting celiac disease. Gastroenterology 115, 1322–1328 (1998).OpenUrlCrossRefPubMed ↵ B. Roy et al., High-throughput single-cell analysis of B cell receptor usage among autoantigen-specific plasma cells in celiac disease. J. Immunol. 199, 782–791 (2017). ↵ D. A. Leffler, D. Schuppan, Update on serologic testing in celiac disease. Am. J. Gastroenterol. 105, 2520–2524 (2010).OpenUrlCrossRefPubMed ↵ K. Lindfors, M. Mäki, K. Kaukinen, Transglutaminase 2-targeted autoantibodies in celiac disease: Pathogenetic players in addition to diagnostic tools? Autoimmun. Rev. 9, 744–749 (2010).OpenUrlCrossRefPubMed ↵ B. Jabri, L. M. Sollid, T cells in celiac disease. J. Immunol. 198, 3005–3014 (2017). ↵BSG Coeliac Disease Guidelines Development Group; British Society of Gastroenterology J. F. Ludvigsson et al.; BSG Coeliac Disease Guidelines Development Group; British Society of Gastroenterology, Diagnosis and management of adult coeliac disease: Guidelines from the British Society of Gastroenterology. Gut 63, 1210–1228 (2014). ↵ M. P. Lefranc et al., IMGT, the international ImMunoGeneTics database. Nucleic Acids Res. 27, 209–212 (1999).OpenUrlCrossRefPubMed ↵ J. Cox, M. Mann, MaxQuant enables high peptide identification rates, individualized p.p.b.-range mass accuracies and proteome-wide protein quantification. Nat. Biotechnol. 26, 1367–1372 (2008).OpenUrlCrossRefPubMed ↵ Y. Perez-Riverol et al., The PRIDE database and related tools and resources in 2019: Improving support for quantification data. Nucleic Acids Res. 47, D442–D450 (2019).OpenUrlCrossRefPubMed
|
|
Scooped by
Gilbert C FAURE
June 20, 2019 9:39 AM
|
Abstract CD4+Foxp3+ regulatory T cells (Tregs) are suppressors of immune activation and play a crucial role in the maintenance of peripheral tolerance. Mutations of Foxp3 result in fatal autoimmunity in multiple organs, including the skin, in both humans and mice. Many studies have demonstrated the altered frequency and functions of Tregs, changes in cytokine and chemokine levels related to Tregs and the differences in genetic background regarding Tregs in autoimmune skin disorders. Recent studies have extended our knowledge of certain properties of Tregs, especially skin‐resident Tregs. In addition, some novel therapies have been performed by modulating the number and the function of Tregs. This review focuses on the role of Tregs in some autoimmune skin disorders, including alopecia areata, vitiligo, pemphigoid and pemphigus, and systemic sclerosis, and discusses questions that remain to be addressed. 1 INTRODUCTION Foxp3+ regulatory T cells (Tregs) are potent suppressors of immune activation and play a crucial role in the maintenance of self‐tolerance.1 Treg cells prevent autoreactive T cells that escape clonal deletion in the thymus from activating and expanding at the periphery. Therefore, a balance between Tregs and effector T cells is a key factor for maintaining appropriate peripheral tolerance. Mutations of Foxp3 result in fatal immune dysregulation, polyendocrinopathy, enteropathy, X‐linked (IPEX) syndrome in humans,2 whereas a mutation in Foxp3 leads to the lymphoproliferative syndrome of scurfy mice.3, 4 Tregs are known to highly express CCR45 and CCR7;6 thus, their ligands CCL22 and CCL21 promote Treg homing to tissues. Various mechanisms by which Tregs directly suppress responder T cells have been proposed: the production of suppressor cytokines IL‐10 and TGF‐β; IL‐2 consumption though CD25 (IL‐2 receptor α), which is highly expressed on Tregs; and granzyme‐mediated cytolysis.7 Tregs also express cytotoxic T lymphocyte‐associated antigen‐4 (CTLA‐4), CD39, CD73, programmed cell death protein 1 (PD‐1) and inducible T‐cell co‐stimulator (ICOS), and these suppress T cells and antigen‐presenting cells.8 In terms of humoral immunity, B cells from patients with IPEX syndrome produce large amounts of autoreactive antibodies and cause hyper‐IgE,9 showing that Tregs play an important role in the maintenance of peripheral anergy in autoreactive B cells. Tregs have specific roles in skin, such as the acceleration of wound healing,10 the promotion of immune tolerance to skin commensal microbes11 and the orchestration of stem cell‐mediated hair follicle regeneration.12 Using an ovalbumin‐expressing mouse model, Rosenblum et al13 demonstrated the existence of skin‐resident memory Tregs, which contribute to mitigating skin inflammation upon repeated antigen exposure. Thus, the function of Tregs in maintaining skin homoeostasis is beginning to be elucidated. This review focuses on some representative autoimmune skin disorders including alopecia areata and vitiligo, which are skin‐specific T cell–mediated autoimmunity; pemphigoid and pemphigus, which are skin‐specific autoantibody‐mediated autoimmunity; and systemic sclerosis, which is a systemic autoimmunity, and discusses the role of Tregs in the pathogenesis of those disorders and questions that should be addressed. 2 ALOPECIA AREATA Alopecia areata (AA) is a site‐specific, T cell–mediated autoimmune disease that affects the hair follicles. The loss of immune privilege in hair follicles associated with an attack by CD8+ T cells on the bulb of the follicle may contribute to the pathogenesis. A study has reported reduced serum TGF‐β levels in patients with AA.14 Meanwhile, no significant difference has been reported in serum IL‐10 levels14-16 and in lesional skin IL‐10 levels17 between AA and healthy control. Thus, the results on Treg‐related cytokines in AA are conflicting. The decreased frequency of Foxp3+ lymphocytes in the scalp lesions of patients with AA has also been reported, whereas circulating CD4+CD25+Foxp3+ Treg levels were marginally higher in severe AA than in mild AA.18 The immunosuppressive function of CD4+CD25+ Tregs is impaired in patients with AA, especially in the ophiasis type of AA, as shown by in vitro assay using TCR stimulation.19 Notably, genomewide association studies (GWAS) have demonstrated single nucleotide polymorphisms in genes that are related to the activation and proliferation of Tregs, such as CTLA‐4, IL‐2, CD25 and Eos (IKZF4, a mediator of Foxp3‐dependent gene silencing in Tregs) in patients with AA.20 These findings suggest that Treg dysfunction is relevant to the development of AA. Interestingly, a recent study using a mouse model demonstrated that Tregs promote hair follicle regeneration by augmenting hair follicle stem cell proliferation and differentiation.12 Thus, skin‐resident Tregs play a major role in hair follicle biology. Castela et al21 reported that the subcutaneous injection of low‐dose recombinant IL‐2 increased the number of Tregs in skin specimens from scalp lesions, resulting in partial hair regrowth, suggesting the possibility that the modulation of Treg number could be a therapeutic strategy for AA. 3 VITILIGO Vitiligo is an autoimmune skin disease of depigmentation that results from the loss of functional melanocytes in the skin. Although the exact pathogenesis remains to be elucidated, studies have demonstrated that CD8+ cytotoxic T cells play a crucial role in inducing the destruction of melanocytes in vitiligo.22 The cytotoxic T cells that produce IL‐6 and IL‐13 induce apoptosis in the melanocytes.23 Furthermore, patients with active vitiligo show greater numbers of CD8+ T cells and lower CD4+/CD8+ ratios than patients with stable vitiligo show.24 Therefore, the imbalance between melanocytes‐reactive CD8+ cytotoxic T cells and Tregs has been suspected as a potential pathogenesis of vitiligo. Many studies have addressed the role of Tregs in vitiligo. The serum level of TGF‐β is significantly lower in patients with vitiligo than in controls, suggesting the dysfunction of Tregs in vitiligo.25-27 The number of circulating Tregs is lower in patients with vitiligo than in controls.24, 27, 28 Furthermore, the frequency and counts of Treg were significantly decreased in the peripheral blood of active patients than in stable patients.24 Significant defects in the immunosuppressive function of CD4+CD25+ Tregs in patients with vitiligo on CD4+CD25− T cells or CD8+ T cells have been shown by in vitro assays with TCR stimulation.27, 28 In vitiligo skin, mRNA levels of molecules related to Treg function were decreased in Foxp3,29, 30 CTLA‐4,31 TGF‐β,30 CCL21 (a ligand for chemokine receptor CCR7)30 and CCL22 (a ligand for CCR4).30 Notably, GWAS using 4680 cases of vitiligo and 39 586 controls identified some associated loci related to immunoregulation, such as CTLA‐4, Eos (IKZF4) and CD80 (a binding partner of CTLA‐4 to inhibit T‐cell activation),32 indicating that a genetic background associated with Treg is involved in the pathogenesis of vitiligo. Some therapeutic approaches involving the manipulation of Tregs have been attempted for the treatment of vitiligo. Chatterjee et al33 examined the immunoregulatory mechanism in vitiligo using transgenic mice that carry T cells with HLA‐A2‐restricted human tyrosinase peptide‐reactive TCR and spontaneously develop vitiligo from an early age. The adoptive transfer of CD4+CD25+Foxp3+ Tregs or treatment with rapamycin, which was reported to be an enhancer of Tregs,34 induces increases in the number of Tregs in skin lesions, resulting in a lasting remission of vitiligo.33 Eby et al35 reported that gene gun treatment whereby CCL22 is introduced into vitiliginous skin lesions on a mouse model promotes Treg recruitment to the lesions, decreases melanocyte‐reactive T cells and leads to significantly reduced depigmentation. These findings show that increasing the number of Tregs at an affected site can be a potential therapeutic for vitiligo. 4 PEMPHIGOID AND PEMPHIGUS Autoantibodies in autoimmune bullous diseases target structural proteins of the epidermis and the epidermal basement membrane zone (BMZ), which cause the loss of cell‐cell adhesion or cell‐matrix adhesion and blistering in the skin. Autoantibodies against BP180, a structural protein at the BMZ, induce bullous pemphigoid (BP). Autoantibodies against desmogleins (Dsg) 1 and 3, desmosomal proteins that are expressed on stratified squamous epithelium including the skin and/or oral mucosa, cause pemphigus foliaceus (PF) and pemphigus vulgaris (PV), respectively. Previous studies reported that peripheral T cells from healthy human donors who carry the susceptible HLA class II alleles of pemphigus vulgaris (PV) or bullous pemphigoid (BP) react to autoantigens.36, 37 Peripheral tolerance may prevent those T cells from activating. However, the number and function of circulating CD4+ CD25+ Foxp3+ Tregs from active patients with BP are similar to those from healthy controls.38 The number of Foxp3+ cells in BP lesions is higher than in control skin.39 A recent study also demonstrated the increased frequency of CD4+CD25++CD127− Tregs in the peripheral blood of patients with BP relative to that in healthy controls.40 In contrast, a significant reduction in circulating CD4+CD25brightFoxp3+ Treg frequency was reported in patients with BP.41 The frequencies of Foxp3+ cells and the numbers of IL‐10+ were significantly lower in skin lesions from patients with BP than in skin lesions from psoriasis or patients with AD, suggesting a possible role of the reduction of Tregs in the pathogenesis of BP.42 Most of these studies did not have functional analyses of Tregs. Rensing‐Ehl et al38 compared the immunosuppressive function of sorted CD4+CD25+ Tregs by co‐culturing them with CD4+CD25− responder T cells at an equal ratio and stimulating them with irradiated allogeneic PBMC or tetanus toxoid. Notably, the immunosuppressive function of Tregs from patients with BP was similar to that of Tregs from healthy controls. Thus, the role of Tregs in the pathogenesis of BP remains controversial. Monoclonal antibodies to PD‐1 or CTLA‐4 have recently been applied for the treatment of melanoma and other neoplasms as immune checkpoint inhibitors, and they are known to suppress Tregs.43, 44 Interestingly, several cases of BP after the administration of those antibodies have been reported.45, 46 In addition, a case of pemphigoid nodularis, a BP subtype, was reported in an IPEX patient.47 These findings suggest that, in some individuals, Tregs suppress T cells that are reactive to BP180 and/or BP230, and that the dysfunction of Tregs may induce the production of autoantibodies to those antigens. In PV, desmoglein (Dsg3)‐reactive type 1 regulatory T cells (Tr1) secreting IL‐10 and TGF‐β are more frequently detected in healthy carriers of PV‐associated HLA class II alleles (DRB1*0402 and DQB1*0503) than in patients with PV, and those Tr1 cells suppress the Dsg3‐reactive T cells in healthy carriers.48 The suppressive function of Tregs has also been demonstrated by a study using an active PV mouse model.49 A recent study demonstrated that the induction of Tregs by the superagonistic anti‐CD28 antibody decreases pathogenic IgG autoantibodies against Dsg3 in a HLA‐DRB1*04:02‐transgenic PV mouse model.50 This study suggests that the modulation of the number of Tregs may provide a novel therapeutic approach against PV. 5 SYSTEMIC SCLEROSIS Systemic sclerosis (SSc) is a systemic autoimmune disorder that is characterized by thickened and sclerotic skin associated with specific autoantibodies. The involvement of internal organs such as the lungs, the gastrointestinal tract, the heart and the kidney is occasionally observed. The pathology of SSc involves three pathways: vasculopathy, fibrosis and aberrant immune activation.51 Many studies have investigated the frequency of Tregs in patients with SSc, and both increases and decreases in their frequency have been reported in peripheral blood52, 53 and in skin lesions.54, 55 The compromised function of CD4+CD25highCD127−/low Tregs in active SSc was also reported.52, 53 The frequency of CD4+CD25brightFoxp3+ Tregs correlates with disease activity and severity in SSc.56 These findings suggest that Tregs play a role in the pathogenesis of SSc, although the significance of that role remains largely unclear. It is known that TGF‐β has potent profibrotic activity, and the expression of TGF‐β‐regulated genes is increased in the skin of patients with SSc.57 Interestingly, a treatment with fresolimumab, a high‐affinity neutralizing antibody that targets TGF‐β, decreases TGF‐β‐regulated gene expression and improves clinical symptoms in patients with SSc,57 suggesting the possible harmful effects of TGF‐β‐producing Tregs in the pathogenesis of SSc. 6 FUTURE DIRECTIONS There are still contradictions in the results regarding the numbers and functions of Tregs, as mentioned above. The variations in methodologies for detecting human Tregs, the age of the studied subjects, and the stages and severities of disease may relate to the inconsistent results in previous reports. Miyara et al58 demonstrated that human CD4+Foxp3+ T cells are divisible into three phenotypically and functionally distinct subpopulations: CD4+CD45RA+Foxp3lo resting Tregs (rTregs), CD4+CD45RA−Foxp3hi activated Tregs (aTregs) and cytokine‐secreting CD4+CD45RA−Foxp3lo non‐suppressive T cells (non‐Tregs). Based on this study, the balance of the three Treg subpopulations has been investigated in some skin diseases.59, 60 Of note, although “non‐Tregs” express Foxp3, they have no immunosuppressive function, suggesting that we should carefully choose the method for detecting or isolating Tregs when we analyse the frequency and function of Tregs in patients. Additionally, the study also demonstrated significant differences in the proportion of the three subpopulations between healthy young donors (between 18 and 40 years old) and aged individuals (between 79 and 90 years old).58 Therefore, we must evaluate the frequency of human Tregs using age‐matched controls. It is also important to notice that Tregs in skin are different from those in blood and secondary lymphoid organs. Fox example, skin‐resident Tregs show activated and memory phenotypes including higher levels of CTLA‐4, CD25, ICOS and CD27 compared to Tregs in blood.61 It is known that conventional CD4+ T cells are mostly activated in human tissues and that activated CD4+ T cells also express Foxp3. Therefore, we should be skeptical of the studies that define Tregs in human skin based solely on expression of CD4 and Foxp3. More sophisticated approaches such as multiparameter flow cytometry or multicolour immunofluorescent microscopy are required to differentiate Tregs from conventional T cells in human skin. In previous studies, functional analyses of Tregs have been commonly performed using TCR stimulation with anti‐CD3 and/or anti‐CD28 antibodies or by co‐culturing with irradiated allogeneic PBMCs.27, 28, 38, 60 If the immunosuppressive function of Tregs is broadly (polyclonally) impaired, why do individuals develop single specific autoimmune diseases but not multiple autoimmunity, such as IPEX syndrome? One possibility is that a portion of the individuals have a genetic background for increased susceptibility to certain autoimmune disorders and carry causative autoreactive T cells that are continuously suppressed by corresponding Tregs in steady state, so that when the immunosuppressive function of Tregs broadly decreases for unknown reasons, the harmful T cells are activated and induce autoimmunity (Figure 1). Maeda et al62 demonstrated that healthy individuals carrying HLA‐A2*0201 possess CD8+ T cells specific to Melan‐A, a self‐antigen expressed by normal melanocytes and targeted in vitiligo. Those CD8+ T cells are anergic and highly express CTLA‐4 and CCR7. In vitro experiments demonstrate that those anergic CD8+ T cells are induced by co‐culturing with CD25highCD4+ Tregs upon antigen stimulation. Melan‐A‐specific CD8+ T cells from healthy individuals express CTLA‐4 at higher levels than those from patients with vitiligo. These findings strongly suggest that the Treg‐mediated induction of anergy in autoreactive T cells is crucial for maintaining self‐tolerance.62 Therefore, we should ideally perform suppression assays using isolated antigen‐specific Tregs and by stimulating them with specific autoantigens, although this is still technically challenging. To find candidates for predisposing factors for autoimmune diseases, comprehensive gene analyses, including GWAS, whole‐exome sequencing or whole‐genome sequencing, may be useful. Most previous studies examined the function of patients’ Tregs using Tregs derived from peripheral blood, because such blood is accessible. However, as previously reported,61 skin‐resident memory Tregs may play an important role in suppressing T cell–mediated inflammation in skin. By contrast, in humoral immunity, CD4+ T follicular helper (Tfh) cells have a particular function in providing T cell help to follicular B cells,63 and they are responsible for the production of autoantibodies;64 also, a subset of Tregs, T follicular regulatory cells (Tfregs), control the expansion of Tfh cells in the germinal centres in secondary lymphoid organs.65 Thus, the appropriate tissue or cell subset for analysing the function of Tregs depends on the type of disease. We should pay attention to this when we plan experiments and interpret the data. In summary, Treg dysfunction is known to be associated with the pathogenesis of certain autoimmune disorders in dermatology, and Treg biology has started to be elucidated. Various approaches to regulate the autoimmunity through the manipulation of Tregs have been tried. A further understanding of Treg properties by investigations with optimal experimental methods promises to lead to novel therapeutic strategies for autoimmune skin diseases. ACKNOWLEDGEMENT None. CONFLICT OF INTEREST The authors have no conflict of interests to declare. AUTHOR CONTRIBUTIONS HU designed the study and wrote the manuscript. REFERENCES Citing Literature
|
|
Scooped by
Gilbert C FAURE
June 2, 2019 5:04 AM
|
Abstract Epidemiological data suggest that previous infections can alter an individual's susceptibility to unrelated diseases. Nevertheless, the underlying mechanisms are not completely understood. Substantial research efforts have expanded the classical concept of immune memory to also include long‐lasting changes in innate immunity and antigen‐independent reactivation of adaptive immunity. Collectively, these processes provide possible explanations on how acute infections might induce long‐term changes that also affect immunity to unrelated diseases. Here, we review lasting changes the immune compartment undergoes upon infection and how infection experience alters the responsiveness of immune cells towards universal signals. This heightened state of alert enhances the ability of the immune system to combat even unrelated infections but may also increase susceptibility to autoimmunity. At the same time, infection‐induced changes in the regulatory compartment may dampen subsequent immune responses and promote pathogen persistence. The concepts presented here outline how infection‐induced changes in the immune system may affect human health. 1 Introduction People react differently to immunological challenges, such as infections or cancer, and show large variance in their susceptibility to inflammatory diseases, such as allergies or autoimmunity. The responsiveness of the immune system is naturally to a large degree determined by genetic factors. However, a series of recent studies have revealed that genetic factors can only explain about 50–75% of the immune trait variance and the immune profile of an individual is thus to an astonishingly large degree determined by environmental factors.1, 2 There is robust epidemiologic evidence that the decreasing frequency of infections in developed countries correlates with a rising prevalence of allergies and other inflammatory disorders, as already put forward in the hygiene hypothesis almost 30 years ago.3 The hypothesis has since been expanded and adapted to account also for the rise in autoimmunity in developed countries.4 Indeed, reduced incidence of infections and lower microbiotic diversity in developed countries correlate with an increased prevalence of clinical conditions that are caused by inappropriate immune responses, such as allergy and autoimmunity—and possibly even cancer.5 These data indicate that both pathogenic and nonpathogenic microorganisms play a fundamental role in educating the immune system.6 While the specific mechanisms regulating how the immune response to one pathogen alters the response to a later infection with another pathogen or the susceptibility to autoimmunity, allergy, or cancer have been studied in some individual combinations, a global picture of how infection history affects disease susceptibility is still lacking. Twin studies have been used to determine heritable versus nonheritable influences in immune responses elicited by vaccinations and the development of autoimmune diseases and found that both aspects strongly affect the immunological status of an individual.7 The microbes (commensal and pathogenic) an individual encounters throughout his or her life are most likely a major determinant for the nonheritable factors. Indeed monozygous twin pairs, from which only one twin acquired cytomegalovirus (CMV) infection, show greatly enhanced variation for immune parameters after the infection.1 Chronic infections, like CMV, and continuous interactions with commensal microbiota thus shape the immune system. Intriguingly, accumulating evidence suggests that transient challenges, such as acute infections and vaccinations, also have nonspecific effects on the ability of the immune system to react to other diseases.8, 9 Several adaptations of the immune system that could contribute to this altered reactivity have been reported, which include changes in the innate and adaptive arm of the immune system as well as alterations in its regulatory mechanisms. The following sections illustrate the long‐term changes that pathogen encounters elicit in these different parts of the immune system (Figure 1), how the sum of these changes contributes to shaping the immune system over time and how this may affect susceptibility to unrelated diseases. 2 Infection‐induced Changes in the Immune System 2.1 Infections Generate Pathogen‐Specific and Heterologous Immunity The capability to memorize previous pathogenic encounters and thereby confer superior protection if the same pathogen is re‐encountered represents a well‐established core feature of the vertebrate adaptive immune system. Memory T cells can rapidly re‐expand and are activated upon engagement of their cognate antigen with their T‐cell receptor (TCR). Antibody production by memory B cells furthermore contributes to rapid and more robust responses upon re‐encounter with a specific pathogen. Although these mechanisms constitute the basis for vaccinations, early observations have noted that certain vaccines such as Bacillus Calmette‐Guérin (BCG), which protects against tuberculosis, can improve overall childhood survival.10 These observations have hinted that the immune system cannot only learn to defend its host against re‐encounter with the same pathogens but might also become superior in fighting other, unrelated pathogens under certain circumstances. To date, a number of mechanisms have been described that are believed to contribute to heterologous immunity (Table 1). These include cross‐reactivity and bystander activation of T cells as well as trained immunity of innate immune cells. A general feature of innate and adaptive immune cells that have participated in an immune response is an altered epigenetic landscape.28, 29 These alterations could put them in a “poised state” and add an additional layer of responsiveness towards inflammatory cues, such as cytokines and the engagement of germline‐encoded receptors, during heterologous immune challenges. To date, a number of studies have shown how mechanisms of heterologous immunity can, on the one hand, contribute to protection against newly encountered infections of their host but, on the other hand, pose a potential risk for immunopathology or the establishment of autoimmune disorders. Process Protection against heterologous infection Reference Memory Cross‐reactivity 42-44, 46 or [36], 45 Bystander activation 56, 57 Trained immunity 11, 14, 57 Microbiota/chronic infection 27, 61 or 72 Physical remodeling 9, 64 Tregs 73, 75 2.2 How Selective Are Adaptive Immune Cells? The most striking feature of T cells and antibodies produced by B cells is their unique specificity for their cognate antigen. This enables the formation of immunological memory, directed responses, and protects from the emergence of autoreactive T cells. But just how specific are T cells and antibodies really? About two decades ago, Mason30 argued that cross‐reactivity of the TCR is required for robust immunological protection. He supported this hypothesis with a simple but conclusive model, in which the number of monospecific naïve T cells required to cover all possible foreign peptides would be impossible to generate and maintain in a physiological context. Indeed, cross‐reactivity has emerged as a common, or even necessary, feature of T cells and antibodies with potentially beneficial and adverse consequences for the host.31 Whether a T cell or an antibody cross‐reacts with different antigens is determined by the sequence and structural similarities of these antigens. Such similarities, also known as molecular mimicry, can occur between self‐ and foreign antigens.32 Importantly, molecular mimicry can result in autoimmunity through inappropriate responses of cross‐reactive T cells that were primed during microbial encounters and are subsequently activated by recognition of self‐antigens.32, 33 Conversely, T‐cell clones with a strong affinity towards a specific self‐antigen will be deleted during their maturation process and thereby the T‐cell pool responsive towards a similar microbial or tumor antigen might be reduced.34 In addition to this, cross‐reactivity towards different foreign antigens was also frequently observed in subsequent infections with related but also unrelated viruses. Some studies have shown that cross‐reactive memory T‐cell clones can be favored over non‐cross‐reactive clones during heterologous infections, thereby altering the relative contributions of different T‐cell clonotypes, also known as immunodominance (Figure 2).35 In extreme cases this could skew the immune response towards cross‐reactive epitopes and thereby facilitate viral escape by mutation of the respective epitope.36 Although cross‐reactive memory T cells could help to confer protective immune responses towards unrelated pathogens, they also pose a risk for immunopathology.37, 38 This is showcased by a study, in which lymphocytic choriomeningitis virus (LCMV)‐immune mice were challenged with influenza A virus (IAV) infection and the degree of IAV‐specific T cells cross‐reacting with LCMV‐peptides correlated with the degree of lung injury.39 Several studies have also found evidence for the significance of cross‐reactive T cells in human infectious diseases. Epstein–Barr virus (EBV) is a common infection in humans and well known as the causative agent of infectious mononucleosis (IM). IM involves pronounced activation and proliferation of CD8+ T cells and can vary considerably in severity. T‐cell clones recognizing IAV epitopes were identified among the T cells activated during IM.40 Moreover, the frequency of IAV and EBV cross‐reactive CD8+ T cells was reported to correlate with disease severity during IM.41 Conversely, a more recent study suggested that some IAV‐specific T‐cell clones might be protective against infection with EBV.42 These contrasting results highlight that the relationship between cross‐reactive T cells and the outcome of heterologous infections may be very complex and not only depend on the respective pathogens but also on the specific cross‐reactive antigens or T‐cell clones. Antibodies and T cells are also commonly cross‐reactive to different species of flavivirus, including the Zika virus (ZIKV) and the dengue virus (DENV). CD8+ T cells from DENV‐immune mice can contribute to immunity against experimental ZIKV infection.43 In line with these reports, a stronger T‐cell response and altered immunodominance pattern were also observed in DENV‐pre‐exposed patients upon ZIKV infection.44 In contrast to the potentially protective role of cross‐reactive CD8+ T cells, several publications have indicated that cross‐reactive antibodies from DENV‐exposed humans or mice can enhance ZIKV infection.45 Thus, it is exceedingly difficult to dissect and determine the overall contribution of previous DENV exposure to infection with ZIKV or disease pathogenesis. Nevertheless, a recent epidemiological study of local residents in Brazil found that previous exposure to DENV is associated with a lower risk of ZIKV infection.46 Overall, the evidence for protective functions of cross‐reactive T cells or antibodies in humans is still rare. This does not seem surprising, as it would likely not result in any clinical symptoms. However, memory‐phenotype CD4+ T cells with specificities for human immunodeficiency virus (HIV), CMV, and herpes simplex virus (HSV) have been found in the blood of donors who were never infected with these viruses.16 The same study also showed that IAV‐specific T cells that expanded in individuals following flu vaccination were able to recognize other microbial peptides, thus indicating that vaccinations could induce long‐lived T cells that cross‐react with peptides derived from unrelated pathogens. 2.3 Training Shapes Innate Immunity The long‐standing dogma that memory features can only be acquired by adaptive immune cells has been overthrown by a number of studies within the last decade. Innate immune cells such as natural killer cells (NK cells) and myeloid cells can also form a type of memory that has been termed “trained immunity.”47 For instance, NK cells that were preactivated had a higher cytokine response upon reactivation.48 Furthermore, preactivated NK cells showed higher proliferative capacity than nonactivated controls and could thereby maintain enhanced function.49 Importantly, it was demonstrated that preactivation of NK cells can enable them to respond more potently towards tumor cells.50 In contrast to other innate cells, NK cells are also able to form antigen‐dependent memory by expression of the germline‐encoded receptor Ly49H, which specifically recognizes a mouse cytomegalovirus (MCMV)‐encoded glycoprotein.51 Through this mechanism, MCMV‐specific NK cells can generate a pool of long‐lived memory cells. Myeloid cells are also able to acquire a “trained” phenotype, which enables them to respond more efficiently to inflammatory stimuli. Trained monocytes were able to confer protection from reinfection with the opportunistic fungal pathogen Candida albicans in mice lacking adaptive immune cells.11 This study also showed that β‐glucans, a component of the fungal cell wall, could train the monocytes and induced changes in their histone methylation. Indeed, epigenetic changes have been shown to be a hallmark of trained monocytes.28 Training of monocytes could also contribute to a potential heterologous protection through BCG vaccinations, which has been frequently discussed.12 In a study addressing this hypothesis, monocytes from BCG‐vaccinated donors acquired epigenetic modifications and exhibited higher functional responsiveness to heterologous inflammatory stimuli when compared to monocytes that were collected before vaccination.13 Furthermore, a BCG vaccination trial in humans showed that epigenetic remodulation of monocytes correlated with cross‐protection against experimental yellow fever virus (YFV) challenge.14 Different functional states in immune cells are accompanied and supported by changes in cell metabolism.17 In accordance with this observation, metabolic and epigenetic changes associated with trained immunity are closely interlinked. BCG‐induced trained immunity in monocytes is dependent on alterations of cellular metabolism, most notably the induction of glycolysis.18 More evidence for the connection between trained immunity and metabolism was provided by a recent study, which showed that the metabolite mevalonate can induce trained immunity in monocytes.19 Because monocytes are rather short‐lived cells, the question arose whether their precursor cells in the bone marrow might acquire a different phenotype through immune training and thereby influence myelopoiesis. A combination of three studies approaching the subject with different murine models of immune training—β‐glucan administration, BCG vaccination, and sterile inflammation induced by a high‐fat western diet—all found that the hematopoetic precursors of myeloid cells were modified and thereby constitute an important component of trained immunity.20 However, trained immune cells may also be detrimental to host fitness in certain settings and contribute to disease manifestation. Monocytes isolated from patients with symptomatic atherosclerosis showed epigenetic modifications and expression levels of glycolytic enzymes that could be attributed to trained immunity.15 Innate immune cells in the brain can also acquire a trained state and thereby affect central nervous system inflammation. In mice, inflammation‐mediated modulation of brain‐resident macrophages (microglia) affected neuropathology in diseases like an experimental Alzheimer's model.52 Interestingly, the authors of the latter study found pronounced, microglia‐dependent differences in brain cytokine content depending on the administration of the inflammatory stimulus. Repeated injection resulted in a tolerant state, whereas a single administration was connected to a training effect and therefore a lower threshold for activation. This highlights the ability of the innate immune system to adapt to different kinds of stimuli and thereby provides important insights for the design of immunotherapies. 2.4 T Cells Show Unexpected Talents As previously mentioned, T cells express a TCR that is unique for each clonotype and can recognize its cognate antigen in the context of MHC presentation. Two additional signals are required in order to direct the T cell to an appropriate response or differentiation: the engagement of costimulatory receptors and signals provided by cytokines. However, depending on the differentiation status of T cells, they can also be activated independent of TCR stimulation and therefore respond in a nonspecific manner during a heterologous immune challenge. This phenomenon has been termed “bystander” or “innate‐like” activation of T cells. While TCR‐dependent activation of T cells is rather well described, the understanding of T‐cell activation by cytokines or germline‐encoded receptors without recognition of cognate antigen is still quite limited. The first observations that memory‐phenotype CD8+ T cells can be activated by cytokines in the absence of TCR signaling were already made about 20 years ago. In particular, the proliferation of memory‐phenotype CD8+ T cells in mice could be induced with cytokine interleukin‐15 (IL‐15).53 Some groups that observed bystander activation or proliferation of T cells have argued that the biological relevance would be rather minimal.37, 54 Although this may be true for the models used in the respective studies, other groups have argued for a significant contribution of bystander T cells in various settings. It has become clear that innate‐like activation of memory T cells depends on a number of variables like the cytokine environment, tissue homing or residency, and ligand expression of other cells, which are likely not met by all commonly examined virus infections or inflammation models. Importantly, the cytokine profile that is induced by innate cells during a heterologous challenge needs to fit the requirements for innate‐like activation of T cells. Some cytokines, in particular IL‐12, IL‐18, or IL‐15, were shown to potently induce interferon‐γ (IFN‐γ) production or cytolytic activity in memory CD8+ T cells.55 In mouse models, activation of memory CD8+ T cells in an antigen‐independent manner contributed to protection against heterologous infection with Listeria monocytogenes.56 In addition to cytokines, engagement of germline‐encoded receptors can also contribute to TCR‐independent activation of memory CD8+ T cells. Such receptors can be expressed by innate as well as adaptive immune cells and detect a wide range of signals that are associated with infections or malignant cells. Some adaptive immune cells can also be activated in the absence of their cognate antigen through the recognition of these general signals in combination with cytokine stimuli. NK receptors like NKG2D are broadly expressed on memory CD8+ T cells in mice and humans. Antigen‐independent activation of memory T cells through NKG2D engagement could have beneficial effects for early pathogen control and thereby support innate immunity.57 In contrast to this protective role, engagement of NKG2D in bystander memory T cells may also result in immunopathology under certain conditions, as shown in the context of Leishmania major infection in mice.58 In humans, NKG2D engagement on CD8+ T cells is thought to contribute to immunopathology in celiac disease.25 Furthermore, a recent report described how TCR‐independent activation of memory CD8+ T cells by IL‐15 and NK‐receptor engagement might significantly contribute to liver injury in patients during acute hepatitis A virus infection.26 Overall, these findings reveal that innate‐like activation of bystander T cells might have a significant impact on disease outcome depending on the inflammatory context (Figure 3). It has become clear that cytokines released by innate cells and engagement of NK receptors can trigger TCR‐independent activation of memory or effector T cells and thereby add an additional layer to the immune response. Nevertheless, many important questions concerning this mode of T‐cell activation remain to be answered: for instance, which specific T‐cell subsets can be activated independent of antigen recognition. 2.5 Microbe Exposure Shapes the Immune System The human body is not just challenged by infections; it is also colonized by a diverse collection of viruses, as well as the microbiota, which is composed of microorganisms like bacteria, fungi, and protists. The microbiota mostly resides at barrier sites such as the skin or the gut and plays an important role in training and shaping the host immune system, allowing for induction of protective immunity to combat infections but also the establishment of immune tolerance.59 However, changes in the microbiota composition or diversity induced by hygiene conditions, overuse of antibiotics, or diet can prevent the maturation and maintenance of a healthy and balanced immune system and predispose to inflammatory diseases and autoimmunity. Furthermore, depending on the context, commensal microorganisms can become pathogenic and vice versa.60 Microbiota as well as ongoing chronic infections continuously condition cells of the immune system and thereby enable a rapid response to infectious challenges through trained immunity and bystander activation. This is illustrated by the observation that antibiotic treatment, which leads to a transient elimination of the bacterial microbiota, markedly reduces the efficacy of vaccinations as well as parasite‐specific immune responses.27 Similarly, several chronic infections were shown to enhance immune responses to unrelated pathogens.61 At the same time, the heightened state of alert in persistent virus infections can also enhance immune responses that are harmful to the host as, e.g., those causing colitis or other inflammatory disorders and thus exacerbate disease.62 2.6 Infections Can Cause Long‐Lasting Physical Changes In addition to changing the composition and function of immune cells, infections often also induce physical changes in the host that, in some cases, even persist after the infection has been cleared. These changes can alter the microenvironment of the affected organ as outlined here for sepsis or they can induce persisting structural changes as seen in Yersinia pseudotuberculosis (Y. pseudotuberculosis) infection. These changes have a large impact on subsequent immune responses as they alter the ability of the host to counter infections but also influence the development of inflammatory disorders and therefore affect susceptibility to a broad spectrum of diseases that are not related to the initial infectious agent. Severe, life‐threatening infections can trigger massive immune responses that are known as sepsis. Severe sepsis entails multiorgan dysfunction and is often accompanied by sepsis‐induced immunosuppression and a high risk of developing pneumonia. This immunosuppressed state persists for weeks even after patients appear to have “recovered” from sepsis itself.63 A recent study revealed that the primary infection induces lasting changes in the local microenvironment in that it promotes the induction of regulatory T cells (Tregs). These dampen the immune response and compromise effective immune responses to a secondary challenge, leaving the host susceptible to infections.64 This suggests that intervention strategies that interfere with Treg induction or function may be able to revert the generalized immune suppression in sepsis patients and improve their survival. Indeed, blockade of the PD‐1/PD‐L1 pathway, which interferes with Treg function, can restore immune function and improve survival of sepsis patients.65 Overall, this suggests that preceding infections induce long‐lasting changes in the local cytokine milieu, immune cell composition, and function that can alter the susceptibility to subsequent immune challenges. The potent immune responses induced to rapidly eliminate the infectious agents are often also accompanied by a certain degree of collateral tissue damage. Once the infection is cleared, tissue damage is usually repaired and function is restored. However, in some instances, such as in Y. pseudotuberculosis infection, extensive structural changes occur and persist even after the infection is cleared.9 Acute infection with Y. pseudotuberculosis results in the relocation of dendritic cells that persists even beyond the clearance of Yersinia and leads to a markedly reduced efficacy of subsequent oral vaccinations.9 At the same time, the sustained inflammation might set the stage for chronic disorders, such as inflammatory bowel disease or celiac disease, which share many features with the inflammation induced by Yersinia infection.66 Infection‐induced structural changes can thus serve as a direct link between acute infections and the development of chronic inflammatory disorders. In both examples listed here, sepsis and Yersinia challenge, the infection leads to long‐lasting changes in the local cytokine milieu that can be immune suppressive or stimulating and persists beyond the clearance of the infection. Given their constant exposure to external challenges as well as constant stimulation through commensals, barrier tissues might be at particularly high risk of accumulating these kinds of immunological scars, predisposing for inflammatory disorders such as inflammatory bowel or celiac disease, psoriasis, allergies, or asthma but also infectious diseases such as pneumonia or gastrointestinal infections. 2.7 Pathogen Encounter Shapes the Regulatory Immune Response Pathogen encounter not only initiates a proinflammatory immune response to eliminate the infection, but also induces a regulatory response that balances these effects to limit immunopathology resulting from excessive activity. At the same time, these regulatory responses can favor pathogen persistence and chronic infections. Myeloid suppressor cells, regulatory B cells, and Tregs are the mediators of this regulatory response. Tregs act through diverse mechanisms,67 and like all T cells, are activated through the engagement of their TCR by antigen together with costimulatory signals.68 However, in contrast to conventional T cells, the TCR repertoire of Tregs is shifted towards self‐antigens.69 This implies that Tregs can be activated independently of foreign antigen in all settings that enhance costimulatory signals. Once activated, their suppressive mechanisms allow Tregs to inhibit responder T cells irrespective of their antigen specificity, a mechanism known as bystander suppression. Furthermore, cytokines released upon tissue damage, such as IL‐33 and IL‐18, have been shown to be able to activate Tregs even in the absence of a TCR signal,70 allowing Tregs to rapidly respond to tissue damage in a bystander fashion and limit immune pathology by dampening the immune response. Pathogen‐ or microbiota‐induced changes in Treg frequency or function could therefore have a strong impact on immune responses to heterologous challenges. The composition of the microbiota has been shown to be a major determinant for the induction of pro‐ versus anti‐inflammatory T‐cell responses. While segmented filamentous bacteria promote proinflammatory T‐cell responses and systemic autoimmunity,71 Clostridia and their metabolic by‐products induce Tregs that have systemic suppressive effects and contribute to maintaining immune homeostasis.72 Similarly, persistent pathogens often induce an increase in Tregs and thereby limit the pathogen‐specific immune response, allowing for pathogen persistence (Figure 4). This extends to all classes of persistent pathogens, including chronic viral, bacterial, and parasitic infections, such as tuberculosis, leprosy, or malaria, where patients with poor anti‐pathogen responses and persistent disease show an increase in Tregs.73 An extensive body of work also outlines the central role of Tregs in parasite persistence in helminth infections and the extensive interplay between the parasites and the immune system.74 Importantly, the generalized suppression of immunity by helminth‐induced Tregs also extends to modulation of unrelated immune responses, as helminth‐infected patients show reduced immune responses towards childhood vaccines or other parasites.75 Given that coinfections with helminths and malaria and/or tuberculosis are still frequent in many low‐income countries, it will be important to determine whether the immune‐suppressive effect of pathogen‐induced Tregs continues to increase with increasing infectious burden and how this could be counteracted to allow for pathogen clearance and efficient vaccination strategies against prevalent diseases. Interestingly, the high levels of parasitic infections in low‐income countries also seem to have beneficial effects in that inflammatory and autoimmune disorders are much less frequent than in the developed world.74 In a cohort of Argentinian multiple sclerosis patients, individuals who unintentionally acquired a helminth infection displayed elevated Treg frequencies and remission from the symptomatic disease. This was reversed upon anti‐helminth treatment and accompanied by a loss of the regulatory response and clinical relapse.21 These findings could also be recapitulated in experimental animal models where helminth infection protects mice from inflammatory disorders such as celiac disease and allergy and this protection can be transferred to naïve animals via Treg transfer.22 These findings have led to therapeutic approaches in clinical trials that capitalize on the ability of parasite extracts to induce Tregs and thereby dampen inflammatory immune responses. The stimulation of Treg activity has thus emerged as a central concept that explains the beneficial effects of certain microbiota and parasitic infections in ameliorating inflammatory diseases such as allergy and autoimmune disorders as well as improving transplantation tolerance.23 Recent research has also revealed that Tregs themselves represent a mixture of functionally diverse subsets. Furthermore, infectious challenges can transiently alter the composition and function of Tregs to allow for the induction of anti‐pathogen responses but also efficiently shutting down the effector response once the infection has been cleared (Figure 4).24 Most likely, these temporary changes in Treg composition not only affect immune responses against the ongoing infection but also would alter suppression of autoreactive immune cells or cells specific for persistent pathogens. Indeed, epidemiological data revealed that several autoimmune diseases show a correlation with certain pathogens, although these do not induce the disease. In the case of multiple sclerosis, many different viruses were investigated as a possible cause, most recently EBV. However, there is no proof that any of them causes multiple sclerosis.76 Similarly, there is a strong correlation between enterovirus species and type 1 diabetes, but again, there is no indication that the virus can actually cause islet destruction.77 As such, the viral infections that are associated with the diseases likely serve as their environmental triggers without being the causative agent. We propose that in addition to infection‐induced training of innate immunity, bystander activation of memory cells and reactivation of cross‐reactive lymphocytes, changes in Treg composition and function may allow an autoreactive immune response to unfold and thus contribute to the manifestation of autoimmune diseases. In contrast, infection‐induced changes in Treg composition could also result in a more potent suppression of immune responses and thereby promote pathogen or tumor persistence. 2.8 Speaking the Same Language—Educated Immune Cells Respond to Universal Signals As outlined in the preceding sections, infections trigger long‐lasting changes in both the innate and adaptive arm of the immune system that go far beyond classical memory. Infection experience seems to equip both types of immune cells with an altered responsiveness towards two types of universal signals: cytokines and the ligation of germline‐encoded receptors. Innate cells are thus able to respond more quickly and potently as observed in trained immunity. Adaptive immune cells are able to rapidly participate in an immune response even in the absence of their cognate antigen as observed in bystander activation. Following infection, immune cells adopt a state of alertness that persists even beyond pathogen clearance and is maintained by epigenetic modifications.28, 29 This education of the immune system likely re‐enforces a first line of defense in heterologous challenges and thereby reduces the magnitude of the immune response required to control the secondary infection and allows the host to preserve its resources. In addition, this heightened responsiveness might serve as a means to compensate for the loss of clonal diversity that is observed with age and contributes to the higher susceptibility of older people to infections.78 Indeed, a recent study found that the effect of non‐heritable factors on the immune response becomes more dominant with age, most likely due to the accumulating effect of environmental influences.1, 79 Interestingly, the frequency of Tregs was more strongly determined by environmental factors with progressing age,1 suggesting that infection‐induced changes in Treg frequencies and function might be an important factor in shaping the immune response and determining susceptibility to infectious and inflammatory diseases. Trained immunity and bystander activation both show positive effects on pathogen control and maybe even anti‐cancer immunity as outlined above (Table 2).50 At the same time, heterologous immunity can also have negative consequences for the host such as increased tissue damage as seen in hepatitis26 and likely also contributes to disease in the context of autoimmunity. Most of the changes observed in an experienced immune system reported to date result in enhanced inflammatory responses and increased cytotoxicity (through NK and cytotoxic T cells). Whether similar mechanisms also exist in cells contributing to allergic responses or anti‐helminth immunity, such as mast cells, eosinophils, or T helper cells, remains to be determined (see Table 2). Similarly, how cells participating in a heterologous response are regulated is still completely unclear. While Tregs have been shown to have tissue protective effects upon antigen‐independent activation,70 it is unclear which cell type might dampen and limit heterologous immunity to prevent immune pathology. Although many questions still remain open, recent developments have made it clear that immune cells are more versatile than previously appreciated. In addition to their classical functions, infection‐experienced immune cells rapidly respond to stimulation by cytokines or germline‐encoded receptors and initiate potent heterologous immune responses that contribute to pathogen control but might also enhance immune pathology. Branch Cell type Mechanisms Possible disease associations Potential impact on host Innate Macrophages ● Epigenetic changes in progenitor cells ● Heterologous protection27, 60 Beneficial ● Proinflammatory phenotype ● Neuropathology68 Harmful ● Enhanced responsiveness ● Atherosclerosis67 NK cells ● Cytokine‐induced epigenetic changes ● Antitumor responses56-58 Beneficial ● Cytokine production ● Heterologous protection? ● Cytotoxicity ● Tissue damage? (mechanism may be similar to memory bystander CD8+ T cells) Harmful Granulocytes ● Epigenetic changes in progenitor cells? ● Heterologous protection? Beneficial ● Allergic disease? Harmful Mast cells ● Epigenetic changes? ● Heterologous protection? Beneficial ● Allergic disease? Harmful Adaptive Effector and memory CD8+ T cells ● Epigenetic changes ● Heterologous protection21-24 Beneficial ● Cytokine production ● Antitumor responses? ● Cytotoxicity ● Tissue damage76-78 Harmful Effector and memory CD4+ T‐helper cells ● Epigenetic changes ● Heterologous protection? Beneficial ● Cytokine production ● Autoimmunity? Harmful Regulatory ● Epigenetic changes? ● Tissue protection? Beneficial T cells ● Tissue abundance? ● Immune homeostasis? ● Enhanced responsiveness? ● Promoting pathogen persistence? Harmful ● Hampered antitumor responses? 3 Conclusions and Outlook The concepts presented here outline how pathogens and commensals induce long‐term changes in the immune system that affect subsequent immune responses and impact human health. Animal models and clinical studies show that vaccinations, prior infections, or coinfections can modify the immune response to unrelated pathogens. Additionally, a number of inflammatory diseases have been linked to infections but finding direct associations between pathogens and the initiation of these disorders has remained difficult. This might in part be due to the fact that infections can induce long‐term changes in the immune system that may persist even once the infection is cleared. These effects likely accumulate over time and the onset of inflammatory disease does not have to coincide with the infectious trigger(s). Similarly, infection history can also induce changes that enhance the regulatory properties of the immune system and thus favor the establishment of chronic infections and prevent protective immunity against cancer. Future work should be aimed at further unraveling the mechanistic basis for these changes in the immune system and most importantly also at bringing these concepts together to reveal a more comprehensive picture of the mechanisms underlying heterologous immunity. Each new infection or immune trigger an individual is exposed to during a lifetime will educate and potentially alter the dynamics of their immune system and it is important that this is taken into account in preclinical models. Future research should identify the factors that shape the immune system in these processes and determine how heterologous secondary immunity affects vaccine efficiency and immune therapies targeting inflammatory disorders or cancer to be able to optimize preventive and therapeutic interventions in the future. Conflict of Interest The authors declare no conflict of interest. References
|
|
Suggested by
Société Francaise d'Immunologie
April 24, 2019 5:21 AM
|
Abstract Objectives To determine the presence and clinical associations of the soluble receptors of B cell‐activating factor from the tumor necrosis factor family (BAFF) in serum of patients with systemic lupus erythematosus (SLE). Methods Serum BAFF and soluble BAFF receptor (sBAFF‐R) were quantified using ELISA, and soluble B cell maturation antigen (sBCMA) and transmembrane activator and cyclophilin ligand interactor (sTACI) by Luminex, in 87 SLE patients and 17 healthy controls (HC). Disease activity and organ damage were assessed using SLE Disease Activity Index 2000 (SLEDAI‐2K) and Systemic Lupus International Collaborating Clinics (SLICC) SLE Damage Index (SDI), respectively. Results BAFF and all receptors were detectable in all serum samples. Serum sBCMA and sTACI, but not sBAFF‐R, were significantly higher in SLE than in HC. Serum BAFF was also increased in SLE, but this association was attenuated after adjusting for age and ethnicity. Increased serum BAFF was associated with flare and organ damage. Increased serum sBCMA was associated with the presence of anti‐dsDNA, but not with overall or organ‐specific disease activity, flare or organ damage. Neither sTACI nor sBAFF‐R was associated with any SLE clinical parameters in multivariable analysis. While serum BAFF correlated negatively with sBAFF‐R in HC, no statistically significant correlations were observed between BAFF and its receptors in SLE patients. Conclusion Serum BAFF was associated with flare and organ damage independent of the presence of its soluble receptors. While sBCMA was associated with anti‐dsDNA positivity, other soluble BAFF receptors were not associated with SLE clinical indicators. Introduction Systemic lupus erythematosus (SLE) is an unpredictable and multifaceted chronic systemic autoimmune disease.1 One of the most prominent breakthroughs in SLE has been the discovery of the pathogenic role of B cell‐activating factor from the tumor necrosis factor (TNF) family (BAFF) [also known as B lymphocyte stimulator (BLyS)].2 BAFF has a crucial role in B cell maturation, differentiation and survival, and is part of the BAFF/a proliferation‐inducing ligand (APRIL) system. BAFF and APRIL ligate two cognate receptors, transmembrane activator and cyclophilin ligand interactor (TACI) and B cell maturation antigen (BCMA), and BAFF also ligates BAFF receptor (BAFF‐R).2 These receptors transduce distinct signals; BCMA activation is important for long‐lived plasma cell survival, BAFF‐R activation for survival and maturation of immature B cells and TACI for B cell regulation, class‐switch recombination and T cell‐independent antibody responses.2 BAFF‐transgenic mice develop SLE‐like features,3 and high serum BAFF levels are a feature of some mouse models of SLE‐like disease.4 Compared to healthy controls (HC), patients suffering from SLE harbour significantly higher serum BAFF levels.2 Serum BAFF has also been reported to be associated with disease activity and autoantibody levels in some studies.2 The efficacy of a BAFF‐targeting therapy, belimumab,5, 6 gives weight to the fact that BAFF plays a critical pathogenic role in SLE. Nevertheless, this therapy is effective only in a subset of SLE patients,5, 6 suggesting a potential BAFF‐mediated subset of SLE, and a significant unmet need for tools to stratify patients in order to define who may benefit from such therapy. Published studies regarding the potential role of serum BAFF as a SLE biomarker are inconsistent,2 both at the overall and organ‐specific disease activity level. Amongst all potential causes for these discrepancies, the presence of soluble BAFF receptors in human SLE patients needs to be considered. Hoffmann et al. reported the existence of a soluble form of TACI (sTACI) as the ectodomain of transmembrane TACI, produced following cleavage of TACI by the metalloproteinase ADAM10 from the cell surface of activated B cells. When further cleaved by γ‐secretase, sTACI can oligomerise to act as a decoy receptor for both BAFF and APRIL.7 The same group also reported the presence of a soluble form of BCMA (sBCMA) in human sera, produced from cleavage of BCMA from plasma cells by γ‐secretase, which in vitro acts as a decoy receptor specific for APRIL.8 The same group showed that sBCMA can also be shed by plasmacytoid dendritic cells via a similar γ‐secretase‐dependent cleavage.9 One study has reported the existence of sBAFF‐R,10 a soluble form of the receptor released by human decidual stromal cells ex vivo, and an inhibitory role in the regulation of interleukin (IL)‐6 and TNF secretion by monocytes has been suggested.10 Some published studies have reported the presence of soluble forms of BAFF receptors in human serum. All three soluble BAFF receptors have been reported in rheumatoid arthritis,11 and sTACI and sBCMA have been described in multiple sclerosis, multiple myeloma and patients with chronic lymphocytic leukaemia.7, 8, 12-14 One group recently reported the presence of sBCMA and sTACI in human SLE7, 8; however, this was in a cohort of modest size (N < 50), and did not investigate clinical phenotypic associations, or association with flare or organ damage. To date, there are no publications on sBAFF‐R in SLE. Here, we aimed to determine the presence and clinical associations of serum soluble BAFF receptors in SLE. Results Participants’ baseline characteristics This study included 87 SLE patients, whose baseline characteristics are displayed in Table 1. Briefly, median [interquartile ranges (IQR)] age and disease duration were 44.3 [33.2, 56.4] and 7 [3.8, 14.8] years, respectively. The cohort was predominantly female (89%), 56% of patients were of Asian ethnicity, 36% of patients had active disease, and 62% had permanent organ damage. In all, 57% and 51% of patients were receiving glucocorticoids and immunosuppressants, respectively. Seventeen healthy individuals were enrolled in the HC group, with a median [IQR] age of 41 [28, 44] years, and comprising 88% of female and 29% of individuals of Asian ethnicity. The HC cohort was gender‐matched to the SLE cohort (Table 2). We observed a significant difference in age and a trend towards significant difference in ethnicity between SLE and HC cohorts (Table 2). Therefore, we adjusted for age and ethnicity in multivariable regression models assessing the associations of serum BAFF and soluble BAFF receptors expressions in SLE compared to HC. Characteristics SLE cohort (N = 87) Age (years), median [IQR] 44.3 [33.2, 56.4] Female, n (%) 77 (89%) Asian ethnicity, n (%) 49 (56%) Disease duration (years), median [IQR] 7 [3.8, 14.8] SLEDAI‐2K, median [IQR] 4 [2, 6] SLEDAI‐2K > 4, n (%) 31 (36%) Organ‐specific manifestationsa n (%) Fever 0 (0%) Neurological 1 (1%) Renal 19 (22%) Mucocutaneous 18 (21%) Musculoskeletal 7 (8%) Serosal 2 (2%) Vascular 0 (0%) Serological 63 (72%) Haematological 3 (3%) Flareb, n (%) 22 (25%) SLICC‐SDI, median [IQR] 1 [0, 2] SLICC‐SDI > 0, n (%) 54 (62%) Treatment n (%) Prednisone 50 (57%) Hydroxychloroquine 74 (85%) Immunosuppressantsc 44 (51%) Clinical laboratory data CRP (mg L−1), median [IQR] 1.5 [0.6, 3.5] ESR (mm h−1), median [IQR] 15 [8, 27] UPCR (g mmol−1), median [IQR] 0.02 [0.01, 0.05] Proteinuriad, n (%) 17 (20%) C3 (g L−1), mean (SD) 0.85 (0.26) C4 (g L−1), mean (SD) 0.17 (0.08) ANA +ve (> 1280), n (%) 67 (81%) Anti‐dsDNA +ve, n (%) 49 (56%) Anti‐Sm Ab +ve, n (%) 20 (24%) Data are expressed as mean (SD), median [IQR] or as number (percentage). Ab, antibody; ANA, antinuclear antibody; C3, complement component 3; C4, complement component 4; CRP, C‐reactive protein; dsDNA, double‐stranded deoxyribonucleic acid; ESR, erythrocyte sedimentation rate; IQR, interquartile range; SD, standard deviation; SLE, systemic lupus erythematosus; SLEDAI‐2K, SLE Disease Activity Index 2000; SLICC‐SDI, Systemic Lupus International Collaborating Clinics‐SLE Damage Index; Sm, Smith; UPCR, urine protein/creatinine ratio. a Individual organ domain disease activity was assessed by the SLEDAI‐2K score. b Encompasses mild, moderate and severe flares. c Immunosuppressants include methotrexate, azathioprine, mycophenolate mofetil, mycophenolate acid, leflunomide, cyclosporine A and/or cyclophosphamide. d Proteinuria defined if UPCR > 0.05 g mmol−1. HC (n = 17) SLE (n = 87) P‐value Demographics Age (years), median [IQR] 41 [28, 44] 44.3 [33.2, 56.4] 0.04 Female, n (%) 15 (88%) 77 (89%) 0.9 Asian, n (%) 5 (29%) 49 (56%) 0.06 Data are expressed as median [IQR] or as number (percentage). HC, healthy control; IQR, interquartile range; SLE, systemic lupus erythematosus. Serum BAFF and soluble BAFF receptors concentrations in SLE BAFF was detectable in all serum samples from SLE patients and HC. Univariable linear regression analysis showed an association of increased serum BAFF levels in SLE compared to HC of borderline significance (ratio of geometric mean (GM), 1.27; 95% CI 0.99, 1.63; P = 0.06). However, this association was weakened after adjusting for age and ethnicity (ratio of GM 1.25; 95% CI 0.96, 1.64; P = 0.09; Figure 1a; Supplementary table 1). sBCMA, sTACI and sBAFF‐R were also detectable in all SLE and HC serum samples. There was evidence of increased serum sBCMA and sTACI in the SLE group (sBCMA: ratio of GM 1.46; 95% CI 1.35, 1.58; P < 0.01; and sTACI: ratio of GM 1.47; 95% CI 1.11, 1.94; P < 0.01), confirmed after adjusting for age and ethnicity (sBCMA: ratio of GM 1.43; 95% CI 1.28, 1.59; P < 0.01; sTACI: ratio of GM 1.45; 95% CI 1.11, 1.91; P < 0.01; Figure 1b, c; Supplementary tables 2, 3). Serum BAFF was not significantly correlated with concentrations of any soluble BAFF receptors in SLE (Figure 2). We did not find any significant difference in serum sBAFF‐R levels between SLE and HC (Figure 1d). However, serum BAFF was significantly negatively correlated with serum sBAFF‐R, while not with sBCMA and sTACI, in HC subjects but not in SLE (Figure 2). Serum BAFF and SLE clinical parameters We next evaluated potential associations between serum BAFF with demographics and clinical parameters using linear regression. Univariable analysis revealed associations between increased serum BAFF and active disease, flare and organ damage. Serum BAFF levels were greater in SLE patients with active disease with borderline significance (ratio of GM 1.24; 95% CI 0.99, 1.55; P = 0.06; Figure 3a), flare of disease (ratio of GM 1.29; 95% CI 1.01, 1.65; P = 0.04; Figure 3b) or irreversible organ damage compared to those without (ratio of GM 1.33; 95% CI 1.07, 1.65; P = 0.01; Figure 3c, Table 3). The association between increased serum BAFF and organ damage was confirmed in multivariable analysis, after adjusting for disease duration (adjusted ratio of GM 1.29; 95% CI 1.03, 1.6; P = 0.02). However, the association between increased serum BAFF and active disease was attenuated after adjusting for the use of immunosuppressants (adjusted ratio of GM 1.18; 95% CI 0.93, 1.48; P = 0.17). With respect to laboratory markers, increased serum BAFF concentrations were significantly associated with high ESR, but not with other routine laboratory markers (Table 3). Serum BAFF was significantly lower in patients receiving hydroxychloroquine, while significantly higher in those receiving immunosuppressants (Table 3). No significant association was observed between serum BAFF concentrations and other clinical parameters (Table 3). SLE cohort (N = 87) BAFF sBAFF Receptors sBCMA sTACI sBAFF‐R RC (95% CI) P‐value RC (95% CI) P‐value RC (95% CI) P‐value RC (95% CI) P‐value Demographics Age 1.00 (0.99, 1.01) 0.49 1.00 (0.99, 1.01) 0.14 1.00 (0.99, 1.01) 0.97 0.98 (0.97, 1.00) 0.02 Disease duration 1.01 (1.00, 1.03) 0.05 1.01 (0.99, 1.01) 0.11 1.00 (0.98, 1.02) 0.78 0.98 (0.96, 0.99) <0.01 Ratio of GM (95% CI) P‐value Ratio of GM (95% CI) P‐value Ratio of GM (95% CI) P‐value Ratio of GM (95% CI) P‐value Demographics Male 1.11 (0.79, 1.57) 0.53 1.02 (0.86, 1.21) 0.86 1.29 (0.96, 1.72) 0.09 1.34 (0.7, 2.53) 0.38 Asian ethnicity 0.93 (0.75, 1.16) 0.52 0.95 (0.82, 1.09) 0.45 0.98 (0.75, 1.29) 0.91 1.42 (1.01, 2.02) 0.04 Clinical manifestations Disease activity (SLEDAI‐2K) Overall 1.24 (0.99, 1.55) 0.06 0.93 (0.82, 1.05) 0.26 0.83 (0.66, 1.05) 0.12 1.04 (0.74, 1.47) 0.82 Serological 1.16 (0.91, 1.48) 0.22 1.06 (0.94, 1.19) 0.36 0.89 (0.71, 1.11) 0.31 1.35 (1.02, 1.78) 0.04 Renal 1.19 (0.92, 1.55) 0.19 0.92 (0.77, 1.09) 0.33 1.16 (0.89, 1.52) 0.26 1.04 (0.72, 1.51) 0.82 Mucocutaneous 0.99 (0.75, 1.29) 0.93 0.99 (0.87, 1.13) 0.92 0.82 (0.62, 1.09) 0.17 1.11 (0.77, 1.59) 0.58 Mild/moderate flare 1.26 (0.95, 1.68) 0.11 0.98 (0.82, 1.16) 0.81 0.91 (0.72, 1.15) 0.44 1.05 (0.68, 1.62) 0.83 Severe flare 1.17 (0.82, 1.68) 0.37 1.12 (0.79, 1.59) 0.53 1.24 (0.85, 1.8) 0.27 0.83 (0.59, 1.17) 0.3 Flare any 1.29 (1.01, 1.65) 0.04 1.06 (0.88, 1.27) 0.56 1.08 (0.82, 1.41) 0.59 0.99 (0.67, 1.48) 0.98 Organ damage present (SDI > 0) 1.33 (1.07, 1.65) 0.01 0.98 (0.88, 1.09) 0.69 1.05 (0.8, 1.4) 0.71 1.04 (0.74, 1.47) 0.83 Treatment at baseline Prednisolone 0.98 (0.79, 1.22) 0.86 0.98 (0.87, 1.11) 0.78 0.82 (0.62, 1.08) 0.15 1.06 (0.8, 1.4) 0.68 Hydroxychloroquine 0.65 (0.49, 0.88) <0.01 0.99 (0.79, 1.26) 0.96 0.87 (0.49, 1.56) 0.65 1.41 (1.04, 1.91) 0.03 Immunosuppressantsa 1.23 (0.996, 1.53) 0.05 0.91 (0.81, 1.03) 0.13 0.85 (0.68, 1.07) 0.17 1.22 (0.9, 1.66) 0.2 Laboratory markers High CRP (> 3) 1.23 (0.96, 1.57) 0.096 0.99 (0.84, 1.17) 0.95 1.23 (0.9, 1.69) 0.18 0.9 (0.56, 1.47) 0.68 High ESR (≥ 25) 1.53 (1.23, 1.9) <0.01 1.05 (0.92, 1.19) 0.48 0.94 (0.75, 1.19) 0.62 1.29 (0.77, 2.15) 0.33 Proteinuria (UPCR > 0.05) 1.16 (0.88, 1.52) 0.3 0.95 (0.82, 1.09) 0.45 1.15 (0.82, 1.61) 0.41 0.93 (0.64, 1.36) 0.71 Low C3 (< 0.79) 1.21 (0.97, 1.51) 0.09 1.07 (0.93, 1.22) 0.34 1.04 (0.79, 1.37) 0.78 1.03 (0.73, 1.47) 0.85 Low C4 (< 0.16) 1.06 (0.85, 1.32) 0.6 1.03 (0.91, 1.16) 0.64 0.82 (0.63, 1.07) 0.14 1.08 (0.77, 1.51) 0.64 ANA +ve (≥ 1280) 1.3 (0.98, 1.71) 0.07 1.13 (0.99, 1.29) 0.08 0.9 (0.67, 1.22 0.51 0.93 (0.57, 1.52) 0.76 Anti‐dsDNA +ve 1.07 (0.86, 1.34) 0.52 1.12 (1.00, 1.26) 0.05 1.01 (0.82, 1.24) 0.92 1.08 (0.82, 1.44) 0.58 Anti‐Sm Ab +ve 0.86 (0.66, 1.12) 0.25 1.11 (0.96, 1.27) 0.17 1.04 (0.79, 1.36) 0.8 0.84 (0.6, 1.17) 0.31 Serum cytokine and soluble receptors BAFF – 1.00 (1.00, 1.00) 0.68 1.00 (1.00, 1.00) 0.79 1.00 (1.00, 1.00) 0.51 sBCMA 1.00 (1.00, 1.00) 0.87 – – 1.00 (1.00, 1.00) <0.01 1.00 (1.00, 1.00) 0.24 sTACI 1.00 (0.995, 1.01) 0.98 1.00 (1.00, 1.01) <0.01 – – 1.00 (0.99, 1.01) 0.94 sBAFF‐R 1.00 (1.00,1.00) 0.53 1.00 (1.00, 1.00) 0.8 1.00 (1.00, 1.00) 0.92 – – Ab, antibody; ANA, antinuclear antibody; BAFF, B cell‐activating factor from the tumor necrosis factor family; BAFF‐R, BAFF receptor; BCMA, B cell maturation antigen; C3, complement component 3; C4, complement component 4; CI, confidence interval; CRP, C‐reactive protein; dsDNA, double‐stranded deoxyribonucleic acid; ESR, erythrocyte sedimentation rate; GM, geometric mean; RC, regression coefficient; SLE, systemic lupus erythematosus; SLEDAI‐2K, SLE Disease Activity Index 2000; SLICC‐SDI, Systemic Lupus International Collaborating Clinics‐SLE Damage Index; Sm, Smith; TACI, transmembrane activator and cyclophilin ligand interactor; UPCR, urine protein/creatinine ratio. a Immunosuppressants include methotrexate, azathioprine, mycophenolate mofetil, mycophenolate acid, leflunomide, cyclosporine A and/or cyclophosphamide. We further characterised baseline serum BAFF in relation with longitudinally collected clinical parameters over a median length of follow‐up of 2 years following baseline assessment (Table 4). Univariable logistic regression analysis revealed an association between baseline serum BAFF and time‐adjusted mean SLEDAI‐2K (AMS), where patients who had high BAFF levels (>median) at baseline visit were more than twice likely to have AMS > 4 (OR, 2.67; 95% CI 1.1, 6.47; P = 0.03; Table 5); this association, however, attenuated after adjusting for the use of immunosuppressants (adjusted OR, 2.13, 95% CI 0.84, 5.42; P = 0.11). In addition, patients with high baseline BAFF levels were nearly four times more likely to have organ damage at the final visit when compared to patients with low serum BAFF levels (OR, 3.7; 95% CI 1.39, 9.81; P < 0.01; Table 5). We did not find an association between BAFF and flare over time (Table 5). Characteristics SLE cohort (N = 87) Length of follow‐up (years), median [IQR] 2 [1.8, 2.1] AMS, median [IQR] 3.7 [1.7, 5.6] AMS > 4, n (%) 38 (45%) Change in SLICC‐SDI > 0, n (%) 19 (22%) Flare overtimea, n (%) 59 (68%) Data are expressed as median [IQR] or as number (percentage). AMS, adjusted mean SLE Disease Activity Index 2000; IQR, interquartile range; SLE, systemic lupus erythematosus; SLICC‐SDI, Systemic Lupus International Collaborating Clinics‐SLE Damage Index; SLE, Systemic lupus erythematosus. a Encompasses mild, moderate and severe flares. AMS > 4 Flare overtimea Organ damage present at last visit Damage accrual OR (95% CI) P‐value OR (95% CI) P‐value OR (95% CI) P‐value OR (95% CI) P‐value Baseline serum BAFF Low (≤ median) 1.00 1.00 1.00 1.00 High (> median) 2.67 (1.1, 6.47) 0.03 1.83 (0.73, 4.57) 0.2 3.7 (1.39, 9.81) <0.01 2.06 (0.72, 5.88) 0.18 Baseline serum sBCMA Low (≤ median) 1.00 1.00 1.00 1.00 High (> median) 0.46 (0.19, 1.1) 0.08 0.44 (0.17, 1.11) 0.08 0.54 (0.22, 1.36) 0.19 0.64 (0.23, 1.81) 0.4 Baseline serum sTACI Low (≤ median) 1.00 1.00 1.00 1.00 High (> median) 0.68 (0.29, 1.61) 0.38 1.19 (0.48, 2.94) 0.7 0.84 (0.34, 2.07) 0.7 0.64 (0.23, 1.81) 0.4 Baseline serum sBAFF‐R Low (≤ median) 1.00 1.00 1.00 1.00 High (> median) 1.32 (0.56, 3.13) 0.53 1.83 (0.73, 4.57) 0.2 0.97 (0.39, 2.39) 0.94 0.68 (0.24, 1.92) 0.47 AMS, adjusted mean SLE Disease Activity Index 2000; BAFF, B cell‐activating factor from the tumor necrosis factor family; BAFF‐R, BAFF receptor; BCMA, B cell maturation antigen; CI, confidence interval; OR, odds ratio; SLE, systemic lupus erythematosus; TACI, transmembrane activator and cyclophilin ligand interactor a Encompasses mild, moderate and severe flares. Serum soluble BAFF receptors and SLE clinical parameters Serum sBCMA was significantly associated with the presence of anti‐dsDNA in univariable analysis (ratio of GM 1.12; 95% CI 1, 1.26; P = 0.05). Serum sBCMA was not associated with overall or organ‐specific disease activity, flare or organ damage (Table 3). Longitudinal analysis revealed no significant association between baseline serum sBCMA and clinical parameters over time (Table 5). Univariable analysis revealed that increased serum sBAFF‐R was associated with Asian ethnicity (ratio of GM 1.42; 95% CI, 1.01, 2.02; P = 0.04) and with serological SLE Disease Activity Index 2000 (SLEDAI‐2K) (ratio of GM 1.35; 95% CI 1.02, 1.78; P = 0.04). However, these associations did not remain significant after adjusting for age (ethnicity: adjusted ratio of GM 1.27; 95% CI 0.87, 1.84; P = 0.22; serological SLEDAI‐2K: adjusted ratio of GM 1.2; 95% CI 0.88, 1.62; P = 0.25). As opposed to BAFF, serum sBAFF‐R was significantly higher in patients receiving hydroxychloroquine (Table 3). No significant association was found between serum sBAFF‐R and any other SLE clinical parameters in cross‐sectional or in longitudinal analyses (Tables 3, 5). No significant association was found between serum sTACI and any demographic or clinical parameters in cross‐sectional or in longitudinal analyses (Tables 3, 5). Discussion While BAFF is a well‐established therapeutic target in SLE, better understanding of how its expression impacts on disease activity is needed. One possible avenue is the relationship between levels of BAFF and of the soluble forms of the three receptors for BAFF. This study aimed to evaluate the presence of soluble BAFF receptors in serum from a well‐defined SLE cohort and to characterise clinical associations. Here, we showed the presence of soluble forms of the three BAFF receptors in all serum samples from SLE patients. The presence of sBAFF‐R in human SLE sera has not previously been described. The present study confirmed the presence of both sTACI and sBCMA in sera from SLE patients, in a larger and better‐defined cohort than previously reported.7, 8 Both serum sTACI and sBCMA, but not sBAFF‐R, were significantly higher in SLE than in HC. Serum concentrations of BAFF were also increased in SLE compared to HC, but this association was attenuated after adjusting for age and ethnicity. Higher serum sTACI and sBCMA concentrations were previously reported in SLE.2, 7, 8 It is noteworthy that no significant association was found between serum BAFF and any of its soluble receptors in SLE in the present study. This is in contrast with the sole previously published study on sBCMA in SLE, which reported a positive correlation between serum BAFF and sBCMA.8 Whether the detected levels of BAFF and its soluble receptors in this study include complexed forms with their respective cognate soluble receptors/ligands is not known. Future research is required to identify complexed and free forms of these proteins. We report that increased serum BAFF concentrations were associated with organ damage and flare of disease, in line with some published studies.15-17 We also report an association between serum BAFF concentrations and the presence of organ damage at follow‐up visits, in line with a previous report.17 Unexpectedly, these cross‐sectional and longitudinal associations of serum BAFF with flare and organ damage were independent of the presence of its three soluble receptors. Laurent et al. recently reported that serum sBCMA was positively correlated with SLEDAI in a cohort of 39 SLE patients.8 They also showed that sBCMA acted as a decoy only for APRIL.8 However, we did not find any statistically significant association between sBCMA and disease activity. Moreover, we did not find any association between sBCMA and clinical phenotypes, flare or organ damage. Increased serum sBCMA was significantly associated with anti‐dsDNA levels, in line with the trend reported by Laurent et al.8 Similarly, in contrast to the positive correlation reported between serum sTACI and SLEDAI in untreated SLE,7 we did not find an association between sTACI and disease activity or any clinical parameters. Discrepancies between our data and these studies may arise from difference in study population with potential difference in phenotypic subsets studied and/or treatment received, as well as in analysis methods. This work constitutes the first study to show the presence of sBAFF‐R in sera from SLE. We observed a significant association between increased serum sBAFF‐R and active serological SLEDAI‐2K; however, this was attenuated after adjusting for age. Serum sBAFF‐R was not associated with any other SLE clinical parameters in cross‐sectional or longitudinal analyses. Interestingly, a negative correlation between serum BAFF and sBAFF‐R was detected in HC samples, but was not observed in SLE, potentially suggesting a loss of co‐regulation of these balancing forces in favor of unopposed BAFF action in SLE; this is consistent with the failure to observed increased sBAFF‐R in SLE despite other BAFF receptors being elevated. Further research in larger studies would help examine this hypothesis, as well as associations between soluble BAFF receptors and phenotypic SLE subsets under‐represented in the present study, such as neurological and musculoskeletal subsets. SLE is a multifactorial disease, where genetic factors are acknowledged to play an important role in disease pathogenesis.18 Consistent with this, SLE is reported of a higher prevalence and more severe in different ethnicities, including Asians and Indigenous Australians, than in Caucasians, even when studied at the same centre.2, 19 Serum BAFF levels, and the relationship of these with disease activity, have been reported to be different between African American and White American SLE patients.2 Here, no significant difference in serum BAFF was found between Asian and Caucasian patients, in line with our previously published work20; the same was true for serum sTACI and sBCMA. Asian SLE patients displayed significantly higher serum sBAFF‐R levels than Caucasians, but this association was not confirmed after adjusting for age. Future larger multiethnic studies evaluating whether ethnicity might influence serum sBAFF‐R levels in SLE patients would be of interest. This study has identifiable limitations. Firstly, recruitment was monocentric. However, the data draw on a very well‐characterised longitudinally followed cohort of SLE patients. Secondly, the HC cohort was of modest size and not age‐matched to the SLE cohort; multivariable regression analysis, however, enabled adjustment for this demographic variable. Finally, numbers of patients with specific active SLE organ manifestations were small in some subsets, such as neurological SLE, precluding meaningful statistical analysis. In conclusion, we report the presence of the three soluble BAFF receptors in serum from SLE patients. Serum BAFF, sBCMA and sTACI were significantly higher in SLE than in HC. In contrast, serum sBAFF‐R was not elevated in SLE, and the negative correlation between BAFF and sBAFF‐R in HC was not observed in SLE. Serum BAFF was associated with flare of disease and organ damage accrual, independent of the presence of its three soluble cognate receptors, which did not vary strongly with disease activity. These data provide insight into the role of the BAFF system in SLE, and show that all BAFF receptors are detectable in this disease, but leave open the need for larger studies of the functional relations between BAFF and its receptors in SLE. Methods Patients and clinical assessments Adult SLE patients fulfilling the 1997 American College of Rheumatology (ACR) revised criteria for SLE classification21 were enrolled from the Lupus Clinic at Monash Medical Centre (Clayton, Victoria, Australia) between December 2009 and July 2014. Patients were not receiving anti‐BAFF, anti‐CD20 or anti‐CD22 drugs within 12 months of sample collection. Demographic and clinical data were recorded prospectively, including date of birth, gender, ethnicity, disease duration, disease activity and treatment. Overall SLE disease activity was assessed using the SLEDAI‐2K,22 and SLE was defined as active (SLEDAI‐2K > 4) or inactive (SLEDAI‐2K ≤ 4), as previously described.23 The 24 items of the SLEDAI‐2K were individually scored, followed by grouping them into nine organ‐specific domains (e.g. neurological, mucocutaneous, renal) in order to assess organ‐specific disease activity. For example, renal disease activity was measured by adding the four renal components of the SLEDAI‐2K: proteinuria, haematuria, urinary casts and pyuria (renal SLEDAI‐2K)24; active renal disease was defined as a renal SLEDAI‐2K score > 0. The AMS was calculated as the SLEDAI‐2K area under the curve divided by the time observed, as previously described.25 Active disease over time was defined as AMS > 4, as previously described.26 Flare was defined according to SLE Flare Index.27 Damage was recorded using the Systemic Lupus International Collaborating Clinics (SLICC) SLE Damage Index (SDI), as previously described.20, 25 Clinical data were collected for a median of two years following the serum sampling. Healthy individuals were enrolled as a HC group. All individuals gave written informed consent. This study was approved by the Monash Health Human Research Ethics Committee. The study was carried out in accordance with the National Statement of Ethical Conduct in Human Research (2007). Collection of human biological samples Blood samples were collected by venepuncture at the time of routine clinical assessment. Serum was isolated using serum‐separating blood collection tube, and stored at −80°C until further use, as previously described.28 Serum cytokine and soluble receptors quantification Commercial ELISA kits were used to quantify serum BAFF (Quantikine, Cat #SBLYS0B, R&D Systems, Minneapolis, MN, USA) and serum sBAFF‐R (Cat #qy‐e05097, Qayee‐Bio, Shanghai, China), following the manufacturer's protocols. A commercial Luminex screening assay kit (polystyrene beads; Cat #LXSAH, R&D Systems) was used to quantify serum sBCMA and sTACI concentrations, using a Bio‐Rad Bio‐Plex 200 system, following the manufacturer's protocol. Serum sBAFF‐R concentrations were not quantified in 6 samples over the 17 HC serum samples tested for BAFF and its soluble receptors. Statistical analysis All statistical analyses were performed using Stata version 14.2 (StataCorp, College Station, Texas, USA). Normally distributed data were presented as mean (standard deviation) (SD). Non‐normally distributed data were summarised as median and IQR. Spearman's correlation test was used to examine the correlations between BAFF and its soluble receptors (sBAFF‐R, sBMCA and sTACI). Categorical variables were analysed by Pearson's chi‐squared test or Fisher's exact test when appropriate. The Mann–Whitney U‐test was used to assess differences in non‐normal continuous variables between the SLE and HC groups. Cytokine and soluble receptors concentrations were positively skewed in distribution and were therefore log10‐transformed before being used as outcomes in linear regression analyses. Bootstrap methods were incorporated to derive robust standard errors when data did not resemble perfect normal distribution even after log10 transformation. Potential confounders were tested for inclusion in multivariable regression models, including demographic and treatment data. All three serum soluble BAFF receptors were tested as potential confounders for association between serum BAFF and clinical parameters, and vice versa. In longitudinal analysis, serum concentrations were categorised into binary variables, using their medians as a cut‐off (≤ median = low, > median = high), to be used as exposures in a logistic regression model. Non‐intermediary variables associated with both primary exposure and outcome variables were included in the multivariable analyses as potential confounders. A P‐value of < 0.1 in univariable analysis was used as threshold to select potential confounders for multivariable regression models. A P‐value of < 0.05 was considered statistically significant. Acknowledgments The authors warmly thank the patients and healthy subjects for their participation in this study. We also thank the clinical staff of the Lupus Clinic at the Monash Medical Centre, particularly Ms Sue Morton and Mr Andrew Toh. The authors thank the 360biolabs for assistance with the multiplex assays, in particular Ms Devy Santoso. The authors thank the French Society of Rheumatology for its support. FM is recipient of fellowships from the NHMRC of Australia. EFM was supported by the Kim Jolly Lupus Research Trust, and the Monash lupus database has received support from Arthritis and Osteoporosis Victoria, and unrestricted educational grants from GlaxoSmithKline, UCB, AstraZeneca and Eli Lilly Australia. There is no financial support or other benefits from commercial sources for the work reported in the manuscript. Conflict of interest EM has been a consultant to GSK and Eli Lilly. The other authors have no conflict of interest to declare. This study had no external funding source. Author contributions Each individual named as an author has made substantial contributions to the conception and design of the study, or acquisition of data, or analysis and interpretation of data. FBV performed the ELISA and multiplex assays. Both FBV and RK‐R analysed the data. FBV drafted the manuscript, and all authors revised it. All authors read and approved the final version of the manuscript to be submitted. Data availability Reasonable requests to view the data set used in this manuscript can be made in writing to Dr Fabien Vincent (fabien.vincent@monash.edu). Supporting Information References
|
|
Suggested by
Société Francaise d'Immunologie
April 18, 2019 2:57 AM
|
Summary CD4+ regulatory T cells (Treg) expressing the forkhead box protein 3 (FOXP3) transcription factor (Tregs) are instrumental for the prevention of autoimmune diseases. There is increasing evidence that the human T regulatory population is highly heterogeneous in phenotype and function. Numerous studies conducted in human autoimmune diseases have shown that Treg cells are impaired either in their suppressive function, in number, or both. However, the contribution of the FOXP3+ Treg subpopulations to the development of autoimmunity has not been delineated in detail. Rare genetic disorders that involve deficits in Treg function can be studied to develop a global idea of the impact of partial or complete deficiency in a specific molecular mechanism involved in Treg function. In patients with reduced Treg numbers (but no functional deficiency), the expansion of autologous Treg cells could be a suitable therapeutic approach: either infusion of in‐vitro autologous expanded cells, infusion of interleukin (IL)‐2/anti‐IL‐2 complex, or both. Treg biology‐based therapies may not be suitable in patients with deficits of Treg function, unless their deficit can be corrected in vivo/in vitro. Finally, it is critical to consider the appropriate stage of autoimmune diseases at which administration of Treg cellular therapy can be most effective. We discuss conflicting data regarding whether Treg cells are more effectual at preventing the initiation of autoimmunity, ameliorating disease progression or curing autoimmunity itself. Introduction CD4+ T regulatory cells (Treg) expressing the forkhead box protein 3 (FOXP3) transcription factor (Treg cells) are capable of suppressing immune responses, especially their initiation, by preventing the activation and proliferation of T and B cells 1. The importance of Treg cells has been demonstrated in animal models whereby their depletion is associated with loss of self‐tolerance and development of severe autoimmunity [e.g. immunodysregulation, polyendocrinopathy enteropathy X‐linked (IPEX) syndrome] 2-5. Further data in murine models have also demonstrated their ability to prevent progression of and even cure established autoimmune/inflammatory disease 6, 7. Overall, these cells are also considered to play a role in allergy prevention 8, gestational tolerance 9, the promotion of graft tolerance post‐transplantation 10 and the prevention of tumour immune responses 11. Human Treg cells were initially characterized as CD4+ T cells co‐expressing the interleukin (IL)‐2 receptor alpha chain 12-18. This was based on murine data demonstrating that depletion of CD4+CD25+ T cells led to the development of severe autoimmunity 2. Since then, Treg cells have been more precisely described as CD4+ T cells expressing the FOXP3 transcription factor in mice 3-5 and in humans 19. However, while the CD25+FOXP3+ phenotype defines Treg cells in mice, both CD25 and FOXP3 can also be induced upon activation in naive CD4+ T cells (of mice and humans) 20. Intriguingly, CD25 and FOXP3 can also be induced in conventional T cells, although this does not equate to them adopting ‘regulatory’ function 21, 22. All this indicates that the mere combination of CD25 and FOXP3 expression is insufficient to define human Treg cells phenotypically in health and diseases 23. In recent years, we have progressed to further categorize human CD4+FOXP3+ T cells into three distinct subpopulations based upon their phenotypical and functional differences. These subpopulations are (a) Fraction I: CD45RA+FOXP3lo naive Treg cells, considered equivalent to natural Treg cells arising from the thymus (tTreg cells) and demonstrating immunosuppressive properties in vitro; (b) Fraction II: CD45RA–FOXP3hi activated effector Treg cells, also immunosuppressive in vitro; and (c) Fraction III: CD45RA–FOXP3lo cytokine‐secreting but not immunosuppressive cells 23. We were also able to classify these populations similarly using CD25 (instead of FOXP3) and CD45RO (instead of CD45RA). Since then, further elegant work has demonstrated that the Fraction III population could be further subdivided on the basis of CD127 to identify two subpopulations. The proteomic analyses performed identified these subpopulations to closely resemble memory conventional T cells or effector Treg cells, respectively 24. Importantly, these aforementioned subpopulations can be distinctly identified in healthy and diseased states. For example, CD45RA+FOXP3lo Treg cells are the main Treg population identified in cord blood 23, whereas effector Treg cells are highly prevalent in tumours or in peripheral blood of patients with sarcoidosis 25, 26 or mycosis fungoides 27. Interestingly, a small proportion of CD45RA–FOXP3lo cells have been identified in the peripheral blood of patients with active systemic lupus erythematosus 27 or in some tumours 28. The impact of these cell subpopulations on their respective pathologies is not yet known. Numerous studies conducted in human autoimmune diseases have shown that Treg cells were impaired either in their suppressive function, in number, or both. A further mechanism involves resistance of conventional T cells to Treg‐mediated suppression via the presence of certain cytokines [tumour necrosis factor (TNF) and IL‐6] in the microenvironment and over‐activated phosphatidylinositol 3‐kinase/protein kinase B (PI3K/Akt) signalling 29. Of note, these findings have been demonstrated in a range of autoimmune diseases 29-31. The conclusions of those studies have been drawn following different phenotypical definitions of human Treg cells, mainly based on the assumption the either that FOXP3‐expressing and/or CD25high CD4+T cells constitute a single homogeneous population of Tregs 19. Hence, the contribution of the heterogeneous FOXP3+ Treg subpopulations to the development of autoimmunity has not been delineated in detail. In this review, we discuss several unresolved questions 32, 33 and emerging issues regarding the role of Treg cells in human autoimmune and inflammatory diseases. Heterogeneity of human FOXP3‐expressing CD4+ T cell subsets There is increasing evidence that the human T regulatory population is highly heterogeneous in phenotype and function 34. While FOXP3‐expressing cells can be roughly separated into three subsets (naive Treg cells, effector Treg cells and FOXP3lo‐activated T cells) 23, there are novel data indicating that these subpopulations can be subdivided phenotypically even further (Fig. 1). CD45RA+ naive Treg cells can be separated into the CD31+ recent thymic emigrant (RTE) and the CD31– naive Treg cell population 35 (Fig. 1). Recent data obtained via cytometry by time of flight (CyTOF) has demonstrated that naive Treg cells can be subdivided based on their expression of CD49b, CD62L and certain chemokine receptors. This has led to their subcategorization as CD49b+, CD49b+CXCR3+CCR4+CCR6+ and CXCR3+RORC2+CD62L+ subsets 36. It is currently unknown how CD31+ RTE Treg cells differentiate into each of these subsets; the prevalence of each subset in human health and disease and how each of those subsets differentiates into other FOXP33+ T cells have also to be determined. Interestingly, CCR4 can also delineate six different subsets among the Fraction III FOXP3lo non‐Treg cell population when combined with CD127 and CD49d. (Fig. 1). Among these subsets, the CD127+CD49d+CCR4– population contains most of the cytokine‐producing cells (IL‐2, IL‐17 and IFN‐γ), while the CD127–CD49d–CCR4+ contains the lowest number of cytokine‐producing cells. This latter subpopulation is, therefore, functionally and phenotypically most similar to the effector Treg subpopulation, as most effector Treg cells are CD127–CD49d–CCR4+ 24. The origin of Fraction III FOXP3lo cells has not yet been completely elucidated: these cells can be derived from naive Treg cells that fail to up‐regulate high levels of FOXP3 upon activation, for instance, because of weak signal transducer and activator of transcription (STAT)‐5 signalling; they may also be derived from some FOXP3hi effector Treg cells through reduced expression of FOXP3, and they can also be derived from conventional CD4+ T cells that transiently up‐regulate FOXP3 upon activation. Of note, all of these phenotypical changes have been observed in vitro, generally in the presence of low‐dose IL‐2 37. Effector Treg cells constitute a functionally homogeneous suppressive subset that is highly proliferative in vivo but poorly proliferative in vitro, and prone to apoptosis in the absence of IL‐2 1, 19. However, from a phenotypical perspective, these cells can be subcategorized based on their co‐expression of effector T cell transcription factors such as T‐bet [T helper type 1 (Th1), GATA binding protein 3 (GATA‐3) (Th2) and retinoid‐related orphan receptor γt (RORC)] (Th17) 32. This is supported by murine data indicating that Th1‐, Th2‐ and Th17‐like Treg cells suppress their related effector Th cell counterparts, respectively 38-40. These Treg subsets also express their effector Th cell counterparts’ chemokine receptors. Hence, Th1‐like Treg cells are CXCR3+, Th2‐like Treg cells are CCR6–CCR4+ and Th17‐like Treg cells are CCR6+CCR4+ 41. A further Treg subset comprise T follicular regulatory (Tfr) cells, which are found in germinal centres and can directly influence B cells. 42 These cells interfere with the interaction between T follicular helper (Tfh) cells and B cells to alter subsequent B cell differentiation towards antibody‐producing plasma cells or a memory phenotype. This interaction requires further study, particularly to improve our understanding of antibody‐mediated autoimmune disease [e.g. thyroiditis, type 1 diabetes (T1D)]. Additionally, recent studies have demonstrated phenotypical heterogeneity between Treg cells in the peripheral circulation and those present in the healthy/diseased tissue 43. For instance, IL‐1 receptor type II (IL‐1R2), a decoy receptor for IL‐1, is highly expressed on breast and colonic Treg cells but not on their peripheral circulation counterparts 44, 45. Similarly, CD15s (sialyl Lewis X) is present on peripherally circulating effector Treg cells but is absent on their pulmonary Treg counterparts 46. Overall, it is clear that historical studies in human autoimmune and/or inflammatory diseases have been conducted on the basis that circulating FOXP3+ T cells were a homogeneous population 30. On the basis of the data discussed above and access to novel technologies, we anticipate the future determination of the distinct contributions of FOXP3+ Treg subsets to human health and disease (Fig. 1). The significance of FOXP3+ Treg cells abnormalities in autoimmune diseases: from pernicious anaemia to IPEX In their seminal publication demonstrating that murine Treg cells displayed the CD4+CD25+ phenotype, Sakaguchi et al. showed that the canonical autoimmune abnormality observed in sick mice depleted of Treg cells was the occurrence of autoimmune gastritis with circulating anti‐parietal autoantibodies 2, a condition that is reminiscent of pernicious anaemia in humans 47. However, the role of Treg cells in pernicious anaemia in humans has not yet been delineated. This knowledge gap can also be extrapolated to other autoimmune diseases whereby the role of Treg cells in their development has been studied using animal or human culture systems that are not necessarily reflective of true human pathology 33. On one hand, upon review of published literature into human autoimmunity, one may be tempted to conclude that all autoimmune diseases could be characterized by either a deficit in Treg number and/or function or resistance of conventional T cells to Treg‐mediated suppression 29-31, 48, 49. On the other hand, the only known condition with clear evidence for total depletion of Treg cells is IPEX 3-5. This condition is provoked by different genetic defects in the FOXP3 gene and is characterized by the occurrence of enteropathy, eczema, T1D, thyroiditis, cytopenia, hepatitis, nephritis and gastritis 50-52. Indeed, the scurfy mouse model is widely utilized for the study of Treg cells, as equivalent defects in the FOXP3 gene lead to a pathologically similar autoimmune disease. Scurfy mice die within a few weeks after birth, while untreated newborns with IPEX die rapidly, both of severe inflammation, allergy and autoimmunity 3-5. Hence, it is clear that a complete defect in Treg cells leads to the development of this lethal systemic autoimmune and inflammatory disease. Due to the rapid progression of IPEX in murine and human newborns (fortunately, a rare condition), the detailed study of Treg cell deficiency in adults with autoimmune disease has remained a challenge. Rudensky et al. and Sparwasser et al. attempted to address this by developing mice with Treg cells bearing the diphtheria toxin receptor 53. Thus, the injection of diphtheria toxin would provoke the complete depletion of Treg cells within days, and thereby lead to a rapidly lethal systemic autoimmune disease that is similar to that observed in IPEX 53, 54. Overall, it is clear from the experimental observations discussed above that a complete deficiency of Treg cells at any stage of life rapidly leads to a fatal systemic disease. However, it is also clear from the clinical literature that human autoimmune diseases tend not to evolve towards an IPEX‐like condition. Indeed, we would reconcile these findings by hypothesizing that Treg number deficiency and dysfunction in human autoimmune diseases is incomplete at any stage of life and is probably mild or minimal. For example, pernicious anaemia may be associated with some organ‐specific endocrine autoimmune diseases such as Graves’ disease, but rarely to other systemic autoimmune diseases 55. Importantly, neither of these conditions evolve towards an IPEX‐like condition. Although not yet proven, if there is indeed a Treg deficit in pernicious anaemia it is likely to be mild or minimal. FOXP3+ Treg cell function deficiencies in human autoimmune diseases: lessons from genetic diseases The lack of validated experimental assays reflective of in‐vivo human Treg biology remains a major limitation in the field. To what extent in‐vitro Treg suppressive activity correlates with in‐vivo Treg function has not yet been established in humans 48. This limitation is important to overcome, as Treg cells have numerous mechanisms of action which require different experimental design and reagents to reliably elicit 56. It is indeed plausible that observed in‐vitro Treg functional deficiency in human autoimmune diseases may be explained by the partial deficiency of one or several mechanisms of suppression. One must also not discount the potential for effector T cells to be resistant to Treg‐mediated suppression mechanisms 29. While the specific roles of these mechanisms can be studied in mice (via different conditional knock‐out models), their corresponding contributions in humans have been mainly elicited using in‐vitro models instead 57. For this reason, patients with rare genetic disorders that involve deficits in Treg function can be studied to develop a global idea of the impact of partial or complete deficiency in a specific molecular mechanism involved in Treg function. One of the most well‐established mechanisms of action of Treg cells is through their cytotoxic T lymphocyte‐associated protein 4 (CTLA‐4) receptor. Indeed, constitutive expression of CTLA‐4 by Treg cells is instrumental for their in‐vivo suppressive capacity 58. Interestingly, CTLA‐4 haploinsufficiency has been described (albeit rarely) in certain families 59, 60. It is therefore noteworthy that patients with heterozygous non‐sense mutations of CTLA‐4 genes develop a systemic autoimmune disease manifesting as diarrhoea, granulomatous interstitial lung disease, autoimmune cytopaenia, thyroiditis, arthritis and skin disease—all of which are reminiscent of IPEX (but with less severity). Of note, none of these patients studied developed autoimmunity in early infancy, but a significant proportion had their first autoimmune abnormality diagnosed in adulthood. From a cellular perspective, although this mutation could have impacted on the CTLA4‐induction properties and function of all activated T cells, the impact on Treg cells specifically is important. This is because normal Treg cells express disproportionally higher surface and intracellular CTLA4 61. Interestingly, in patients with CTLA‐4 haploinsuffiency, they had higher numbers of Treg cells but their individual expression of CTLA‐4 was reduced, especially after activation 59, 60. Hence, CTLA‐4 haploinsufficiency could be considered as a partial CTLA‐4‐related Treg functional deficiency. Additionally, the unintended manifestations of blocking CTLA‐4 have recently been demonstrated in humans with cancer who are receiving anti‐CTLA‐4 checkpoint blockade therapy 62. These therapies work by boosting effector T cell activity and inhibiting Treg cells; however, pharmacovigilance data suggest that some patients develop enteropathy and colitis similar to that of inflammatory bowel disease. It is important to understand why these patients specifically have effector T cells targeting and infiltrating the gut, as the anti‐CTLA‐4 antibody itself is systemically administered. There is also another rare genetic disorder, which leads instead to a complete CTLA‐4‐related functional deficiency. This involves a deficiency in lipopolysaccharide‐responsive and beige‐like anchor protein (LRBA), which is an intracellular protein involved in the membrane expression of CTLA‐4 63. This condition is clinically characterized by a systemic autoimmune syndrome that resembles CTLA‐4 haploinsufficiency as well as IPEX (as some patients develop T1D). However, LRBA deficiency onsets in early infancy and, indeed, in a few patients shortly after birth 64. Similarly, mild reduction in CTLA‐4 expression has also been observed in Treg cells isolated from patients with rheumatoid arthritis (RA). While the CTLA‐4 gene is highly demethylated in normal Treg cells (thus indicating stable CTLA‐4 expression) 65, the CTLA‐4 promoter was instead methylated in Treg cells from RA patients 66. All the above findings are also important from an age‐related perspective; in comparison to LRBA deficiency, which onsets in early infancy, the onset of RA is usually in adults (older than 45–50 years) 67. Hence, by comparing patients with RA, CTLA‐4 haploinsufficiency, LRBA insufficiency and IPEX we can study the relationship between the intensity of CTLA‐4‐related functional deficiency on Treg cells, the effect on Treg biology and the extent of any clinical presentation (including its severity and time of onset) (Fig. 2). Finally, although Treg functional deficiencies have been described in numerous other autoimmune diseases, the detailed molecular mechanism(s) responsible for these deficiencies is/are currently unknown 68. For example, impaired Treg suppression has been described in multiple sclerosis (MS) 69. It is indeed noteworthy that a key mechanism of suppression by Treg cells is related to their high expression of CD25, as Treg cells act as a sink for IL‐2 2, 70, 71. Interestingly, a polymorphism in CD25 has been associated with a high risk for developing MS through a genome‐wide association study (GWAS) 72. Therefore, it is plausible that a CD25‐related mechanism of suppression may be altered in the Treg cells of MS patients. These Treg cells may also be unstable, as loss of CD25 on Treg cells is known to alter FOXP3 expression, Treg cell function and precipitate Th17 effector cell differentiation 73. In parallel with RA patients who have a mild deficiency in CTLA‐4, the extent of the defect in Treg suppression is probably mild or moderate. This is further supported by clinical observations that both RA and MS never evolve toward an IPEX‐like syndrome and rarely occur in early infancy. Targeting FOXP3+ Treg cells for the control of autoimmune responses As deficiencies in Treg number/function or resistance of T conventional cells from Treg‐mediated suppression are observed in most human autoimmune diseases, it seems logical to propose stable and functionally superior Treg‐based immunotherapies as a new therapeutic strategy in order to reinstate immune homeostasis. The two Treg‐based therapeutic strategies currently being clinically evaluated in autoimmunity are in‐vivo Treg expansion and infusion of in‐vitro expanded Treg cells 19, 74, 75. From the perspective of in‐vivo expansion, low‐dose IL‐2 has been evaluated in Phases I and II trials as a therapeutic targeting human Treg cells in order to expand them in vivo within the context of autoimmunity (e.g. T1D, alopecia areata and systemic lupus) or inflammatory conditions (hepatitis C‐related cryoglobulinaemic vasculitis) 76. However, although injection of IL‐2 expands the circulating Treg cell population, it also expands effector cells such as natural killer (NK) cells or eosinophils—thus indicating the lack of Treg specificity 77, 78. This has been overcome through the development of an IL‐2/anti‐IL‐2 complex that can specifically promote the binding of IL‐2 to the high‐affinity receptor of IL‐2 that is expressed by activated Treg cells and promote Treg cell expansion in vivo without modifying other effector cells 79-81. A second approach is the autologous expansion of Treg cells in vitro in order to reinfuse a large number of Treg cells into patients. Due to the recognized potential for reduced FOXP3 expression or reduced immunosuppressive capacity upon in‐vitro expansion, it is important to culture the right cell subpopulation in conditions that favour maintenance of Treg phenotype and function 82. This will help to optimize any expansion protocols and more reliably predict the phenotype of the end product 83. The addition of rapamycin to the culture conditions is important to eliminate contaminating conventional effector cells. Finally, we also consider it important to utilize molecules capable of modifying Treg epigenetics (e.g. DNA methyltransferase inhibitors or vitamin C) 37, 84, 85. These molecules work to maintain FOXP3 expression as well as various other Treg‐specific demethylation patterns, which consequently lead to more stable and functional Treg cells 37, 65, 85. Strategies aiming at increasing the number of autologous Treg cells are suitable for diseases with reduced but fully functional Treg cells. However, it is currently unknown in diseases with deficiencies in Treg function whether the deficiency is present within the entire Treg population (i.e. all Treg cells are impaired) or specific to a distinct subset (indicating that some Treg cells would be functionally impaired while others would be fully functional). In the first case, all expanded Treg cells would be functionally impaired with no beneficial therapeutic effect. In the second case the expansion, either in vitro or in vivo, of the global pool of Treg cells would lead to the expansion of deficient Treg cells and of fully functional Treg cells. It could, therefore, be speculated that the number of expanded fully functional Treg cells would be sufficient to overcome and compensate the functional deficiency of the expanded deficient subset. However, it is important not to overlook the possibility that expanded dysfunctional Treg cells could convert into pathogenic cells when in a proinflammatory environment and also exacerbate disease 86. There are data demonstrating that FOXP3+ human Treg cells can start secreting IL‐17 when exposed to cytokines such as IL‐1β, ‐2, ‐6, ‐15, ‐21 and ‐23 87, 88. These IL‐17‐secreting Treg cells can subsequently lose their anti‐inflammatory function despite continuous FOXP3 expression 88. A third approach is to utilize peripherally induced Treg cells (pTreg cells or iTreg cells if in vitro), which differentiate from naive CD4+ T cells in the presence of transforming growth factor (TGF)‐β and IL‐2 89. One advantage of these cells is the potential to generate antigen‐specific subsets corresponding to the antigens key to the immunopathogenesis of different autoimmune diseases. However, the partially demethylated nature of FOXP3 gives rise to the instability of FOXP3 expression and subsequent loss of suppressive function 89. The in‐vivo stability of human iTreg cells within a proinflammatory microenvironment needs to be optimized if they are to be considered as a safe and non‐pathogenic clinical product. In diseases with functional Treg deficiencies, infusion of autologous Treg cells would be feasible if the impaired molecular mechanism of suppression is identified and corrected by the use of small molecules in vitro or via genetic modifications. An alternative strategy could be the infusion of allogeneic expanded Treg cells sourced from cord blood or other healthy donors 90. Another strategy is to give those patients therapeutics that can compensate for the impaired Treg mechanism; e.g. in patients with CTLA‐4 deficiency, the use of CTLA‐4‐Ig has proved effective in preventing autoimmune events 63. As discussed above, Treg‐based strategies are already being clinically evaluated in some human autoimmune diseases with reported deficiencies in Treg cell numbers 78, 91 (and even in Treg functions) 92, with the assumption that increasing their number would ameliorate or even cure the diseases. The first in‐human trial evaluating Treg cells in autoimmunity was conducted in the setting of T1D 92. Fourteen patients received expanded autologous polyclonal Treg cells (CD25+CD127lo) in a dose‐escalation study (from 0·5 to 26 × 108 cells). The reliability of the expansion process was demonstrated by the purity of the final product, 76–96·9% FOXP3+. Although two patients had serious adverse events of severe hypoglycaemia and ketoacidosis, no directly Treg‐related adverse events were reported. This study was not powered for disease‐specific outcomes, as it was a Phase 1 study—hence, results of future Phase 2 studies are awaited. Further novel work using Treg cells is also ongoing in the contexts of graft‐versus‐host disease and solid organ transplantation 93-96. Treg cells are capable of inhibiting the initiation of immune responses, although the evidence regarding their ability to control active autoimmune/inflammatory disease is more controversial 2, 6, 7, 74. There are in‐vitro data demonstrating that Treg cells cannot inhibit the proliferation of preactivated effector T cells 97, and when transferred into mice after pathogenic cells the Treg cells are incapable of preventing the onset of autoimmunity 2 (Fig. 3). Indeed, this resistance of effector T cells to Treg‐mediated suppression is another key mechanism in autoimmunity. The effector T cells are supported by a signalling pleiotrophic microenvironment consisting of TNF, IL‐6, IL‐1β as well as over‐activated intracellular signalling via the PI3K/Akt pathways 29. Additionally, in another murine model of severe colitis, the progression of this disease was ameliorated and reversed when the mice underwent adoptive transfer of Treg cells 7. This effect was inhibited when mice were administered antibodies to IL‐10, CTLA‐4 or TGF‐β. Together, these data suggest that it is not only Treg cells but also the presence of particular cytokines in the microenvironment that can modulate disease progression. Hence, there was little surprise that only modest benefits are observed in trials evaluating Treg‐based therapies for ongoing autoimmune or inflammatory diseases 78, 98. However, while they are inefficient at controlling activated pathogenic cells, the expanded Treg cells could theoretically prevent the activation of resting pathogenic cells 74, 75. Therefore, some modest beneficial effect can be expected, as Treg cells would inhibit the activation of dormant pathogenic cells. This would indeed be a viable therapeutic approach, as clinical observations have identified the role of steroids and/or immunosuppressants in controlling active autoimmune diseases as they target activated effector cells first. Secondly, when the disease is considered in remission, another line of immunosuppressants and/or of immunomodulatory drugs are given to patients in order to prevent relapses or disease flare‐up 75. As Treg cells are professionally involved in the prevention of the initiation of pathogenic autoimmune responses, we believe that Treg cell‐based treatments should only be considered as a maintenance therapy for the prevention of flares or relapses after the elimination of pathogenic cells. Such strategies would, therefore, be suitable for remitting and relapsing diseases such as MS, RA or anti‐neutrophil cytoplasmic antibodies (ANCA)‐associated vasculitis only during the remission period to prevent relapses. These trials have also not addressed concerning whether or not it is necessary for infused Treg cells in humans to migrate to the diseased tissue in order to prevent further flares/relapses. This is important in the context of autoimmunity, as although patients have a focal site of inflammation (e.g. joints in RA, gut in inflammatory bowel disease), they also have pathology elsewhere (e.g. extra‐articular/intestinal manifestations) 99, 100. Thus, in order to optimize the Treg therapeutic effect and dose, it may be necessary to culture Treg cells that pre‐emptively express tissue‐specific homing markers (if not, induce this phenotype genetically or pharmacologically). This is also important to minimize any off‐target effects such as the risk of malignancy from interference with anti‐tumour immunity. Interestingly, the Treg‐based therapeutic strategies available in humans aim at expanding polyclonal Treg cells, without considering their antigen specificity 74, 75. Studies in mice indicate that antigen‐specific Treg cells are more efficient that polyclonal Treg cells in preventing autoimmune diseases. However, if the activation of Treg cells is dependent on the target antigen of their T cell receptors (TCRs), the suppressive function itself is not only antigen‐specific. Once activated, Treg cells can suppress effector T cells with the same or any other antigen specificity (via bystander suppression) 48. However, as Treg cells expanded in vitro for cell therapy are highly activated, it may not be necessary to take into account antigen‐specificity of Treg cells to obtain beneficial results in the settings of human autoimmune diseases. Conclusions From the data discussed so far, it is clear that abnormalities in the quantity or function of Treg cells are observed in most, if not all, human autoimmune and/or inflammatory diseases. Although numerous Treg subsets have been defined, their individual contributions to human autoimmune and/or inflammatory diseases are largely unknown. The clinical observations of genetic diseases involving deficiencies in Treg function indicate that the severity and the age of disease onset correlate to the depth of Treg functional impairment. Treg biology‐based therapies may not be suitable in patients with deficits of Treg function, unless their deficit can be corrected in vivo/in vitro. It is also critical to consider the appropriate stage of autoimmune diseases whereby administration of Treg cellular therapy can be effective. As highlighted, there are conflicting data regarding whether Treg cells are more effectual at preventing the initiation of autoimmunity, ameliorating disease progression or curing autoimmunity itself. This is because, although Treg cells can prevent the initiation of autoimmune responses, they cannot terminate ongoing responses. We therefore propose here a global sequential therapeutic strategy for autoimmune diseases that includes (1) induction treatments for diseases flares or chronic disease with chronic activity and (2) maintenance treatments that are suitable for diseases during remission phases by utilizing Treg cell biology‐derived therapies to prevent relapses or subsequent flares (Fig. 4). In patients with reduced Treg numbers (but no functional deficiency), the expansion of autologous Treg cells could be a suitable therapeutic approach (either infusion of in‐vitro‐expanded autologous cells, infusion of IL‐2/anti‐IL‐2 complex, or both). In contrast, patients with diseases involving deficiencies of Treg function would benefit from a detailed understanding of the impaired mechanisms of action of their Treg cells. We anticipate the development of suitable therapeutics to correct/reduce the severity of their Treg deficiencies and thereby reduce their disease burden. Another feasible therapeutic option would be to administer functional allogeneic expanded Treg cells. Acknowledgements M. A. is funded by the EASL Juan Rodes PhD Fellowship. The work is supported by the PHRC programme (AOR17082) and by AFPCA (Association Française de la PolyChondrite Atrophiante). Disclosures None declared. References
|
|
Suggested by
Société Francaise d'Immunologie
February 20, 2019 3:32 PM
|
Summary Viral infections can be fatal because of the direct cytopathic effects of the virus or the induction of a strong, uncontrolled inflammatory response. Virus and host intrinsic characteristics strongly modulate the outcome of viral infections. Recently we determined the circumstances under which enhanced replication of virus within the lymphoid tissue is beneficial for the outcome of a disease. This enforced viral replication promotes anti‐viral immune activation and, counterintuitively, accelerates virus control. In this review we summarize the mechanisms that contribute to enforced viral replication. Antigen‐presenting cells and CD169+ macrophages exhibit enforced viral replication after infection with the model viruses lymphocytic choriomeningitis virus (LCMV) and vesicular stomatitis virus (VSV). Ubiquitin‐specific peptidase 18 (Usp18), an endogenous type I interferon blocker in CD169+ macrophages, has been identified as a proviral gene, as are B cell activating factor (BAFF) and carcinoembryonic antigen‐related cell adhesion molecule 1 (CEACAM1). Lymphotoxins (LT) strongly enhance viral replication in the spleen and lymph nodes. All these factors modulate splenic architecture and thereby promote the development of CD169+ macrophages. Tumor necrosis factor alpha (TNF‐α) and nuclear factor kappa‐light‐chain‐enhancer of activated B cell signaling (NF‐κB) have been found to promote the survival of infected CD169+ macrophages, thereby similarly promoting enforced viral replication. Association of autoimmune disease with infections is evident from (1) autoimmune phenomena described during a chronic virus infection; (2) onset of autoimmune disease simultaneous to viral infections; and (3) experimental evidence. Involvement of virus infection during onset of type I diabetes is strongly evident. Epstein–Bar virus (EBV) infection was discussed to be involved in the pathogenesis of systemic lupus erythematosus. In conclusion, several mechanisms promote viral replication in secondary lymphatic organs. Identifying such factors in humans is a challenge for future studies. Introduction Rapid spread of virus to a susceptible organ causes serious tissue damage, which can lead to fatal disease because of the direct cytopathic effects of the virus. A typically infectious dose of one to a few infectious particles must be replicated several times before it reaches such harmful levels. During this time window, the immune system must be activated so that viral replication can be limited and the spread of virus to the susceptible organ can be avoided. Replication of virus in secondary lymphatic organs accelerates immune activation, and thereby helps to control the virus. Dendritic cells and CD169+ macrophages are important initiators of the anti‐viral immune response The importance of the splenic cellular architecture on viral replication has been recognized for decades 1. Various cell types influence efficient virus replication. In particular, antigen‐presenting cells (APCs), such as specialized macrophages and dendritic cells (DCs), exhibit strong immune‐activating ability. Therefore, viral replication in these cells exerts an important effect on the outcome of an infection. Viral infection leads to antigen presentation on major histocompatibility complex (MHC) class I molecules of DCs, which contributes strongly to the priming of cytotoxic T lymphocytes (CTLs). Even in a situation where viral replication is strongly limited (i.e. infection of mice, which lack the entry receptor of human poliovirus, with human poliovirus) DCs manage to replicate sufficient amounts of virus to induce priming of CD8+ T cells 2. Therefore, it has been suggested that DCs have a special ability to be infected by virus. This ability, as well as the expression of co‐stimulatory molecules would explain the strong immune‐activating ability of DCs during viral infection. However, infectivity of virus may also be dependent on the virus type and the DC subset. Indeed, other studies have indicated that some DC subsets are not susceptible to viral infection 3, 4. The enhanced viral replication in CD169+ macrophages is obviously even more important in those instances where DCs themselves cannot be infected. In such cases, antigen transfer and cross‐presentation by DCs would become important for CD8+ T cell activation 5, 6. Furthermore, we draw attention to the importance of metallophilic macrophages and subcapsular sinus macrophages that express a C‐type lectin, CD169 (Siglec‐1). During virus infection, CD169+ macrophages play an important role in activating the innate and adaptive immune systems by capturing virus and promoting viral replication 7-10. CD169+ macrophages can directly activate CD8+ T cells, but can also transfer antigen to DCs 11. In line with this, CD169+ macrophages can activate CD8+ T cells against non‐replicating antigen 11-13. The absence of CD169+ macrophages leads to a fatal disease outcome because of reduced interferon (IFN) production and limited activation of adaptive immune cells 8, 14, 15. Although we found that the replication ability of these macrophages is an important factor explaining the strong effect of CD169+ macrophages on the anti‐viral immune response, additional mechanisms by which CD169+ macrophages contribute to anti‐viral immune activation must be determined. Mechanisms of splenic architecture maintenance Overview The proper development and function of CD169+ macrophages rely on an intact splenic architecture. Several cytokines and chemokines (i.e. RANK, LXRa), maintain the splenic architecture and thereby influence the development of CD169+ macrophages 16-18. Similarly, the proper development of CD169+ macrophages relies on a balanced B cell function 1, 19. Factors that influence B cell development have a strong effect on viral replication in the spleen of mice. The general absence of B cells or the absence of tumor necrosis factor (TNF)‐α or lymphotoxin (LT) production, which both is linked to the normal function of B cells, influences splenic maintenance and virus replication during lymphocytic choriomeningitis virus (LCMV) infection 20. The promotion of virus replication in CD169+ macrophages relies solely on the presence of B cells rather than on the antibody response 19. In addition, certain members of the TNF superfamily 21, i.e. LTα, LTβ, TNF‐α, B cell‐activating factor (BAFF) and carcinoembryonic antigen‐related cell adhesion molecule 1 (CEACAM1) 22, 23, have been found to be similarly important for the maintenance of splenic architecture because of their influence on B cell development 21-23. Although B cells and members of the TNF superfamily play an important role in the function of macrophages, their impairment of the immune response of DCs is also important. Lymphotoxins are cytokines that consist of LTα and LTβ. Surface‐bound LT expression has been detected on innate lymphoid cells (ILCs), DCs, natural killer (NK) cells and B and T lymphocytes 24. LTs serve several functions in vivo, including organ maintenance, lymphoid organogenesis and immune response regulation 25, 26. Deficiency in LTα, LTβ or lymphotoxin‐beta receptor (LTβR) can manipulate the development of not only Peyer’s patches and lymph nodes, but also of CD169+ macrophages 20. Interestingly, despite a reduction in CD169+ macrophages, LTβ‐deficient mice exhibit reduced viral replication 20. Mice lacking LTβ fail to restrict the replication of vesicular stomatitis virus (VSV) to the marginal zone of the spleen, and this failure leads to fatal outcome of the infection 20. The impact of LTβ deficiency is restricted not only to macrophages, but also to DCs. Mechanistically, LTβ expression influences maturation, activation and the homing ability of lymphocytes. Detailed mechanisms by which LT influences the development of CD169+ macrophages remain to be determined. LT not only influences the development of CD169+ macrophages but also contributes to the generation of splenic conduits, whose function is essential for early virus distribution in the spleen and thereby influences innate immune activation during virus infection 15. Although the absence of LT is clearly linked to impaired organogenesis and reduced numbers of CD169+ macrophages, the role of TNF‐α in the development of CD169+ macrophages is controversial. The impact of TNF‐α on the formation of primary B cells and germinal centers, as well as on follicular DC (FDC) networks, has been studied intensively 27-29, but its role in the maintenance of CD169+ macrophages remains controversial 27-29. On one hand, some reports state that mice deficient in TNF‐α and mice deficient in p55 tumor necrosis factor receptor 1 (TNF‐R1) exhibit severe impairment in marginal zone development 29; on the other hand, some reports hint at the depletion activity of TNF‐α after infection. Excessive production of TNF‐α in mice infected with Leishmania donovani leads to rapid remodeling of splenic structure and loss of marginal zone macrophages (MZMs). In line with this finding, other researchers have found that the pathogenic burden during L. donovani infection can be reversed by TNF depletion 30. In contrast, a recent study found reductions in the numbers of CD169+ cells in the absence of TNF‐α or TNF‐R1. Consequently, reduced production of type I IFN (IFN‐I) can be detected during VSV infection and leads to a severe disease outcome. At the molecular level, the absence of TNF‐α expression impedes RelA translocation into the nuclei of CD169+ macrophages, which is necessary for early IFN‐I expression after viral infection 31. B cell activating factor (BAFF), another TNF superfamily‐related factor, is crucial for B cell development and humoral immunity in mice and humans 32. BAFF binds to B lymphocytes via one of three receptors: B cell maturation antigen (BCMA), transmembrane activator and calcium‐modulating cyclophilin ligand interactor (TACI) or BAFF‐R 33. BAFF specifically co‐stimulates B cell proliferation, promotes splenic B cell survival in vitro and is a key regulator of peripheral B cell populations. BAFF‐R signaling has been found to be crucial for B cell formation. In the absence of BAFF‐R signaling, the development of CD169+ macrophages is hampered. Transfer of BAFF‐R‐competent B cells partially restores the number of CD169+ macrophages 23. Therefore, BAFF‐R contributes to enforced viral replication during viral infection. Limited induction of a functional innate immune response by congenital IFN‐I after viral infection in Baffr−/− mice is due to reduced viral replication. Decreased virus presentation consequently results in greatly reduced anti‐viral adaptive immune responses 23. CEACAM1, in addition to TNF family‐related molecules, is a member of the carcinoembryonic antigen and immunoglobulin families and influences viral replication in a B cell‐dependent manner. CEACAM1 exerts limited influence on the proliferation of B cells but, rather, induces the survival of proliferating B cells via the Bruton’s tyrosine kinase/spleen tyrosine kinase/nuclear factor kappa‐light‐chain‐enhancer of activated B cells (BTK/Syk/NF‐κB) axis. During viral infection, CEACAM1‐deficient mice can barely induce an anti‐viral B cell response. In addition, because of the lack of CD169+ macrophages, CEACAM1‐deficient mice exhibit a reduction in innate immune activation. Therefore, CEACAM1‐deficient mice die after VSV infection 22. Molecules influencing viral replication The influence on viral replication in CD169+ macrophages and DCs is not exclusively restricted to the splenic architecture. Cell‐intrinsic molecules have a large effect on viral replication. Deubiquitinating enzymes are involved in several essential biological processes and pathways, such as transcriptional silencing, growth control and regulation of virus infection 34. The family of ubiquitin‐specific peptidase (USPs) contains more than 100 proteins, all of which share homolog sequences. Ubiquitin‐specific peptidase 18 (Usp18) is a ubiquitin‐specific peptidase that cleaves ISG15 from Isg15ylated proteins 35. In addition to this function, Usp18 binds directly to the Janus kinase (JAK) binding site of the IFN‐α receptor and blocks IFN‐I signaling. At a molecular level, Usp18 represses signal transducer and activator of transcription 1 (STAT‐1) and STAT‐2 heterodimer formation and IFN regulatory factor 9 (IRF9)‐dependent activation of IFN‐stimulated gene (ISG) transcription. CD169+ macrophages and DCs strongly express Usp18 14, 36. Therefore, over‐expression of Usp18 by CD169+ macrophages leads to IFN‐I unresponsiveness and enhanced viral replication within these cells (Fig. 1). The absence of Usp18 in mice leads to rapid death due to defective activation of innate and adaptive immune responses 7. In addition to Usp18, the paracaspase mucosa‐associated lymphoid tissue lymphoma translocation protein 1 (MALT1) is an important factor in viral replication. MALT1 is widely expressed on various immune cells and plays an important role in immunity, inflammation and cancer by fine‐tuning immune responses 37. After VSV infection, the absence of MALT1 inhibits RelA translocation into nuclei in a TNF‐dependent manner 31. Ablation of MALT1 increases the accumulation of RelB, which regulates RelA signaling by competitive binding to DNA 38. NF‐κB subunit RelA is crucial for regulating early IFN‐β expression after virus infection. Consequently, MALT1 deficiency reduces VSV replication and causes inefficient activation of the innate immune response; this lower immune response leads to a severe outcome of the infection 39. We consider that additional pathways influence viral replication in APCs. Additional screening must be performed so that researchers can identify more players that specifically promote viral replication within APCs in mice and humans. Acute cytopathic infection VSV has a tropism for neuronal tissue. Once VSV reaches the brain, its rapid propagation within the brain tissue usually leads to death. If this lethal outcome is to be avoided, the spread of VSV to the brain must be prevented by the innate and adaptive immune systems 40, 41. The two most important arms of VSV control are IFN‐I and neutralizing antibodies 40. IFN‐I reduces VSV replication in all organs to undetectable levels. Induction of neutralizing immunoglobulin (Ig)G allows complete control of all viral particles, even those that can escape the innate immune response. The absence of IFN‐I leads to overwhelming replication of VSV in several organs, including the liver, spleen, kidney and brain. Therefore, IFN‐I‐deficient mice die quickly after VSV infection 40, 42. In the absence of neutralizing antibodies, some viral particles manage to persist or even exhibit low‐level replication in the presence of IFN‐I 40. From such peripheral niches, virus can spread into the brain and cause death 40. Because of these specific features of VSV, rapid activation of the innate and adaptive immune systems is required for virus control. Viral replication within the lymph nodes and the spleen accelerates the activation of the innate and adaptive immune systems. This activation is mainly explained by increasing concentrations of viral RNA and proteins. Indeed, factors that promote viral replication within the lymphatic system (i.e. Usp18, BAFF, TNF, CEACAM1) accelerate the activation of the innate and adaptive immune systems after VSV infection and thereby promote rapid control of VSV in peripheral niches 14, 22, 23, 39. In this situation, the replication of VSV is beneficial or even essential during infection. VSV is a highly cytopathic virus that responds strongly to IFN‐I. Therefore, early viral replication in the spleen may be especially important. Whether viral replication in the spleen is also important for other virus infections remains to be determined. So far, it is known that several viruses, including murine cytomegalovirus (mCMV), mouse hepatitis virus, LCMV and vaccinia virus, replicate in the spleen, in addition to their typical tissue tropism 42-45. Vaccination Another example of the overall beneficial effect of viral replication occurs during vaccination with live vaccines. In fact, earlier studies indicated that replicating viruses elicit a stronger neutralizing antibody response than do inactivated virus particles 46, 47. In some cases, immunization with a dead virus is inefficient. A number of live attenuated vaccines provide sufficient protection, whereas inactivated vaccines fail to induce a neutralizing antibody response (e.g. rubella, measles, mumps, yellow fever, varicella, chickenpox) 48. Replication of active influenza virus leads to better immune activation than inactive virus does 49, 50. Besides the strength of the immune response, its quality can also be influenced by viral replication. For example, active rubella virus or poliovirus induces the production of IgA in addition to IgG 51-53. Therefore, immunization with active virus is beneficial in disrupting the infection chain, because IgA can neutralize poliovirus in the gut. After exposure to measles virus, prophylactic administration of live attenuated measles, mumps and rubella (MMR) vaccine leads to a beneficial outcome of the infection in some cases if the vaccine is administered within hours or days after exposure 54. In a separate study, we determined whether replication can contribute to anti‐viral immunity during challenge infection with LCMV. Interestingly, virus‐specific antibodies specifically prevent the replication of LCMV in peripheral organs except for the spleen and lymph nodes. The presence of virus‐specific antibodies allows rapid boosting of the existing and new immune components. This boosting results in rapid control of the virus, even in the case of infection with the highly persistent LCMV strain Docile. In this situation, virus control is dependent on CD169+ macrophages and on the priming of new virus‐specific CD8+ T cells 55. Exhaustion and viral replication in APCs During infection with the persistent LCMV strain Docile or clone 13, exhaustion of CD8+ T cells can prevent immunopathology 56. Although this process leads to viral persistence, it can be beneficial for survival. However, partial reduction of exhaustion by depletion of interleukin (IL)‐10, programmed cell death protein 1 (PD‐1) or CEACAM1 can result in virus control with limited adverse effects 57-60. Therefore, exhaustion is a double‐edged sword, with both benefits and disadvantages. Exhaustion is induced by overwhelming amounts of antigen presented together with exhaustive signals 61. IFN‐I strongly influences exhaustion 62. On one hand, IFN‐I reduces viral replication, and this reduction limits the number of antigens and thereby prevents exhaustion 63, 64. On the other hand, IFN‐I induces programmed death ligand 1 (PD‐L1) and thereby promotes exhaustion 62. We found that the absence of CD169+ macrophages or of Usp18 limits the induction of IFN‐I and thereby prevents the expression of PD‐L1 65. This factor also limits the exhaustion of CD8+ T cells; therefore, mice died because of severe immunopathology. Also, timewise‐limited depletion of CD169+ macrophages worsens the outcome of virus infection. Therefore, we conclude that, during infection with an exhaustive virus strain, limitation of replication in the spleen may prevent exhaustion of CD8+ T cells but increases the risk of severe immunopathology. Entry receptor and enforced viral replication To date, researchers have identified several factors that promote replication of virus in APCs. One important question that has not yet been addressed is the role of the entry receptor during the infection of APCs. One important bottleneck in the life cycle of a virus is entry into cells in which the virus can replicate. To enter cells viruses express glycoproteins, which allow cell entry via a specific receptor. Therefore, the specificity of the glycoprotein is a crucial factor determining organ‐specific replication. We used primarily LCMV for our studies. LCMV uses alpha‐dystroglycan as its main entry receptor. Because of the wide expression of alpha‐dystroglycan, LCMV can infect several types of cells in almost all organs 66-68. Because of this feature, LCMV can easily infect APCs. For viruses with a more specific entry receptor, the role of enforced viral replication can be questioned. For example, human poliovirus uses human CD155 as an entry receptor. Wild‐type (WT) mice, which do not express human CD155, can normally not be infected by poliovirus. However, mice expressing human CD155 are susceptible to poliovirus infection 69, 70. Although the role of Usp18 has not been studied during poliovirus infection, Freigang et al. have shown that murine APCs can be infected with poliovirus even in the absence of human CD155 2. This finding suggests that APCs can be infected via a receptor‐independent pathway. Hepatitis C virus (HCV) replicates almost exclusively in hepatocytes. The narrow tropism of HCV can be explained by its requirement for cell entry. The entry of HCV into hepatocytes is synchronized via various receptors: glycosaminoglycans (GAGs), the low‐density lipoprotein receptor (LDL‐R), tetraspanin CD81, the high‐density lipoprotein receptor scavenger receptor class B type I and two tight junction proteins, claudin‐1 (CLDN1) and occludin (OCLN) 71. The summation of these factors is essential for sufficient entry of HCV into cells and explains the liver specificity. Therefore, it is unthinkable that HCV could replicate in APCs. Nevertheless, HCV infection can induce sufficient immune activation (at least in some people). These facts clearly show that anti‐viral immune activation is possible even in the absence of viral contribution to enforced viral replication. Autoimmune disease and viral replication Autoimmune disease is often associated with infections. This evidence results from three facts: (1) autoimmune phenomena are described during a chronic virus infection 72-74; (2) evidence for a virus infection in patients with autoimmune disease 75, 76; and (3) experimental evidence (cross‐reactive epitopes, mouse models) 77-80. Well‐studied examples are multiple sclerosis and type I diabetes. Viruses can contribute to pathogenesis of autoimmune disease in several ways 77, 81. In type I diabetes, one well‐studied mechanism how viruses can induce diabetes is molecular mimicry 82, 83. In fact, Coxsackie virus, which infection is associated with type I diabetes, carries cross‐reactive antigens with beta islet cells 84. In line with these data, cross‐reactive antigens between a virus and the beta islet cells can be well modeled in the autoimmune diabetes model 85. Beside adaptive immune activation, local and systemic innate immune activation is usually occurring during a virus infection. Obviously, over‐activation of these innate signals can contribute to autoreactivity 86, 87. Especially in the presence of autoreactive CD8+ T cells, a strong induction by pattern recognition receptors (i.e. Toll‐like receptor (TLR)‐3, TLR‐7), which is usually occurring during virus infection, can turn such an autoimmunity into an autoimmune disease 88, 89. Further evidence for the role of innate immune activation in type I diabetes comes from genetic screens showing that a mutation in the genes for MDA5 (IFN‐induced helicase 1, IFIH1), which is one of the most important pattern recognition receptors for viruses, are associated with type I diabetes 90. Further, a rare mutation in IFIH1 can protect from type I diabetes 91, 92. In a recent study we asked whether enforced viral replication, can contribute to autoimmune diabetes. Therefore, we used the rat insulin promoter‐glycoprotein (RIP‐GP) model, which allows the study of virus‐induced diabetes. In this model, induction of diabetes depends on CD8+ T cells and interferons 85, 88, 93. In fact, deletion of Usp18, which limits replication of LCMV in lymphatic tissue, limited the innate immune activation and the induction of autoreactive CD8+ T cells 36. These data were confirmed using a second type I diabetes model, the RIP‐nucleoprotein (NP) model 36. Systemic lupus erythematosus (SLE) is a heterogeneous chronic autoimmune disease affecting diverse organ systems and tissues 94. Uncontrolled inflammatory response results in various clinical manifestations, including skin rash, arthritis, cardiovascular disease, hemolytic anemia and glomerulonephritis 95. While the pathogenesis of SLE is complex and complicated, the pivotal characteristic of SLE disease is an impaired removal of dead cells, with accumulation of apoptotic debris providing the main source for autoantigens 96. Exposition of the nuclear materials derived from apoptotic cells driven by APCs, such as myeloid DCs and macrophages, prime autoreactive T cells 97. Subsequently, activated autoreactive T cells interact with B cells causing production of autoantibodies which form immune complexes. Finally, deposits of immune complexes on tissues activate the complement system, resulting in severe inflammation and tissue damage. Additionally, plasmacytoid DCs triggered by immune complexes up‐regulate the release of type I IFN‐inducing IFN signature as a major pathological indicator of SLE 98. Several environmental factors were suggested to contribute toward the pathogenesis of SLE. Among them, viruses seem to be involved in the establishment of SLE disease in genetically susceptible individuals 99, 100. There is growing evidence suggesting a relationship between infection with Epstein–Barr virus (EBV) and SLE. Recent studies revealed an increase prevalence of EBV infection as well as higher titers of anti‐EBV‐antibodies in SLE patients compared to healthy subjects 101-103. Furthermore, structural similarities between components of EBV protein, in particular Epstein–Barr nuclear antigen 1 (EBNA1) and autoantigens, were described in SLE, suggesting molecular mimicry as a potential mechanism to promote production of cross‐reactive autoantibodies 104, 105. Enhanced expression of type I interferon genes due to viral infection may also mediate IFN signature, allowing the abnormal immune response and as a consequence the onset of SLE. Loss of tolerance to self‐antigens is thought to be additionally responsible for the induction of SLE 106, 107. Fcgr2b contributes to lack of tolerance in SLE 108. Therefore, mice lacking Fcgr2b develop a lupus‐like syndrome 109. In fact, we and others found that during age Fcgr2b knock‐out (KO) mice developed anti‐dsDNA antibodies 110. Almost all mice older than 21 weeks showed elevated anti‐nuclear and anti‐dsDNA autoantibodies. Despite elevated levels of autoantibodies, we did not observe strong disease onset in Fcgr2b KO mice in the absence of further stimuli. However, upon virus infection with LCMV, mice died quickly during infection 110. The death of the mice depended on IFN‐γ and CD8+ T cells. Mechanistically, IFN‐γ derived from virus‐specific CD8+ T cells strongly increased expression of Fcgr1 and Fcgr3 on myeloid cells and thereby made self‐reactive antibodies visible to these immune cells. Together, these data clearly show that activation of virus‐specific CD8+ T cells can also lead to serious harm to the body if they are not cross‐reactive for an autoantigen. Especially in a systemic autoimmune disease, systemic activation of virus‐specific CD8+ T cells will strongly influence myeloid cells, but perhaps also other adaptive immune cells, which then impact on the disease onset. Concluding remarks In some circumstances, replication in immunological niches can be beneficial for the control of virus; however, it carries the risk to induce autoimmune disease. More studies are necessary before final conclusions can be reached. Disclosures The authors declare no competing interests. References Citing Literature Number of times cited according to CrossRef: 1 U. Christen, Pathogen infection and autoimmune disease, Clinical & Experimental Immunology, 195, 1, (10-14), (2018). Wiley Online Library
|
|
|
Scooped by
Gilbert C FAURE
August 7, 2024 9:13 AM
|
Chimeric antigen receptor (CAR) T cells are highly effective at targeting and eliminating cells of the B cell lineage. CAR T cell therapy has become a standard-of-care treatment for patients with relapsed or refractory B cell malignancies. In addition, the administration of genetically modified T cells with the capacity to deplete B cells and/or plasma cells has tremendous therapeutic potential in autoimmune diseases. In the past few years, CD19-based and B cell maturation antigen (BCMA)-based CAR T cell therapies have been applied to various B cell-mediated autoimmune diseases including systemic lupus erythematosus, idiopathic inflammatory myopathy, systemic sclerosis, neuromyelitis optica spectrum disorder, myasthenia gravis and multiple sclerosis. The scientific rationale behind this approach is that deep depletion of B cells, including autoreactive B cell clones, could restore normal immune function, referred to as an immune reset. In this Review, we discuss important aspects of CAR T cell therapy in autoimmune disease, including considerations relating to patient selection, safety, efficacy and medical management. These considerations are based on the early experiences of CAR T cell therapy in autoimmune diseases, and as the field of CAR T cell therapy in autoimmune diseases continues to rapidly evolve, these issues will remain subject to ongoing refinement and adaptation. CAR T cell therapy shows promise for achieving long-term drug-free remission in various autoimmune diseases. This Review discusses the ongoing challenges and unanswered questions of CAR T cell therapy in autoimmune diseases, including pre-procedural, procedural and post-procedural considerations.
|
|
Scooped by
Gilbert C FAURE
January 15, 2024 10:07 AM
|
Researchers have analyzed the bones and teeth of approximately 5,000 humans who lived across Western Europe and Asia up to 34,000 years ago to create the world’s largest ancient human gene bank. The findings show the historical spread of genes and diseases over time as populations migrated. The study pinpoints the introduction of MS risk genes into north-western Europe by herders from the east around 5,000 years ago, having a beneficial impact despite increasing the risk of MS. The gene bank resulted in a new understanding of genetic markers associated with autism, ADHD, schizophrenia, bipolar disorder, and depression. This research was supported by the Lundbeck Foundation and is a great leap forward in the understanding of immune systems and their impact on autoimmune diseases today. Source link
|
|
Scooped by
Gilbert C FAURE
August 9, 2022 9:56 AM
|
The pathogenic role of the interleukin 21 (IL-21) in different autoimmune diseases, such as multiple sclerosis (MS), has been extensively studied. However, its pleiotropic nature makes it a cytokine that may exhibit different activity depending on the immunological stage of the disease.
|
|
Scooped by
Gilbert C FAURE
September 24, 2020 4:58 AM
|
Abstract Autoimmune optic neuritis (AON), a model of multiple sclerosis‐associated optic neuritis, is accompanied by degeneration of retinal ganglion cells (RGCs) and optic nerve demyelination and ...
|
|
Scooped by
Gilbert C FAURE
April 10, 2020 2:50 PM
|
Celiac disease (CeD) is a common gastrointestinal disorder that can be diagnosed at any age. The disease is associated with intake of cereal gluten proteins, and the diagnostic scheme initially relied on elimination-provocation diets, typical of food intolerances. This has changed. Currently, diagnosis in pediatric patients can be made solely on the basis of the presence of high serum concentrations of autoantibodies (antibodies that recognize “self” antigens) to transglutaminase 2 (TG2, also known as TGM2 ), a cytosolic enzyme with broad tissue expression. Accumulating evidence indicates that these autoantibodies are formed as a result of an adaptive immune response to gluten and that interactions between gluten-specific T cells and TG2-specific B cells are important for development of CeD. No other human autoantibodies are better diagnostic markers for disease than TG2-specific antibodies. Without knowledge of disease dependence on dietary gluten, the presence of these autoantibodies would categorize CeD as an archetypical autoimmune disease rather than a food intolerance. Although autoimmune disorders are a collection of heterogeneous conditions, for which a single unifying mechanism is unlikely, some autoimmune diseases might share key pathogenic processes with CeD. Indeed, a provocative idea is that immune reactions to exogenous antigens can drive autoimmune diseases other than CeD (1). Environmental factors such as viral or bacterial infections have often been associated with development of autoimmunity. Yet, CeD is the only autoimmune disease for which pathogenic T cell epitopes originating from an exogenous antigen (gluten) have been identified. CeD shows strong association to certain genetic variants (allotypes) of major histocompatibility complex (MHC) class II molecules that mediate antigen presentation to CD4+ T cells. Hence, gluten-reactive CD4+ T cells are considered key pathogenic players in CeD. These CD4+ T cells reside in the gut lamina propria and release proinflammatory cytokines in response to gluten in the diet. As recently demonstrated in a mouse model of CeD, cytokines from CD4+ T cells control the action of cytotoxic intraepithelial lymphocytes (2). The result is release of cytotoxic molecules that kill epithelial cells and thus cause the typical destruction of the small intestinal tissue structure that is seen in CeD. The gluten epitopes that are recognized by the CD4+ T cells uniformly contain negatively charged glutamate residues that are important for binding to the CeD-associated MHC class II molecules. The glutamate residues are introduced into gluten peptides through deamidation, a posttranslational modification that is catalyzed by TG2. The dual role of TG2 in CeD as the target of autoantibodies and responsible for creating T cell epitopes can be explained in the context of T cell–B cell collaboration. TG2-specific B cells can take up TG2-gluten complexes through B cell receptor (BCR)–mediated endocytosis. Deamidated gluten peptides may then be presented to CD4+ T cells in a complex with MHC class II molecules on the surface of the B cells. The outcome is mutual activation of B cells and T cells, resulting in production of TG2-specific antibodies by the B cells and release of proinflammatory cytokines by the T cells (see the figure). The generation of autoantibodies in CeD implies breaking of B cell self-tolerance to TG2. However, a recent study in genetically modified mice expressing a CeD patient–derived, TG2-specific BCR suggested that there is no active induction of B cell tolerance to TG2 under normal conditions (3). The reason for the lack of tolerance induction is probably that TG2 is a cytosolic enzyme and that TG2-reactive B cells are therefore not exposed to extracellular antigen during their development. Hence, TG2-reactive naïve B cells are most likely continuously present both in CeD and in healthy individuals. In CeD, such B cells receive activation signals from gluten-reactive effector T cells. We hypothesize that once efficient T cell–B cell collaboration has been established, autoimmunity and tissue damage could ensue, in CeD and likely also in other autoimmune diseases. Although T cell–B cell interactions have been implicated in other autoimmune diseases, the well-characterized target epitopes in CeD offer distinct possibilities for studying pathogenic mechanisms. Hence, collaboration between TG2-specific B cells and gluten-specific T cells has been demonstrated both in vitro and in vivo (3). Gluten presentation by TG2-specific B cells was shown to depend on the TG2 epitope that is recgnized by the BCR (4). Thus, targeting of some TG2 epitopes allowed more efficient presentation of gluten on MHC class II than others, and antibody production against those epitopes correlated with the onset of clinical disease. Efficient T cell–B cell interactions therefore seem to be important for CeD development, and B cells are likely to be the main antigenpresenting cells (APCs) for pathogenic CD4+ T cells in inductive lymphoid structures. In addition, B-lineage cells may be involved in antigen presentation in nonlymphoid tissues. Plasma cells were recently identified as the main cell type presenting an immunodominant gluten epitope in gut biopsies of CeD patients (5). Plasma cells are terminally differentiated B cells whose main function is to secrete antibodies. However, plasma cells secreting immunoglobulin A (IgA) and IgM antibodies also express cell-surface immunoglobulins (6), which serve as functional BCRs (7), allowing receptor-mediated uptake of cognate antigen. Although the ability of plasma cells to stimulate CD4+ T cells has yet to be demonstrated, these observations suggest that they may act as APCs for tissue-resident CD4+ effector T cells in CeD. A role of B cells as the main APCs in CeD is supported by characteristics of gluten-reactive CD4+ T cells in blood and gut biopsies of CeD patients. These cells were recently described to have a distinct phenotype with features resembling those of T follicular helper (TFH) cells that are specialized for providing activation signals to B cells and that rely on B cell interactions for their differentiation (8). Thus, the CD4+ T cells expressed high amounts of the cytokine interleukin-21 and C-X-C motif chemokine ligand 13 (CXCL13), which are important for activating and attracting B cells. But, they lacked expression of the chemokine receptor CXCR5, which is required for homing to B cell follicles. A similar expression profile was observed in CD4+ T cells of patients with other autoimmune dieseases, including systemic lupus erythematosus (SLE) (8) and rheumatoid arthritis (9). The lack of CXCR5 expression suggests that inductive T cell–B cell interactions take place not in conventional germinal centers (GCs) in secondary lymphoid organs, but rather at extrafollicular sites such as the border between the T cell zone and the B cell follicle in lymph nodes or Peyer's patches of the gut. Extrafollicular activation of B cells in CeD is supported by the observation that TG2-specific antibodies rapidly disappear when patients start a gluten-free diet, indicating that GC-dependent long-lived plasma cells are not generated. Furthermore, these antibodies contain relatively few mutations, consistent with B cells being activated extrafollicularly rather than in GCs (6). Curiously, activated B cells in SLE patients were also found to lack CXCR5, consistent with a non–GC-dependent origin (10). Similarities between CeD and other autoimmune diseases may not be restricted to immune cell phenotypes and interactions. Common mechanisms could also guide the targeting of antigens. Similar to the deamidation of gluten in CeD, posttranslational modifications of antigens have been implicated in other autoimmune diseases. Yet, it remains to be established whether T cells specific to modified (self )-peptides are controlling tissue destruction in patients or if posttranslational modifications are a side effect of autoimmune reactions. Posttranslational modifications can potentially create neoepitopes that the immune system perceives as foreign, thereby facilitating escape of autoreactive cells from tolerance. The underlying mechanisms of neoepitope formation and their potential role in autoimmunity are poorly understood. Environmental factors such as smoking and viral infections are candidate triggers that may induce inflammatory tissue alterations, accompanied by dysregulation of posttranslational modifications and formation of neoantigens that could lead to autoimmunity. A prominent example of the connection between viral infections and autoimmunity is the association of Epstein-Barr virus (EBV) infection with development of multiple sclerosis (MS) (11)—a demyelinating autoimmune disease that affects the central nervous system. EBV persists in a latent state in memory B cells, which could serve as a permanent reservoir of viral antigens that can stimulate other immune cells. The disease is traditionally considered T cell mediated. Nevertheless, B cell depletion therapy with CD20-specific antibodies has a beneficial effect and limits relapses in MS, suggesting that B cells play an important role. If persistent viral antigens are important drivers of autoimmunity, a possible explanation for the clinical observations is that EBV-infected B cells are depleted by anti-CD20 therapy, thereby effectively removing the driving antigen (12). In this case, B cell depletion in MS would resemble the exclusion of gluten from the diet of CeD patients. Although intriguing, it has not been proven experimentally that viral antigens can drive autoimmune disease. Thus, the exact role of EBV in MS remains unclear, and it is not established whether EBV-specific T cells are pathogenic or if EBV-infected B cells in the central nervous system give rise to inflammation. Antibody production is typically considered the main function of B cells. However, B cells can play additional roles in regulation of immune reactions through secretion of cytokines or antigen presentation. Indeed, because anti-CD20 therapy does not deplete plasma cells, the clinical benefits of the treatment in MS strongly suggest that B cells have pathogenic involvement independent of antibody production. Circulating B cells in MS patients were shown to stimulate autoreactive, potentially pathogenic T cells that home to the brain (13). In addition, ablation of MHC class II expression specifically on B cells in mice resulted in amelioration of symptoms in experimental autoimmune encephalomyelitis, the primary mouse model of MS (14). Similar findings were also obtained in a mouse model of SLE (15), suggesting that antigen presentation by B cells to CD4+ T cells plays a key role in development of destructive immune reactions, at least in some autoimmune diseases. Dendritic cells are usually credited as the main APCs for T cells during an immune response. However, B cells are receiving increased attention as potent APCs in several autoimmune diseases. The main limitation to our understanding of pathogenic T cell–B cell interactions is the lack of well-defined target antigens in most autoimmune disorders. Characterization of T cell and B cell specificities will allow the study of disease-relevant immune cells that potentially can be targeted. Another major challenge is to understand why some people develop autoimmunity. Genetic predisposition is part of the answer, but environmental factors also play a role, possibly both by triggering and driving autoimmune reactions. Defining such factors is crucial for efficient treatment and prevention of autoimmune diseases. It is important to note that autoimmune disorders are a heterogeneous group of diseases with different manifestations and etiologies. Nevertheless, the mechanisms that are beginning to be unraveled in CeD could be relevant for other autoimmune conditions. http://www.sciencemag.org/about/science-licenses-journal-article-reuse This is an article distributed under the terms of the Science Journals Default License. References and Notes ↵ L. M. Sollid, B. Jabri, Nat. Rev. Immunol. 13, 294 (2013).OpenUrlCrossRefPubMed ↵ V. Abadie et al., Nature 578, 600 (2020).OpenUrl ↵ M. F. du Pré et al., J. Exp. Med. 217, e20190860 (2020).OpenUrl ↵ R. Iversen et al., Proc. Natl. Acad. Sci. U.S.A. 116, 15134 (2019). ↵ L. S. Høydahl et al., Gastroenterology 156, 1428 (2019).OpenUrl ↵ R. Di Niro et al., Nat. Med. 18, 441 (2012).OpenUrlCrossRefPubMed ↵ D. Pinto et al., Blood 121, 4110 (2013). ↵ A. Christophersen et al., Nat. Med. 25, 734 (2019).OpenUrlCrossRef ↵ D. A. Rao et al., Nature 542, 110 (2017).OpenUrlCrossRef ↵ S. A. Jenks et al., Immunity 49, 725 (2018).OpenUrl ↵ L. I. Levin, K. L. Munger, E. J. O'Reilly, K. I. Falk, A. Ascherio, Ann. Neurol. 67, 824 (2010). ↵ U. C. Meier et al., Clin. Exp. Immunol. 167, 1 (2012).OpenUrlCrossRefPubMed ↵ I. Jelcic et al., Cell 175, 85 (2018).OpenUrlCrossRef ↵ N. Molnarfi et al., J. Exp. Med. 210, 2921 (2013). ↵ J. R. Giles et al., J. Immunol. 195, 2571 (2015). Acknowledgments: The authors are supported by the University of Oslo World-leading research program on human immunology (WL-IMMUNOLOGY) and by grants from the South-Eastern Norway Regional Health Authority (project 2016113), the European Commission (project ERC-2010-Ad-268541), and Stiftelsen KG Jebsen (SKGJ-MED-017).
One of the more perplexing questions in biomedical research is—why does the body's protective shield against infections, the immune system, attack its own vital cells, organs, and tissues? The answer to this question is central to understanding an array of autoimmune diseases, such as rheumatoid arthritis, type 1 diabetes, systemic lupus erythematosus, and Sjogren's syndrome. When some of the body's cellular proteins are recognized as "foreign" by immune cells called T lymphocytes, a destructive cascade of inflammation is set in place. Current therapies to combat these cases of cellular mistaken identity dampen the body's immune response and leave patients vulnerable to life-threatening infections. Research on stem cells is now providing new approaches to strategically remove the misguided immune cells and restore normal immune cells to the body. Presented here are some of the basic research investigations that are being guided by adult and embryonic stem cell discoveries. Introduction The body's main line of defense against invasion by infectious organisms is the immune system. To succeed, an immune system must distinguish the many cellular components of its own body (self) from the cells or components of invading organisms (nonself). "Nonself" should be attacked while "self" should not. Therefore, two general types of errors can be made by the immune system. If the immune system fails to quickly detect and destroy an invading organism, an infection will result. However, if the immune system fails to recognize self cells or components and mistakenly attacks them, the result is known as an autoimmune disease. Common autoimmune diseases include rheumatoid arthritis, systemic lupus erythematosis (lupus), type 1 diabetes, multiple sclerosis, Sjogren's syndrome and inflammatory bowel disease. Although each of these diseases has different symptoms, they share the unfortunate reality that, for some reason, the body's immune system has turned against itself (see Box 6.1. Immune System Components: Common Terms and Definitions). How Does the Immune System Normally Keep Us Healthy? The "soldiers" of the immune system are white blood cells, including T and B lymphocytes, which originate in the bone marrow from hematopoietic stem cells. Every day the body comes into contact with many organisms such as bacteria, viruses, and parasites. Unopposed, these organisms have the potential to cause serious infections, such as pneumonia or AIDS. When a healthy individual is infected, the body responds by activating a variety of immune cells. Initially, invading bacteria or viruses are engulfed by an antigen presenting cell (APC), and their component proteins (antigens) are cut into pieces and displayed on the cell's surface. Pieces of the foreign protein (antigen) bind to the major histocompatibility complex (MHC) proteins, also known as human leukocyte antigen (HLA) molecules, on the surface of the APCs (see Figure 6.1 Immune Response to Self or Foreign Antigens). This complex, formed by a foreign protein and an MHC protein, then binds to a T cell receptor on the surface of another type of immune cell, the CD4 helper T cell. They are so named because they "help" immune responses proceed and have a protein called CD4 on their surface. This complex enables these T cells to focus the immune response to a specific invading organism. The antigen-specific CD4 helper T cells divide and multiply while secreting substances called cytokines, which cause inflammation and help activate other immune cells. The particular cytokines secreted by the CD4 helper T cells act on cells known as the CD8 "cytotoxic" T cells (because they can kill the cells that are infected by the invading organism and have the CD8 protein on their surface). The helper T cells can also activate antigen-specific B cells to produce antibodies, which can neutralize and help eliminate bacteria and viruses from the body. Some of the antigen-specific T and B cells that are activated to rid the body of infectious organisms become long-lived "memory" cells. Memory cells have the capacity to act quickly when confronted with the same infectious organism at later times. It is the memory cells that cause us to become "immune" from later reinfections with the same organism. Figure 6.1. Immune Response to Self or Foreign Antigens. (© 2001 Terese Winslow) How Do the Immune Cells of the Body Know What to Attack and What Not To? All immune and blood cells develop from multipotent hematopoietic stem cells that originate in the bone marrow. Upon their departure from the bone marrow, immature T cells undergo a final maturation process in the thymus, a small organ located in the upper chest, before being dispersed to the body with the rest of the immune cells (e.g., B cells). Within the thymus, T cells undergo an important process that "educates" them to distinguish between self (the proteins of their own body) and nonself (the invading organism's) antigens. Here, the T cells are selected for their ability to bind to the particular MHC proteins expressed by the individual. The particular array of MHCs varies slightly between individuals, and this variation is the basis of the immune response when a transplanted organ is rejected. MHCs and other less easily characterized molecules called minor histocompatibility antigens are genetically determined and this is the reason why donor organs from relatives of the recipient are preferred over unrelated donors. In the bone marrow, a highly diverse and random array of T cells is produced. Collectively, these T cells are capable of recognizing an almost unlimited number of antigens. Because the process of generating a T cell's antigen specificity is a random one, many immature T cells have the potential to react with the body's own (self) proteins. To avoid this potential disaster, the thymus provides an environment where T cells that recognize self-antigens (autoreactive or self-reactive T cells) are deleted or inactivated in a process called tolerance induction. Tolerance usually ensures that T cells do not attack the "autoantigens" (self-proteins) of the body. Given the importance of this task, it is not surprising that there are multiple checkpoints for destroying or inactivating T cells that might react to auto-antigens. Autoimmune diseases arise when this intricate system for the induction and maintenance of immune tolerance fails. These diseases result in cell and tissue destruction by antigen-specific CD8 cytotoxic T cells or autoantibodies (antibodies to self-proteins) and the accompanying inflammatory process. These mechanisms can lead to the destruction of the joints in rheumatoid arthritis, the destruction of the insulinproducing beta cells of the pancreas in type 1 diabetes, or damage to the kidneys in lupus. The reasons for the failure to induce or maintain tolerance are enigmatic. However, genetic factors, along with environmental and hormonal influences and certain infections, may contribute to tolerance and the development of autoimmune disease [4, 7]. Hematopoietic Stem Cell Therapy for Autoimmune Diseases The current treatments for many autoimmune diseases include the systemic use of anti-inflammatory drugs and potent immunosuppressive and immunomodulatory agents (i.e., steroids and inhibitor proteins that block the action of inflammatory cytokines). However, despite their profound effect on immune responses, these therapies are unable to induce clinically significant remissions in certain patients. In recent years, researchers have contemplated the use of stem cells to treat autoimmune disorders. Discussed here is some of the rationale for this approach, with a focus on experimental stem cell therapies for lupus, rheumatoid arthritis, and type 1 diabetes. The immune-mediated injury in autoimmune diseases can be organ-specific, such as type 1 diabetes which is the consequence of the destruction of the pancreatic beta islet cells or multiple sclerosis which results from the breakdown of the myelin covering of nerves. These autoimmune diseases are amenable to treatments involving the repair or replacement of damaged or destroyed cells or tissue (see Chapter 7. Stem Cells and Diabetes and Chapter 11. Use of Genetically Modified Stem Cells in Experimental Gene Therapies). In contrast, non-organ-specific autoimmune diseases, such as lupus, are characterized by widespread injury due to immune reactions against many different organs and tissues. One approach is being evaluated in early clinical trials of patients with poorly responsive, life-threatening lupus. This is a severe disease affecting multiple organs in the body including muscles, skin, joints, and kidneys as well as the brain and nerves. Over 239,000 Americans, of which more than 90 percent are women, suffer from lupus. In addition, lupus disproportionately afflicts African-American and Hispanic women [11]. A major obstacle in the treatment of non-organ-specific autoimmune diseases such as lupus is the lack of a single specific target for the application of therapy. The objective of hematopoietic stem cell therapy for lupus is to destroy the mature, long-lived, and auto-reactive immune cells and to generate a new, properly functioning immune system. In most of these trials, the patient's own stem cells have been used in a procedure known as autologous (from "one's self") hematopoietic stem cell transplantation. First, patients receive injections of a growth factor, which coaxes large numbers of hematopoietic stem cells to be released from the bone marrow into the blood stream. These cells are harvested from the blood, purified away from mature immune cells, and stored. After sufficient quantities of these cells are obtained, the patient undergoes a regimen of cytotoxic (cell-killing) drug and/or radiation therapy, which eliminates the mature immune cells. Then, the hematopoietic stem cells are returned to the patient via a blood transfusion into the circulation where they migrate to the bone marrow and begin to differentiate to become mature immune cells. The body's immune system is then restored. Nonetheless, the recovery phase, until the immune system is reconstituted represents a period of dramatically increased susceptibility to bacterial, fungal, and viral infection, making this a high-risk therapy. Recent reports suggest that this replacement therapy may fundamentally alter the patient's immune system. Richard Burt and his colleagues [18] conducted a long-term follow-up (one to three years) of seven lupus patients who underwent this procedure and found that they remained free from active lupus and improved continuously after transplantation, without the need for immunosuppressive medications. One of the hallmarks of lupus is that during the natural progression of disease, the normally diverse repertoire of T cells become limited in the number of different antigens they recognize, suggesting that an increasing proportion of the patient's T cells are autoreactive. Burt and colleagues found that following hematopoietic stem cell transplantation, levels of T cell diversity were restored to those of healthy individuals. This finding provides evidence that stem cell replacement may be beneficial in reestablishing tolerance in T cells, thereby decreasing the likelihood of disease reoccurrence. Development of Hematopoietic Stem Cell Lines for Transplantation The ability to generate and propagate unlimited numbers of hematopoietic stem cells outside the body—whether from adult, umbilical cord blood, fetal, or embryonic sources—would have a major impact on the safety, cost, and availability of stem cells for transplantation. The current approach of isolating hematopoietic stem cells from a patient's own peripheral blood places the patient at risk for a flare-up of their autoimmune disease. This is a potential consequence of repeated administration of the stem cell growth factors needed to mobilize hematopoietic stem cells from the bone marrow to the blood stream in numbers sufficient for transplantation. In addition, contamination of the purified hematopoietic stem cells with the patient's mature autoreactive T and B cells could affect the success of the treatment in some patients. Propagation of pure cell lines in the laboratory would avoid these potential drawbacks and increase the numbers of stem cells available to each patient, thus shortening the at-risk interval before full immune reconstitution. Whether embryonic stem cells will provide advantages over stem cells derived from cord blood or adult bone marrow hematopoietic stem cells remains to be determined. However, hematopoietic stem cells, whether from umbilical cord blood or bone marrow, have a more limited potential for self-renewal than do pluripotent embryonic stem cells. Although new information will be needed to direct the differentiation of embryonic stem cells into hematopoietic stem cells, hematopoietic cells are present in differentiated cultures from human embryonic stem cells [9] and from human fetal-derived embryonic germ stem cells [17]. One potential advantage of using hematopoietic stem cell lines for transplantation in patients with autoimmune diseases is that these cells could be generated from unaffected individuals or, as predisposing genetic factors are defined, from embryonic stem cells lacking these genetic influences. In addition, use of genetically selected or genetically engineered cell types may further limit the possibility of disease progression or reemergence. One risk of using nonself hematopoietic stem cells is of immune rejection of the transplanted cells. Immune rejection is caused by MHC protein differences between the donor and the patient (recipient). In this scenario, the transplanted hematopoietic stem cells and their progeny are rejected by the patient's own T cells, which are originating from the patient's surviving bone marrow hematopoietic stem cells. In this regard, embryonic stem cell-derived hematopoietic stem cells may offer distinct advantages over cord blood and bone marrow hematopoietic stem cell lines in avoiding rejection of the transplant. Theoretically, banks of embryonic stem cells expressing various combinations of the three most critical MHC proteins could be generated to allow close matching to the recipient's MHC composition. Additionally, there is evidence that embryonic stem cells are considerably more receptive to genetic manipulation than are hematopoietic stem cells (see Chapter 11. Use of Genetically Modified Stem Cells in Experimental Gene Therapies). This characteristic means that embryonic stem cells could be useful in strategies that could prevent their recognition by the patient's surviving immune cells. For example, it may be possible to introduce the recipient's MHC proteins into embryonic stem cells through targeted gene transfer. Alternatively, it is theoretically possible to generate a universal donor embryonic stem cell line by genetic alteration or removal of the MHC proteins. Researchers have accomplished this by genetically altering a mouse so that it has little or no surface expression of MHC molecules on any of the cells or tissues. There is no rejection of pancreatic beta islet cells from these genetically altered mice when the cells are transplanted into completely MHC-mismatched mice [13]. Additional research will be needed to determine the feasibility of these alternative strategies for prevention of graft rejection in humans [6]. Jon Odorico and colleagues have shown that expression of MHC proteins on mouse embryonic stem cells and differentiated embryonic stem cell progeny is either absent or greatly decreased compared with MHC expression on adult cells [8]. These preliminary findings raise the intriguing possibility that lines derived from embryonic stem cells may be inherently less susceptible to rejection by the recipient's immune system than lines derived from adult cells. This could have important implications for the transplantation of cells other than hematopoietic stem cells. Another potential advantage of using pure populations of donor hematopoietic stem cells achieved through stem cell technologies would be a lower incidence and severity of graft-versus-host disease, a potentially fatal complication of bone marrow transplantation. Graft-versus-host disease results from the immune-mediated injury to recipient tissues that occurs when mature organ-donor T cells remain within the organ at the time of transplant. Such mature donor alloreactive T cells would be absent from pure populations of multipotent hematopoietic stem cells, and under ideal conditions of immune tolerance induction in the recipient's thymus, the donor-derived mature T cell population would be tolerant to the host. Gene Therapy and Stem Cell Approaches for the Treatment of Autoimmune Diseases Gene therapy is the genetic modification of cells to produce a therapeutic effect (see Chapter 11. Use of Genetically Modified Stem Cells in Experimental Gene Therapies). In most investigational protocols, DNA containing the therapeutic gene is transferred into cultured cells, and these cells are subsequently administered to the animal or patient. DNA can also be injected directly, entering cells at the site of the injection or in the circulation. Under ideal conditions, cells take up the DNA and produce the therapeutic protein encoded by the gene. Currently, there is an extensive amount of gene therapy research being conducted in animal models of autoimmune disease. The goal is to modify the aberrant, inflammatory immune response that is characteristic of autoimmune diseases [15, 19]. Researchers most often use one of two general strategies to modulate the immune system. The first strategy is to block the actions of an inflammatory cytokine (secreted by certain activated immune cells and inflamed tissues) by transferring a gene into cells that encodes a "decoy" receptor for that cytokine. Alternatively, a gene is transferred that encodes an anti-inflammatory cytokine, redirecting the auto-inflammatory immune response to a more "tolerant" state. In many animal studies, promising results have been achieved by using these approaches, and the studies have advanced understanding of the disease processes and the particular inflammatory cytokines involved in disease progression [15, 19]. Serious obstacles to the development of effective gene therapies for humans remain, however. Foremost among these are the difficulty of reliably transferring genetic material into adult and slowly dividing cells (including hematopoietic stem cells) and of producing long-lasting expression of the intended protein at levels that can be tightly controlled in response to disease activity. Importantly, embryonic stem cells are substantially more permissive to gene transfer compared with adult cells, and embryonic cells sustain protein expression during extensive self-renewal. Whether adult-derived stem cells, other than hematopoietic stem cells, are similarly amenable to gene transfer has not yet been determined. Ultimately, stem cell gene therapy should allow the development of novel methods for immune modulation in autoimmune diseases. One example is the genetic modification of hematopoietic stem cells or differentiated tissue cells with a "decoy" receptor for the inflammatory cytokine interferon gamma to treat lupus. For example, in a lupus mouse model, gene transfer of the decoy receptor, via DNA injection, arrested disease progression [12]. Other investigators have used a related but distinct approach in a mouse model of type 1 diabetes. Interleukin-12 (IL-12), an inflammatory cytokine, plays a prominent role in the development of diabetes in these mice. The investigators transferred the gene for a modified form of IL-12, which blocks the activity of the natural IL-12, into pancreatic beta islet cells (the target of autoimmune injury in type 1 diabetes). The islet cell gene therapy prevented the onset of diabetes in these mice [20]. Theoretically, embryonic stem cells or adult stem cells could be genetically modified before or during differentiation into pancreatic beta islet cells to be used for transplantation. The resulting immune-modulating islet cells might diminish the occurrence of ongoing autoimmunity, increase the likelihood of long-term function of the transplanted cells, and eliminate the need for immunosuppressive therapy following transplantation. Researchers are exploring similar genetic approaches to prevent progressive joint destruction and loss of cartilage and to repair damaged joints in animal models of rheumatoid arthritis. Rheumatoid arthritis is a debilitating autoimmune disease characterized by acute and chronic inflammation, in which the immune system primarily attacks the joints of the body. In a recent study, investigators genetically transferred an anti-inflammatory cytokine, interleukin-4 (IL-4), into a specialized, highly efficient antigen-presenting cell called a dendritic cell, and then injected these IL-4-secreting cells into mice that can be induced to develop a form of arthritis similar to rheumatoid arthritis in humans. These IL-4-secreting dendritic cells are presumed to act on the CD4 helper T cells to reintroduce tolerance to self-proteins. Treated mice showed complete suppression of their disease and, in addition to its immune-modulatory properties, IL-4 blocked bone resorption (a serious complication of rheumatoid arthritis), making it a particularly attractive cytokine for this therapy [10]. However, one obstacle to this approach is that human dendritic cells are difficult to isolate in large numbers. Investigators have also directed the differentiation of dendritic cells from mouse embryonic stem cells, indicating that a stem cell-based approach might work in patients with rheumatoid arthritis [5]. Longer-term follow-up and further characterization will be needed in animal models before researchers proceed with the development of such an approach in humans. In similar studies, using other inhibitors of inflammatory cytokines such as a decoy receptor for tumor necrosis factor-α (a prominent inflammatory cytokine in inflamed joints), an inhibitor of nuclear factor-κB (a protein within cells that turns on the production of many inflammatory cytokines), and interleukin-13 (an anti-inflammatory cytokine), researchers have shown promising results in animal models of rheumatoid arthritis [19]. Because of the complexity and redundancy of immune system signaling networks, it is likely that a multifaceted approach involving inhibitors of several different inflammatory cytokines will be successful, whereas approaches targeting single cytokines might fail or produce only short-lived responses. In addition, other cell types may prove to be even better vehicles for the delivery of gene therapy in this disease. Chondrocytes, cells that build cartilage in joints, may provide another avenue for stem cell-based treatment of rheumatoid arthritis. These cells have been derived from human bone marrow stromal stem cells derived from human bone marrow [14]. Little is known about the intermediate cells that ultimately differentiate into chondrocytes. In addition to adult bone marrow as a source for stromal stem cells, human embryonic stem cells can differentiate into precursor cells believed to lead ultimately to the stromal stem cells [16]. However, extensive research is needed to reliably achieve the directed derivation of the stromal stem cells from embryonic stem cells and, subsequently, the differentiation of chondrocytes from these stromal stem cells. The ideal cell for optimum cartilage repair may be a more primitive cell than the chondrocyte, such as the stromal cell, or an intermediate cell in the pathway (e.g., a connective tissue precursor) leading to the chondrocyte. Stromal stem cells can generate new chondrocytes and facilitate cartilage repair in a rabbit model [3]. Such cells may also prove to be ideal targets for the delivery of immune-modulatory gene therapy. Like hematopoietic stem cells, stromal stem cells have been used in animal models for delivery of gene therapy [1]. For example, a recent study demonstrated that genetically engineered chondrocytes, expressing a growth factor, can enhance the function of transplanted chondrocytes [2]. Two obstacles to the use of adult stromal stem cells or chondrocytes are the limited numbers of these cells that can be harvested and the difficulties in propagating them in the laboratory. Embryonic stem cells, genetically modified and expanded before directed differentiation to a connective tissue stem cell, may be an attractive alternative. Collectively, these results illustrate the tremendous potential these cells may offer for the treatment of rheumatoid arthritis and other autoimmune diseases. Conclusion Stem cell-based therapies offer many exciting possibilities for the development of novel treatments, and perhaps even cures, for autoimmune diseases. A challenging research effort remains to fully realize this potential and to address the many remaining questions, which include how best to direct the differentiation of specific cell types and determine which particular type of stem cell will be optimum for each therapeutic approach. Gene therapy with cytokines or their inhibitors is still in its infancy, but stem cells or their progeny may provide one of the better avenues for future delivery of immune-based therapies. Ultimately, the potential to alleviate these devastating chronic diseases with the use of stem cell-based technologies is enormous. References Allay, J.A., Dennis, J.E., Haynesworth, S.E., Majumdar, M.K., Clapp, D.W., Shultz, L.D., Caplan, A.I., and Gerson, S.L. (1997). LacZ and interleukin-3 expression in vivo after retroviral transduction of marrow-derived human osteogenic mesenchymal progenitors. Hum. Gene Ther. 8, 1417–1427. Brower-Toland, B.D., Saxer, R.A., Goodrich, L.R., Mi, Z., Robbins, P.D., Evans, C.H., and Nixon, A.J. (2001). Direct adenovirus-mediated insulin-like growth factor I gene transfer enhances transplant chondrocyte function. Hum. Gene Ther. 12, 117–129. Caplan, A.I., Elyaderani, M., Mochizuki, Y., Wakitani, S., and Goldberg, V.M. (1997). Principles of cartilage repair and regeneration. Clin. Orthop. 342, 254–269. Cooper, G.S., Dooley, M.A., Treadwell, E.L., St Clair, E.W., Parks, C.G., and Gilkeson, G.S. (1998). Hormonal, environmental, and infectious risk factors for developing systemic lupus erythematosus. Arthritis Rheum. 41, 1714–1724. Fairchild, P.J., Brook, F.A., Gardner, R.L., Graca, L., Strong, V., Tone, Y., Tone, M., Nolan, K.F., and Waldmann, H. (2000). Directed differentiation of dendritic cells from mouse embryonic stem cells. Curr. Biol. 10, 1515–1518. Gearhart, J. (1998). New potential for human embryonic stem cells. Science. 282, 1061–1062. Grossman, J.M. and Tsao, B.P. (2000). Genetics and systemic lupus erythematosus. Curr. Rheumatol. Rep. 2, 13–18. Harley, C.B., Gearhart, J., Jaenisch, R., Rossant, J., and Thomson, J. (2001). Keystone Symposia. Pluripotent stem cells: biology and applications. Durango, CO. Itskovitz-Eldor, J., Schuldiner, M., Karsenti, D., Eden, A., Yanuka, O., Amit, M., Soreq, H., and Benvenisty, N. (2000). Differentiation of human embryonic stem cells into embryoid bodies comprising the three embryonic germ layers. Mol. Med. 6, 88–95. Kim, S.H., Kim, S., Evans, C.H., Ghivizzani, S.C., Oligino, T., and Robbins, P.D. (2001). Effective treatment of established murine collagen-induced arthritis by systemic administration of dendritic cells genetically modified to express IL-4. J. Immunol. 166, 3499–3505. Lawrence, R.C., Helmick, C.G., Arnett, F.C., Deyo, R.A., Felson, D.T., Giannini, E.H., Heyse, S.P., Hirsch, R., Hochberg, M.C., Hunder, G.G., Liang, M.H., Pillemer, S.R., Steen, V.D., and Wolfe, F. (1998). Estimates of the prevalence of arthritis and selected musculoskeletal disorders in the United States. Arthritis Rheum. 41, 778–799. Lawson, B.R., Prud'homme, G.J., Chang, Y., Gardner, H.A., Kuan, J., Kono, D.H., and Theofilopoulos, A.N. (2000). Treatment of murine lupus with cDNA encoding IFN-gammaR/Fc. J. Clin. Invest. 106, 207–215. Osorio, R.W., Ascher, N.L., Jaenisch, R., Freise, C.E., Roberts, J.P., and Stock, P.G. (1993). Major histocompatibility complex class I deficiency prolongs islet allograft survival. Diabetes. 42, 1520–1527. Pittenger, M.F., Mackay, A.M., Beck, S.C., Jaiswal, R.K., Douglas, R., Mosca, J.D., Moorman, M.A., Simonetti, D.W., Craig, S., and Marshak, D.R. (1999). Multilineage potential of adult human mesenchymal stem cells. Science. 284, 143–147. Prud'homme, G.J. (2000). Gene therapy of autoimmune diseases with vectors encoding regulatory cytokines or inflammatory cytokine inhibitors. J. Gene. Med. 2, 222–232. Schuldiner, M., Yanuka, O., Itskovitz-Eldor, J., Melton, D., and Benvenisty, N. (2000). Effects of eight growth factors on the differentiation of cells derived from human embryonic stem cells. Proc. Natl. Acad. Sci. U. S. A. 97, 11307–11312. Shamblott, M.J., Axelman, J., Littlefield, J.W., Blumenthal, P.D., Huggins, G.R., Cui, Y., Cheng, L., and Gearhart, J.D. (2000). Human embryonic germ cell derivatives express a broad range of develpmentally distinct markers and proliferate extensively in vitro. Proc. Natl. Acad. Sci. U. S. A. 98, 113–118. Traynor, A.E., Schroeder, J., Rosa, R.M., Cheng, D., Stefka, J., Mujais, S., Baker, S., and Burt, R.K. (2000). Treatment of severe systemic lupus erythematosus with high-dose chemotherapy and haemopoietic stem-cell transplantation: a phase I study. Lancet. 356, 701–707. Tsokos, G.C. and Nepom, G.T. (2000). Gene therapy in the treatment of autoimmune diseases. J. Clin. Invest. 106, 181–183. Yasuda, H., Nagata, M., Arisawa, K., Yoshida, R., Fujihira, K., Okamoto, N., Moriyama, H., Miki, M., Saito, I., Hamada, H., Yokono, K., and Kasuga, M. (1998). Local expression of immunoregulatory IL-12p40 gene prolonged syngeneic islet graft survival in diabetic NOD mice. J. Clin. Invest. 102, 1807–1814. Chapter 5 | Table of Contents | Chapter 7 Historical content: June 17, 2001
Via Krishan Maggon
|
|
Scooped by
Gilbert C FAURE
July 30, 2019 8:09 AM
|
A machine learning approach using high-dimensional phenotypic and functional profiling data identifies a multiple sclerosis-specific T cell population that is reduced following treatment.
|
|
Scooped by
Gilbert C FAURE
July 22, 2019 1:52 PM
|
B cells possess a predominant role in adaptive immune responses via antibody-dependent and -independent functions. The microbiome of the gastrointestinal tract is currently being intensively investigated due to its profound impact on various immune responses, including B cell maturation, activation and IgA antibody responses. Recent findings have demonstrated the interplay between dietary components, gut microbiome and autoantibody production. ‘Western’ dietary patterns, such as high fat and high salt diets, can induce alterations in the gut microbiome that in turn affects IgA responses and the production of autoantibodies. This could contribute to multiple pathologies including autoimmune and inflammatory diseases. Here, we summarize current knowledge on the influence of various dietary components on B cell function and (auto)antibody production in relation to the gut microbiota, with a particular focus on the gut-brain axis in the pathogenesis of multiple sclerosis (MS).
|
|
Scooped by
Gilbert C FAURE
June 17, 2019 1:57 PM
|
Summary CD4+ regulatory T cells (Treg) expressing the forkhead box protein 3 (FOXP3) transcription factor (Tregs) are instrumental for the prevention of autoimmune diseases. There is increasing evidence that the human T regulatory population is highly heterogeneous in phenotype and function. Numerous studies conducted in human autoimmune diseases have shown that Treg cells are impaired either in their suppressive function, in number, or both. However, the contribution of the FOXP3+ Treg subpopulations to the development of autoimmunity has not been delineated in detail. Rare genetic disorders that involve deficits in Treg function can be studied to develop a global idea of the impact of partial or complete deficiency in a specific molecular mechanism involved in Treg function. In patients with reduced Treg numbers (but no functional deficiency), the expansion of autologous Treg cells could be a suitable therapeutic approach: either infusion of in‐vitro autologous expanded cells, infusion of interleukin (IL)‐2/anti‐IL‐2 complex, or both. Treg biology‐based therapies may not be suitable in patients with deficits of Treg function, unless their deficit can be corrected in vivo/in vitro. Finally, it is critical to consider the appropriate stage of autoimmune diseases at which administration of Treg cellular therapy can be most effective. We discuss conflicting data regarding whether Treg cells are more effectual at preventing the initiation of autoimmunity, ameliorating disease progression or curing autoimmunity itself. Introduction CD4+ T regulatory cells (Treg) expressing the forkhead box protein 3 (FOXP3) transcription factor (Treg cells) are capable of suppressing immune responses, especially their initiation, by preventing the activation and proliferation of T and B cells 1. The importance of Treg cells has been demonstrated in animal models whereby their depletion is associated with loss of self‐tolerance and development of severe autoimmunity [e.g. immunodysregulation, polyendocrinopathy enteropathy X‐linked (IPEX) syndrome] 2-5. Further data in murine models have also demonstrated their ability to prevent progression of and even cure established autoimmune/inflammatory disease 6, 7. Overall, these cells are also considered to play a role in allergy prevention 8, gestational tolerance 9, the promotion of graft tolerance post‐transplantation 10 and the prevention of tumour immune responses 11. Human Treg cells were initially characterized as CD4+ T cells co‐expressing the interleukin (IL)‐2 receptor alpha chain 12-18. This was based on murine data demonstrating that depletion of CD4+CD25+ T cells led to the development of severe autoimmunity 2. Since then, Treg cells have been more precisely described as CD4+ T cells expressing the FOXP3 transcription factor in mice 3-5 and in humans 19. However, while the CD25+FOXP3+ phenotype defines Treg cells in mice, both CD25 and FOXP3 can also be induced upon activation in naive CD4+ T cells (of mice and humans) 20. Intriguingly, CD25 and FOXP3 can also be induced in conventional T cells, although this does not equate to them adopting ‘regulatory’ function 21, 22. All this indicates that the mere combination of CD25 and FOXP3 expression is insufficient to define human Treg cells phenotypically in health and diseases 23. In recent years, we have progressed to further categorize human CD4+FOXP3+ T cells into three distinct subpopulations based upon their phenotypical and functional differences. These subpopulations are (a) Fraction I: CD45RA+FOXP3lo naive Treg cells, considered equivalent to natural Treg cells arising from the thymus (tTreg cells) and demonstrating immunosuppressive properties in vitro; (b) Fraction II: CD45RA–FOXP3hi activated effector Treg cells, also immunosuppressive in vitro; and (c) Fraction III: CD45RA–FOXP3lo cytokine‐secreting but not immunosuppressive cells 23. We were also able to classify these populations similarly using CD25 (instead of FOXP3) and CD45RO (instead of CD45RA). Since then, further elegant work has demonstrated that the Fraction III population could be further subdivided on the basis of CD127 to identify two subpopulations. The proteomic analyses performed identified these subpopulations to closely resemble memory conventional T cells or effector Treg cells, respectively 24. Importantly, these aforementioned subpopulations can be distinctly identified in healthy and diseased states. For example, CD45RA+FOXP3lo Treg cells are the main Treg population identified in cord blood 23, whereas effector Treg cells are highly prevalent in tumours or in peripheral blood of patients with sarcoidosis 25, 26 or mycosis fungoides 27. Interestingly, a small proportion of CD45RA–FOXP3lo cells have been identified in the peripheral blood of patients with active systemic lupus erythematosus 27 or in some tumours 28. The impact of these cell subpopulations on their respective pathologies is not yet known. Numerous studies conducted in human autoimmune diseases have shown that Treg cells were impaired either in their suppressive function, in number, or both. A further mechanism involves resistance of conventional T cells to Treg‐mediated suppression via the presence of certain cytokines [tumour necrosis factor (TNF) and IL‐6] in the microenvironment and over‐activated phosphatidylinositol 3‐kinase/protein kinase B (PI3K/Akt) signalling 29. Of note, these findings have been demonstrated in a range of autoimmune diseases 29-31. The conclusions of those studies have been drawn following different phenotypical definitions of human Treg cells, mainly based on the assumption the either that FOXP3‐expressing and/or CD25high CD4+T cells constitute a single homogeneous population of Tregs 19. Hence, the contribution of the heterogeneous FOXP3+ Treg subpopulations to the development of autoimmunity has not been delineated in detail. In this review, we discuss several unresolved questions 32, 33 and emerging issues regarding the role of Treg cells in human autoimmune and inflammatory diseases. Heterogeneity of human FOXP3‐expressing CD4+ T cell subsets There is increasing evidence that the human T regulatory population is highly heterogeneous in phenotype and function 34. While FOXP3‐expressing cells can be roughly separated into three subsets (naive Treg cells, effector Treg cells and FOXP3lo‐activated T cells) 23, there are novel data indicating that these subpopulations can be subdivided phenotypically even further (Fig. 1). CD45RA+ naive Treg cells can be separated into the CD31+ recent thymic emigrant (RTE) and the CD31– naive Treg cell population 35 (Fig. 1). Recent data obtained via cytometry by time of flight (CyTOF) has demonstrated that naive Treg cells can be subdivided based on their expression of CD49b, CD62L and certain chemokine receptors. This has led to their subcategorization as CD49b+, CD49b+CXCR3+CCR4+CCR6+ and CXCR3+RORC2+CD62L+ subsets 36. It is currently unknown how CD31+ RTE Treg cells differentiate into each of these subsets; the prevalence of each subset in human health and disease and how each of those subsets differentiates into other FOXP33+ T cells have also to be determined. Interestingly, CCR4 can also delineate six different subsets among the Fraction III FOXP3lo non‐Treg cell population when combined with CD127 and CD49d. (Fig. 1). Among these subsets, the CD127+CD49d+CCR4– population contains most of the cytokine‐producing cells (IL‐2, IL‐17 and IFN‐γ), while the CD127–CD49d–CCR4+ contains the lowest number of cytokine‐producing cells. This latter subpopulation is, therefore, functionally and phenotypically most similar to the effector Treg subpopulation, as most effector Treg cells are CD127–CD49d–CCR4+ 24. The origin of Fraction III FOXP3lo cells has not yet been completely elucidated: these cells can be derived from naive Treg cells that fail to up‐regulate high levels of FOXP3 upon activation, for instance, because of weak signal transducer and activator of transcription (STAT)‐5 signalling; they may also be derived from some FOXP3hi effector Treg cells through reduced expression of FOXP3, and they can also be derived from conventional CD4+ T cells that transiently up‐regulate FOXP3 upon activation. Of note, all of these phenotypical changes have been observed in vitro, generally in the presence of low‐dose IL‐2 37. Effector Treg cells constitute a functionally homogeneous suppressive subset that is highly proliferative in vivo but poorly proliferative in vitro, and prone to apoptosis in the absence of IL‐2 1, 19. However, from a phenotypical perspective, these cells can be subcategorized based on their co‐expression of effector T cell transcription factors such as T‐bet [T helper type 1 (Th1), GATA binding protein 3 (GATA‐3) (Th2) and retinoid‐related orphan receptor γt (RORC)] (Th17) 32. This is supported by murine data indicating that Th1‐, Th2‐ and Th17‐like Treg cells suppress their related effector Th cell counterparts, respectively 38-40. These Treg subsets also express their effector Th cell counterparts’ chemokine receptors. Hence, Th1‐like Treg cells are CXCR3+, Th2‐like Treg cells are CCR6–CCR4+ and Th17‐like Treg cells are CCR6+CCR4+ 41. A further Treg subset comprise T follicular regulatory (Tfr) cells, which are found in germinal centres and can directly influence B cells. 42 These cells interfere with the interaction between T follicular helper (Tfh) cells and B cells to alter subsequent B cell differentiation towards antibody‐producing plasma cells or a memory phenotype. This interaction requires further study, particularly to improve our understanding of antibody‐mediated autoimmune disease [e.g. thyroiditis, type 1 diabetes (T1D)]. Additionally, recent studies have demonstrated phenotypical heterogeneity between Treg cells in the peripheral circulation and those present in the healthy/diseased tissue 43. For instance, IL‐1 receptor type II (IL‐1R2), a decoy receptor for IL‐1, is highly expressed on breast and colonic Treg cells but not on their peripheral circulation counterparts 44, 45. Similarly, CD15s (sialyl Lewis X) is present on peripherally circulating effector Treg cells but is absent on their pulmonary Treg counterparts 46. Overall, it is clear that historical studies in human autoimmune and/or inflammatory diseases have been conducted on the basis that circulating FOXP3+ T cells were a homogeneous population 30. On the basis of the data discussed above and access to novel technologies, we anticipate the future determination of the distinct contributions of FOXP3+ Treg subsets to human health and disease (Fig. 1). The significance of FOXP3+ Treg cells abnormalities in autoimmune diseases: from pernicious anaemia to IPEX In their seminal publication demonstrating that murine Treg cells displayed the CD4+CD25+ phenotype, Sakaguchi et al. showed that the canonical autoimmune abnormality observed in sick mice depleted of Treg cells was the occurrence of autoimmune gastritis with circulating anti‐parietal autoantibodies 2, a condition that is reminiscent of pernicious anaemia in humans 47. However, the role of Treg cells in pernicious anaemia in humans has not yet been delineated. This knowledge gap can also be extrapolated to other autoimmune diseases whereby the role of Treg cells in their development has been studied using animal or human culture systems that are not necessarily reflective of true human pathology 33. On one hand, upon review of published literature into human autoimmunity, one may be tempted to conclude that all autoimmune diseases could be characterized by either a deficit in Treg number and/or function or resistance of conventional T cells to Treg‐mediated suppression 29-31, 48, 49. On the other hand, the only known condition with clear evidence for total depletion of Treg cells is IPEX 3-5. This condition is provoked by different genetic defects in the FOXP3 gene and is characterized by the occurrence of enteropathy, eczema, T1D, thyroiditis, cytopenia, hepatitis, nephritis and gastritis 50-52. Indeed, the scurfy mouse model is widely utilized for the study of Treg cells, as equivalent defects in the FOXP3 gene lead to a pathologically similar autoimmune disease. Scurfy mice die within a few weeks after birth, while untreated newborns with IPEX die rapidly, both of severe inflammation, allergy and autoimmunity 3-5. Hence, it is clear that a complete defect in Treg cells leads to the development of this lethal systemic autoimmune and inflammatory disease. Due to the rapid progression of IPEX in murine and human newborns (fortunately, a rare condition), the detailed study of Treg cell deficiency in adults with autoimmune disease has remained a challenge. Rudensky et al. and Sparwasser et al. attempted to address this by developing mice with Treg cells bearing the diphtheria toxin receptor 53. Thus, the injection of diphtheria toxin would provoke the complete depletion of Treg cells within days, and thereby lead to a rapidly lethal systemic autoimmune disease that is similar to that observed in IPEX 53, 54. Overall, it is clear from the experimental observations discussed above that a complete deficiency of Treg cells at any stage of life rapidly leads to a fatal systemic disease. However, it is also clear from the clinical literature that human autoimmune diseases tend not to evolve towards an IPEX‐like condition. Indeed, we would reconcile these findings by hypothesizing that Treg number deficiency and dysfunction in human autoimmune diseases is incomplete at any stage of life and is probably mild or minimal. For example, pernicious anaemia may be associated with some organ‐specific endocrine autoimmune diseases such as Graves’ disease, but rarely to other systemic autoimmune diseases 55. Importantly, neither of these conditions evolve towards an IPEX‐like condition. Although not yet proven, if there is indeed a Treg deficit in pernicious anaemia it is likely to be mild or minimal. FOXP3+ Treg cell function deficiencies in human autoimmune diseases: lessons from genetic diseases The lack of validated experimental assays reflective of in‐vivo human Treg biology remains a major limitation in the field. To what extent in‐vitro Treg suppressive activity correlates with in‐vivo Treg function has not yet been established in humans 48. This limitation is important to overcome, as Treg cells have numerous mechanisms of action which require different experimental design and reagents to reliably elicit 56. It is indeed plausible that observed in‐vitro Treg functional deficiency in human autoimmune diseases may be explained by the partial deficiency of one or several mechanisms of suppression. One must also not discount the potential for effector T cells to be resistant to Treg‐mediated suppression mechanisms 29. While the specific roles of these mechanisms can be studied in mice (via different conditional knock‐out models), their corresponding contributions in humans have been mainly elicited using in‐vitro models instead 57. For this reason, patients with rare genetic disorders that involve deficits in Treg function can be studied to develop a global idea of the impact of partial or complete deficiency in a specific molecular mechanism involved in Treg function. One of the most well‐established mechanisms of action of Treg cells is through their cytotoxic T lymphocyte‐associated protein 4 (CTLA‐4) receptor. Indeed, constitutive expression of CTLA‐4 by Treg cells is instrumental for their in‐vivo suppressive capacity 58. Interestingly, CTLA‐4 haploinsufficiency has been described (albeit rarely) in certain families 59, 60. It is therefore noteworthy that patients with heterozygous non‐sense mutations of CTLA‐4 genes develop a systemic autoimmune disease manifesting as diarrhoea, granulomatous interstitial lung disease, autoimmune cytopaenia, thyroiditis, arthritis and skin disease—all of which are reminiscent of IPEX (but with less severity). Of note, none of these patients studied developed autoimmunity in early infancy, but a significant proportion had their first autoimmune abnormality diagnosed in adulthood. From a cellular perspective, although this mutation could have impacted on the CTLA4‐induction properties and function of all activated T cells, the impact on Treg cells specifically is important. This is because normal Treg cells express disproportionally higher surface and intracellular CTLA4 61. Interestingly, in patients with CTLA‐4 haploinsuffiency, they had higher numbers of Treg cells but their individual expression of CTLA‐4 was reduced, especially after activation 59, 60. Hence, CTLA‐4 haploinsufficiency could be considered as a partial CTLA‐4‐related Treg functional deficiency. Additionally, the unintended manifestations of blocking CTLA‐4 have recently been demonstrated in humans with cancer who are receiving anti‐CTLA‐4 checkpoint blockade therapy 62. These therapies work by boosting effector T cell activity and inhibiting Treg cells; however, pharmacovigilance data suggest that some patients develop enteropathy and colitis similar to that of inflammatory bowel disease. It is important to understand why these patients specifically have effector T cells targeting and infiltrating the gut, as the anti‐CTLA‐4 antibody itself is systemically administered. There is also another rare genetic disorder, which leads instead to a complete CTLA‐4‐related functional deficiency. This involves a deficiency in lipopolysaccharide‐responsive and beige‐like anchor protein (LRBA), which is an intracellular protein involved in the membrane expression of CTLA‐4 63. This condition is clinically characterized by a systemic autoimmune syndrome that resembles CTLA‐4 haploinsufficiency as well as IPEX (as some patients develop T1D). However, LRBA deficiency onsets in early infancy and, indeed, in a few patients shortly after birth 64. Similarly, mild reduction in CTLA‐4 expression has also been observed in Treg cells isolated from patients with rheumatoid arthritis (RA). While the CTLA‐4 gene is highly demethylated in normal Treg cells (thus indicating stable CTLA‐4 expression) 65, the CTLA‐4 promoter was instead methylated in Treg cells from RA patients 66. All the above findings are also important from an age‐related perspective; in comparison to LRBA deficiency, which onsets in early infancy, the onset of RA is usually in adults (older than 45–50 years) 67. Hence, by comparing patients with RA, CTLA‐4 haploinsufficiency, LRBA insufficiency and IPEX we can study the relationship between the intensity of CTLA‐4‐related functional deficiency on Treg cells, the effect on Treg biology and the extent of any clinical presentation (including its severity and time of onset) (Fig. 2). Finally, although Treg functional deficiencies have been described in numerous other autoimmune diseases, the detailed molecular mechanism(s) responsible for these deficiencies is/are currently unknown 68. For example, impaired Treg suppression has been described in multiple sclerosis (MS) 69. It is indeed noteworthy that a key mechanism of suppression by Treg cells is related to their high expression of CD25, as Treg cells act as a sink for IL‐2 2, 70, 71. Interestingly, a polymorphism in CD25 has been associated with a high risk for developing MS through a genome‐wide association study (GWAS) 72. Therefore, it is plausible that a CD25‐related mechanism of suppression may be altered in the Treg cells of MS patients. These Treg cells may also be unstable, as loss of CD25 on Treg cells is known to alter FOXP3 expression, Treg cell function and precipitate Th17 effector cell differentiation 73. In parallel with RA patients who have a mild deficiency in CTLA‐4, the extent of the defect in Treg suppression is probably mild or moderate. This is further supported by clinical observations that both RA and MS never evolve toward an IPEX‐like syndrome and rarely occur in early infancy. Targeting FOXP3+ Treg cells for the control of autoimmune responses As deficiencies in Treg number/function or resistance of T conventional cells from Treg‐mediated suppression are observed in most human autoimmune diseases, it seems logical to propose stable and functionally superior Treg‐based immunotherapies as a new therapeutic strategy in order to reinstate immune homeostasis. The two Treg‐based therapeutic strategies currently being clinically evaluated in autoimmunity are in‐vivo Treg expansion and infusion of in‐vitro expanded Treg cells 19, 74, 75. From the perspective of in‐vivo expansion, low‐dose IL‐2 has been evaluated in Phases I and II trials as a therapeutic targeting human Treg cells in order to expand them in vivo within the context of autoimmunity (e.g. T1D, alopecia areata and systemic lupus) or inflammatory conditions (hepatitis C‐related cryoglobulinaemic vasculitis) 76. However, although injection of IL‐2 expands the circulating Treg cell population, it also expands effector cells such as natural killer (NK) cells or eosinophils—thus indicating the lack of Treg specificity 77, 78. This has been overcome through the development of an IL‐2/anti‐IL‐2 complex that can specifically promote the binding of IL‐2 to the high‐affinity receptor of IL‐2 that is expressed by activated Treg cells and promote Treg cell expansion in vivo without modifying other effector cells 79-81. A second approach is the autologous expansion of Treg cells in vitro in order to reinfuse a large number of Treg cells into patients. Due to the recognized potential for reduced FOXP3 expression or reduced immunosuppressive capacity upon in‐vitro expansion, it is important to culture the right cell subpopulation in conditions that favour maintenance of Treg phenotype and function 82. This will help to optimize any expansion protocols and more reliably predict the phenotype of the end product 83. The addition of rapamycin to the culture conditions is important to eliminate contaminating conventional effector cells. Finally, we also consider it important to utilize molecules capable of modifying Treg epigenetics (e.g. DNA methyltransferase inhibitors or vitamin C) 37, 84, 85. These molecules work to maintain FOXP3 expression as well as various other Treg‐specific demethylation patterns, which consequently lead to more stable and functional Treg cells 37, 65, 85. Strategies aiming at increasing the number of autologous Treg cells are suitable for diseases with reduced but fully functional Treg cells. However, it is currently unknown in diseases with deficiencies in Treg function whether the deficiency is present within the entire Treg population (i.e. all Treg cells are impaired) or specific to a distinct subset (indicating that some Treg cells would be functionally impaired while others would be fully functional). In the first case, all expanded Treg cells would be functionally impaired with no beneficial therapeutic effect. In the second case the expansion, either in vitro or in vivo, of the global pool of Treg cells would lead to the expansion of deficient Treg cells and of fully functional Treg cells. It could, therefore, be speculated that the number of expanded fully functional Treg cells would be sufficient to overcome and compensate the functional deficiency of the expanded deficient subset. However, it is important not to overlook the possibility that expanded dysfunctional Treg cells could convert into pathogenic cells when in a proinflammatory environment and also exacerbate disease 86. There are data demonstrating that FOXP3+ human Treg cells can start secreting IL‐17 when exposed to cytokines such as IL‐1β, ‐2, ‐6, ‐15, ‐21 and ‐23 87, 88. These IL‐17‐secreting Treg cells can subsequently lose their anti‐inflammatory function despite continuous FOXP3 expression 88. A third approach is to utilize peripherally induced Treg cells (pTreg cells or iTreg cells if in vitro), which differentiate from naive CD4+ T cells in the presence of transforming growth factor (TGF)‐β and IL‐2 89. One advantage of these cells is the potential to generate antigen‐specific subsets corresponding to the antigens key to the immunopathogenesis of different autoimmune diseases. However, the partially demethylated nature of FOXP3 gives rise to the instability of FOXP3 expression and subsequent loss of suppressive function 89. The in‐vivo stability of human iTreg cells within a proinflammatory microenvironment needs to be optimized if they are to be considered as a safe and non‐pathogenic clinical product. In diseases with functional Treg deficiencies, infusion of autologous Treg cells would be feasible if the impaired molecular mechanism of suppression is identified and corrected by the use of small molecules in vitro or via genetic modifications. An alternative strategy could be the infusion of allogeneic expanded Treg cells sourced from cord blood or other healthy donors 90. Another strategy is to give those patients therapeutics that can compensate for the impaired Treg mechanism; e.g. in patients with CTLA‐4 deficiency, the use of CTLA‐4‐Ig has proved effective in preventing autoimmune events 63. As discussed above, Treg‐based strategies are already being clinically evaluated in some human autoimmune diseases with reported deficiencies in Treg cell numbers 78, 91 (and even in Treg functions) 92, with the assumption that increasing their number would ameliorate or even cure the diseases. The first in‐human trial evaluating Treg cells in autoimmunity was conducted in the setting of T1D 92. Fourteen patients received expanded autologous polyclonal Treg cells (CD25+CD127lo) in a dose‐escalation study (from 0·5 to 26 × 108 cells). The reliability of the expansion process was demonstrated by the purity of the final product, 76–96·9% FOXP3+. Although two patients had serious adverse events of severe hypoglycaemia and ketoacidosis, no directly Treg‐related adverse events were reported. This study was not powered for disease‐specific outcomes, as it was a Phase 1 study—hence, results of future Phase 2 studies are awaited. Further novel work using Treg cells is also ongoing in the contexts of graft‐versus‐host disease and solid organ transplantation 93-96. Treg cells are capable of inhibiting the initiation of immune responses, although the evidence regarding their ability to control active autoimmune/inflammatory disease is more controversial 2, 6, 7, 74. There are in‐vitro data demonstrating that Treg cells cannot inhibit the proliferation of preactivated effector T cells 97, and when transferred into mice after pathogenic cells the Treg cells are incapable of preventing the onset of autoimmunity 2 (Fig. 3). Indeed, this resistance of effector T cells to Treg‐mediated suppression is another key mechanism in autoimmunity. The effector T cells are supported by a signalling pleiotrophic microenvironment consisting of TNF, IL‐6, IL‐1β as well as over‐activated intracellular signalling via the PI3K/Akt pathways 29. Additionally, in another murine model of severe colitis, the progression of this disease was ameliorated and reversed when the mice underwent adoptive transfer of Treg cells 7. This effect was inhibited when mice were administered antibodies to IL‐10, CTLA‐4 or TGF‐β. Together, these data suggest that it is not only Treg cells but also the presence of particular cytokines in the microenvironment that can modulate disease progression. Hence, there was little surprise that only modest benefits are observed in trials evaluating Treg‐based therapies for ongoing autoimmune or inflammatory diseases 78, 98. However, while they are inefficient at controlling activated pathogenic cells, the expanded Treg cells could theoretically prevent the activation of resting pathogenic cells 74, 75. Therefore, some modest beneficial effect can be expected, as Treg cells would inhibit the activation of dormant pathogenic cells. This would indeed be a viable therapeutic approach, as clinical observations have identified the role of steroids and/or immunosuppressants in controlling active autoimmune diseases as they target activated effector cells first. Secondly, when the disease is considered in remission, another line of immunosuppressants and/or of immunomodulatory drugs are given to patients in order to prevent relapses or disease flare‐up 75. As Treg cells are professionally involved in the prevention of the initiation of pathogenic autoimmune responses, we believe that Treg cell‐based treatments should only be considered as a maintenance therapy for the prevention of flares or relapses after the elimination of pathogenic cells. Such strategies would, therefore, be suitable for remitting and relapsing diseases such as MS, RA or anti‐neutrophil cytoplasmic antibodies (ANCA)‐associated vasculitis only during the remission period to prevent relapses. These trials have also not addressed concerning whether or not it is necessary for infused Treg cells in humans to migrate to the diseased tissue in order to prevent further flares/relapses. This is important in the context of autoimmunity, as although patients have a focal site of inflammation (e.g. joints in RA, gut in inflammatory bowel disease), they also have pathology elsewhere (e.g. extra‐articular/intestinal manifestations) 99, 100. Thus, in order to optimize the Treg therapeutic effect and dose, it may be necessary to culture Treg cells that pre‐emptively express tissue‐specific homing markers (if not, induce this phenotype genetically or pharmacologically). This is also important to minimize any off‐target effects such as the risk of malignancy from interference with anti‐tumour immunity. Interestingly, the Treg‐based therapeutic strategies available in humans aim at expanding polyclonal Treg cells, without considering their antigen specificity 74, 75. Studies in mice indicate that antigen‐specific Treg cells are more efficient that polyclonal Treg cells in preventing autoimmune diseases. However, if the activation of Treg cells is dependent on the target antigen of their T cell receptors (TCRs), the suppressive function itself is not only antigen‐specific. Once activated, Treg cells can suppress effector T cells with the same or any other antigen specificity (via bystander suppression) 48. However, as Treg cells expanded in vitro for cell therapy are highly activated, it may not be necessary to take into account antigen‐specificity of Treg cells to obtain beneficial results in the settings of human autoimmune diseases. Conclusions From the data discussed so far, it is clear that abnormalities in the quantity or function of Treg cells are observed in most, if not all, human autoimmune and/or inflammatory diseases. Although numerous Treg subsets have been defined, their individual contributions to human autoimmune and/or inflammatory diseases are largely unknown. The clinical observations of genetic diseases involving deficiencies in Treg function indicate that the severity and the age of disease onset correlate to the depth of Treg functional impairment. Treg biology‐based therapies may not be suitable in patients with deficits of Treg function, unless their deficit can be corrected in vivo/in vitro. It is also critical to consider the appropriate stage of autoimmune diseases whereby administration of Treg cellular therapy can be effective. As highlighted, there are conflicting data regarding whether Treg cells are more effectual at preventing the initiation of autoimmunity, ameliorating disease progression or curing autoimmunity itself. This is because, although Treg cells can prevent the initiation of autoimmune responses, they cannot terminate ongoing responses. We therefore propose here a global sequential therapeutic strategy for autoimmune diseases that includes (1) induction treatments for diseases flares or chronic disease with chronic activity and (2) maintenance treatments that are suitable for diseases during remission phases by utilizing Treg cell biology‐derived therapies to prevent relapses or subsequent flares (Fig. 4). In patients with reduced Treg numbers (but no functional deficiency), the expansion of autologous Treg cells could be a suitable therapeutic approach (either infusion of in‐vitro‐expanded autologous cells, infusion of IL‐2/anti‐IL‐2 complex, or both). In contrast, patients with diseases involving deficiencies of Treg function would benefit from a detailed understanding of the impaired mechanisms of action of their Treg cells. We anticipate the development of suitable therapeutics to correct/reduce the severity of their Treg deficiencies and thereby reduce their disease burden. Another feasible therapeutic option would be to administer functional allogeneic expanded Treg cells. Acknowledgements M. A. is funded by the EASL Juan Rodes PhD Fellowship. The work is supported by the PHRC programme (AOR17082) and by AFPCA (Association Française de la PolyChondrite Atrophiante). Disclosures None declared. References
|
|
Scooped by
Gilbert C FAURE
April 29, 2019 2:29 PM
|
Full text KEYWORDS Antiphospholipid syndrome, antiphospholipid antibodies, thrombosis, pregnancy morbidity, catastrophic antiphospholipid syndrome, treatment INTRODUCTION The antiphospholipid syndrome (APS) is defined by the occurrence of venous and/or arterial thrombotic events and/or pregnancy-related morbidity (≥ 3 unexplained consecutive spontaneous abortions < 10 weeks with exclusion of chromosomal causes, foetal death or severe pre-eclampsia before 34th week of gestation), combined with the presence of circulating antiphospholipid antibodies (aPL) and/or a lupus anticoagulant (LAC), see table 1.1 Formally, LAC is the result of aPL binding to plasma proteins, mainly β2-glycoprotein, that have affinity for the negatively-charged phospholipids; therefore, the pathologic auto-antibodies are not directed against phospholipids. In this paper, the term ‘aPL’ refers to both LAC and anticardiolipin (aCL)/anti-β2-glycoprotein-I (anti-β2GPI) antibodies, following clinical practice and literature. APS is considered a primary autoimmune disease, but is often diagnosed as being secondary to other auto-immune diseases; 30-40% of patients with systemic lupus erythematodes (SLE) also have APS, and APS can be diagnosed secondary to rheumatoid arthritis, systemic sclerosis, dermatomyositis or other autoimmune diseases.2 Large, controlled, randomised clinical trials for interventions in APS are limited, and the quality of current data is not sufficient to develop a structured guideline or assess evidence-based management strategies. However, clinically-relevant questions about diagnostic criteria and treatment of APS patients arise on a daily basis. We aim to provide clinicians with an expert consensus on the management of APS, with a focus on classification, diagnostics, risk stratification, and treatment. METHODS A literature review was performed (KdL and ML) with the following Pubmed search terms: ‘antiphospholipid syndrome’, "Antiphospholipid Syndrome"[Mesh], ‘antiphospholipid antibodies’, "Antibodies, Antiphospholipid"[Mesh], ‘obstetric antiphospholipid syndrome’, ‘catastrophic antiphospholipid syndrome’, ‘laboratory diagnostics’, ‘Clinical Laboratory Techniques"[Mesh] ‘diagnosis’, "Diagnosis"[Mesh], ‘treatment’ and "Therapeutics"[Mesh]; papers focusing on diagnostics and/or treatment for APS were included. Non-English papers and papers published before 2000 were excluded. The literature search was performed on April 3rd, 2018; papers published after that date but with high impact according to the writing committee were included until September 1st, 2018. Statements on APS diagnostics and treatment were extracted from the papers selected, and a first draft of the consensus paper was written (KdL and ML). This draft was circulated amongst all authors and comments were collected. On June 6th, 2018, a first consensus meeting was held in Utrecht, The Netherlands. Based on the outcomes of this meeting, a second draft of the paper was written (JS, ML) and circulated again for comments. On November 5th, 2018, a second consensus meeting was held in Utrecht, The Netherlands. Degree of consensus on statements was assessed by a Delphi procedure and a final report was written afterwards (see table 3). Diagnosis, classification, risk stratification Diagnosis of APS No diagnostic criteria for APS exist. If a patient meets the classification criteria – developed for research purposes – for APS (e.g., a thrombotic event and/or pregnancy morbidity, combined with repeated presence of antiphospholipid antibodies (aPL); see table 1), most likely a clinical diagnosis of APS will be made, although thrombotic and pregnancy complications are not necessarily causally related to circulating aPL. In addition to the thrombotic or pregnancy-related events listed in the classification criteria, APS may be associated with a variety of non-criteria manifestations, such as superficial vein thrombosis, thrombocytopenia, renal microangiopathy, heart valve disease, livedo reticularis or racemosa, migraine, chorea, seizures and myelitis; see table 2. As a result, a clinical diagnosis of APS can be made in patients who do not fulfil the classification criteria.3 An even more complicating factor is the concept of seronegative APS, a term coined to include patients with clinical (criteria and non-criteria) features suggestive of APS, but who are persistently negative for aPL.4 The existence of seronegative APS is a point of international discussion among experts. If the suspicion of seronegative APS arises, we suggest referral to an expert centre. Catastrophic antiphospholipid syndrome (CAPS) is the most extreme APS variant that includes simultaneous multiple organ thrombosis and develops in a short period of time with a high mortality rate. Although strongly associated with the presence of LAC, no other laboratory or clinical determinants are known to be associated with CAPS.2 Risk stratification in APS Several assessment tools to risk-stratify patients have been proposed, mainly focusing on presence and levels of aPL and/or on clinical parameters. For aPL, the presence of LAC is the strongest risk factor for both arterial and venous thrombosis in APS.5,6 For aCL and anti-β2GPI, the association between (levels of) antibodies and thrombosis is less clear. It has been suggested that anti-β2GPIdependent LAC has a strong association with thrombotic risk.7 In several studies, it has been demonstrated that the risk of arterial and venous thrombosis increases with the number of positive tests for aPL, with the highest risks in patients with both LAC, aCL and anti-β2GPI antibodies, so-called ‘triple positive patients’.6,8 In clinical practice, risk stratification does not affect treatment decisions in most situations. The antiphospholipid score (aPL-S) has been developed to predict the risk of APS-related clinical events in patients with APS and other autoimmune diseases (such as SLE, rheumatoid arthritis, and Sjögren’s syndrome) based on the presence of aPL.9 The global APS score (GAPSS) is another clinical score, including both aPL and conventional cardiovascular risk factors, predicting the risk of thrombotic events in patients with SLE.10 The GAPSS has been validated in a cohort of APS patients, and a correlation between higher GAPSS values and recurrence of thrombotic events was observed.11 However, these scores are not sufficient to design treatment strategies for the individual patient. We consider triple positive patients to be at highest risk for recurrent thrombosis. Laboratory diagnostics in APS The classification criteria for APS indicate three different antibody subsets of aPL. For two of these, the antigen is well-defined: aCL antibodies recognize the plasma glycoprotein β2GPI in complex with the anionic phospholipid cardiolipin, and anti-β2GPI antibodies recognize the protein β2GPI in the absence of cardiolipin. Both antibody subtypes can be detected with quantitative solid phase assays in which the antigen is immobilized on a surface. The third aPL subtype, known as LAC, is detected with a functional assay: these antibodies manifest as phospholipid-dependent inhibitors of in vitro coagulation. They are detected with phospholipid sensitive coagulation assays. Although the exact antigen to which LAC are directed is currently unclear, there is ample evidence that antibodies against β2GPI as well as antibodies against prothrombin can induce the LAC phenomenon.12,13 The diagnosis of APS is made in cases of persistent presence of aPL (titre > 99th percentile), assessed in two separate samples taken with an arbitrarily defined interval of at least twelve weeks. This is an important distinction, as several aPL occur transiently in relation to viral and bacterial infections and are of uncertain clinical relevance.14 Moreover, since aPL is prevalent (1-5%) in the general population,15 aPL status should only be tested in patients considered at risk of having APS, such as those < 50 years of age, unprovoked arterial or venous thrombosis, thrombosis at an unusual site, recurrent thrombosis, and thrombotic/pregnancy complications with or without association with a systemic autoimmune disease.16-18 Unfortunately, gold standards for aPL detection are lacking, although aCL assays based on pooled human serum have been in use for over 20 years.19 Reports have been published of new standards based on human(ized) monoclonal antibodies against β2GPI and purified patient-derived polyclonal antibody preparations, but these are not yet available.20 No such standards exist for LAC-positive plasmas. For further harmonization of results between diagnostic laboratories, centres performing these tests participate in diagnostic surveys as part of laboratory accreditation. Measurement of anticardiolipin and anti-β2-glycoprotein I antibodies The classification criteria for APS specify that both immunoglobin G (IgG) and IgM class immunoglobulins against cardiolipin or β2GPI should be measured. Several commercial entities supply kits to measure these antibodies and many laboratories have developed their own solid phase assays. To minimize the effect of the lack of gold standards and the large number of assays in use for detection of aPL on assay standardization, guidance on assay characteristics has been provided by the Scientific Standardization Committee of the International Society on Thrombosis and Haemostasis.16 Detection of aCL and β2GPI antibodies can be performed in both trisodium citrate anticoagulated plasma and in serum. Since aCL antibodies associated with APS are β2GPI-dependent, diagnostic laboratories should use assays in which cardiolipin is saturated with human β2GPI. Samples should be considered positive when the value obtained in these assays exceeds the 99th percentile of the normal population, rather than antibody levels exceeding 40 arbitrary units as indicated in the classification criteria, as this appears to be more specific for APS.21 We recommend that the laboratory report mentions both a cut-off value (< 99th or > 99th percentile, e.g., negative or positive) and a continuous numeric value. Detection of lupus anticoagulant LAC are phospholipid-dependent coagulation inhibitors and are detected with sensitive coagulation assays in trisodium citrate anticoagulated plasma. Plasma samples should be double centrifuged to minimize contamination with platelets, as they are a major source of phospholipid and might therefore interfere with LAC detection.17,18 LAC can be detected with any phospholipid-dependent coagulation assay, however, no gold standard for LAC testing exists. For this reason, it is warranted to perform two tests based on a different assay principle for LAC detection, preferably a dilute Russell’s viper venom time (dRVVT) and a LAC-sensitive activated partial thromboplastin time (APTT).17 In order to be deemed LAC-positive, a sample should have a prolonged clotting time when a reagent with a low phospholipid content is used (screening test), which should correct when a reagent with a high phospholipid content is used (confirmatory test), indicating phospholipid-dependence of the prolongation. The presence of a coagulation inhibitor as the cause of the prolongation should be shown with a mixing test, in which patient plasma is mixed with an equal volume of pooled normal plasma. This will normalise any coagulation factor deficiencies that are present, and any remaining prolongation of the clotting time is therefore caused by an inhibitor. Cut-off values for LAC should be determined locally in each diagnostic laboratory, based on the 99th percentile of the local normal population or alternatively, on the mean + 2 standard deviation (SD) of the clotting time of the normal population. The strength of the LAC should be expressed as a ratio between screen and confirm clotting times, preferably normalized on the mean of the normal population, according to the following equation: Samples are deemed positive for LAC when one or both tests for LAC detection (APTT and dRVVT-based tests) indicate the presence of LAC. The use of anticoagulant drugs interferes with detection of LAC, possibly resulting in false-positive test results. Samples for LAC-detection should therefore be collected before treatment with anticoagulants has started, or sufficiently long after cessation of treatment to minimize confounding effects. However, it should be avoided to use samples obtained in the acute phase after a thrombotic event or during infection, as this is associated with high Factor VIII levels, which might interfere with LAC detection by APTT-based assays. Although LAC can be determined in samples from patients receiving vitamin K antagonists when they are mixed with an equal volume of pooled normal plasma, the outcome of LAC tests in samples with an INR within therapeutic range (INR 2-3) should be interpreted with caution and measurement of LAC in samples with an international normalised ratio (INR) > 3 is not recommended. Mixing antagonists with normal plasma dilutes the titre of LAC and thus reduces the sensitivity of the assay. On the other hand, the mixing test may not completely correct the clotting time for samples in the high INR range and may lead to false-positive interpretation. Temporary discontinuation of vitamin K antagonists (or co-administration of vitamin K and continuing vitamin K antagonists) and bridging with low molecular weight heparin is possible. Unfractionated heparin, however, is incompatible with LAC testing, as is the use of direct oral anticoagulants, even at trough levels of factor Xa or thrombin inhibitors, with factor Xa inhibitors producing false-positive LAC.22 No alternatives exist for LAC detection in samples containing direct thrombin inhibitors. A possible means to detect LAC in samples containing rivaroxaban is the Taipan snake venom time/Ecarin clotting time combination, as these tests are insensitive to factor Xa-inhibitors.23 More studies on the specificity and sensitivity for LAC of this test combination are required before these tests will be widely adopted for LAC detection. Non-criteria aPL There are several reports on the association between various non-criteria aPL subtypes and thrombosis. Amongst these are IgA anti-β2GPI antibodies,24-26 antibodies against the phospholipid phosphatidylethanolamine (PE),27 antibodies against the complex between the phospholipid phosphatidylserine, and the coagulation factor prothrombin (aPS/PT).28 Currently, however, there is insufficient evidence of their clinical relevance to warrant routine detection of these antibodies. Treatment Venous thrombosis in APS A first venous thrombotic event (VTE; amongst others including deep vein thrombosis and pulmonary embolism, abdominal vein thrombosis, cerebral vein thrombosis) should be treated according to the current guidelines for treatment of VTE; no routine testing for aPL is indicated in the general population. In cases of recurrent thrombosis (both provoked and unprovoked), or patients with a pre-existing autoimmune disease (and in particular, SLE), additional testing for aPL should be performed. Low molecular weight heparin (LMWH) in therapeutic doses and subsequent vitamin K antagonists (VKA) are first-line treatments for a first or recurrent APS-related venous thrombotic event (VTE). Treatment with direct oral anticoagulants (DOACs; see separate section below) is not recommended. For APS patients with a first VTE, life-long anticoagulation is recommended. After treatment with LMWH in the acute phase, treatment will be switched to VKA, with an INR target range of 2.0-3.0 for venous events.29,30 High-intensity treatment with an INR ≥ 3.0 after a first VTE is not recommended.31,32 Arterial thrombosis in APS Optimal long-term treatment for arterial thrombosis (other than cerebral arterial thrombosis; see below) is still a matter of debate; either anti-platelet therapy such as aspirin or clopidogrel, VKA with an INR target range of 2.5-3.5 or combined therapy with VKA with an INR target range of 2.0-3.0 and anti-platelet therapy has been recommended.30 As combined therapy, VKA and anti-platelet therapy has not been shown to be superior to anti-platelet therapy alone, and since more major bleeding complications were observed in the combination group,33 we do not recommend up-front combined treatment with both VKA and anti-platelet therapy. Based on expert opinion and in slight contrast with international recommendations, we prefer treatment with either clopidogrel or VKA with an INR target range of 2.0-3.0 in these patients.33,34 In patients with a cerebral ischemic event (transient ischemic attack (TIA) or ischemic stroke) as clinical manifestation, there is no evidence supporting one therapy over the other. A prospective, comparative study in aPL-positive stroke patients showed no benefit of warfarin over aspirin (325 mg/day) on recurrent events; more (minor) haemorrhagic complications in the warfarin group were observed. However, these patients did not necessarily fulfil APS criteria.35 A small (n = 20), randomized, controlled trial in APS patients with ischemic stroke compared VKA and low-dose aspirin with low-dose aspirin alone, and demonstrated less recurrent stroke in the combined-therapy group.36 In APS patients with a first ischemic stroke or TIA without any cause other than APS on work-up, we propose treatment with either VKA with an INR target range of 2.0-3.0 or clopidogrel (since this is superior to aspirin for stroke prevention in a general population suffering from atherosclerotic cerebrovascular disease).37 Position of direct oral anticoagulants in APS DOACs such as dabigatran, rivaroxaban, apixaban, and edoxaban, were shown to be non-inferior to VKAs for treatment and secondary prevention of venous thromboembolic events and prevention of stroke and systemic embolism in patients with nonvalvular atrial fibrillation.38 Furthermore, these drugs have some advantages compared to VKAs as it is a fixed dose, no monitoring is required, interaction is limited, and there is a lower risk of intracranial and other major bleeding. Nonetheless, few studies are published concerning the use of DOACs in known APS. A recent review summarised the available data, including one randomized controlled trial (RAPS trial) and case series.39 From all available case series and case reports, 122 patients were analysed.39 High-risk APS patients with triple positivity or with several clinical criteria for definite APS, developed recurrent thrombosis more frequently while on DOACs in comparison to warfarin. The RAPS trial, comparing 54 APS patients treated with rivaroxaban to 56 APS patients treated with warfarin, demonstrated that the in vitro anticoagulant effect of rivaroxaban may be inferior to that of warfarin.40 A randomized controlled clinical trial in triple positive patients, comparing VKA treatment with rivaroxaban, was terminated early due to more thrombotic events in the rivaroxaban-arm, with particularly more ischemic strokes in the DOAC group.41 At this moment VKAs, compared to DOACs, remain the standard of care in the treatment of APS, especially in high-risk APS patients. DOACs might be an alternativetreatment modality for only those patients with instable INR or poor adherence to INR monitoring, and we anticipate more data from future trials using DOACs in thrombotic APS. Recurrent venous thrombotic events while using anticoagulation therapy Recurrent thrombosis in APS patients, despite adequate anticoagulation therapy (INR target range, 2.0-3.0) is common and occurs in up to one-third of all patients.2 However, recurrent thrombosis is uncommon in APS patients with a higher INR target range of 2.5-3.5 and most patients treated with a VKA with recurrent thrombosis, appear to have an INR target < 3.0.42 Therefore, anticoagulation therapy should be intensified with a INR target range of 2.5-3.5 in case of a recurrent venous event despite adequate INR. When a recurrent venous thrombosis is diagnosed with a suboptimal INR (< 2.0), therapeutic LMWH should be given for a period of two weeks and the INR treatment range should not be changed. Note that the INR value can be underestimated due to interference of thromboplastin and LAC, although this is mostly problematic with higher INR values, i.e. > 4.0.43 If the target INR cannot be reached and/or maintained with VKA, referral to an expert centre is recommended. Based on expert opinion, in patients with recurrent venous thrombosis, despite an adequate INR target range of 2.5-3.5 and after two weeks of therapeutic LMWH, additional long-term use of aspirin can be recommended, or intensifying of VKA therapy with to an INR target range of 3-4. Alternatively, a permanent switch to therapeutic LMWH can be considered. Combining VKA with hydroxychloroquine may also decrease the risk of recurrent venous thrombosis, although randomized studies with hydroxychloroquine in APS are still lacking.44,45 Until now, no clinical support for the use of statins in patients with recurrent venous thrombosis despite anticoagulation exists. However, based on in vitro work and surrogate endpoints, a beneficial role of statins has been suggested.46,47 Recurrent arterial thrombotic events while using anticoagulation therapy No consensus on treatment of recurrent arterial thrombosis was reached at the last meeting of the APS task force.30 Optimal treatment strategies for recurrent arterial thrombotic events have not been studied. In recurrent arterial thrombosis, including TIA or ischemic stroke, despite treatment with clopidogrel, we suggest switching treatment to VKA with an INR target range of 2.0-3.0. If recurrent arterial thrombosis occurs despite adequate treatment with VKA, referral to an expert centre is recommended. We do not recommend to routinely perform brain magnetic resonance imaging (MRI) in APS patients with an ischemic stroke. However, some experts believe that if neurological symptoms, including migraine or cognitive performance, deteriorate, a repeat brain MRI is indicated and new white matter abnormalities may lead to intensifying treatment. The possible benefits of this strategy have not been confirmed in clinical studies, and for patients with deterioration of neurological symptoms, referral to an expert centre is recommended. Catastrophic antiphospholipid syndrome (CAPS) CAPS is a rare complication of APS and occurs in approximately 1% of APS patients. CAPS is a severe condition, including massive (mostly arterial) thrombosis of small vessels, causing multi-organ failure. Mortality in CAPS is high, up to 50%. Adequate and fast treatment initiation slightly improves clinical outcomes (mortality 20-40%) and treatment should be carried out in an expert centre.48,49 A combination of anticoagulant drugs (mostly unfractionated heparin with APTT ratio 2-2.5), intravenous corticosteroids (methylprednisolone 500-1000 mg/day for 3-5 days), therapeutic plasma exchange (TPE) and/or intravenous immunoglobulins (IVIG) (1 g/kg, for a time period of 3 days) is associated with highest survival rates. Combination of heparin-corticosteroids-plasmapheresis with or without additional IVIG results in 69-78% patient survival.50-52 TPE should be started when the clinical suspicion of CAPS arises, within a minimum of 5 days.52 Clinical response dictates the duration of TPE and no single clinical or laboratory parameter is used to determine when to discontinue treatment. For patients with CAPS and underlying SLE, treatment with cyclophosphamide (750 mg/m2 monthly) has been proposed.48,53 Rituximab (anti-CD20) has been administered to patients with refractory CAPS and may be of adjunctive value in a selected population of patients. Eculizumab (anti-complement 5) has been reported in case reports as a last resort, and could be considered in those patients refractory to all other therapies.54,55 Pregnancy and antiphospholipid antibodies Pregnancy complications of APS include recurrent first trimester pregnancy loss, intrauterine growth restriction (IUGR), preeclampsia (PET), premature birth, and intrauterine death (IUD). Early miscarriages are reported in 26-35% and aPL-related PET, premature birth or foetal death are seen in 10–20% of APS pregnancies.2,56 Women with positive aPL do not all carry the same obstetric risk. The following parameters are associated with an increased risk: the presence of LAC, more than one aPL (especially triple positivity), IgG aPL (instead of IgM), previous thrombosis, previous pregnancy complications, associated autoimmune condition, and hypocomplementemia.57 At present, however, risk stratification does not direct different treatment strategies. The current standard treatment, based on low-dose aspirin and LMWH, increases the percentage of a successful pregnancy from 20% to 54-80%.58 In patients with obstetrical APS, aspirin and a prophylactic dose of LMWH should be administered. Depending on the context (concurrent SLE, maternal age, non-criteria clinical features), treatment of patients with fewer than three miscarriages, and therefore, formally not classified as having APS, can be considered. To prevent overtreatment in these cases, confirmation of miscarriage by ultrasound is recommended. During pregnancy, regular clinical pregnancy follow-up is sufficient; only in specified subpopulations (e.g. patients with SLE, chronic kidney disease, morbid obesity, triple positive antibody profile, and patients with a thrombotic event during pregnancy), follow-up (of foetal growth and hypertensive pregnancy complications) should be intensified. Platelets should be checked at least once every 10-14 days after starting LMWH to exclude heparin-induced thrombocytopenia. If pregnancy complications (foetal death or miscarriage) still occur despite combined treatment with low-dose aspirin and prophylactic dose of LMWH, the dose of LMWH can be increased to a therapeutic dose; reverting back to a prophylactic dose of LMWH after 36 weeks of gestation can be considered. Based on expert opinion, patients with APS who already use therapeutic anticoagulation before pregnancy, should be switched to therapeutic dose of LMWH and low-dose aspirin should be added. Anti-factor Xa levels should be periodically monitored (at least once every trimester) in patients receiving therapeutic doses of LMWH, depending on the context. If this strategy fails, further treatment should take place in an expert centre. The recommendations are again based on expert opinion and retrospective cohort studies and include, for example, the addition of hydroxychloroquine or intravenous immunoglobulins. This should however, be confirmed in randomized controlled trials.59-61 In the postpartum period there is an increased risk for thrombosis. Patients with APS with an indication of therapeutic anticoagulation before pregnancy, should be switched to VKA or continue with therapeutic LMWH. Obstetrical APS patients should receive prophylactic or intermediate doses (a randomized clinical trial to investigate optimal dosing is currently underway62) of LMWH during a period of six weeks postpartum.57 Withdrawal of antithrombotic treatment in APS As mentioned above it is recommended to treat thrombotic APS patients lifelong. However, as long-term anticoagulation therapy is associated with haemorrhagic complications, the question arises whether it is possible to withdraw this therapy in selected patients, especially those who have a long-term event free period or who no longer have positive aPL, also called seroconversion. Only a few (uncontrolled and small) studies have addressed this question. Criado-Garcia et al described the effects of anticoagulation withdrawal in six primary APS patients in whom aPL had disappeared.63 None of these patients experienced a thrombotic event during a follow-up of 21 ± 4.9 months. It should be mentioned, however, that these patients were at low risk for recurrence, as they only had a venous thrombosis history. Similar results were found by Coloma Bazan et al, who reported no thrombotic recurrences after anticoagulation withdrawal durign a median follow-up of 20 months in 11 primary APS patients (seven with history of venous thrombosis and four with obstetrical APS).64 However, in a more recent study, 30 APS patients with anticoagulation withdrawal were compared to a thrombotic APS control population without withdrawal. During a median follow-up of 51 months, anticoagulation withdrawal was associated with a higher risk of thrombotic relapse (HR 4.82). Predictive factors were male gender, anti-β2GPI-positivity and triple positivity at onset as well as persistence positivity over time. Predictive factors for low risk of relapse were aspirin prescription and aPL disappearance during follow-up.65 In conclusion, data is insufficient to draw firm conclusions concerning anticoagulation withdrawal in APS patients. The available data suggests that anticoagulation could be withdrawn in APS patients with a single provoked venous thrombotic event in the presence of a known transient precipitating risk factor (such as smoking, disease activity, oral contraceptive use) together with disappearance of aPL. In all other situations, the high risk of thrombotic relapse favours the continuance of anticoagulation treatment. Randomized studies with larger sample sizes are still needed to confirm these statements.66,67 The decision to withdraw anticoagulation in APS patients should be made in an expert centre. Position of rituximab, hydroxychloroquine, intravenous immunoglobulins Several immunomodulatory drugs are suggested for the treatment for patients with APS, although their exact use in the treatment of APS is unclear; these include. rituximab, hydroxychloroquine (HCQ), and IVIG. Most evidence is based on cohort studies, case series or expert opinion. Only a few randomised controlled trials (RCTs) are published. Furthermore, their application is strongly dependent on the different clinical situations. For example, in secondary APS in SLE patients, HCQ is strongly recommended, as it has been shown that HCQ has ‘thrombo-protective’ effects, resulting in fewer venous and arterial thrombotic events.68 In primary APS, limited data is available. One retrospective cohort study demonstrated strong reduction of aPL titres and a decrease in the incidence of arterial thrombosis recurrence by using HCQ.69,70 One RCT randomizing 40 APS patients to VKAs versus VKAs with HCQ showed a protective effect of adding HCQ upon venous thrombotic events.45 At this moment, HCQ is not included in standard care of primary APS, but refractory cases, including refractory obstetrical APS, might benefit from this treatment. Treatment with HCQ (200-400 mg per day) is safe during pregnancy and lactation. Rituximab and IVIG may be used in difficult-totreat APS patients, especially in those with CAPS or recurrent haematological non-criteria manifestations as thrombocytopenia, but not as standard of care of APS.71,72 Prophylaxis in aPL-positive patients without earlier events The question remains whether patients with obstetric APS or individuals with positive aPL without thrombotic events should be treated to prevent thrombosis (primary thromboprophylaxis). At present, there is insufficient evidence to support prophylactic treatment for all of these patients.8,73 However, in patients with more risk factors for thrombosis (such as obesity, smoking, higher age) and/ or high-risk aPL profile (e.g., triple positive), low dose aspirin might be beneficial. In any case, attention should be paid to avoid or to treat any associated cardiovascular risk factors, e.g. using antihypertensives or cholesterollowering agents and avoidance of smoking, etc. Also, the administration of oral contraceptives should be used with caution and with counselling.74 Lastly, prophylaxis of venous thrombosis using LMWH is required for patients in situations associated with increased risk of thrombosis, such as surgical procedures, plaster casts, and those requiring bed rest. CONCLUSION APS is a rare and heterogeneous disease and as a result, well-designed and well-conducted clinical trials are scarce and the development of a formal guideline is difficult. However, by combining data from completed clinical intervention trials together with observational data and data from research in other thrombotic and/ or inflammatory conditions, recommendations for clinical practice can be formulated. Current national and international initiatives – such as the Dutch Arthritis Research and Collaboration Hub (ARCH) and the European Reference Network on Rare and Complex Connective Tissue and Musculoskeletal Diseases (ERN-ReConnet) – are aiming to structure the care for APS patients to offer a unique future opportunity to collect longitudinal clinical data on APS treatment and outcomes. Until a formal guideline has been made, this consensus paper fills the gap between evidence-based medicine and daily clinical practice for the care of APS patients. ACKNOWLEDGEMENTS KdL and ML performed the literature search and wrote the first article draft. All authors reviewed and commented on the first article draft and attended the first consensus meeting. JS and ML wrote the second article draft. All authors reviewed and commented on the second article draft. ML wrote the final report. All authors read the final report and agreed with the text. DISCLOSURES All authors declare no conflicts of interest. FUNDING This work was supported by the Arthritis Research and Collaboration Hub (ARCH) Foundation. REFERENCES Myakis S, Lockshin MD, Atsumi T, et al. International consensus statement on an update of the classification criteria for definite antiphospholipid syndrome (APS). J Thromb Hemost. 2006;4:295-306. Cervera R, Piette JC, Font J et al. Antiphospholipid syndrome: clinical and immunologic manifestations and patterns of disease expression in a cohort of 1,000 patients. Arthritis Rheum. 2002;46:1019-27. Abreu MM, Danowski A, Wahl DG, et al. The relevance of "non-criteria" clinical manifestations of antiphospholipid syndrome: 14th International Congress on Antiphospholipid Antibodies Technical Task Force Report on Antiphospholipid Syndrome Clinical Features. Autoimmun Rev. 2015;14:401-14. Hughes GRV, Khamashta MA. Seronegative antiphospholipid syndrome. Ann Rheum Dis. 2003;62:1127. Galli M, Luciani D, Bertolini G, Barbui T. Lupus anticoagulants are stronger risk factors for thrombosis than anticardiolipin antibodies in the antiphospholipid syndrome: a systematic review of the literature. Blood. 2003;101:1827-32. De Groot PG, Lutters B, Derksen RH, Lisman T, Meijers JC, Rosendaal FR. Lupus anticoagulants and the risk of a first episode of deep venous thrombosis. J Thromb Haemost. 2005;3:1993-7. de Laat HB, Derksen RH, Urbanus RT, Roest M, De Groot PG. Beta2-glycoprotein I-dependent lupus anticoagulant highly correlates with thrombosis in the antiphospholipid syndrome. Blood. 2004;104:3598-602. Pengo V, Ruffatti A, Legnani C, et al. Incidence of a first thromboembolic event in asymptomatic carriers of high-risk antiphospholipid antibody profile: a multicenter prospective study. Blood. 2011;118:4714-8. Otomo K, Atsumi T, Amenqual O, et al. Efficacy of the antiphospholipid score for the diagnosis of antiphospholipid syndrome and its predictive value for thrombotic events. Arthritis Rheum. 2012;64:504-12. Sciascia S, Sanna G, Murru V, Roccatello D, Khamashta MA, Bertolaccini ML. GAPSS: the global anti-phospholipid syndrome score. Rheumatology (Oxford, England). 2013;52:1397-403. Sciascia S, Sanna G, Murru V, Roccatello D, Khamashta MA, Bertolaccini ML. The global anti-phospholipid syndrome score in primary APS. Rheumatology (Oxford, England). 2015;54:134-8. Bevers EM, Galli M, Barbui T, Comfurius P, Zwaal RF. Lupus anticoagulant IgG's (LA) are not directed to phospholipids only, but to a complex of lipid-bound human prothrombin. Thromb Haemost. 1991;66:629-32. Oosting JD, Derksen RH, Entjes HT, Bouma BN, de Groot PG. Lupus anticoagulant activity is frequently dependent on the presence of beta 2-glycoprotein I. Thromb Haemost. 1992;67:499-502. De Groot PG, Urbanus RT. Antiphospholipid Syndrome--Not a Noninflammatory Disease. Semin Thromb Hemost. 2015;41:607-14. Mchrani T, Petri M. Handbook of systemic autoimmune diseases. 2nd edition. Amsterdam: Elsevier; 2009. Chapter 2: Epidemiology of the antiphospholipid syndrome:13-34. Devreese KM, Pierangeli SS, de Laat B, et al. Testing for antiphospholipid antibodies with solid phase assays: guidance from the SSC of the ISTH. J Thromb Haemost. 2014;12:792-5. Pengo V, Tripodi A, Reber G, et al. Update of the guidelines for lupus anticoagulant detection. Subcommittee on Lupus Anticoagulant/ Antiphospholipid Antibody of the Scientific and Standardisation Committee of the International Society on Thrombosis and Haemostasis. J Thromb Haemost. 2009;7:1737-40. Keeling D, Mackie I, Moore GW, Greer IA, Greaves M. British Committee for Standards in Haematology. Guidelines on the investigation and management of antiphospholipid syndrome. Br J Haematol. 2012;157:47-58. Harris EN. Special report. The Second International Anti-cardiolipin Standardization Workshop/the Kingston Anti-Phospholipid Antibody Study (KAPS) group. Am J Clin Pathol. 1990;94:476-84. Willis R, Grossi C, Orietta Borghi M. et al. International standards for IgG and IgM anti-β2glycoprotein antibody measurement. Lupus. 2014;23:1317-9. Ruffatti A, Olivieri S, Tonello M, et al. Influence of different IgG anticardiolipin antibody cut-off values on antiphospholipid syndrome classification. J Thromb Haemost. 2008;6:1693-6. Merriman E, Kaplan Z, Butler J, Malan E, Gan E, Tran H. Rivaroxaban and false positive lupus anticoagulant testing. Thromb Haemost, 2011;105:385-6. Van Os GM, de Laat B, Kamphuisen PW, Meijers JC, de Groot PG. Detection of lupus anticoagulant in the presence of rivaroxaban using Taipan snake venom time. J Thromb Haemost. 2011;9:1657-9. Tortosa C, Cabrera-Marante O, Serrano M, et al. Incidence of thromboembolic events in asymptomatic carriers of IgA anti β2 glycoprotein-I antibodies. PLoS One. 2017 20;12:e0178889. Pericleous C, Ferreira I, Borghi O, et al. Measuring IgA Anti-β2-Glycoprotein I and IgG/IgA Anti-Domain I Antibodies Adds Value to Current Serological Assays for the Antiphospholipid Syndrome. PLoS One. 2016;11:e0156407. Murthy V, Willis R, Romay-Penabad Z, et al. Value of isolated IgA anti-β2 -glycoprotein I positivity in the diagnosis of the antiphospholipid syndrome. Arthritis Rheum. 2013;65:3186-93. Sanmarco M, Gayet S, Alessi MC, et al. Antiphosphatidylethanolamine antibodies are associated with an increased odds ratio for thrombosis. A multicenter study with the participation of the European Forum on antiphospholipid antibodies. Thromb Haemost. 2007;97:949-54. Nojima J, Iwatani Y, Suehisa E, Kuratsune H, Kanakura Y. The presence of anti-phosphatidylserine/prothrombin antibodies as risk factor for both arterial and venous thrombosis in patients with systemic lupus erythematosus. Haematologica. 2006;91:699-702. Bala MM, Celinska-Lowenhoff M, Szot W, et al. Antiplatelet and anticoagulant agents for secondary prevention of stroke and other thromboembolic events in people with antiphospholipid syndrome. Cochrane Database Syst Rev. 2017;10:CD012169. Ruiz-Irastorza G, Cuadrado MJ, Ruiz-Arruza I, et al. Evidence-based recommendations for the prevention and long-term management of thrombosis in antiphospholipid antibody-positive patients: report of a task force at the 13th International Congress on antiphospholipid antibodies. Lupus. 2011;20:206-18. Crowther MA, Ginsberg JS, Julian J, et al. A comparison of two intensities of warfarin for the prevention of recurrent thrombosis in patients with the antiphospholipid antibody syndrome. N Engl J Med. 2003;349:1133-8. Finazzi G, Marchioli R, Brancaccio V. et al. A randomized clinical trial of high-intensity warfarin vs. conventional antithrombotic therapy for the prevention of recurrent thrombosis in patients with the antiphospholipid syndrome (WAPS). J Thromb Haemost. 2005;3:848-53. Cuadrado MJ, Bertolaccini ML, Seed PT, et al. Low-dose aspirin vs low-dose aspirin plus low-intensity warfarin in thromboprophylaxis: a prospective, multicentre, randomized, open, controlled trial in patients positive for antiphospholipid antibodies (ALIWAPAS). Rheumatology (Oxford). 2014;53:275-84. Gerhard-Herman MD, Gornik HL, Barrett C, et al. 2016 AHA/ACC Guideline on the Management of Patients With Lower Extremity Peripheral Artery Disease: A Report of the American College of Cardiology/American Heart Association Task Force on Clinical Practice Guidelines. Circulation. 2017;135:e726-e779. Levine SR, Brey RL, Tilley BC, et al. Antiphospholipid antibodies and subsequent thrombo-occlusive events in patients with ischemic stroke. JAMA. 2004;291:576-84. Okuma H. et al. Comparison between single antiplatelet therapy and combination of antiplatelet and anticoagulation therapy for secondary prevention in ischemic stroke patients with antiphospholipid syndrome. Int J Med Sci. 2009;7:15-8. Xu H, Ping Y, Lin H, He P, Li W, Dai H. Antiplatelet Strategies and Outcomes in Patients with Noncardioembolic Ischemic Stroke from a Real-World Study with a Five-Year Follow-Up. Transl Stroke Res. 2017;8:228-33. Van der Hulle T, Kooiman J, den Exter PL, Dekkers OM, Klok FA, Huisman MV. Effectiveness and safety of novel oral anticoagulants as compared with vitamin K antagonists in the treatment of acute symptomatic venous thromboembolism: a systematic review and meta-analysis. J Thromb Haemost. 2014;12:320-8. Dufrost V, Risse J, Zuily S, Wahl D. DOAC USE in APS: are the drugs an effective and safe alternative to warfarin? Curr Rheum Report. 2016 Dec;18:74. Cohen H, Hunt BJ, Efthymiou M, et al. Rivaroxaban versus warfarin to treat patients with thrombotic antiphospholipid syndrome, with or without systemic lupus erythematosus (RAPS): a randomised, controlled, open-label, phase 2/3, non-inferiority trial. Lancet Haematol. 2016;3:e426-36. Pengo V, Denas G, Zoppellaro G, et al. Rivaroxaban vs warfarin in high-risk patients with antiphospholipid syndrome. Blood. 2018;132:1365-71. Ruiz-Irastorza G, Hunt BJ, Khamashta MA. A systematic review of secondary thromboprophylaxis in patients with antiphospholipid antibodies. Arthritis Rheum. 2007;57:1487-95. Ferrazzi P, Colombo A, Di Micco P, et al. Differences in the INR evaluation of two different thromboplastins in patients with positivity to lupus anticoagulant in ongoing oral anticoagulation. J Blood Med. 2010;1:57-60. Erkan D, Aguiar CL, Andrade D, et al. 14th International Congress on Antiphospholipid Antibodies task force report on antiphospholipid syndrome treatment trends. Autoimmun Rev. 2014;13:685-96. Schmidt-Tanguy A, Voswinkel J, Henrion D, et al. Antithrombotic effects of hydroxychloroquine in primary antiphospholipid syndrome patients. J Thromb Haemost. 2013;11:1927-9. Ruiz-Irastorza G, Crowther M, Branch W, Khamashta MA. Antiphospholipid syndrome. Lancet. 2010;376:1498-509. Jajoria P, Murthy V, Papalardo E, Romay-Penabad Z, Gleason C, Pierangeli SS. Statins for the treatment of antiphospholipid syndrome? Ann NY Acad Sci. 2009;1173:736-45. Rodriguez-Pinto I, Moitinho M1, Santacreu I, et al. Catastrophic antiphospholipid syndrome (CAPS): Descriptive analysis of 500 patients from the International CAPS Registry. Autoimmun Rev. 2016;15:1120-24. Asherson RA, Cervera R, Piette JC, et al. Catastrophic antiphospholipid syndrome: clues to the pathogenesis from a series of 80 patients. Medicine (Baltimore). 2001;80:355-77. Bucciarelli S, Espinosa G, Cervera R, et al. Mortality in the catastrophic antiphospholipid syndrome: causes of death and prognostic factors in a series of 250 patients. Arthritis Rheum. 2006;54:2568-76. Cervera R. 8th International Congress on Autoimmunity: new perspectives for refractory catastrophic antiphospholipid syndrome. Expert Rev Clin Immunol. 2012;8:617-9. Legault K, Schunemann H, Hillis C, et al. McMaster RARE-Bestpractices clinical practice guideline on diagnosis and management of the catastrophic antiphospholipid syndrome. J Thromb Haemost. 2018;16:1656-64. Bayraktar UD, Erkan D, Bucciarelli S, et al. The clinical spectrum of catastrophic antiphospholipid syndrome in the absence and presence of lupus. J Rheumatol. 2007;34:346-52. Kronbichler A, Frank R, Kirschfink M, et al. Efficacy of eculizumab in a patient with immunoadsorption-dependent catastrophic antiphospholipid syndrome: a case report. Medicine (Baltimore). 2014;93:e143. Shapira I, Andrade D, Allen SL, Salmon JE. Brief report: induction of sustained remission in recurrent catastrophic antiphospholipid syndrome via inhibition of terminal complement with eculizumab. Arthritis Rheum. 2012;64:2719-23. Schreiber K, Radin M, Sciascia S. Current insights in obstetric antiphospholipid syndrome. Curr Opin Obstet Gynaecol. 2017;29:397-403. Chighizola CB, Gerosa M, Trespidi L, Di Giacomo A, Rossi F, Acaia B, Meroni PL. Update on the current recommendations and outcomes in pregnant women with antiphospholipid syndrome. Expert Rev Clin Immunol. 2014;10:1505-17. Bates SM, Greer IA, Middeldorp S, et al. VTE, thrombophilia, antithrombotic therapy, and pregnancy: Antithrombotic therapy and prevention of thrombosis, 9th edition: American college of chest physicians evidence-based clinical practice guidelines. Chest. 2012;141:e691S-736S. Alijotas-Reig J. Treatment of refractory obstetric antiphospholipid syndrome: The state of the art and new trends in the therapeutic management. Lupus. 2013;22:6-17. Mekinian A, Lazzaroni MG, Kuzenko A, et al. The efficacy of hydroxychloroquine for obstetrical outcome in anti-phospholipid syndrome: Data from a European multicenter retrospective study. Autoimmun Rev. 2015;14:498-502. Mekininian A, Alijotas-Reig J, Carrat F, et al. Refractory obstetrical APS: features, treatment and outcome in a European multicenter retrospective study. Autoimmun Rev. 2017;16:730-4. Bleker SM, Buchmüller A, Chauleur C, et al. Low-molecular-weight heparin to prevent recurrent venous thromboembolism in pregnancy: Rationale and design of the Highlow study, a randomized trial of two doses. Throm Res. 2016;144;62-8. Criado-Garcia J, Fernández-Puebla RA, JimŽnez LL, Velasco F, Santamaria M, Blanco-Molina A. Anticoagulation treatment withdrawal in primary antiphospholipid syndrome when anticardiolipin antibodies become negative. Rev Clin Esp. 2008;208:135-7. Coloma Bazan E, Donate López C, Moreno Lozano P, Cervera R, Espinosa G. Discontinuation of anticoagulation or antiaggregation treatment may be safe in patients with primary antiphospholipid syndrome when antiphospholipid antibodies became persistently negative. Immunol Res. 2013;56:358-61. Yelnik CM, Urbanski G, Drumez E, et al. Anticoagulation withdrawal in antiphospholipid syndrome: a retrospective matched-control study. Lupus. 2018;27:357-64. Sciascia S, Coloma-Bazán E, Radin M, et al. Can we withdraw anticoagulation in patients with APS after seroconversion? Autoimmun Rev. 2017;16:1109-14. Kearon C, Parpia S, Spencer FA, et al. Antiphospholipid antibodies and recurrent thrombosis after a first unprovoked venous thromboembolism. Blood. 2018;131;2151-60. Jung H, Bobba R, Su J, et al. The protective effect of antimalarial drugs on thrombovascular events in systemic lupus erythematosus. Arthritis Rheum. 2010;62:863-8. Broder A, Putterman C. Hydroxychloroquine use is associated with lower odds of persisently positive antiphospholipid antibodies and/ or lupus anticoagulant in systemic lupus erythematosus. J Rheumatol. 2013;40:30-3. Nuri E, Taraborelli M, Andreoli L, et al. Long-term use of hydroxychloroquine reduces antiphospholipid antibodies levels in patients with primary antiphospholipid syndrome. Immunol Res. 2017;65:17-24. Al Marzooqi A, Leone A, Al Saleh J, Khamashta M. Current status and future prospects for the treatment of antiphospholipid syndrome. Expert Rev Clin Immunol. 2016;12:927-35. Tenti S, Cheleschi S, Guidelli GM, Galeazzi M, Fioravanti A. Intravenous immunoglobulins and antiphospholipid syndrome: How, when and why? A review of the literature. Autoimmun Rev. 2016;15:226-35. Erkan D, Harrison MJ, Levy R, et al. Aspirin for primary thrombosis prevention in the antiphospholipid syndrome: a randomized, double-blind, placebo-controlled trial in asymptomatic antiphospholipid antibody-positive individuals. Arthritis Rheum. 2007;56:2382-91. Legault KJ, Ugarte A, Crowther MA, Ruiz-Irastorza G. Prevention of Recurrent Thrombosis in APS: different from general population. Curr Rheumatol Rep. 2016;18:26.
|
|
Scooped by
Gilbert C FAURE
April 23, 2019 5:09 AM
|
Research ArticleImmunology Free access | 10.1172/jci.insight.126471 Stem cell–derived tissue-associated regulatory T cells suppress the activity of pathogenic cells in autoimmune diabetes Mohammad Haque,1 Fengyang Lei,2 Xiaofang Xiong,1 Jugal Kishore Das,1 Xingcong Ren,3 Deyu Fang,4 Shahram Salek-Ardakani,5 Jin-Ming Yang,3 and Jianxun Song1 First published February 19, 2019 - More info Abstract The autoantigen-specific Tregs from pluripotent stem cells (PSCs), i.e., PSC-Tregs, have the ability to suppress autoimmunity. PSC-Tregs can be programmed to be tissue associated and to infiltrate into local inflamed tissues to suppress autoimmune responses after adoptive transfer. Nevertheless, the mechanisms by which the autoantigen-specific PSC-Tregs suppress the autoimmune response remain to be fully elucidated. In this study, we generated functional autoantigen-specific Tregs from the induced PSC (iPSCs), i.e., iPSC-Tregs, and investigated the underlying mechanisms of autoimmunity suppression by these Tregs in a type 1 diabetes (T1D) murine model. A double-Tg mouse model of T1D was established in F1 mice, in which the first generation of RIP-mOVA Tg mice that were crossed with OT-I T cell receptor (TCR) Tg mice was challenged with vaccinia viruses expressing OVA (VACV-OVA). We show that adoptive transfer of OVA-specific iPSC-Tregs greatly suppressed autoimmunity in the animal model and prevented the insulin-secreting pancreatic β cells from destruction. Further, we demonstrate that the adoptive transfer significantly reduced the expression of ICAM-1 in the diabetic pancreas and inhibited the migration of pathogenic CD8+ T cells and the production of the proinflammatory IFN-γ in the pancreas. These results indicate that the stem cell–derived tissue-associated Tregs can robustly accumulate in the diabetic pancreas, and, through downregulating the expression of ICAM-1 in the local inflamed tissues and inhibiting the production of proinflammatory cytokine IFN-γ, suppress the migration and activity of the pathogenic immune cells that cause T1D. Graphical Abstract Introduction Type 1 diabetes (T1D) develops due to autoimmune self-destruction of pancreatic β cells that produce insulin, and life-time administration of insulin is required for treatment of this disease (1). Although accumulating knowledge has contributed greatly to our understanding of the autoimmune pathogenesis of T1D, the precise causes remain unclear. It has been generally appreciated that autoimmune diseases arise from the breakdown of immune tolerance (2, 3). A number of studies found the massive infiltration of CD8+ T cells into the pancreases of newly diagnosed T1D patients whereas the number of CD4+ T cells was greatly reduced (4, 5). Infiltrated CD8+ T cells are pathogenic to the islets, can cause the destruction of pancreatic β cells, and ultimately reduce the secretion of insulin. Currently, there is no definitive treatment for controlling blood glucose level in T1D except durable insulin therapy. As a result, generation and transplantation of exogenous β cells to replace dead or dysfunctional endogenous β cells are considered as a promising strategy for controlling blood glucose level in patients with T1D. However, since the autoimmune disease is a continuous process, after β cell transplantation, diabetes may develop and progress again through destruction of the pancreatic islets by pathogenic T cells. Therefore, β cell transplantation might not be a long-lasting solution for the control of blood glucose level in T1D. Over the past several years, there has been an increasing interest in Tregs, which play a fundamental role in controlling various autoimmune responses. Numerous preclinical studies suggest that adoptive transfer of Tregs can prevent or cure T cell–mediated autoimmune diseases, such as T1D and arthritis (6, 7). There are several advantages of the Treg adoptive transfer over conventional treatments. These advantages include (a) the potential of antigen (Ag) specificity without general immunosuppression; (b) the option of inducing “physiological” long-lasting regulation in vivo; and (c) the possibility of Treg-based immunotherapy as a customized or personally designed agent for each patient, with reduced side effects (8, 9). It is now generally believed that adoptive transfer of in vitro–generated Tregs can reduce the hazards of complicated surgical events throughout the life. However, the use of Tregs has been complicated due to difficulties in expanding and characterizing this minor subset of T cells. Here, we report the development of a robust technique for producing a large amount of autoantigen-specific Tregs from induced pluripotent stem cells (iPSCs), i.e., iPSC-Tregs that retain all the quintessential characteristics of this T cell subset, including expressions of CD25, CTLA-4, and FoxP3 and production of IL-10. We show that adoptive transfer of these autoantigen-specific iPSC-Tregs significantly reduces the high ratio of CD8+ to CD4+ T cells in the pancreases of diabetic mice and markedly decreases the expression of intracellular adhesion molecule-1 (ICAM-1) in the pancreases of prediabetic and diabetic mice. These results demonstrate the great potential of stem cell–derived autoantigen-specific Tregs in T1D immunotherapy. Moreover, we show that the stem cell–derived tissue-associated Tregs control autoimmune diabetes via preventing the ICAM-1–mediated migration of pathogenic CD8+ T cells in the pancreas and suppressing the production of proinflammatory cytokine IFN-γ. Results Characterization of autoantigen-specific naturally occurring Treg–like iPSC-Tregs. Although FoxP3 is a master regulator and a specific molecular marker for naturally occurring Tregs (nTregs), there is evidence that FoxP3 expression is not a distinct and reliable marker or a sole regulator of functionally stable Tregs. In addition, recent evidence showed that various transcription factors are critical for the development of FoxP3+ Tregs, including Nr4a1, Ikzf4, Tnfrsf18, and Tbx21 (10). These genes, which are substantially expressed in nTregs, are essential for regulating Treg transcriptional programs and maintaining the lineage stability in Tregs. We previously showed the generation of functional Ag-specific iPSC-Tregs, which had the ability to suppress the development of autoimmune arthritis after adoptive transfer in murine models (11, 12). Because the iPSC-Tregs are retrovirally transduced with FoxP3 and TCR genes and have a similar phenotype to iPSC-Tregs in expression of IL-10 and TGF-β, we examined the Treg signature genes in the autoantigen-specific iPSC-Tregs. We adoptively transferred Rag 1–/– mice with pre-iPSC-Tregs that had been cocultured with OP9-DL1/DL4/I-Ab cells for 7 days. Six weeks later, mice were sacrificed and their spleens and lymph nodes (LNs) were removed for the isolation of CD4+CD25+ cells. Conversely, CD4+CD25+ cells were sorted from the spleens and LNs of normal C57BL/6 mice. RT-PCR analysis of the Treg signature genes showed that there were no significant differences between the mice in gene expression of the transcription factors (Nr4a1, Il2ra, Ikzf4, Tnfrsf18, and Bcl6) involved in the regulation of Treg functions (all P > 0.05, Figure 1). Collectively, these results and suggest that the autoantigen-specific iPSC-Tregs are nTreg-like suppressive cells. Figure 1 Characterization of autoantigen-specific nTreg-like iPSC-Tregs. PCR analysis was performed by TaqMan real-time PCR. Primers for sequences were used as follows: (A) Nr4a1, forward 5′-TGTGAGGGCTGCAAGGGCTTC-3′, reverse 5′-AAGCGGCAGAACTGGCAGCGG-3′; (B) Il2ra, forward 5′-AACTGCCAGTGCACCAGCAAC-3′, reverse 5′ GAGGTGGCTCCCTGCAGTGAC-3′; (C) Ikzf4, forward 5′-CAATCTGCTTCGCCACATCAAG-3′, reverse 5′-GCCACAGTAGTTGCACTTGTAG-3′; (D) Tbx21, forward 5′-GGAGCCCACTGGATGCGCCAG-3′, reverse 5′ AGGCAGCCTCTGGCTCTCCATC-3′, Tnfrsf18, forward 5′-CCTGCCAACCAGGCCAGAGGG-3′, reverse 5′-GTCCAAAGTCTGCAGTGACCG-3′; and (E) Bcl6, forward 5′-CACACCCGTCCATCATTGAA-3′, reverse 5′-TGTCCTCACGGTGCCTTTTT-3′. Data shown are representative of 3 identical experiments. The values represent mean ± SEM (n = 3). ns, P > 0.05, Student’s 1-tailed t test. Accumulation of activated CD8+ T cells in autoantigen-expressing pancreases of diabetic mice. To show the expression of autoantigen in the pancreases of double-Tg mice (B6-mOVA with OT-I), we performed immunofluorescence examination. The results showed the expression of OVA autoantigen in the double-Tg mice but not in the B6 or OT-I control mice (Figure 2A). Because the OVA-specific CD8+ T cells have the ability to migrate into the pancreases of the F1 generation that results from crossing B6 mOVA with OT-I TCR Tg mice and to cause destruction of the islets, we examined the fate of OVA-specific CD8+ T cells in vivo (Figure 2B). The migrations of CD8+ T cells in diabetic mice were further confirmed by flow cytometry in which more numbers of both CD8+ and TCRVβ5+ cells were present in diabetic mice (Figure 2C). In F1 mice after vaccinia virus (VACV) infection (Supplemental Figure 3; supplemental material available online with this article; https://doi.org/10.1172/jci.insight.126471DS1), the draining LNs and spleens of the F1 mice were analyzed for the presence of OT-I CD8+ T cells. The proportions of OVA-specific CD8+ cells among the total CD8+ cells in the pancreatic LNs were significantly higher than in the pyloric, mesenteric, inguinal, cervical, or splenic LNs. No apparent accumulation or homing was observed in the non-Tg control B6 mice (Figure 2D). Additionally, all F1 mice after VACV infection developed autoimmune diabetes at age of 9 weeks, which was confirmed by the measurement of blood sugar (Figure 2E). These results verify that autoantigen-specific CD8+ T cells are the main pathogenic immune cells that induce autoimmune diabetes in the murine model. Figure 2 Accumulation of activated CD8+ T cells in autoantigen-expressing pancreases in diabetic mice. Pancreases were isolated from B6-mOVA × OT-I TCR double-Tg mice and B6 mice at 9 weeks of age, including 1 week in which mice were challenged with vaccinia viruses expressing OVA (VACV-OVA). (A) Detection of OVA expression by immunohistochemically staining. OVA expression (arrow) is indicated (original magnification, ×200). Data are representative of 5 mice per group in 3 independent experiments. Scale bar: 20.1 μm. (B) CD8+ T cell infiltration in the pancreas. CD8+ T cells (arrow) are indicated. Data are representative of 5 mice per group in 3 independent experiments. Scale bar: 20.1 μm. (C) OVA-specific CD8+ T cells in the pancreas. OVA-specific TCRVβ5 was analyzed by flow cytometry, after gating on CD8+ populations from the pancreas. Data shown are representative of 3 independent experiments (P < 0.001, Student’s 1-tailed t test). (D) Summarized analyses of OVA-specific CD8+ T cells in various locations. Data shown are representative of 5 mice per group in 3 independent experiments. Data shown are representative of 3 individual experiments. The values represent mean ± SD. **P < 0.01; ns, P > 0.05, multiple Student’s 1-tailed t test. (E) Blood glucose measurement. Data shown are representative of 3 individual experiments (n = 5). The values represent mean ± SD. **P < 0.01, Student’s 1-tailed t test. In vivo specificity of nTreg-like autoantigen-specific iPSC-Tregs. To exert their suppressive effects, Tregs need to migrate to specific tissues or organs, and this requires Ag specificity (8). We and others have previously reported that Tregs are detected within inflamed tissues and transplanted grafts, suggesting that these Tregs could control effector T cells in the peripheral tissues at sites of ongoing immune responses (12–14). Tregs may block the pathogenic cells from filling up their appropriate niche by taking up the space. The Treg population was reduced in autoimmune prone animals and patients, and Tregs were defective in NOD mice (15). In this study, we observed that mice receiving autoantigen OVA-specific iPSC-Tregs maintained a high population of both CD4+ and FoxP3+ cells in the pancreas, as compared with diabetic mice receiving control cells (iPSC-derived cells with empty vector) or nontissue-associated SM1-specific iPSC-Tregs by immunofluorescence examination (Figure 3A) and by flow cytometric analysis (90.1% vs. 12.5% or 16.8% at week 13, Figure 3B). These results suggest that the autoantigen-specific iPSC-Tregs are organ/tissue-associated nTreg-like suppressive cells. Figure 3 Accumulation of autoantigen-specific iPSC-Tregs in the pancreases of diabetic mice following adoptive transfer. B6-mOVA Tg × OT-I TCR double-Tg mice were immunized with VACV-OVA. At week 10, control cells or OVA- or SM1-specific pre-iPSC-Tregs were transferred into diabetic mice. Before or after the cell transfer, mice were sacrificed and their pancreases were isolated for analysis of CD4 and FoxP3. (A) Immunohistology at week 13 (original magnification, ×200). Scale bar: 20.1 μm. (B) Flow cytometric analysis at week 10 (before the cell transfer), 13, and 16. Data are representative of 5 mice per group in 3 independent experiments. Autoantigen-specific iPSC-Tregs can prevent destruction of pancreaticβcells and reduce autoimmune diabetes. Next, we injected diabetic mice with autoantigen-specific iPSC-Tregs. Two weeks after the cell transfer, blood glucose levels were measured. This cell transfer with autoantigen OVA-specific iPSC-Tregs but not control cells or nontissue-associated SM1-specific iPSC-Tregs significantly reduced blood glucose level with urine discharge in all of the diabetic mice (P < 0.0001, Figure 4A and Supplemental Figure 3). T1D develops due to the destructive autoreactive immune response in which CD8+ T cells play a critical role. CD8+ T cells infiltrated into the pancreatic islets of the T1D patients at both initial and final destructive phases of autoimmune β cells attack (16). The blood glucose level was increased because of the destruction of β cells in the islets by pathogenic CD8+ T cells in the diabetic pancreas, which was evidenced in the above mouse diabetic model. More CD8+ T cells were accumulated in the pancreases of mice receiving control cells or nontissue-associated Ag-specific iPSC-Tregs than autoantigen-specific iPSC-Tregs by immunofluorescence examination (Figure 4B) and by flow cytometric analysis (49.8% or 46.1% vs. 6.5%, Figure 4C). Only mice receiving autoantigen-specific iPSC-Tregs had a significantly reduced percentage of incidence of diabetes (P < 0.001, Figure 4D). A large number of inflammatory cells had infiltrated into the pancreases of mice receiving control cells, whereas the infiltration was substantially reduced in mice receiving autoantigen-specific iPSC-Tregs, as shown by H&E staining (Figure 4E). The total number of the islets was also reduced in mice receiving control cells as compared with autoantigen-specific iPSC-Tregs (P < 0.01 or P < 0.001, Figure 4F). To detect the destruction of β cells in the islets of diabetic mice, we stained pancreases with insulin. The islets were reduced in size and number in mice receiving control cells, whereas mice receiving autoantigen-specific iPSC-Tregs were protected from the destruction, by immunofluorescence examination (Figure 4G). The islets were partially destructed by pathogenic CD8+ T cells, which caused the increase of blood sugar and developed autoimmune diabetes, but some insulin+ staining in diabetic mice was still present. Collectively, these results indicate that autoantigen-specific iPSC-Tregs are specific and effective in protecting the hosts from islet destruction and in promoting insulin secretion to prevent the mice from diabetes mellitus. Figure 4 Prevention of destruction of pancreatic β cells and suppression of autoimmune diabetes by autoantigen-specific iPSCs-Tregs. Control cells or pre-iPSC-Tregs were adoptively transferred into diabetic mice, as described in Figure 3. (A) Blood sugar measurement at various weeks. Data shown are representative of 5 mice per group in 3 independent experiments. **P < 0.001; ***P < 0.0001, 2-way ANOVA analysis. (B) Immunofluorescence detection of pathogenic immune cells. Mice were sacrificed and pancreases were isolated for immunohistochemistry staining with CD8+ T cells (original magnification, ×200). Scale bar: 20.1 μm. Data are representative of 5 mice per group in 3 independent experiments. (C) Flow cytometric analysis of pathogenic immune cells. Pancreatic lymph nodes (LNs) were isolated, and single-cell suspensions were prepared for OVA-specific CD8+ TCRVβ5+ staining and analyzed by flow cytometry. Data shown are representative of 3 identical experiments (P < 0.001, Student’s 1-tailed t test). (D) Percentage of incidence of diabetes at week 22. Data shown are representative of 5 mice per group in 3 independent experiments. The values represent mean ± SD. **P < 0.001; ***P < 0.001, 1-way ANOVA analysis. (E) Representative photomicrographs (H&E staining) of the islet inflammation (original magnification, ×200). Scale bar: 20.4 μm. Cellular infiltrations (arrow) are indicated. Data are representative of 5 mice per group in 3 independent experiments. (F) Islet count from sections of 5 individual pancreases in each group. Data are represented as the mean ± SD of 3 independent experiments (***P < 0.001, 1-way ANOVA analysis). (G) Representative photomicrographs (immunofluorescence staining) of islet destruction (original magnification, ×200). Scale bar: 20.1 μm. Insulin-producing cells (arrow) are indicated. Data are representative of 5 mice per group in 3 independent experiments. Autoantigen-specific iPSC-Tregs can decrease the expression of ICAM-1. A number of mononuclear cells, including macrophages and CD4+ T cells, were found to be initially predominant in the autoimmune process taking place in T1D (17, 18). In autoimmune diabetes, these cells played an important role in the early infiltrating process and were shown to express ICAM-1, which served to bind to lymphocytes and possibly to monocytes and polymorphonuclear leukocytes (19). The infiltrated ICAM-1 can promote the release of several cytokines that modulate the expression of the adhesion molecules, thus increasing the adhesion of leukocytes and other autoreactive T cells (20). These autoreactive T cells, after migrating into the pancreas, start to destroy β cells. We thus examined the expression of ICAM-1 in the pancreases. The high expression of ICAM-1 in the pancreases of the diabetic mice, which was undetectable in the normal pancreases, was significantly reduced in diabetic mice receiving autoantigen-specific iPSC-Tregs but not other control cells (Figure 5, A and B). In addition, the high expression of ICAM-1 on the effector CD4+ T cells in the pancreases of the diabetic mice receiving control cells (84.4% or 78.9%), which was undetectable in the normal pancreases (0.35%), was markedly reduced in those of mice receiving autoantigen-specific iPSC-Tregs (18.4%) (Figure 5C). In addition, the expression of ICAM-1 on CD11b+ cells in the pancreases of diabetic mice receiving control cells (15.64% or 12.83%), which was at a low level in the normal pancreases (4.89%), was considerably reduced in those of mice receiving autoantigen-specific iPSC-Tregs (5.68%) (Figure 5D). Because CD11b is expressed on the surface of various leukocytes, including monocytes/macrophages, granulocytes, neutrophils, NK cells, and dendritic cells, the reduction of CD11b+ICAM-1+ cells indicated the inhibition of leukocyte adhesion and migration to mediate the inflammatory response. Taken together, these results suggest that the autoantigen-specific iPSC-Tregs can reduce the expression of ICAM-1 in diabetic mice, inhibit the migration of autoreactive CD8+ T cells into the pancreas, and, ultimately, protect the pancreatic β cells from destruction. Figure 5 Reduction of ICAM-1 expression in the diabetic pancreas by autoantigen-specific iPSC-Tregs. Mice were sacrificed 4 weeks after adoptive cell transfer, and the pancreases were isolated from nondiabetic, diabetic (cell transfer control), and diabetic (Ag-specific iPSC-Treg transfer) mice. Samples were prepared for immunohistochemistry staining. (A) ICAM-1+ zones (arrow) are indicated (original magnification, ×200). Data are representative of 5 mice per group in 3 independent experiments. (B) Quantification of ICAM-1 expression from sections of 5 individual pancreases in each group. Data are represented as the mean ± SD from 3 independent experiments (**P < 0.01; ***P < 0.001, 1-way ANOVA). (C and D) Flow cytometry analysis of ICAM-1 expression in pancreatic CD4+ T or CD11b+ cells. The pancreatic lymph nodes (LNs) were isolated, and single-cell suspensions were prepared for ICAM-1 staining on CD4+ or CD11b+ cells and analyzed by flow cytometry. Data shown are representative of 3 identical experiments. Autoantigen-specific iPSC-Tregs can migrate to the pancreas and produce a large amount of suppressive cytokines. In BDC2.5/NOD mice, FoxP3 was highly expressed in insulitic lesions where the function was impaired due to alterations in their gene expression profile (21, 22). We previously showed that the iPSC-Tregs exhibited a similar expression of Treg signature genes and produced IL-10 and TGF-β (12). In the current study, we observed very few numbers of FoxP3-expressing T cells in the pancreases of diabetic mice, and these cells did not secret IL-10 and TGF-β, which are the two key cytokines that are the hallmark for functional Tregs and secreted by activated and functional Tregs. We further showed that the pancreatic CD4+ T cells from mice receiving autoantigen-specific iPSC-Tregs produced substantially more IL-10 (66.1% vs. 12.9% or 15.1%) and TGF-β (5.61% vs. 0.62% or 1.68%), as compared with those from mice receiving control cells (Figure 6). These results support the assumption that autoantigen-specific iPSC-Tregs accumulating in the pancreas can secrete large amounts of suppressive cytokines (IL-10 and TGF-β), reduce the expression of ICAM-1, and prevent the migration of pathogenic CD8+ T cells into the pancreas, thus protecting the pancreas from destruction. Figure 6 Induction of IL-10 and TGF-β by autoantigen-specific iPSC-Tregs. Mice were sacrificed 4 weeks after adoptive cell transfer, and single-cell suspension was prepared from the pancreatic lymph nodes (LNs). Cells were stimulated with plate-coated CD3 and soluble CD28 antibodies and then stained with CD4, TGF-β, and IL-10. The CD4 population was gated, and the production of TGF-β and IL-10 was analyzed. Data shown are representative of 3 identical experiments. Autoantigen-specific iPSC-Tregs can decrease the production of IFN-γby pathogenic immune cells in the diabetic pancreatic islets. Treatment of NOD mice with an anti-IFN-γ monoclonal antibody could block diabetes (23); conversely, overproduction of IFN-γ in pancreatic islets provoked the disease (24). We next determined the secretion of IFN-γ in the diabetic islet. We found more IFN-γ–producing pancreatic CD8 and CD4 T cells in mice receiving control cells (31.4% and 30.4% or 29.7% and 28.6%); by contrast, both of the IFN-γ–producing pancreatic CD8 and CD4 T cells were significantly reduced in mice receiving autoantigen-specific iPSC-Tregs (14.6% and 10.9%) (Figure 7). These results indicate that the autoantigen-specific iPSC-Tregs can protect the islets from destruction by suppressing the secretion of IFN-γ produced by the pathogenic immune cells. Figure 7 Downregulation of IFN-γ by autoantigen-specific iPSC-Tregs in the diabetic pancreatic islets. Mice were sacrificed 4 weeks after adoptive cell transfer, and single cell suspension was prepared from the pancreatic lymph nodes (LNs). Cells were stimulated with plate-coated CD3 and soluble CD28 antibodies, and then stained with CD4, CD8, and IFN-γ for flow cytometric analysis. (A) IFN-γ production in CD4+ or CD8+ population. Data shown are the representative of 3 identical experiments. (B) Quantification of IFN-γ production. Data shown are representative of 3 identical experiments (**P < 0.01; ***P < 0.001, 1-way ANOVA). Discussion We and others have previously reported that adoptive transfer of stem cells has or stem cell–derived Tregs has the ability to suppress the development of autoimmunity in various animal models (11, 12, 25, 26). However, the suppressive mechanisms behind this suppression remain to be fully defined. By investigating the adoptive transfer of autoantigen-specific iPSC-Tregs in a murine model of T1D, we demonstrate that adoptive transfer significantly reduced the high ratio of CD8+ to CD4+ T cells in the pancreases of diabetic mice. We also show a critical role of this transfer in reducing the expression of ICAM-1 in inflamed pancreatic tissues and preventing the accumulation of pathogenic CD8+ T cells in the pancreases and diabetic pathogenesis. We further demonstrate that autoantigen-specific iPSC-Tregs associated with inflamed tissue and protected the islets from destruction through suppressing the production of proinflammatory cytokine IFN-γ. These findings may help us better understand the pathogenesis of autoimmunity in T1D and provide a foundation for therapeutic use of the stem cell–derived tissue-associated Tregs in the treatment of T1D (27). Among animal models of autoimmune diabetes, the NOD mouse is a widely used animal of autoimmune T cell–mediated T1D (spontaneously nonobese diabetic). The NOD mouse model clearly shows the leukocytic infiltration into the pancreatic islets (insulitis) and autoimmune destruction of the pancreatic β cell in female mice (2–4 weeks), which occurs later in male mice (5–7 weeks). Insulitis in NOD mice shows a combination of T cells (both CD4+ and CD8+), B cells (28), and inconstant numbers of macrophages/dendritic cells. In addition, a dominant-negative mutation in the mouse insulin 2 gene (Ins2Akita) produces a severe insulin deficiency syndrome exclusive of autoimmune participation and various transgenes overexpressed in β cells. Moreover, pharmacologically induced T1D (without autoimmunity) by alloxan or streptozotocin produces hyperglycemia in most strains of mice. Several low doses of streptozotocin combing direct β cell toxicity with local inflammation also elicit T1D in a male sex-specific fashion (29). To determine the suppressive mechanisms of stem cell–derived tissue-associated Tregs, we employed a mouse model of T1D by crossing B6-mOVA Tg mice with OT-I TCR Tg mice. Around 8 weeks of age, blood glucose levels were measured in F1 mice. Approximately 20%–40% of the mice were found to be diabetic; one potential explanation for this occurrence is that the OT-I CD8+ T cells may be tolerated during T cell development in the thymuses of F1 mice. As we propose in our model in which mice will develop autoimmune diabetes due to a large amount and the autoreactivity of CD8+ T cells, we activated tissue-associated CD8+ T cells by inoculating VACV-OVA into the mice in which the viruses-induced CD8+ T cells became highly polyfunctional (30). All mice developed diabetes with high blood glucose levels (Supplemental Figure 3) and more urine discharge, for which mice needed additional animal care. In this mouse model of T1D, OVA protein serves as inflamed tissue–associated autoantigen and is highly expressed in the pancreas. OVA-specific CD8+ T cells act as central pathogenic immune cells that accumulate in the pancreas and cause pancreatic β cell destruction and T1D (Figure 2). In addition, in this mouse model of T1D, we observed a non-OVA-specific CD4+ population existing in the pancreas (Figure 3), and these CD4+ T cells produced IFN-γ (Figure 7), which might also involve to the disease pathogenesis. These FoxP3–CD4+ T cells in the pancreas were TCRVα2–/Vβ5–, indicating that T cell activation was not through OVA-specific TCR. Of note, the number of these effector CD4+ T cells was dramatically reduced in mice receiving OVA-specific but not SM1-specific iPSC-Tregs (Supplemental Figure 4). These results also indicate that tissue-associated (OVA-specific) iPSC-Tregs are more effective than nontissue-associated (SM1-specific) iPSC-Tregs. Because of the challenge of VACV-OVA, these non-OVA-specific CD4+ T cells mainly originating from the RIP-mOVA descent may undergo bystander activation (31, 32). However, addition studies are needed on the pathways leading to bystander T cell activation under the condition. Tregs are an important component of self-tolerance, and numerous studies have demonstrated the effects of Tregs on natural and induced autoimmune diseases in various mouse models (33, 34). Targeting Tregs as a treatment for autoimmune disorders is an attractive approach, as there is an emerging consensus that many patients suffering from autoimmune disease have dysfunctional Tregs (35, 36). Given the manageability of murine models, the evidence for Tregs in control of autoimmune diseases has recently become clearer, particularly as a therapeutic intervention. In well-established models of rheumatoid arthritis (37), multiple sclerosis (38), and systemic lupus erythematosus (39), adoptive transfer of polyclonal Tregs could prevent or slow disease progression when administered prior to disease occurrence. In multiple sclerosis, Ag-specific Tregs targeting the disease-associated Ags were highly efficacious in reverting the ongoing disease (8, 40). Specifically, the nonobese T1D NOD.Cd28–/– mouse model deficient in Tregs developed diabetes at an accelerated rate as compared with NOD mice. Injection of NOD Tregs into NOD.Cd28–/– mice could delay and, in some cases, prevent the development of diabetes (41). In the current study, we have confirmed that adoptive transfer of stem cell–derived autoantigen-specific Tregs but not control cells, nonspecific iPSC-Tregs, or nontissue-associated Ag-specific iPSC-Tregs caused a high level of accumulation of these cells in the pancreas and reversed the disease process of autoimmune diabetes in the mouse model of T1D that was caused by pathogenic CD8+ T cells (Figure 4 and Supplemental Figure 3). A small number of Ag-specific iPSC-Tregs was observed in LNs and spleen (Supplemental Figure 5). A possible working mechanism of stem cell–derived autoantigen-specific Tregs is mediated through the secretion of large amounts of suppressive cytokines (e.g., IL-10 and TGF-β) that were identified (Figure 6). Of note, Ag-specific iPSC-Tregs have a functional stability for which we had previously demonstrated in an autoimmune condition (12), and FoxP3 expression in these cells persisted for 6 weeks after adoptive transfer in the diabetic mice (Figure 3). We further show that ICAM-1 (also known as CD54), a member of the Ig-like superfamily of adhesion proteins, plays a critical role in the accumulation of the pathogenic CD8+ T cells in the pancreases of the mice with autoimmune diabetes. ICAM-1 is a cell surface glycoprotein expressed in endothelial cells and some immune cells. ICAM-1 expressed in diabetic pancreatic tissues can bind to integrins of type CD11a/CD18 or CD11b/CD18 on pathogenic CD8+ T cells, and this binding facilitates the accumulation of pathogenic CD8+ T cells in the panaceas. The expression of ICAM-1 in the pancreases of diabetic mice is much higher than that in normal mice. In contrast, in the pancreases of diabetic mice, the adoptive transfer of autoantigen-specific iPSC-Tregs can dramatically reduce the expression of ICAM-1. This cell transfer can also reduce the accumulation of autoreactive CD8+ T cells in the pancreases and eventually protect the pancreatic β cells from further devastation (Figure 5). This conclusion is in line with those of previous studies showing that the expression of ICAM-1 is critical for the development of experimental autoimmune encephalomyelitis (42, 43). The role of IFN-γ, a prototypical Th1 cytokine, has been appreciated in the development of T1D, because the treatment of NOD mice with an anti-IFN-γ monoclonal antibody prevented the development of the autoimmune diabetes (23, 24). We detected an elevated amount of IFN-γ in both effector CD8 and CD4 T cells of the diabetic islets and showed that adoptive transfer of stem cell–derived autoantigen-specific Tregs markedly decreased the production of the proinflammatory cytokine in the pathogenic T cells. We demonstrated that the autoantigen-specific iPSC-Tregs protected the islets from mass destruction via suppressing the production of pathogenic IFN-γ (Figure 7). As other proinflammatory cytokines, such as IL-21 (44), IL-17 (45), TNF-α (46), and IL-1β (47) also play roles in the pathogenesis of T1D, studies on these proinflammatory cytokines would be needed to better exploit the stem cell–derived tissue-associated Tregs as a therapeutic approach against autoimmune disorders. The Tg model used in this study highly expressed OVA as surrogate autoantigen and received approximately 2 million of OVA-specific iPSC-Tregs for the treatment, which may be much higher than in the clinical setting with diverse low-abundance target peptides. However, the understanding of islet Ags has previously resulted in translation into new strategies by targeting tissue-specific immune interventions to prevent disease progression as well as to reverse T1D. A big advantage of our approach is the development of large numbers of autoantigen-specific nTreg-like suppressive cells (Figure 1 and Supplemental Figures 1 and 2), which can accumulate in the inflamed tissues and suppress local pathogenic immune cells. In addition, the stem cell–derived Tregs maintain stability for up to 3 months (11, 12), because the overexpression of FoxP3 has the ability to suppress the potential switch of Tregs to Th17 cells. Of note, the selection of optimal autoantigens for the development of tissue-associated Tregs is critical for the success of the Treg-based T1D immunotherapy. Taken together, the current study provides insight into the mechanisms by which stem cell–derived tissue-associated Tregs suppress autoimmunity in T1D and suggests that stem cell–derived autoantigen-specific Tregs have a great potential to be adapted as an immunotherapy for T1D. Methods Cell lines and mice. The mouse iPS-MEF-Ng-20D-17 cell line was obtained from the RIKEN Cell Bank (48). The OP9-DL1/DL4/I-Ab cell line was generated by a retroviral transduction of the OP9 cells (12). The SNL76/7 cell line (ATCC SCRC-1049) was purchased from ATCC. C57BL/6 (B6), Rag1–/–, B6 mOVA RIP (RIP-mOVA) Tg, and OT-I TCR Tg mice were purchased from The Jackson Laboratory. Cell culture. iPSCs were maintained on feeder layers of irradiated SNL76/7 cells in 6-well culture plates (Nunc) and were passaged every 3 days (48). Retroviral transduction and generation of OVA-specific iPSC-Tregs. cDNA for FoxP3 with OVA 322–339 (ISQAVHAAHAEINEAGR)-specific I-Ab-restricted TCR genes (Vα2 and Vβ5; obtained from Dario A. Vignali, University of Pittsburgh, Pittsburgh, Pennsylvania, USA) or LCMV (SMARTA1; SM1) gp61 (GLKGPDIYKGVYQFKSVEFD)-specific I-Ab-restricted TCR genes (Vα2 and Vβ8; obtained from Matthew A. Williams, University of Utah, Salt Lake City, Utah, USA) was used for retroviral transduction of mouse iPSCs and the generation of OVA- or SM1-specific iPSC-Tregs (12). Antibodies. PE-, PE/Cy7-, Alexa Fluor 647–, APC-, or APC/Cy7-conjugated anti-mouse TCRVβ5 (MR9-4), CD4 (GK1.5), CD11b (M1/70), TGF-β1 (TW7-16B4), and FoxP3 (MF-14) were obtained from Biolegend. FITC- or PE-conjugated anti-mouse CD8 (6A242) was obtained from Santa Cruz Biotechnology. APC-conjugated IL-10 (JES5-16E3) was purchased from BD Biosciences. Rabbit insulin antibody (C27C9; 3014) was purchased from Cell Signaling and anti-ICAM1 (YN1/1.7.4; ab25375) antibody was obtained from Abcam. Flow cytometric analysis. T cells from the pancreatic LNs were collected and intracellular IL-10 and TGF-β were analyzed by flow cytometry after gating on live CD4+ or CD8+ cells. RT-PCR. MiDR OTII 2A FoxP3-transduced mouse iPSCs were cocultured with OP9-DL1-DL4-I-Ab in the presence of mFlt-3L for 7 days. Differentiated iPSCs were separated and adoptively transferred into Rag1–/– mice. Mice were housed for 6 weeks for in vivo maturation of the iPSC-Tregs. Six weeks later, spleens and LNs were collected from normal B6 mice and cell transferred Rag1–/– mice. CD4+CD25+ cells were sorted and total RNA was extracted from sorted cells using QIAgen RNeasy mini kits. Samples were subjected to reverse transcription using a high-capacity cDNA synthesis kit (Applied Biosystems). PCR analysis was performed by TaqMan real-time PCR (Thermo Fisher Scientific). Ex vivo stimulation assay. Mice were sacrificed 4 weeks after adoptive cell transfer and single-cell suspension was then prepared from the pancreatic LNs. Cells were stimulated with plate-coated CD3 plus soluble CD28 antibodies. Productions of IL-10 and TGF-β were determined by intracellular cytokine staining (12). Murine autoimmune diabetes model. Autoimmune diabetes was induced in F1 mice that were crossed between RIP-mOVA Tg with OT-I TCR Tg mice by i.p. injection with VACV-OVA (2 × 10⁶ PFU/mouse) (49). All of the mice developed diabetes after viral injection. Blood glucose was measured 1 week after the VACV-OVA injection. Blood glucose measurement. Blood glucose levels were determined using a Glucometer Ascensia Elite XL (Bayer). Six hundred milligrams per deciliter is the maximum measurable glucose reading. Mice were typically considered diabetic with readings of >250 mg/dl. Adoptive cell transfer. B6-mOVA Tg × OT-I TCR double-Tg mice (F1) were immunized with VACV-OVA for 1 week. At week 10, OVA-specific pre-iPSC-Tregs or iPSC-derived control cells (3 × 10⁶) were i.v. transferred into diabetic mice. Four to six weeks later, mice were euthanized, and the pancreatic tissues were removed for histopathological examination. Histology and immunohistochemistry. For H&E staining, pancreatic tissues were fixed with 10% neutral formalin solution (VWR), and the fixed samples were prepared and stained as described previously (48). For immunofluorescent microscopy, the pancreatic tissues were frozen in cryovials on dry ice immediately after resection. Cryosectioning and immunofluorescent staining were performed as described previously (48). Statistics. Multiple Student’s 1-tailed t test or 1-way ANOVA or 2-way ANOVA analysis was performed to analyze the differences between the groups, using GraphPad Prism. A P value of less than 0.05 was considered significant. Study approval. The present studies in mice were reviewed and approved by The Texas A&M University Animal Care Committee and were in accordance with the guidelines of the Association for the Assessment and Accreditation of Laboratory Animal Care. Author contributions JS and JMY designed the experiments, analyzed data, and contributed to the writing of the paper. MH, FL, and JKD performed the experiments. DF and SSA provided reagents in the animal model. XX and XR analyzed data. Supplemental material View Supplemental data Acknowledgments JS is the guarantor of this work and, as such, had full access to all the data in the study and takes responsibility for the integrity of the data and the accuracy of the data analysis. This work was supported by National Institutes of Health grants R01AI121180, R01CA221867, and R21AI109239 and the American Diabetes Association (1-16-IBS-281 to JS). Footnotes Conflict of interest: The authors have declared that no conflict of interest exists. Copyright: © 2019 American Society for Clinical Investigation Reference information: JCI Insight. 2019;4(7):e126471. https://doi.org/10.1172/jci.insight.126471. References Delovitch TL, Singh B. The nonobese diabetic mouse as a model of autoimmune diabetes: immune dysregulation gets the NOD. Immunity. 1997;7(6):727–738. View this article via: PubMed CrossRef Google Scholar Hori S, Nomura T, Sakaguchi S. Control of regulatory T cell development by the transcription factor Foxp3. Science. 2003;299(5609):1057–1061. View this article via: PubMed CrossRef Google Scholar Hänninen A, Jalkanen S, Salmi M, Toikkanen S, Nikolakaros G, Simell O. Macrophages, T cell receptor usage, and endothelial cell activation in the pancreas at the onset of insulin-dependent diabetes mellitus. J Clin Invest. 1992;90(5):1901–1910. View this article via: JCI PubMed CrossRef Google Scholar Shull MM, et al. Targeted disruption of the mouse transforming growth factor-beta 1 gene results in multifocal inflammatory disease. Nature. 1992;359(6397):693–699. View this article via: PubMed CrossRef Google Scholar Bottazzo GF, Dean BM, McNally JM, MacKay EH, Swift PG, Gamble DR. In situ characterization of autoimmune phenomena and expression of HLA molecules in the pancreas in diabetic insulitis. N Engl J Med. 1985;313(6):353–360. View this article via: PubMed CrossRef Google Scholar Sakaguchi S, Miyara M, Costantino CM, Hafler DA. FOXP3+ regulatory T cells in the human immune system. Nat Rev Immunol. 2010;10(7):490–500. View this article via: PubMed CrossRef Google Scholar Roncarolo MG, Battaglia M. Regulatory T-cell immunotherapy for tolerance to self antigens and alloantigens in humans. Nat Rev Immunol. 2007;7(8):585–598. View this article via: PubMed CrossRef Google Scholar Tang Q, et al. In vitro-expanded antigen-specific regulatory T cells suppress autoimmune diabetes. J Exp Med. 2004;199(11):1455–1465. View this article via: PubMed CrossRef Google Scholar Wright GP, Ehrenstein MR, Stauss HJ. Regulatory T-cell adoptive immunotherapy: potential for treatment of autoimmunity. Expert Rev Clin Immunol. 2011;7(2):213–225. View this article via: PubMed CrossRef Google Scholar Sekiya T, et al. Nr4a receptors are essential for thymic regulatory T cell development and immune homeostasis. Nat Immunol. 2013;14(3):230–237. View this article via: PubMed CrossRef Google Scholar Haque R, et al. Programming of regulatory T cells from pluripotent stem cells and prevention of autoimmunity. J Immunol. 2012;189(3):1228–1236. View this article via: PubMed CrossRef Google Scholar Haque M, et al. Stem cell-derived tissue-associated regulatory T cells ameliorate the development of autoimmunity. Sci Rep. 2016;6:20588. View this article via: PubMed Google Scholar Belkaid Y, Piccirillo CA, Mendez S, Shevach EM, Sacks DL. CD4+CD25+ regulatory T cells control Leishmania major persistence and immunity. Nature. 2002;420(6915):502–507. View this article via: PubMed CrossRef Google Scholar Lee I, Wang L, Wells AD, Dorf ME, Ozkaynak E, Hancock WW. Recruitment of Foxp3+ T regulatory cells mediating allograft tolerance depends on the CCR4 chemokine receptor. J Exp Med. 2005;201(7):1037–1044. View this article via: PubMed CrossRef Google Scholar Kukreja A, et al. Multiple immuno-regulatory defects in type-1 diabetes. J Clin Invest. 2002;109(1):131–140. View this article via: JCI PubMed CrossRef Google Scholar Coppieters KT, et al. Demonstration of islet-autoreactive CD8 T cells in insulitic lesions from recent onset and long-term type 1 diabetes patients. J Exp Med. 2012;209(1):51–60. View this article via: PubMed CrossRef Google Scholar Ihm SH, Yoon JW. Studies on autoimmunity for initiation of beta-cell destruction. VI. Macrophages essential for development of beta-cell-specific cytotoxic effectors and insulitis in NOD mice. Diabetes. 1990;39(10):1273–1278. View this article via: PubMed Google Scholar Lee KU, Amano K, Yoon JW. Evidence for initial involvement of macrophage in development of insulitis in NOD mice. Diabetes. 1988;37(7):989–991. View this article via: PubMed Google Scholar Calderon B, Carrero JA, Miller MJ, Unanue ER. Entry of diabetogenic T cells into islets induces changes that lead to amplification of the cellular response. Proc Natl Acad Sci USA. 2011;108(4):1567–1572. View this article via: PubMed CrossRef Google Scholar Pober JS, et al. Activation of cultured human endothelial cells by recombinant lymphotoxin: comparison with tumor necrosis factor and interleukin 1 species. J Immunol. 1987;138(10):3319–3324. View this article via: PubMed Google Scholar Herman AE, Freeman GJ, Mathis D, Benoist C. CD4+CD25+ T regulatory cells dependent on ICOS promote regulation of effector cells in the prediabetic lesion. J Exp Med. 2004;199(11):1479–1489. View this article via: PubMed CrossRef Google Scholar Chen Z, Herman AE, Matos M, Mathis D, Benoist C. Where CD4+CD25+ T reg cells impinge on autoimmune diabetes. J Exp Med. 2005;202(10):1387–1397. View this article via: PubMed CrossRef Google Scholar Campbell IL, Kay TW, Oxbrow L, Harrison LC. Essential role for interferon-gamma and interleukin-6 in autoimmune insulin-dependent diabetes in NOD/Wehi mice. J Clin Invest. 1991;87(2):739–742. View this article via: JCI PubMed CrossRef Google Scholar Sarvetnick N, Liggitt D, Pitts SL, Hansen SE, Stewart TA. Insulin-dependent diabetes mellitus induced in transgenic mice by ectopic expression of class II MHC and interferon-gamma. Cell. 1988;52(5):773–782. View this article via: PubMed CrossRef Google Scholar Ben Nasr M, et al. PD-L1 genetic overexpression or pharmacological restoration in hematopoietic stem and progenitor cells reverses autoimmune diabetes. Sci Transl Med. 2017;9(416):eaam7543. View this article via: PubMed CrossRef Google Scholar Ben Nasr M, et al. The use of hematopoietic stem cells in autoimmune diseases. Regen Med. 2016;11(4):395–405. View this article via: PubMed CrossRef Google Scholar Ben Nasr M, Frumento D, Fiorina P. Adipose stem cell therapy for chronic pancreatitis. Mol Ther. 2017;25(11):2438–2439. View this article via: PubMed CrossRef Google Scholar Fiorina P, et al. Targeting CD22 reprograms B-cells and reverses autoimmune diabetes. Diabetes. 2008;57(11):3013–3024. View this article via: PubMed CrossRef Google Scholar Leiter EH, Schile A. Genetic and pharmacologic models for type 1 diabetes. Curr Protoc Mouse Biol. 2013;3(1):9–19. View this article via: PubMed CrossRef Google Scholar Precopio ML, et al. Immunization with vaccinia virus induces polyfunctional and phenotypically distinctive CD8(+) T cell responses. J Exp Med. 2007;204(6):1405–1416. View this article via: PubMed CrossRef Google Scholar Di Genova G, Savelyeva N, Suchacki A, Thirdborough SM, Stevenson FK. Bystander stimulation of activated CD4+ T cells of unrelated specificity following a booster vaccination with tetanus toxoid. Eur J Immunol. 2010;40(4):976–985. View this article via: PubMed CrossRef Google Scholar Whiteside SK, et al. IL-10 Deficiency reveals a role for TLR2-dependent bystander activation of T cells in lyme arthritis. J Immunol. 2018;200(4):1457–1470. View this article via: PubMed CrossRef Google Scholar Sakaguchi S. Naturally arising Foxp3-expressing CD25+CD4+ regulatory T cells in immunological tolerance to self and non-self. Nat Immunol. 2005;6(4):345–352. View this article via: PubMed CrossRef Google Scholar Chatenoud L, Salomon B, Bluestone JA. Suppressor T cells--they’re back and critical for regulation of autoimmunity! Immunol Rev. 2001;182:149–163. View this article via: PubMed CrossRef Google Scholar Ehrenstein MR, et al. Compromised function of regulatory T cells in rheumatoid arthritis and reversal by anti-TNFalpha therapy. J Exp Med. 2004;200(3):277–285. View this article via: PubMed CrossRef Google Scholar Huan J, et al. Decreased FOXP3 levels in multiple sclerosis patients. J Neurosci Res. 2005;81(1):45–52. View this article via: PubMed CrossRef Google Scholar Morgan ME, et al. Effective treatment of collagen-induced arthritis by adoptive transfer of CD25+ regulatory T cells. Arthritis Rheum. 2005;52(7):2212–2221. View this article via: PubMed CrossRef Google Scholar Kohm AP, Carpentier PA, Anger HA, Miller SD. Cutting edge: CD4+CD25+ regulatory T cells suppress antigen-specific autoreactive immune responses and central nervous system inflammation during active experimental autoimmune encephalomyelitis. J Immunol. 2002;169(9):4712–4716. View this article via: PubMed CrossRef Google Scholar Scalapino KJ, Tang Q, Bluestone JA, Bonyhadi ML, Daikh DI. Suppression of disease in New Zealand Black/New Zealand White lupus-prone mice by adoptive transfer of ex vivo expanded regulatory T cells. J Immunol. 2006;177(3):1451–1459. View this article via: PubMed CrossRef Google Scholar Tarbell KV, Yamazaki S, Olson K, Toy P, Steinman RM. CD25+ CD4+ T cells, expanded with dendritic cells presenting a single autoantigenic peptide, suppress autoimmune diabetes. J Exp Med. 2004;199(11):1467–1477. View this article via: PubMed CrossRef Google Scholar Salomon B, et al. B7/CD28 costimulation is essential for the homeostasis of the CD4+CD25+ immunoregulatory T cells that control autoimmune diabetes. Immunity. 2000;12(4):431–440. View this article via: PubMed CrossRef Google Scholar Bullard DC, Hu X, Crawford D, McDonald K, Ramos TN, Barnum SR. Expression of a single ICAM-1 isoform on T cells is sufficient for development of experimental autoimmune encephalomyelitis. Eur J Immunol. 2014;44(4):1194–1199. View this article via: PubMed CrossRef Google Scholar Bullard DC, Hu X, Schoeb TR, Collins RG, Beaudet AL, Barnum SR. Intercellular adhesion molecule-1 expression is required on multiple cell types for the development of experimental autoimmune encephalomyelitis. J Immunol. 2007;178(2):851–857. View this article via: PubMed CrossRef Google Scholar Korn T, et al. IL-21 initiates an alternative pathway to induce proinflammatory T(H)17 cells. Nature. 2007;448(7152):484–487. View this article via: PubMed CrossRef Google Scholar Honkanen J, et al. IL-17 immunity in human type 1 diabetes. J Immunol. 2010;185(3):1959–1967. View this article via: PubMed CrossRef Google Scholar Arif S, et al. Peripheral and islet interleukin-17 pathway activation characterizes human autoimmune diabetes and promotes cytokine-mediated β-cell death. Diabetes. 2011;60(8):2112–2119. View this article via: PubMed CrossRef Google Scholar Ablamunits V, et al. Synergistic reversal of type 1 diabetes in NOD mice with anti-CD3 and interleukin-1 blockade: evidence of improved immune regulation. Diabetes. 2012;61(1):145–154. View this article via: PubMed CrossRef Google Scholar Lei F, et al. In vivo programming of tumor antigen-specific T lymphocytes from pluripotent stem cells to promote cancer immunosurveillance. Cancer Res. 2011;71(14):4742–4747. View this article via: PubMed CrossRef Google Scholar Haque M, et al. C-Myc regulation by costimulatory signals modulates the generation of CD8+ memory T cells during viral infection. Open Biol. 2016;6(1):150208. View this article via: PubMed CrossRef Google Scholar Version history Version 1 (February 19, 2019): In-Press Preview Version 2 (April 4, 2019): Electronic publication
|
|
Scooped by
Gilbert C FAURE
March 12, 2019 9:07 AM
|
Summary Immune metabolism is a rapidly moving field. While most of the research has been conducted to define the metabolism of healthy immune cells in the mouse, it is recognized that the overactive immune system that drives autoimmune diseases presents metabolic abnormalities that provide therapeutic opportunities, as well as a means to understand the fundamental mechanisms of autoimmune activation more clearly. Here, we review recent publications that have reported how the major metabolic pathways are affected in autoimmune diseases, with a focus on rheumatic diseases. Introduction The connection between cellular metabolism and immune activation was first established when it was shown that activation of T cells through the engagement of the co‐stimulatory receptor CD28 triggered glycolysis through the phosphoinositide‐3‐kinase (PI3K) pathway 1 (Fig. 1). A few years later, it was shown that the ligation of the B cell receptor activated the same pathway, and that glycolysis was required for B cell activation and differentiation 2 (Fig. 2). The next decade has seen an explosive growth of research in immunometabolism that has defined nutrient utilization and cellular processes to sustain the unique energy biosynthetic needs of immune cells to achieve rapid growth and to perform effector functions upon challenge with pathogens 3. While most of the research has characterized the metabolism of healthy immune cells, it has been rapidly recognized that the overactive immune system that drives autoimmune diseases presents metabolic abnormalities that provide therapeutic opportunities 4, 5. Exploiting the intricately dysregulated metabolic networks in cancer is being considered to develop therapeutic approaches that would either starve tumor cells or boost the immune system 6, 7. Reviews have been recently published focusing on rheumatic diseases 8, rheumatoid arthritis (RA) 9 and systemic lupus erythematosus (SLE) 10, two autoimmune diseases for which the field of immunometabolism is the most advanced. Here, we review recent publications that have reported how the major metabolic pathways are affected in autoimmune diseases, with a focus on rheumatic diseases. The yin and yang regulation of autoimmunity by MTOR and AMPK Mammalian target of rapamycin (mTOR) and AMP‐activated protein kinase (AMPK) are metabolic sensors that play a major role in immune cell functions 11. Activated AMPK inhibits adenosine triphosphate (ATP)‐consuming processes, such as protein synthesis while enhancing ATP‐producing processes, such as fatty acid oxidation (FAO) and glucose uptake 12. Activated AMPK inhibits mTOR activation, which promotes energy‐consuming processes. mTOR signaling is mediated by two multimeric complexes, mTOR complex 1 (mTORC1) and mTORC2, which share the catalytic subunit mTOR but are distinguished by the scaffold proteins regulatory‐associated protein of mTOR (RAPTOR) and rapamycin‐insensitive companion of mammalian target of rapamycin (RICTOR), respectively. Activation of both complexes promote glucose metabolism, linking mTORC and glycolysis. Direct modulation of glucose metabolism through over‐expression of glucose transporter 1 (Glut1) enhances follicular helper T (Tfh) cell differentiation and leads to autoimmunity 13. mTOR activation promotes the differentiation of T helper type 1 (Th1), Th17 14 and Tfh T cells 13, three effector subsets that are expanded in lupus 15, 16. mTOR activation plays a more complex role in regulatory T cell (Treg) differentiation and function by preventing the generation of long‐lived central Tregs, but promoting the generation of effector Tregs 17. Treg‐specific deletion of mTOR reduced their frequency, leading to spontaneous effector T cell activation and inflammation 18. Deletion of Lkb1 in Tregs, the upstream kinase of AMPK and a well‐known sensor of metabolic stress, resulted in dysfunctional Tregs and the development of a Th2‐dominant severe autoimmune phenotype 19, 20. Deletion of PP2A in Tregs, a serine‐threonine phosphatase involved in the development SLE by regulating the production of interleukin (IL)‐2 and IL‐17 in CD4+ T cells 21, resulted in increased mTORC1 activation and a severe, multi‐organ autoimmune disorder 22. These results indicated that while mTOR activity is required for Treg development and function, its level of activation has to be kept in check by protein phosphatase 2 (PP2A), and possibly other mechanisms. The function and differentiation of follicular regulatory T cells (Tfr), a Treg subset that suppresses germinal center (GC) B cells and Tfh cells, is also mTORC1‐dependent 23. These results suggest that T cell differentiation of most T cell subsets is mTOR‐dependent and aberrant expression of mTOR might lead to autoimmunity. CD4+ T cells from lupus patients present a high level of mTOR activation that is directly implicated in the disease process 24. Indeed, treatment with sirolimus, an mTOR inhibitor, reduced disease activity in refractory lupus patients 25. Intriguingly, the therapeutic response in these patients was best associated with a reduced number of effector memory CD8+ T cells, a subset whose role in lupus pathogenesis is as yet undefined. Tfh cells in the B6.Sle1.Sle2.Sle3 (TC) model of lupus show a high level of mTORC1 activation, which was reduced by the inhibition of glucose metabolism 26. This reduction was associated with a decreased frequency of Tfh cells, GC B cells and autoantibody production. This effectively linked glycolysis, mTORC1 activation and Tfh expansion in lupus. mTOR also plays an essential role in B cell differentiation. In the Roquin mouse model of lupus, activation of AMPK and inhibition of mTOR limited B cell differentiation into GC B and plasma cells, which was associated with a reduced disease activity 27. In SLE patients, high mTOR activation in CD19+ B cells correlates with plasmablast numbers and disease activity 28 (Fig. 2). Conversely, treatment with metformin, which activates AMPK 29, has beneficial effects in lupus patients 30 and in mouse models of lupus 31, 32. Overall, these studies showed that mTOR plays a central role in lupus by affecting multiple cell types. However, these findings should not be generalized to other autoimmune diseases without further studies, in which the AMPK/mTOR pathway has not been explored in detail. Glycolysis Glycolysis refers to the metabolic pathway by which glucose is metabolized. The first common phase of glycolysis is the production of pyruvate. Pyruvate is then either oxidized in the Krebs cycle, leading to the production of up to 38 molecules of ATP per molecule of glucose, or reduced into lactate in either hypoxic conditions or when metabolite intermediates are needed over ATP production, which in this case is limited to two molecules. Glycolysis commonly refers to this lactate end‐point branch of glycolysis, while the other is referred to as glucose oxidative or mitochondrial metabolism. Activation of CD4+ T cells from lupus‐prone mice and SLE patients occurs with high levels of oxygen consumption and oxidation 31, 33. Lupus T cells also display a high level of glycolysis 31, with oxidation representing a major part of glucose utilization 32. Glucose transporters provide the ‘primary first step’ of glycolysis by importing glucose into the cell. The major glucose transporter expressed by T cells is Glut1, which is significantly up‐regulated upon T cell receptor and co‐stimulator CD28 signaling 34. Over‐expression of Glut1 in mice led to the accumulation of activated CD4+ T cells, the production of autoantibodies and a modest immune complex deposition in the glomeruli of aged mice 35. Furthermore, these mice showed increased Tfh and GC B cell numbers, with elevated IL‐21 and immunoglobulin (Ig)A production 13. The combination of 2‐deoxy‐D‐glucose (2DG), a glycolysis inhibitor, and metformin, which inhibits complex I of the mitochondrial electron transport chain 36, reversed lupus pathogenesis in mice 31. While treatment with either metformin or 2DG alone could prevent the development of the disease 32, these results indicate that targeting cellular metabolism could be a potential therapy for lupus and other autoimmune diseases 37. Among the subsets of T cells, Tfh cells from lupus mice are highly glycolytic (Fig. 1), and their expansion as well as that of GC B cells was abrogated by 2DG treatment 26. This glycolytic requirement is restricted to autoreactive Tfh cells, as Tfh cells induced by immunization with a nominal antigen or by infection with influenza virus were not affected by 2DG 26. This suggests that the metabolic requirements of autoreactive CD4+ T cells are unique, which may provide a window of opportunity for their selective elimination. The expansion of Tfh cells was also kept in check by 2DG in the K/BXN model of RA, which indicated that the high glucose requirement of autoreactive Tfh cells is not model‐dependent 38. 2DG‐treated K/BXN mice also showed a reduced disease severity, in association with a decreased T and B cell metabolism and a reduced activation of both adaptive and innate immune cells 38. In the same RA model, reducing glycolysis by targeting hexokinase (HK) showed beneficial effects by decreasing the activation of fibroblast‐like synoviocytes 39. Contrary to murine RA T cells and synoviocytes, glycolysis is reduced in the CD4+ T cells from RA patients, which develop a hyper‐reduced state due to an over‐active pentose phosphate pathway (PPP) 40. The pathogenicity of these T cells can be reduced by diverting the glucose flux away from PPP 41 or with oxidative agents 42. Lactate accumulation has been reported in the synovia of RA patients, which may be secondary to the hypoxic conditions in the inflamed joint. The excess is responsible for the ‘entrapment’ of CD4+ and CD8+ T cells. The expression of lactate transporters on these cells correlates with the clinical T cell score in the synovia of RA patients. Lactate directly inhibits CD4+ T cell motility by interfering with glycolysis activated upon engagement of the chemokine receptor C‐X‐C motif chemokine receptor 3 (CXCR3) with C‐X‐C motif chemokine ligand 10 (CXCL10) 43. These results suggest that blocking lactate production in the RA joint may decrease T cell infiltrates and present therapeutic benefits. Pyruvate dehydrogenase (PDH) promotes the oxidative phosphorylation of pyruvate over the lactate glycolytic pathway. Pyruvate dehydrogenase phosphatase catalytic subunit 2 (PDP2) converts the inactive PDH to its active form. PDP2 expression was decreased in memory Th17 cells from patients with SLE and forced expression of PDP2 in CD4+ T cells from lupus‐prone MRL/lpr mice and patients with SLE‐suppressed Th17 differentiation. This may be due at least partly to the direct control of energy production by the transcription factor‐inducible cAMP early repressor/cAMP response element modulator (ICER/CREM) at the PDH metabolism bifurcation level 44. These results are consistent with the glycolytic requirements of Th17 cells 45 and the expansion of Th17 cells in SLE patients 15. Finally, dimethyl fumarate, a derivative of the Krebs cycle intermediate fumarate that inactivates glyceraldehyde 3‐phosphate dehydrogenase (GAPDH) and therefore inhibits both branches of glycolysis, altered the differentiation and function of Th1 and Th17 cells, attenuating disease in the experimental autoimmune encephalomyelitis (EAE) model of multiple sclerosis 46, stressing again the potentials of glucose metabolic inhibitors to target pathogenic autoreactive T cells. HIF1α, a transcription factor that controls the cellular response to hypoxia, activates the glycolytic pathway and, as such, promotes inflammation 47. HIF1α expression is required for the differentiation of Th17 cells 45, a T cell subset expanded in many autoimmune and inflammatory diseases. Mice with a B cell‐specific deletion of HIF1α have reduced numbers of IL‐10‐producing B cells, which exacerbate collagen‐induced arthritis and EAE 48. HIF1α‐inhibitor echinomycin reduced Th1 and Th17 responses, and attenuated a mouse model of acute graft‐versus‐host disease 49. Moreover, hypoxia induced HIF1α expression as well as signal transducer and activator of transcription (STAT)‐1 and STAT‐3 activation in human RA‐fibroblast‐like synoviocytes (FLS). STAT‐3 knock‐down inhibited HIF1α expression and the hypoxia‐induced cell invasion, migration and cytokine production, indicating a functional link between HIF1α and STAT‐3 in the regulation of proinflammatory mechanisms in RA 50. Prolyl hydroxylase domain (PHD) are enzymes that regulate HIFα levels by promoting its degradation. PHD‐2 is the major hydroxylase regulating HIF levels and the expression of angiogenic genes in RA‐FLS, illustrating the major role played by hypoxia in the RA joint 51. Finally, knocking down HIF1α in myeloid cells ameliorated induced colitis 52. Taken together, targeting glycolysis directly and indirectly may present promising therapeutic venues to treat autoimmune diseases; however, detailed disease‐specific analyses of preclinical models are necessary to understand the cellular targets and specific pathways in glucose flux that are responsible for pathogenesis. Oxidative phosphorylation and fatty acid oxidation In order to produce ATP, enzymes in the electron transport chain (ETC) transfer electrons from donor metabolites to electron acceptors. This is known as oxidative phosphorylation (OXPHOS) 53. In this process, complex I of the ETC, nicotinamide adenine dinucleotide hydrogenase (NADH), oxidizes NADH to nicotinamide adenine dinucleotide (NAD) 54. Succinate dehydrogenase, complex II, oxidizes succinate to fumarate, reducing ubiquinone 55. Ubiquinone is then oxidized by complex III, cytochrome c reductase, which reduces cytochrome c allowing for its oxidation by complex IV, cytochrome oxidase 56, 57. Thus, the design of OXPHOS is to produce ATP by the oxidation and reduction of key metabolites. A number of studies have demonstrated alterations in the OXPHOS and FAO metabolic pathways in autoimmune diseases. As mentioned earlier, T cells from RA patients function in a hyper‐reduced phenotype due to a hyperactive PPP, probably in response to the deficiency of necessary intermediates and the hypoxic environment 5, 9, 58. This is probably a result of oxidative stress from macrophages and other reactive oxygen species (ROS) releasing cells in the symptomatic tissue 59. Contrary to the RA phenotype, SLE T cells are hyper‐oxidative 33. These changes in oxidative profiles may be due in part to genetic predisposition. This hypothesis is supported by the finding that the murine lupus risk allele Esrrg encodes for a nuclear receptor, estrogen‐related receptor gamma (ERRγ), which regulates mitochondrial function and OXPHOS 60. Directly relevant to lupus, type 1 interferon (IFN) induces OXPHOS and FAO in plasmacytoid dendritic cells (pDCs), and this metabolic reprogramming is critical for their activation and amplification of IFN production 61. B cells and other myeloid cells are less well metabolically characterized, and it is not understood if these cell types also have altered OXPHOS or FAO metabolism in autoimmune disease 62. Notably, long‐lived plasma cells, which are a critical component of many antibody‐mediated autoimmune diseases, require mitochondrial import of pyruvate 63. A recent study utilizing several mice models of lupus nephritis demonstrated that kidney‐infiltrating T cells (KITs) present an exhausted phenotype similar to that observed in tumor‐infiltrating lymphocytes 64. Both CD4+ and CD8+ KITs demonstrated substantial loss of their spare respiratory capacity and little to no oxidative phosphorylation. The significance of this finding remains unclear, as CD4+ T cell infiltrates have been associated with lupus nephritis in mouse models 65, 66 and patients 67, 68. Another unexpected finding was the identification of C1q, a member of the complement pathway involved in efferocytosis, as a modulator of mitochondrial metabolism in CD8+ T cells in the chronic graft‐versus‐host‐disease (cGVHD)‐induced model of SLE 69. C1q‐deficiency reduced cGVHD induction and, mechanistically, resulted in the reduction of mitochondrial function in effector memory CD8+ T cells (Fig. 1). These results indicated a novel link between C1q, mitochondrial metabolism and CD8+ T cell effector functions in autoimmunity. OXPHOS may also play an important role in the pathogenesis of RA, according to a recent study showing that the Krebs cycle metabolite succinate is under‐utilized in the adjuvant‐induced arthritis (AIA) model of RA, possibly leading to increased joint inflammation 70. Suncr1, the cognate receptor succinate receptor 1, is an active participant in the innate immune response 71-73, and increased amounts of succinate correlate with disease in AIA 70, 72. Accordingly, Suncr1 deficiency reduced the expansion of pathogenic Th17 cells and AIA severity 70. Succinate is largely used by OXPHOS, which has a reduced activity in the T cells of RA patients and in other autoimmune diseases 74. This reduced OXPHOS probably results in an under‐utilization of succinate which would, in turn, create a microenvironment that increases disease activity. A recent study found, in a small subset of CD4+CXCR3+CXCR5–PD‐1hi, T cells in the blood of SLE patients who have increased ROS due to reverse ETC regulated by succinate 75. These cells provide help to B cells via IL‐10 and succinate, independently of IL‐21. These studies emphasize the importance of the metabolite succinate in rheumatic diseases. Itaconate inhibits succinate dehydrogenase, regulating succinate oxidation to fumarate. Itaconate is one of the most highly produced metabolites in lipopolysaccharide (LPS)‐activated macrophages, in which it has anti‐inflammatory effects 76. Mechanistically, itaconate derivatives can regulate nuclear factor kappa B inhibitor zeta (IκBζ) via activating transcription factor 3 (ATF3), ameliorating IL‐17 IκBζ‐driven inflammation 76. Another study identified that activation of nuclear factor‐like 2 (Nrf2) via Kelch‐like ECH‐associated protein 1 (KEAP1) alkylation could explain the anti‐inflammatory effects exhibited by itaconate 77. Further, cell‐permeable itaconate derivatives decreased cytokine production in macrophages and limited the type I IFN response, indicating a possible therapeutic use for itaconate and its derivatives in IFN‐driven diseases such as SLE 77, 78. FAO represents a major energy source for Treg and memory T cells 79, although a genetic rather than a pharmacological approach has recently challenged this tenet 80. The contribution to FAO to autoimmune diseases has not been well characterized. Elevated levels of adipocyte‐fatty acid binding protein (FABP), which is responsible for facilitating the transport of fatty acids to specific organelles for oxidation, correlate with disease activity in patients with multiple sclerosis (MS) and clinical isolated syndrome 81. Inhibition of FABP prevented EAE in mice 82, providing a possible treatment option to correct this specific metabolic defect that is contributing to immune cell dysfunction in MS‐related diseases. Finally, D‐mannose was found to induce Treg differentiation and decrease the production of inflammatory cytokines, indicating that D‐mannose has the potential to improve autoimmune pathology 83. Mechanistically, D‐mannose promotes transforming growth factor (TGF)‐β production, which is mediated at least in part through ROS produced by increased FAO, an indirect consequence of the inhibitory effect of D‐mannose on glycolysis 83. This study illustrates the complex relationships that exist between metabolic networks and their consequences on immune activation. Finally, glycolysis is required by Treg cells to migrate to the site of inflammation 84. Mechanistically, PI3K‐mTORC2 activation in Treg cells induces the expression of glycokinase, which binds actin and promotes the cytoskeletal remodeling that is necessary for cell migration. This latter finding emphasizes that specific metabolic pathways sustain different aspects of immune function. Branch chain amino acid and glutamine metabolism Amino acids are metabolites used for the biosynthesis of lipids, nucleotides, glutathione, glucosamine and polyamines, as well as in the anaplerosis of the Krebs cycle 85. Moreover, branch chain amino acids (BCAA) and glutamine function as signaling molecules of the cellular metabolic state to activate mTORC1 86. Here, we will focus on BCAAs, especially leucine and glutamine metabolism. The potential contribution of leucine metabolism to autoimmune diseases is largely attributed to its role as a critical checkpoint of mTORC1 signaling and glycolysis, which then control the function of T cells and monocytes/macrophages 87-89. Leucine influx is mediated by solute carrier family 7 member 5 (SLC7A5). Intracellular leucine undergoes reversible transamination by branched‐chain aminotransferase (BCAT) to form α‐ketoisocaproate, which is further metabolized into acetoacetate, then acetyl‐co‐enzyme A (CoA), to be subsequently oxidized in the Krebs cycle. BCAT exists in two isoforms, mitochondrial BCAT2 and cytosolic BCAT1. In human monocyte‐derived macrophages, BCAT1 is the most abundantly expressed BCAT isoform 90. Circulating monocytes from RA patients express higher SLC7A5 levels than cells from healthy controls, and these levels correlate with clinical parameters. Furthermore, blockade of SLC7A5 reduced IL‐1β production in these monocytes 87. Treatment with a selective inhibitor of BCAT1 reduced inflammation and macrophage infiltration in target organs in murine models of RA and crescentic glomerulonephritis 90. Glutamine (Gln) uptake is mediated by ASCT2/SLC1A5. It is converted to glutamate by glutaminase (GLS), followed by the conversion to α‐ketoglutaric acid (αKG) by transaminases or glutamate dehydrogenase 1 (GLUD1), after which αKG enters the Krebs cycle. Isocitrate dehydrogenase (IDH1 and IDH2) produce (D)‐2‐hydroxyglutarate (2HG) from αKG. In the SKG zymosan‐induced model of RA, the proliferation of RA‐FLS was decreased by glutamine but not glucose deprivation 91. Furthermore, Gls1 expression was higher in RA‐FLS than in osteoarthritis‐derived FLS. Accordingly, the administration of a Gls1 inhibitor ameliorated disease symptoms by suppressing FLS proliferation. Similarly, blocking glutaminolysis with the Gls1 inhibitor BPTES [bis‐2‐(5‐phenylactamido‐1,2,4‐thiadiazol‐2‐yl)ethyl sulfide] 92 or with the transaminase inhibitor aminooxyacetic acid (AOA) 93 prevented disease in the EAE model. The regulation of the balance between Th17 and Treg differentiation may underline the role of glutaminolysis in the pathogenesis of autoimmune diseases. Indeed, glutaminolysis is a major source of energy for the generation of Th17 cells 6. Gln deprivation led to the differentiation of activated naïve CD4+ T cells 6 and Th1‐polarized cells 94 into Treg cells. Gln transporter deficiency or depletion of Gln in culture media inhibited both Th1 and Th17 differentiation 95, but blocking the conversion of Gln to glutamate preferentially suppressed Th17 over other T cell subsets 6, 92. Blocking glutamate oxaloacetate transaminase 1 (Got1) also altered the balance between Th17 and Treg cells without affecting Th1 cells 93. However, Gls1 inhibition did not alter the number of Th17 cells and decreased the number of Treg cells in SKG mice 91. The reason for these discrepancies is as yet unclear, but it may include differences between healthy versus inflammatory or autoimmune strains. It may also be due to the role of some metabolic enzymes or metabolites in non‐metabolic pathways. The latter includes a greater accumulation of 2‐hydroxyglutarate (2‐HG) in differentiating Th17 than Treg cells, which promotes the methylation of the Foxp3 locus and silences its expression 91. Limiting glutamate production reversed this process and ameliorated EAE disease by expanding Treg and reducing Th17 cell numbers 92. This highlights the role of glutamine metabolism in epigenetic regulation in addition to energy production. Finally, the role of glutamine metabolism has been recently examined in Tfh cells in the TC model of SLE. Slc1a5 expression was lower in TC Tfh than in congenic non‐autoimmune B6 Tfh cells 26. Contrary to glycolysis, glutaminolysis inhibition greatly reduced immunization‐induced as well as autoimmune humoral responses. This diminished Tfh function, in both lupus‐prone and non‐autoimmune mice 26, indicating that it required for the development of germinal centers. Lipid synthesis De‐novo FA synthesis starts from the generation of malonyl‐CoA from acetyl‐CoA by the rate‐limiting enzyme acetyl‐CoA carboxylase (ACC1) 96. Subsequent steps and FA elongation require fatty acid synthase (FAS), stearoyl‐CoA desaturase (SCD) and the FA‐co‐enzyme A ligase family to generate diacetyl‐ and triacetyl‐glycerols and long‐chained FA 97. Most of the de‐novo synthesized FA are incorporated into phospholipids for membrane biogenesis and localize to lipid rafts to participate in crucial membrane‐based processes 98, while some form lipid droplets 99. Pathogenic T cells in RA patients are characterized by increased FA synthesis leading to the formation of cytoplasmic lipid droplets. The inhibition of FA synthesis corrected the pro‐arthritogenic tissue‐invasiveness of these T cells 100. FA, in the form of triglycerides, phosphoglycerides or sphingolipids, are directly involved in T cell activation and proliferation as key components of cell membranes, signaling molecules and energy‐yielding substrates. T cell‐specific deletion of ACC1 severely impaired the accumulation of antigen‐specific CD8+ T cell due to activation‐induced cell death. Furthermore, exogenous FA rescued defective blasting and survival of ACC1‐deficient CD8+ T cells in vitro 101. These results may provide insights for therapeutic targets to either increase or decrease CD8+ T cell activity. Th17 cell induction results in increased levels of mRNA and phosphorylated ACC1 and ACC2 proteins. Pharmacological inhibition or T cell‐specific deletion of ACC1 restrained the formation of human and mouse Th17 cells and promoted the induction of Treg cells, which attenuated Th17 cell‐mediated EAE 102. Inhibition of fatty acid synthase (FASN) also reduced EAE severity, with direct evidence from adaptive transfer that this effect is Th17‐dependent. However, FASN inhibition also promoted IFN‐γ production by Th1 and Th1‐like Th17 cells, which is different from the effect of ACC inhibition 103. The specific mechanisms by which FA synthesis regulates CD8+ T cell survival or inflammatory CD4+ T cell polarization have not yet been elucidated. Glycophingolipids (GSLs) are a key constituent of lipid rafts that have been implicated in lupus pathogenesis. CD4+ T cells from SLE patients present elevated GSL levels due to increased synthesis and altered trafficking 104. Normalization of GSL metabolism in these T cells normalized their function. In addition, activated T cells from SLE patients show a reduced induction of BTLA, an inhibitory receptor similar to cytotoxic T lymphocyte antigen (CTLA)‐4 and programmed death 1 (PD1) 105. The capacity of BTLA to restrain T cell activation in SLE is impaired, which could be due to poor BTLA recruitment to the immunological synapse. In support of this hypothesis, a glucosylceramide synthase inhibitor that normalized lipid metabolism restored BTLA inhibition. The dissociation of preclustered T cell receptor (TCR) molecules in the presence of this inhibitor allowed BTLA recruitment to TCR clusters directly linking GSL homeostasis to intracellular trafficking of components of the TCR 105. Cholesterol homeostasis Cholesterol homeostasis is maintained through the sophisticated balance between its synthesis, import and elimination of excessive cholesterol from the cells. Cholesterol is synthesized by endoplasmic reticulum‐bound 3‐hydroxy‐3‐methylglutaryl‐CoA reductase (HMGCR), which is controlled by the transcription factor sterol regulatory element‐binding protein (SREBP) 106. Apolipoprotein E (ApoE) and low‐density lipoprotein receptor (LDLR) contribute to the recycling and intercellular transport of cholesterol. ApoA1 and high‐density lipoproteins (HDL) mediate the efflux of cholesterol from immune cells via liver X receptor (LXR)‐regulated genes, such as ABCA1 and ABCG1. Cholesterol plays a key role in the regulation of immune responses through at least three mechanisms. First, cholesterol is required for membrane synthesis during cell expansion. Secondly, cholesterol is a key constituent of lipid rafts; thus, any changes in cholesterol content modify raft‐dependent signaling of major immune pathways such as Toll‐like receptors (TLRs), major histocompatibility complex (MHC), TCRs and B cell receptors (BCRs) 107-109. Finally, type I IFN reprograms lipid metabolism, including a decreased synthetic and increased import of cholesterol 110. Interestingly, ApoE is bound not only to plasma lipoproteins but is also present on immune cell membranes 111. ApoE deficiency in DCs impaired the removal of cholesterol from the membrane, resulting in lipid raft accumulation, enhanced MHC‐II clustering on the membrane and increased antigen presentation. This, in turn, expanded proinflammatory CD4+ T cells and enhanced skin allograft rejection, independently of dyslipidemia 112. Atherogenic dyslipidemia caused by a Western diet in ApoE or LDLR‐deficient mice increased the production of autoantibodies and the severity of lupus by expanding the number of Tfh cells 113. A novel mechanism was identified by which dyslipidemia induces IL‐27 production by DCs, which in turn expands Tfh cell responses and GC reactions to lupus‐associated self‐antigens 113. The levels of IL‐27 were increased in patients with hypercholesterolemia, while blocking IL‐27 in atherogenic mice reduced autoantibodies and Tfh cells to levels similar to those of control mice. An almost complete absence of HDL due to ApoA1 deletion induced autoimmune phenotypes, characterized by cholesterol‐engorged, enlarged lymph nodes, anti‐dsDNA autoantibodies and increased T cell activation 114, suggesting a link between cellular cholesterol accumulation and autoimmunity. Mice lacking LXRs exhibit an age‐dependent systemic autoimmune disease, and pharmacological activation of LXRs attenuated disease progression in a mouse model of lupus 115. Transcriptional induction of Abca1 expression by LXRs promotes cholesterol efflux and alters plasma membrane cholesterol distribution. Mice with Abca1/g1 deficiency presented lymphadenopathy and glomerulonephritis 116, 117. Interestingly, autoimmune activation in these mice was due to the specific deficiency of these transporters in DCs (Fig. 1). Abca1/g1‐deficient DCs showed an activated inflammasome, increased proliferation and cytokine secretion. These led to the expansion of Th1, Th17 and Tfh cells, GC B cells and plasma cells, all changes which have been implicated in the pathogenesis of SLE 117. Macrophages lacking the ABC transporters Abca1 and Abcg1 showed an increased TLR cell surface expression and enhanced inflammatory responses to LPS 118, while Abcg1‐deficient T cells show enhanced TCR signaling and proliferation 119. None of these studies in macrophages and T cells have reported autoimmune phenotypes. The mechanisms responsible for cell‐specific consequences of cholesterol efflux are not clear at present. Conclusions Immune metabolism is a rapidly moving field. Earlier studies have proposed a simple model in which activated effector immune cells switched from mitochondrial respiration to aerobic glycolysis relying on an increased glucose import 120. More recent studies have demonstrated that glutamine and fatty acid utilization provided additional layers of metabolic reprogramming with functional consequences in immune cells. Additional levels of complexity have been uncovered. Altered metabolic pathways in one immune‐mediated disease cannot be automatically expanded to another immune‐mediated disease, as outlined in this review, with CD4+ T cells in SLE and RA at opposite poles of the oxidation spectrum. Metabolic reprogramming is cell type‐specific; for example, pDC activation by type I IFN relying on FAO instead of glycolysis 61, a process that has not been found in other types of DCs. Some metabolic enzymes may regulate immune function through mechanisms only indirectly linked to metabolism, such as GAPDH regulating IFN‐γ production 121. In addition, some metabolites such as succinate or itaconate show previously unsuspected anti‐inflammatory effects 122. Finally, mitochondria emerge as central players in immune responses, not only through the generation of these metabolite intermediates, but also by regulating ATP and ROS production through the fusion and fission processes, providing a platform for retinoic acid‐inducible gene I protein (RIG‐I) and nucleotide‐binding oligomerization domain‐like receptor family, pyrin domain‐containing‐3 (NRLP‐3) inflammasome signaling. Directly related to autoimmunity, mitochondria are a source of highly immunogenic mitochondrial DNA 123. The majority of these ground‐breaking studies have been conducted in normal mice, with only a few in models of autoimmune diseases, and even fewer in patients with autoimmune diseases as reported in this review. There are, however, reasons to believe that research in immunometabolism will have a significant long‐lasting impact in the field of autoimmunity. First, a clearer understanding of the specific nature of metabolic dysregulation in autoimmunity may provide much‐needed novel mechanistic insights into the nature of autoimmune activation. Secondly, these studies may lead to additional therapeutic tools, either alone or in combination with standard of care approaches. The metabolism of immune cells is already targeted by a drug commonly used by rheumatologists, methotrexate, which interferes with 1‐Carbon metabolism 124. Furthermore, mTOR inhibitors and metformin show promising results in SLE 25, 30. It would also be of great interest to explore the metabolic consequences of current treatments used or tested by rheumatologists to have a clearer understanding of the mechanisms by which drugs or biologics modulate the immune system effectively or not through altered metabolism. Preclinical studies guided by the results obtained in normal mice, as well as in‐depth characterization on the metabolic signatures of effector cells in patients with autoimmune diseases, are urgently needed to make significant strides in this direction. Acknowledgements This publication is supported by grants from the NIH (R01AI045050 and R01 AI128901) and from the Alliance for Lupus Research (TIL‐416522) to L. M. Disclosures None. References
|