Your new post is loading...

|
Scooped by
Gilbert C FAURE
December 27, 2013 5:57 AM
|
Pathology, Diagnosis and Therapy
|
|
Scooped by
Gilbert C FAURE
November 7, 5:28 AM
|
Autoimmune and inflammatory diseases arise from a breakdown of immune tolerance driven by hyperactivation of effector lymphocytes and dysfunction of regulatory T (Treg) cells. Interleukin-2 (IL-2) supports both Treg maintenance and effector cell responses, necessitating careful dose optimization for selective immune regulation.
Here, we report an immunoconjugate strategy that integrates Treg-selective cytokine signaling with localized pharmacological suppression by coupling a site-specifically PEGylated IL-2 variant (Y31-20K) to immunosuppressive small molecules. Through systematic screening, we identify Y31-20K-KU as the lead construct, which restores immune homeostasis in patient-derived lymphocytes and ameliorates pathology in mouse models of chronic colitis and collagen-induced arthritis.
Mechanistically, Y31-20K-KU selectively expands Tregs while concurrently suppressing effector cells and exhibited favorable safety with minimal immunogenicity, thereby overcoming limitations of cytokine- and small-molecule-based monotherapies.
These findings establish IL-2–drug immunoconjugates as a clinically tractable strategy for bidirectional immune modulation, providing a versatile platform for reprogramming cytokine signaling in inflammatory diseases.
Paper and research by @Jing Li and larger team. The excerpt above is from the author's manuscript.
|
|
Scooped by
Gilbert C FAURE
October 15, 11:50 AM
|
🔬 Want to hear about FOXP3 and novel autoimmune diseases treatments from a Nobel Prize, and hear his take on resilience in science?
Dr. Fred Ramsdell, The Nobel Prize Laureate in Physiology or Medicine in 2025, shares not only fascinating insights into his scientific discoveries, but also where he was when he received the life-changing news of the Prize (you won't guess!)🌟
Joining the IUIS Junior Community Leadership Academy #webinar series, Dr. Fred Ramsdell generously shared his time in an engaging Q and A, offering invaluable perspectives.
🎥 Watch this inspiring webinar: https://lnkd.in/eQcH5-pB
#IUIS International Union of Immunological Societies (IUIS) Sociedad Mexicana de Inmunología A. C.#LeadershipAcademy #Immunology #NobelPrize #FOXP3 #EarlyCareerResearchers #ScientificLeadership
|
|
Scooped by
Gilbert C FAURE
October 8, 8:43 AM
|
|
|
Scooped by
Gilbert C FAURE
October 6, 10:25 AM
|
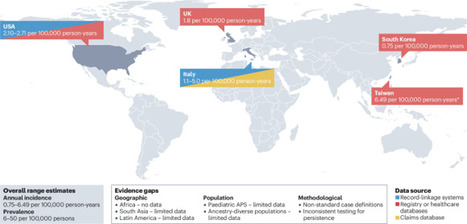
This Review provides a comprehensive overview of available evidence on the epidemiology of antiphospholipid syndrome (APS). The authors highlight the challenges associated with defining APS and its clinical heterogeneity and emphasize key areas that require further research to improve...
|
|
Scooped by
Gilbert C FAURE
August 17, 6:53 AM
|
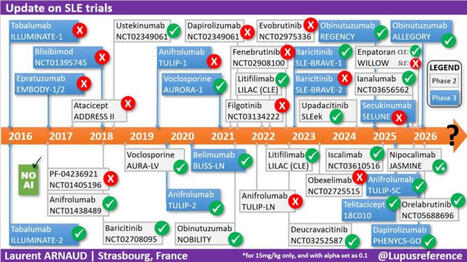
✅ 10 YEARS of RANDOMIZED TRIALS in #LUPUS ⏲️summarized on a single slide!!!! With a specific focus on phase 2(b) and 3 #RCTs, as well as whether the main endpoint was reached or not 👍 The least we can say, is that we have collectively put A LOT OF EFFORT in the development of new treatments 💊 in #SLE. As always I used only my natural intelligence (#NoAI) so please let me know if I have forgotten a trial or if something needs to be corrected.
|
|
Scooped by
Gilbert C FAURE
August 10, 7:36 AM
|
Why "Autoimmune Disease" is a Diagnostic Dead End 🔬
Here is a summary of the main points from the article written by Dr. Kenneth P. Stoller, which discusses his book Incurable Us:
The Main Idea: The author deeply questions the concept of "autoimmune disease." According to him, the idea that the immune system inexplicably turns against its own body is one of the most misleading concepts in modern medicine. The immune system is not the disease; it is merely reacting to a threat.
Key Points of His Argument:
A label born of ignorance: Historically, when medicine failed to find the cause of certain diseases, it ended up grouping them under the "autoimmune" label. The problem with this diagnosis is that it often puts an end to the search for the true cause of the disease.
The wrong medical question: Instead of looking for the root cause by asking, "What is triggering this immune response?", modern medicine has settled for asking, "How do we suppress this response?" (often using immunosuppressants).
Autoantibodies are just a symptom: The author does not deny the existence of autoantibodies or the damage they cause to healthy tissues. However, he asserts that they are proof that a battle is taking place, but do not indicate who started the war. Factors such as a persistent infection, molecular mimicry, or chronic injury can produce these autoantibodies.
The example of Crohn's disease: The article highlights a link between Crohn's disease (often considered autoimmune) and Johne's disease (a known bacterial infection in animals, caused by MAP bacteria). This illustrates his point: what is labeled "autoimmune" often hides an undiagnosed underlying infection.
In Conclusion: This reflection, which is at the heart of his book Incurable Us, calls for a medical paradigm shift: we must stop blaming the patients' immune systems and start hunting down the true external and infectious causes of these complex diseases again.
To read the article: https://lnkd.in/g2hSWvqg
Short video: https://lnkd.in/gGqWcsdV
#medicine #health #disease #autoimmune #diagnostics #IncurableUs #curable #kennethpstoller #docstoller
|
|
Scooped by
Gilbert C FAURE
August 4, 10:55 AM
|
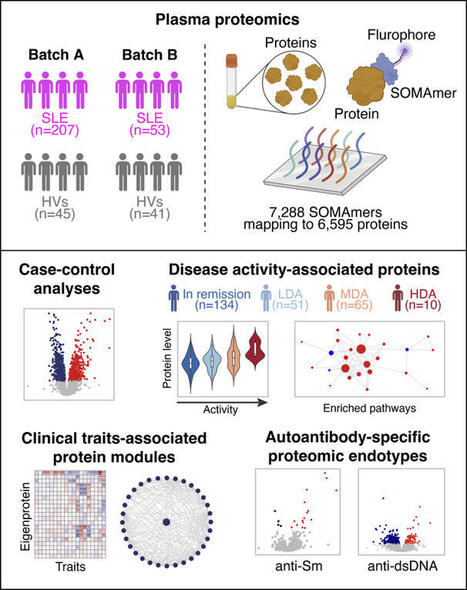
Plasma proteomic profiles of SLE. We recruited 268 patients with SLE and 86 HVs. The cohort encompassed a wide range of disease duration and disease activity (Table 1). Positivity for autoantibodies was as follows: anti-dsDNA n = 70 patients (28%), anti-Sm n = 63 (24.6%), anti-Ro60 n = 120...
|
|
Scooped by
Gilbert C FAURE
June 28, 4:46 AM
|
Wonderful news!
Five lupus patients in England are in remission after being treated with a revolutionary therapy that genetically modifies their own cells, in a medical breakthrough that could offer people a cure, doctors have said.
CAR (chimeric antigen receptor) T-cell therapy involves removing a type of white blood cell also called T lymphocytes, which are crucial for hunting out infected or damaged cells, and engineering them to spot and destroy disease. The T-cells are then fed back into the patient via an infusion to reset their immune system.
The therapy is already revolutionising cancer treatment. Now medics in London have successfully used the technique to effectively cure five NHS patients with severe lupus aged between 19 and 50.
CAR T-cell therapy, which patients only need to have once, could transform lupus treatment and remove the need for lifelong medication, doctors said.
|
|
Scooped by
Gilbert C FAURE
June 19, 1:19 PM
|
Sjögren’s Syndrome (SjS) has historically been associated with classical anti-Ro60/SSA, Ro52/SSA and La/SSB, however they are lacking in one third of the patients, which induces delays in diagnosis, and their disease-contributing role is debated. Here we have applied a SjS-tailored Systems Serology approach to a cohort of 58 SjS and 16 non-SjS sicca syndrome patients, and 40 healthy individuals, involving a multiplex assay measuring antibody isotype, subclass, Fc Receptor and complement engagement to 14 SjS-related autoantigens, an antibody-glycosylation profiling assay and a phagocytosis cell-based assay. Via a machine learning approach, we have identified unique autoantibody signatures, including classical and non-classical autoantigens-related features especially involving autoantigen-specific Fc Receptor binding, with apparent functional consequences. These findings provide interesting insights into the autoantibody responses in SjS, possibly paving the way for improved diagnostics, especially in difficult-to-diagnose patients (e.g., seronegative SjS and non-SjS sicca syndrome patients), and novel therapeutic options targeting autoantibody-specific Fc/Fc Receptor-related effector functions.
|
|
Scooped by
Gilbert C FAURE
June 8, 4:10 AM
|
🎾 Dimanche, Alexander Zverev a soulevé la Coupe des Mousquetaires 🏆.
Ce que les caméras n’ont pas filmé, c’est le deuxième match qu’il jouait en même temps. Celui contre sa propre glycémie.
Zverev est diabétique de type 1 depuis l’âge de 3 ans et demi. Une maladie auto-immune qui détruit les cellules du pancréas produisant l’insuline.
Résultat : son corps n’en fabrique plus une seule goutte. Sans injection, ce n’est pas une gêne,c’est un pronostic vital engagé.
Alors imaginez gérer cela pendant une finale de plus de 4 heures.
L’effort prolongé fait chuter la glycémie : le muscle consomme le glucose, la sensibilité à l’insuline grimpe. Mais le stress, l’adrénaline et le cortisol de la compétition la font, eux, remonter. Ajoutez la chaleur de juin sur l’ocre parisienne, qui accélère l’absorption de l’insuline et peut fausser les capteurs. La glycémie part dans les deux sens, sans prévenir.
Comment fait-il ?
Pas de pompe dernier cri. Zverev gère avec un capteur de glycémie en continu,qu’il consulte à chaque changement de côté et un simple stylo à insuline qu’il dégaine sur le court. Il a d’ailleurs dû batailler pour en obtenir le droit à Roland-Garros, qui le lui refusait au départ. « Si je ne le fais pas, ma vie est en danger », a-t-il répondu.
On lui avait pourtant dit, enfant, qu’une carrière de haut niveau serait impossible. Des médecins, « derrière leur bureau ». Ils avaient tort.
Et c’est là que la science a rattrapé le dogme. À condition de maintenir la glycémie dans la cible, une personne diabétique de type 1 peut atteindre une capacité aérobie comparable à celle d’une personne non diabétique. Le consensus international de référence (Riddell, The Lancet Diabetes & Endocrinology, 2017) en donne la recette :
- réduire l’insuline avant l’effort sans jamais la couper
- apporter 30 à 60 g de glucides par heure
- lire non pas le chiffre, mais la tendance 📈.
Team Novo Nordisk, équipe cycliste professionnelle composée exclusivement de diabétiques de type 1, le prouve chaque saison dans le peloton international.
Soyons clairs, en cardiologie/diabétologie : on ne « gagne » pas contre un diabète de type 1. La maladie est là le lendemain matin. Elle reste un facteur de risque cardiovasculaire majeur, à surveiller toute une vie.
Ce que Zverev démontre, ce n’est pas que la volonté guérit. C’est que la technologie et la discipline déplacent le plafond,celui que des décennies de prudence médicale avaient fixé bien trop bas.
Aujourd’hui, on gère le diabète de type 1. Demain, en guérira-t-on ?
Les avancées en cours méritent un post à part,j’y reviens bientôt.
À 9 ans, on lui a listé tout ce qu’il ne ferait jamais.
Dimanche, pendant que le public suivait le score, lui suivait une autre courbe,sur son capteur, entre deux jeux.
Les deux ont fini dans le vert.
Hôpital Américain de Paris
|
|
Scooped by
Gilbert C FAURE
May 13, 3:29 AM
|
Antiphospholipid antibodies (aPL) are directed against phospholipids and phospholipid-binding proteins. Laboratory assays used to detect aPL include serological tests for aPL against β2-glycoprotein 1, cardiolipin and other molecules, as well as functional assays for lupus anticoagulant. The presence of aPL can lead to endothelial dysfunction or a hypercoagulable state through prothrombotic and antifibrinolytic mechanisms. These processes, often in conjunction with a ‘second hit’, such as trauma, surgery, or other causes of hypercoagulability or stasis, can lead to venous or arterial thrombosis. The thrombotic risk associated with aPL is best recognized in thrombotic antiphospholipid syndrome, characterized by a persistently positive test for lupus anticoagulant or seropositivity for aPL associated with venous, arterial or microvascular thrombosis. However, aPL seropositivity and its clinical effect on thrombotic events have been increasingly recognized in a broader group of individuals who do not meet traditional research criteria for thrombotic antiphospholipid syndrome. In this Review, we provide an overview of the evidence related to aPL seropositivity in individuals with or without previous thrombosis and the clinical relevance of aPL seropositivity in predicting the risk of thrombotic cardiovascular events. We discuss potential management strategies and identify key knowledge gaps that warrant further research. Antiphospholipid antibodies (aPL) are associated with an elevated risk of thromboembolic events in patients with antiphospholipid syndrome and, increasingly, in those without previous thrombosis. In this Review, Bikdeli and colleagues discuss the clinical relevance of aPL seropositivity in predicting the risk of thrombotic cardiovascular events, summarize potential management strategies and identify key knowledge gaps that warrant further research.
|
|
Scooped by
Gilbert C FAURE
May 9, 5:28 AM
|
Help!! They're attacking our balls!!
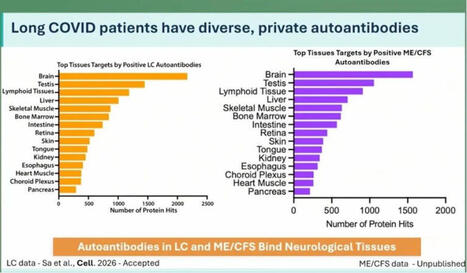
At the ME/CFS conference in Berlin today, Keyla Sá from the Akiko Iwasaki group at Yale showed that Long Covid patients have more autoantibodies targeting neurological tissue. This was apparently tested in both human and mouse tissue.
In ME there are even more autoantibodies than in Long Covid, but number 2 on the list are the cojones.
Interesting. 🍒
Maybe this helps explain why some men develop ME even though the disease is normally more common in women?
Testosterone seems to actually protect against this kind of immune misfire. We see this in research on trans men: https://lnkd.in/ewjxZsRZ
If that protection drops for any reason, the immune system can start attacking your own tissues?
Including your balls?
That’s bullocks!!
https://lnkd.in/eE-giXTv
#pwme #myalgicE #millionsmissing #severeME #MECFSConf2026
|
|
|
Scooped by
Gilbert C FAURE
November 10, 11:15 AM
|
📊 Are we underestimating the true economic burden of systemic autoimmune diseases?
More patients. Higher expenditures. And a growing indirect burden +++
Our latest nationwide study, covering nearly the entire French population from 2015 to 2023, reveals some striking trends:
🔹 +30% in the number of patients with systemic autoimmune diseases.
🔹 +61.8% in total reimbursed expenditures, reaching €628.5 million in 2023.
🔹 +98.9% in medication costs, the main driver of expenditure growth.
🔹 +74.4% in indirect financial support, reflecting the growing impact on work capacity and productivity.
Behind these figures lies an important message: the economic burden of autoimmune diseases extends far beyond healthcare spending.
As treatments evolve and patient numbers increase, understanding the full economic impact of these diseases becomes more important than ever — for researchers, clinicians and policymakers alike.
📖 Curious to explore the findings?
Discover our latest publication:
Evolution of direct and indirect costs of chronic systemic auto-immune and inflammatory rheumatic diseases in France: a 2015–2023 nationwide population-based study
🔗 DOI: https://lnkd.in/eWfVHqnF
#Rheumatology #AutoimmuneDiseases #HealthEconomics #PublicHealth #HealthcareExpenditure #RealWorldData #France
|
|
Scooped by
Gilbert C FAURE
October 17, 9:18 AM
|
Resting and activated B cell subtypes are altered by SLE disease and disease activity. The frequency of total naive B cells has been shown to inversely correlate with SLE disease activity in studies that did not exclude the aN fraction (2, 10). Additionally, there is a direct correlation between disease activity and increased numbers of aN cells as well as the DN2 progeny of aN cells (2). These B cell abnormalities were present in the individuals assessed herein as determined by multiparameter flow cytometry analysis of isolated peripheral blood PBMCs (Supplemental Figure 1A; supplemental material available online with this article; https://doi.org/10.1172/JCI199528DS1) from a cohort of 14 healthy individuals treated as controls (HCs), 46 with inactive SLE (SELENA-SLEDAI ≤ 4), and 22 with active SLE (SELENA-SLEDAI ≥ 5) (Supplemental Tables 1 and 2). On average, transitional B cells were increased (P = 0.0500) in both SLE cohorts as previously described (Supplemental Figure 1B) (11). The frequency and total number of rN cells were decreased in active disease compared with HC subjects and negatively correlated with SLEDAI (Supplemental Figure 1, C and D). The frequency and number of rN cells were similar between inactive disease and HC. As expected, the aN population was expanded as a fraction of total CD19+ cells and as a fraction of total naive B cells in active SLE (Supplemental Figure 1E). Within the IgD–CD27– DN compartment, we confirmed the expansion of DN2 cells (CD19+CD27–IgD–CD21–CD11c+) in active disease (2) and to a lesser but still significant degree in individuals with low-disease activity (Supplemental Figure 1F). A similar profile was observed for the DN3 cells (CD19+CD27–IgD–CD21–CD11c–), previously described in severe COVID-19 infection (12) and in IgG4-related disease (13). Combined, SLE cohorts displayed an increase of the DN2/DN1 and DN3/DN1 ratios, reflecting a reversal of the DN1 dominance within the DN B cell compartment characteristic of physiological B cell homeostasis (Supplemental Figure 1G). This effect was also seen in antibody-secreting cells (CD19+CD27++CD38++) (Supplemental Figure 1H). Reduced frequencies of unswitched memory B cells (CD19+CD27+IgD–) were observed in both SLE conditions (Supplemental Figure 1I), whereas switched memory B cells (SWM; CD19+CD27+IgD+) were unchanged by SLE diagnosis or disease activity (Supplemental Figure 1J). Overall, the B cell profiles of this SLE cohort align with our earlier findings (2, 3, 10). Principal component analysis (PCA) using all gated B cell populations revealed that the samples from HCs were enriched in rN and unswitched memory B cells according to the principal component loadings, with considerable overlap with inactive SLE, while active individuals separated by PC1, reflecting their increased aN/DN2/antibody-secreting cell populations (Supplemental Figure 1K). The inactive SLE cohort was spread between SWM/DN1, T1/T2, and active disease–associated areas. Collectively, the B cell profiles of most inactive SLE showed more heterogeneity than those individuals with active disease. Importantly, inactive disease B cell profiles did not completely overlap with those from HC samples, a finding consistent with the hypothesis that B cells in inactive SLE may have unique molecular determinants. SLE rN B cells express an abnormal transcriptome in patients with low disease activity. Our previous work demonstrated the presence of an SLE-specific transcriptome and epigenome in several B cell subsets of individuals with high disease activity, including rN (5, 6). To determine whether this transcriptome reflected a disease-determined regulatory program or was instead secondary to disease activity, RNA-seq was performed on cells isolated from PBMCs derived from an additional 17 HC, 15 inactive SLE (SELENA-SLEDAI ≤ 4), and 12 active SLE (SELENA-SLEDAI ≥ 5) individuals using a previously developed sorting strategy (14, 15) to rigorously sort rN B cells (CD19+CD27–IgD+MTG–CD24+CD38+) (5) and T1/T2 cells (CD19+CD27–IgD+MTG+CD24+CD38+) (Supplemental Table 1 and Supplemental Figure 2A). Here, the inactive disease cohort represented a longitudinal blend of individuals who were inactive and flare free from 1.6 to 107.3 months (Supplemental Figure 2B). PCA performed on the differentially expressed genes (DEGs) detected from pairwise comparisons of inactive SLE, active SLE, and HC, showed separation of each group of rN cells (Figure 1A). PC1 distinguished active SLE from both HC and inactive SLE and was positively correlated with SLEDAI (Figure 1B), whereas PC2 separated SLE samples from HC. Principal components were also analyzed with respect to other covariates, including age and medications, and revealed that these covariates were not correlated with the major PCs (Supplemental Figure 2, C and D). Thus, the data reflect that disease state and activity account for the dominant sources of variance in the data. Figure 1The distinct transcriptomes of active and inactive SLE B cells. (A) PCA plot of DEGs in rN B cells. Contours represent high-density regions calculated at probabilities (Prob). (B) Scatterplot of PC1 score by SLEDAI for SLE samples. P value and correlation were calculated by Pearson’s correlation test. (C–E). MA plots showing mean normalized expression (RPKM) for each gene by log2FC. Colors represent –log10 of P value derived from differential testing. (F) GSVA plot showing IFN-α response gene set. P values were calculated using 2-way ANOVA. Post hoc tests were performed across samples within the same cell type using Tukey’s honestly significant difference test and showed significance (adjusted P value < 0.05) in SLE versus HC comparisons but not between active and inactive SLE groups. Differential expression analysis of rN B cells showed hundreds of DEGs between both disease activity groups and HCs and each other (Figure 1, C–E, Supplemental Figure 3A, and Supplemental Dataset 1). In general, both rN and T1/T2 B cells from individuals with active SLE displayed greater numbers of DEGs than their inactive SLE counterparts compared with HCs (Supplemental Figure 3A). PCA of T1/T2 cells also showed a similar separation, albeit with greater overlap between inactive and active SLE, as relatively few genes met FDR significance for differential expression between these 2 groups (Supplemental Figure 3, B and C). Thus, both rN and newly emerging T1/T2 B cells in inactive disease display hallmarks of an SLE disease state with a greater effect of disease activity on the transcriptome of rN cells. This pattern is consistent with the existence of a disease program initiated during early development, as reflected by T1/T2 B cells that expand during maturation into naive B cells and are modified during naive B cell activation. Additionally, many of the DEGs that are unique to either active or inactive SLE rN cells could dictate the properties of these cells in the different phases of the disease. For example, the upregulation in active disease of TNFRSF13B (TACI) (Supplemental Figure 3D), which binds BAFF and APRIL, could lead to alterations in tolerance (16). Upregulation of FCRL5 in active disease (Supplemental Figure 3D) could inhibit anergy and facilitate TLR signaling, as suggested from mouse models (17). In contrast, inactive disease rN cells overexpressed SPI1, which encodes the ETS transcription factor (TF) PU.1, and the epigenetic regulator EZH2 (Figure 1, D and E), a pattern consistent with preferential differentiation of inactive disease naive B cells through germinal centers (GCs) (18, 19). Type I IFN response, TLR, and BCR signaling genes differentiate rN B cells in active SLE. A hallmark transcriptional feature of SLE is the upregulation of type I IFN response in multiple B cell populations (5, 20). Indeed, gene set variation analysis (GSVA) showed that the IFN-α response gene signature was present in the majority of individuals with SLE in this study (Figure 1F). Importantly, 2-way ANOVA of the GSVA results showed that the IFN-α response in rN cells was significantly different across HC and SLE samples but not between active and inactive disease. A combined analysis of all cell types and activity levels highlighted limited DEG overlap between the groups (Figure 2A). The exceptions to this were primarily a core set of IFN response genes (N = 25) upregulated in all SLE groups (Figure 2B). In addition, 76 DEGs were shared only among the active disease rN and T1/T2 cells (Figure 2C). These genes were either upregulated or downregulated in active disease cells, while remaining at HC levels in inactive SLE. Of the genes upregulated (Figure 2D), ISG15, an IFN-induced antiviral response gene, has been associated with SLE disease activity (21). NLRP6, also overexpressed in active disease, encodes a key pattern recognition sensor component of inflammasome-mediated innate immunity and can be upregulated via type I IFN in some infections (22). The IFN regulatory factor 7 TF, encoded by IRF7, was more highly expressed in active disease B cells. IRF7 is a key regulator of the interferon response gene program (23) and genetic susceptibility to severe SLE (24). Of note, IRF7 mediates TLR7 signaling, a central SLE activation pathway (4). Finally, although THEMIS2 expression was significantly enriched in active versus HC, some inactive disease rN and T1/T2 samples also expressed high levels of THEMIS2 (Figure 2D). THEMIS2 encodes a protein known to interact with PLCγ2 to lower B cell activation thresholds to low-avidity antigens, a function of particular relevance to naive B cells (25). THEMIS2 is also of interest for SLE pathogenesis, as it is required to induce the expression of TBET and the production of IFN-γ (26), factors of major significance in the activation and differentiation of SLE naive B cells. Figure 2Shared and distinct gene expression signatures in active and inactive SLE. (A) Venn diagram showing the number of DEGs shared and distinct across groups. (B) Heatmap of the 25 DEGs shared across all 4 groups from A. Normalized expression values (RPKM) were averaged by group and z scored. (C) Heatmap as in B showing the 76 DEGs overlapping between the indicated cell types. (D and E) Box-and-whisker plots showing normalized gene expression for indicated genes and groups with higher or lower expression, respectively, in active SLE. Dots represent individual samples and are colored according to log transformation of SLEDAI score. The box-and-whisker plots depict the minimum and maximum values (whiskers), the upper and lower quartiles, and the median. Downregulation was also observed for PI3K family members, including the catalytic subunits PIK3CD and PIK3CG, as well as the regulatory subunit PIK3R5 and the TF FOXO1, which regulates PIK3R5 (27) (Figure 2, C and E). The PI3K/FOXO1 axis is an important regulator of B cell activation and homing to the lymph nodes, and its attenuation may enhance class switch recombination in primary B cells (28). Other examples of modulators of lymphocyte activation gene sets downregulated in active disease included FCRL3 and FCER2 (encoding CD23), although there appears to be a downward trend in inactive disease (Figure 2E). FCRL3 is an inhibitor of BCR signaling, and stimulation through FCRL3 enhances TLR9-mediated B cell activation but suppresses further differentiation to plasma cells (29). CD23 is induced by stimulation of B cells with IL-4, while being reduced by IFN stimulation. Human CD23 expression is strongly downregulated in SLE aN B cells (3). Also downregulated in B cells within the active SLE cohort was the expression of MEF2C (Figure 2, C and E), a TF involved in B cell development and GC formation (30, 31). Inactive SLE has a unique transcriptional program. To better understand the nature of a SLE disease-state signature in the absence of disease activity, all pairwise DEGs were hierarchically clustered resulting in 4 distinct gene clusters (Figure 3A). In parallel, the samples were K-means clustered into 3 groups based on gene expression patterns. This approach resulted in a clear group of high SLEDAI active SLE samples that also displayed the largest transcriptional distance from HCs. Although heterogeneity exists, the majority of inactive individuals formed a distinct cluster. Cluster 1 contained DEGs highly expressed in both SLE groups and was enriched for IFN response genes (Figure 3), many of which were shared between rN and T1/T2 cells (Figure 2B). This cluster also included the gene for STAT4, a TF induced by type I interferons that participates in IL-12 signaling, promoting IFN-γ production (32, 33). Polymorphisms in STAT4 are associated with severe SLE (34), and its expression was elevated in rN cells from both disease activity levels, although to a greater extent in active SLE (Supplemental Figure 3D). Genes in cluster 2 were most highly expressed in active SLE, as exemplified by THEMIS2, also overexpressed in active transitional cells (Figure 2E). Cluster 2 also contained overexpressed members of the TNF superfamily, including TNFRSF10A (Death Receptor 4 or TRAIL receptor), which activates NF-κB inflammatory pathways. This cluster also contains the gene for STAG3, a protein critical for functionality of meiotic cohesin complexes, previously found as one of the top overexpressed genes in unfractionated CD19+ SLE B cells (35). Figure 3Cytokine and CD40 signaling gene expression in rN inactive SLE. (A) Heatmap showing DEGs in rN B cells with respect to disease activity. Normalized expression (RPKM) of DEGs were z scored and clustered using hierarchical clustering into 4 clusters by row, whereas columns were K-means clustered using a K = 3. (B) Bubble plot showing Gene Ontology enrichment of clusters from A. Bubbles are colored by the overlapped (k) genes normalized by each gene set size (K) and are presented as percentages. (C) Bar plots of normalized gene expression (RPKM) for indicated genes in rN cells. (D) Bubble plot showing GSEA. Bubbles are colored by normalized enrichment score (NES) and sized according to enrichment P value. Gene set descriptions are provided in Supplemental Table 3. A, active SLE; I, inactive SLE. (E) GSEA plots and NES for inactive or active SLE versus HC rN B cells. Dotted lines indicated enrichment that did not meet significance (FDR < 0.05). (F) Heatmap showing leading-edge genes from the CD40 signaling GSEA gene set in E. Normalized expression (RPKM) of DEGs were z scored. (G) GSEA plots for indicated gene sets for rN cells. (H) Bar plots of normalized gene expression (RPKM) for indicated genes from rN cells. In C and H, data are presented as the mean ±1 SD. Asterisks indicate significance in DESeq2 differential expression testing (Wald test with Benjamini-Hochberg correction), FDR < 0.05. The remaining 2 clusters (3 and 4) contained genes that were down- and upregulated in inactive disease compared with HCs, respectively, and included gene sets broadly associated with cytokine responses, proliferation, and regulation of cell activation pathways (Figure 3, A and B). Cluster 3 comprised genes most severely repressed in active SLE and to a lesser extent in inactive SLE. Notably, it included IL4R, which counteracts the ability of IFN-γ to induce a TBET program in pathogenic SLE B cells as well as the differentiation of TLR7-activated naive B cells into pathogenic DN2 B cells (36–38). Cluster 3 also included downmodulated genes associated with B cell activation, naive B cell identity, and BCR signaling inhibition, including PIK3R5, MEF2C, and FCRL3 discussed above (29, 30) as well as NFAT1 (NFATC2), which is important for B cell anergy in a mouse self-tolerance model (39, 40). Cluster 4 contained genes highly expressed by inactive SLE rN B cells, including BCL6, which is required for the early stage of GC formation (Figure 3C) (41). Cluster 4 also contained genes associated with B cell activation and TNF-α/NF-κB signaling gene sets (Figure 3B), which suggests the potential for dysregulation of additional cytokine pathways in inactive SLE. To test this, we curated a library of gene sets representing various forms of B cell activation and cytokine signaling (Supplemental Table 3). In addition to enrichment of type I and II IFN gene sets in all SLE cell types and activity levels (Figure 3D), significant enrichment in inactive SLE rN B cells was found for CD40 signaling and several cytokine pathways, including TNF-α, IL-12, and IL-10, compared with HC and active SLE (Figure 3G and Supplemental Figure 3E). TNF-α/NF-κB and CD40 signaling pathways showed the greatest number of gene set members upregulated (FDR < 0.05) in inactive SLE (Figure 3E). It is important to note that many of these pathways have common overlapping genes and that all genes in a pathway may not be expressed in a given comparison. We next interrogated the leading-edge subset of genes driving the association with CD40 signaling. That gene subset, with the greatest expression in inactive SLE, included members of not only the B cell CD40 response but also NF-κB signaling and GC B cell expressed genes (Figure 3F). Direct gene expression comparison between active and inactive SLE showed enrichment in inactive SLE for CD40 signaling, IL-4 response, and light zone GC B cell–expressed genes (Figure 3G). Compared with active disease, transcripts for GC B cell genes BCL6 (Figure 3C) and ITGB2 (Figure 3H) were significantly elevated in inactive SLE, suggesting that inactive SLE rN cells may be predisposed to interact with T cells and to follow distinct differentiation paths when activated. Alternatively, increased GC genes could restrict the differentiation potential of these B cells. Other significantly elevated transcripts in this comparison included CD44, a cell adhesion molecule with maximal expression in preactivated naive B cells and the TF BHLHE40, which is often associated with B cell activation and may restrict GC formation (Figure 3H) (42, 43). Increased expression of TNIP2, which encodes a modulator of NF-κB signaling, was observed in inactive SLE compared with HC (Figure 3H). Intriguingly, reduced expression of TRAF5 (a signaling mediator of CD40 signaling) (44, 45) in inactive SLE compared with HC suggested that this activation pathway may be dysfunctional to some extent (Supplemental Figure 3D). Overall, these data suggest an increased role of abnormal CD40, NF-κB, IL-4, and TNF-α cytokine signaling events in inactive disease rN B cells. Epigenetic alterations to IFN-α response and TLR regulation loci remain accessible during disease remission. To characterize the epigenetic state of rN B cells during active and inactive SLE, we performed the assay for transposase-accessible chromatin with sequencing (ATAC-seq) (46) on a subset of the same SLE and HC samples that were profiled by RNA-seq above (Supplemental Table 1). A total of 24,793 differentially accessible regions (DARs) were found after comparing both disease groups and HCs in all pairwise combinations (Supplemental Dataset 2). Similar to the RNA-seq data, correlation analysis of the major principal components to other covariates revealed PC1 correlated with disease activity and SLEDAI and not to medications or other covariates (Supplemental Figure 2D). Both inactive (Figure 4A) and active SLE (Figure 4B) exhibited thousands of DARs (FDR < 0.05) when compared with HCs. On average, DARs present only in inactive disease exhibited small changes in accessibility, whereas those that overlapped both disease groups and active disease had higher absolute differential accessibility levels (Figure 4C). When assessing a 2-fold change, one-third of DARs from active disease rN cells overlapped with those occurring in inactive rN cells (Figure 4D). This collection of loci reflecting inactive and active disease-specific DARs, as well as those that overlapped, was used for gene pathway enrichment analysis (Figure 4E). Figure 4Chromatin accessibility changes in inactive SLE partially overlap those in active SLE. (A and B) MA plots showing mean normalized accessibility (reads per peak million [rppm]) for each locus by log2FC compared between the indicated groups. Dotted lines represent ± 0.5 log2FC cutoff. (C) Whisker-and-box plot showing absolute value of log2FC for loci in A and B separated by whether they occur in the indicated groups or overlap. (D) Venn diagram showing number of DARs in either disease activity compared with HCs using a log2FC cutoff of > 1. (E) Lollipop chart showing gene pathway enrichment of DARs (log2 of number observed [Obs]/number expected [Exp]) in the indicated groups. (F) Genome track plots. Black boxes represent DARs. (G) Whisker-and-box plots showing log2FC in gene expression in rN for each SLE group compared with HCs that have ≥ 1 shared accessible DAR. Lines connect individual genes. The box-and-whisker plots depict the minimum and maximum values (whiskers), the upper and lower quartiles, and the median. P value was calculated by paired 2-tailed Student’s t test. This analysis showed significant enrichment for overlapping and nonoverlapping pathways in each disease group. A subset of regions was significantly changed in accessibility only in inactive SLE. Consistent with the reduced effect size for this set of DARs, subtle increases in accessibility in DARs within the NOTCH3, ETS1, and DGKD loci were observed for inactive SLE rN cells (Supplemental Figure 4A). NOTCH3 and ETS1 encode transcriptional regulators, and DGKD encodes a diacylglycerol kinase. DARs specifically associated with active SLE were enriched around genes in several signaling cascades and in the positive regulation of lymphocyte activation, including SOCS1, which encodes a suppressor of IFN signaling (47) and a direct regulator of IRF7 degradation (48). DARs at CLEC16A, which functions in autophagy and intracellular trafficking, were enriched in active SLE (Supplemental Figure 4B). CLEC16A is associated with susceptibility to autoimmune disease and inflammation (49, 50) and is located at an autoimmunity risk locus (51) that includes the MHC-II master regulators CIITA and SOCS1. The HKDC1 and SUPV3L1 genes, which encode a hexokinase and a mitochondrial double-stranded RNA helicase, respectively, contain DARs found only in active SLE (Supplemental Figure 4B). Importantly, DARs in both disease activities (when compared with HCs) included regions with increased accessibility around several IFN response genes, such as IFI44/IFI44L and RSAD2 (Figure 4F and Supplemental Figure 4C). To determine whether these changes to chromatin accessibility were correlated with gene expression changes in SLE, expression was queried for those genes found at loci with at least 1 shared DAR in both active and inactive SLE. Many of these genes showed continued differential expression from HCs in both disease activity groups; however, a significant increase in the magnitude of expression changes was observed in active SLE individuals (Figure 4G). These data suggest that inactive disease rN B cells maintain accessible regions of chromatin around important loci, such as type I IFN response genes, indicating that either durable epigenetic memory, persistent inflammatory signaling, or both is occurring. The increase in overall gene expression at these shared loci suggests that additional events/factors are present/augmented in the active disease state. Unique and shared TF motifs in inactive and active SLE epigenomes. To determine which TFs may play a role in regulating genes with differential accessibility in inactive and active SLE, enrichment analysis of known TF-binding motifs was performed on all DARs. Ranking the magnitude of enrichment of motifs over genomically matched background regions using HOMER (52) identified specific TF families that were enriched in each of the above categories of DARs. TF binding motifs for EBF1, p63, and TCF4, which contribute to mature B cell identity, homeostasis, and GC formation (53–56), were enriched in DARs with increased accessibility in inactive disease (Figure 5A). DARs in both disease activity groups (but not HCs) were enriched for ETS and IRF family motifs. Regions that became less accessible only in active SLE were enriched for NF-κB, FOXO1, and SPIB motifs, whereas inactive-specific DARs with less accessibility were enriched for EGR family motifs (Figure 5B). EGR motifs were previously shown to drive a network of genes in rN cells of active SLE (5). The enrichment for IRF family motifs, including IFN-stimulated response elements, was found within regions that remained accessible in both disease activity levels. However, additional enrichment of IRF and IFN-stimulated response element motifs was also found in DARs that were accessible only in active SLE (Figure 5C). Basic helix-loop-helix (bHLH) family motifs, such as those for TCF4, E2A (TCF3), and n-MYC, were also enriched with the highest ranking in the DARs specific to inactive SLE (Figure 5D). Intriguingly, significant enrichment of IRF8 motifs was found in regions both losing and gaining accessibility compared with HCs, particularly in active disease DARs, but also in those shared with inactive disease (Figure 5E). As above, NF-κB motifs were only enriched in DARs that lose accessibility in SLE (Down DAR), most significantly in active disease rN (Figure 5E). Together, these data suggest roles for ETS, IRF, bHLH, EGR, and NF-κB TF families in establishing or maintaining SLE disease activity–associated epigenetic changes. Figure 5IRF and NFAT family factor motifs are enriched in shared elements of inactive and active SLE chromatin. (A and B) Heatmaps showing z scored ranking of HOMER motif enrichment from DARs with positive (A) or negative (B) log2FC compared with HCs ranked by effect size within each column. Columns represent specificity to active, inactive, or overlapped (those found in both disease states) DARs. (C and D) Heatmap of ranking for IRF (C) or bHLH (D) family factors after log10 transformation. (E) Bar plots showing percentage of regions containing indicated target motif (red) versus selected genomic background (blue). Act, active SLE; Inact, inactive SLE. MEF2C and E2A/E2-2 factors likely regulate inactive SLE-specific gene sets. RNA expression and chromatin accessibility assay data were integrated into a gene regulatory network with the Taiji tool (57), which uses the PageRank algorithm to reveal the factors most implicated in coordinated regulation of RNA expression based on chromatin accessibility (Figure 6A). Similar to previous results (5), ATF3 was enriched in both active and inactive rN datasets, suggesting a role in driving the common SLE signature. PAX5 and RUNX1 had higher PageRank values in inactive disease for both rN and T1/T2 cells, while EGR1 and IKZF1 values were highest for the T1/T2 cell type within inactive SLE. TCF4, TCF3, and TCF12, which encode the TFs E2-2, E2A, and HEB, respectively, along with MEF2C and MEF2D showed the highest PageRank score in rN cells from inactive disease samples. In contrast, the factors NFATC2 and NFATC3 showed reduced importance in inactive disease rN cells compared with healthy or active counterparts (Figure 6A). This reduced importance correlated with lowered expression of the NFAT genes themselves (Figure 6B). A comparison of PageRank scores between active versus inactive disease showed that TFs such as TCF3, MEF2D, and CEBPB were predicted to be more important in inactive disease rN cells. Other PageRank scores were likely less driven by changes in their own transcript expression, but more by their influence on target genes. For example, BCL6 was more highly expressed in inactive disease but appears to have a lower impact on its target genes, as assessed by PageRank. Figure 6MEF2 and E2A/E2-2 regulate inactive SLE gene expression programs. (A) Heatmap showing log2FC of PageRank network importance score for SLE conditions (rN and T1/T2) versus HCs. (B) Scatterplots showing PageRank score (x axis) versus RNA expression. (C) Heatmap representing significance of overlap between TF target list and relevant B cell gene pathways. Color represents FDR P value of Fisher’s exact tests transformed using –log10. To test this, TF gene targets in inactive rN cells, as determined by accessibility of motifs at predicted enhancer regions, were cross-referenced across the B cell activation and cytokine-signaling gene set libraries used in Figure 3. Fisher’s exact tests showed significant enrichments of target genes of PageRank-implicated TFs (Figure 6C). For example, IRF3 and IRF7 regulatory targets were most significantly enriched for IFN response genes, supporting their known role in TLR-mediated type I IFN response gene expression pathways (58). Targets of MEF2C/D and NR3C2, as well as to a lesser extent RUNX1 and NF-κB factors, were enriched for elements of the CD40 signaling gene set, which was expressed more highly by inactive rN B cells. MEF2C expression was significantly decreased from HCs in active SLE only (Supplemental Figure 3D). NFATC1 and NFATC2 target genes were enriched for B cell receptor and TLR signaling genes, suggesting alterations in the potential for these cells to respond to future antigen, cytokine, or stimulation challenges. The regulatory targets of E2A (TCF3), HEB (TCF12), PRDM1, and the glucocorticoid receptor NR3C1 were enriched for a gene set consisting of the DEGs from active versus inactive SLE in rN cells (Figure 6C). Thus, these data connect epigenetic changes in DARs with their associated TF motifs and alterations in gene expression pathways regulated in inactive SLE.
|
|
Scooped by
Gilbert C FAURE
October 14, 6:49 AM
|
|
|
Scooped by
Gilbert C FAURE
October 8, 8:19 AM
|
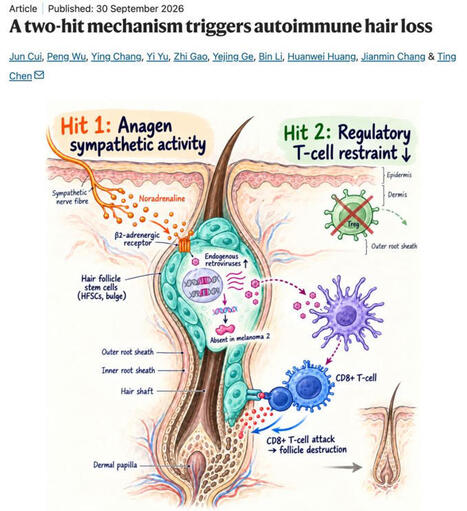
𝗦𝘁𝗿𝗲𝘀𝘀 + 𝗹𝗼𝘀𝘁 𝘁𝗼𝗹𝗲𝗿𝗮𝗻𝗰𝗲 = 𝗔𝘂𝘁𝗼𝗶𝗺𝗺𝘂𝗻𝗲 𝗵𝗮𝗶𝗿 𝗹𝗼𝘀𝘀
𝘚𝘵𝘳𝘦𝘴𝘴, 𝘦𝘯𝘥𝘰𝘨𝘦𝘯𝘰𝘶𝘴 𝘳𝘦𝘵𝘳𝘰𝘷𝘪𝘳𝘶𝘴𝘦𝘴 𝘢𝘯𝘥 𝘭𝘰𝘴𝘵 𝘛𝘳𝘦𝘨 𝘵𝘰𝘭𝘦𝘳𝘢𝘯𝘤𝘦 𝘤𝘰𝘯𝘷𝘦𝘳𝘨𝘦 𝘵𝘰 𝘵𝘳𝘪𝘨𝘨𝘦𝘳 𝘊𝘋8+ 𝘛-𝘤𝘦𝘭𝘭-𝘮𝘦𝘥𝘪𝘢𝘵𝘦𝘥 𝘢𝘶𝘵𝘰𝘪𝘮𝘮𝘶𝘯𝘦 𝘩𝘢𝘪𝘳 𝘭𝘰𝘴𝘴.
🧠 𝗔 𝗽𝗮𝗽𝗲𝗿 𝗮 𝗱𝗮𝘆 𝗸𝗲𝗲𝗽𝘀 𝗯𝗿𝗮𝗶𝗻 𝗱𝗲𝗰𝗮𝘆 𝗮𝘄𝗮𝘆 🧠
Wednesday, 7 October 2026
𝘏𝘢𝘪𝘳 𝘧𝘰𝘭𝘭𝘪𝘤𝘭𝘦 𝘴𝘵𝘦𝘮 𝘤𝘦𝘭𝘭𝘴 𝘢𝘳𝘦 𝘯𝘰𝘳𝘮𝘢𝘭𝘭𝘺 𝘱𝘳𝘰𝘵𝘦𝘤𝘵𝘦𝘥 𝘧𝘳𝘰𝘮 𝘪𝘮𝘮𝘶𝘯𝘦 𝘢𝘵𝘵𝘢𝘤𝘬. 𝘊𝘶𝘪, 𝘞𝘶 𝘦𝘵 𝘢𝘭. 𝘴𝘩𝘰𝘸 𝘪𝘯 𝘮𝘪𝘤𝘦 𝘵𝘩𝘢𝘵 𝘢𝘯𝘢𝘨𝘦𝘯-𝘭𝘪𝘯𝘬𝘦𝘥 𝘴𝘺𝘮𝘱𝘢𝘵𝘩𝘦𝘵𝘪𝘤 𝘯𝘰𝘳𝘢𝘥𝘳𝘦𝘯𝘢𝘭𝘪𝘯𝘦 𝘴𝘪𝘨𝘯𝘢𝘭𝘭𝘪𝘯𝘨 𝘵𝘩𝘳𝘰𝘶𝘨𝘩 𝘈𝘋𝘙𝘉2 𝘤𝘳𝘦𝘢𝘵𝘦𝘴 𝘢 𝘵𝘳𝘢𝘯𝘴𝘪𝘦𝘯𝘵𝘭𝘺 𝘷𝘶𝘭𝘯𝘦𝘳𝘢𝘣𝘭𝘦 𝘧𝘰𝘭𝘭𝘪𝘤𝘶𝘭𝘢𝘳 𝘴𝘵𝘢𝘵𝘦 𝘵𝘩𝘢𝘵 𝘱𝘳𝘰𝘨𝘳𝘦𝘴𝘴𝘦𝘴 𝘵𝘰 𝘢𝘶𝘵𝘰𝘪𝘮𝘮𝘶𝘯𝘦 𝘥𝘦𝘴𝘵𝘳𝘶𝘤𝘵𝘪𝘰𝘯 𝘸𝘩𝘦𝘯 𝘳𝘦𝘨𝘶𝘭𝘢𝘵𝘰𝘳𝘺 𝘛-𝘤𝘦𝘭𝘭 𝘤𝘰𝘯𝘵𝘳𝘰𝘭 𝘪𝘴 𝘭𝘰𝘴𝘵.
💡 𝗧𝗮𝗸𝗲 𝗵𝗼𝗺𝗲 𝗺𝗲𝘀𝘀𝗮𝗴𝗲
• During anagen, sympathetic noradrenaline signals through the β2-adrenergic receptor in hair follicle stem cells, physiologically reactivating endogenous retroviruses before overt inflammation.
• Loss of regulatory T-cell restraint converts this normally tolerated state into autoimmunity. Psychological stress or optogenetic sympathetic activation also renders normally resistant telogen follicles susceptible.
• Endogenous retroviral activity engages absent in melanoma 2 and type 1 conventional dendritic-cell-dependent CD8+ T-cell responses. Reverse-transcriptase inhibition or Aim2 deletion protects follicles from destruction.
🔥 𝗜𝗺𝗽𝗮𝗰𝘁
• Autoimmune hair loss emerges from the convergence of immune dysregulation with a transient physiological tissue state, nominating adrenergic signalling and endogenous retroviral activity for translational testing.
❓ 𝗢𝗽𝗲𝗻 𝗾𝘂𝗲𝘀𝘁𝗶𝗼𝗻𝘀
• Do well-staged human alopecia areata lesions reproduce the sympathetic–β2-adrenergic receptor–endogenous retrovirus axis?
• Which endogenous retroviral nucleic acids and responding cell populations drive absent in melanoma 2 activation in vivo?
• Would reverse-transcriptase inhibition or selective follicular β2-adrenergic receptor blockade prevent or reverse established human disease?
𝗔 𝘁𝘄𝗼-𝗵𝗶𝘁 𝗺𝗲𝗰𝗵𝗮𝗻𝗶𝘀𝗺 𝘁𝗿𝗶𝗴𝗴𝗲𝗿𝘀 𝗮𝘂𝘁𝗼𝗶𝗺𝗺𝘂𝗻𝗲 𝗵𝗮𝗶𝗿 𝗹𝗼𝘀𝘀
Jun Cui, Peng Wu et al.
Nature, September 2026
Corresponding author: Ting Chen
🔗 𝘓𝘪𝘯𝘬 𝘵𝘰 𝘵𝘩𝘦 𝘱𝘶𝘣𝘭𝘪𝘤𝘢𝘵𝘪𝘰𝘯 𝘪𝘯 𝘤𝘰𝘮𝘮𝘦𝘯𝘵𝘴
𝘐𝘭𝘭𝘶𝘴𝘵𝘳𝘢𝘵𝘪𝘰𝘯 𝘨𝘦𝘯𝘦𝘳𝘢𝘵𝘦𝘥 𝘸𝘪𝘵𝘩 𝘊𝘩𝘢𝘵𝘎𝘗𝘛.
𝘛𝘩𝘦 𝘰𝘱𝘪𝘯𝘪𝘰𝘯𝘴 𝘴𝘩𝘢𝘳𝘦𝘥 𝘰𝘯 𝘓𝘪𝘯𝘬𝘦𝘥𝘐𝘯 𝘢𝘳𝘦 𝘮𝘺 𝘰𝘸𝘯.
|
|
Scooped by
Gilbert C FAURE
August 25, 9:14 AM
|
We are excited to report in PNAST-Proceedings Of The National Acad... that autoantibodies neutralizing type I interferons underlie 35% of cases of Chikungunya virus (CHIKV) encephalitis or myelitis from a multiple cohort study (https://lnkd.in/gxux4e6e).
Chikungunya virus (CHIKV), an arthropod-borne virus, has caused many outbreaks. While most patients experience fever and joint pain, in rare cases, it invades the brain or spinal cord, causing fatal complications. Our new paper shows why only some develop these complications.
We studied 245 confirmed CHIKV cases from Martinique and Brazil, including 20 with severe CNS disease (encephalitis, myelitis, encephalomyelitis). In 35% of CNS cases, patients had autoantibodies that neutralize their own type I interferons, the body's frontline antiviral defense.
These autoantibodies were undetectable in all 225 patients with mild infection. However, patients who had these antibodies before infection had approximately 850 times the risk of developing severe CNS disease compared to the general population.
Our data support a mechanism where these autoantibodies block the activity of IFN-I during CHIKV infection. This disruption of the host's normal antiviral responses allows the virus to replicate unchecked and cross into the central nervous system, leading to fatal diseases.
This paper is the latest chapter of a six-year-long story that our lab has been writing. In 2020, we showed that these IFN-I autoantibodies underlie at least 10% of life-threatening COVID-19 pneumonia. This discovery was a glimpse of a larger picture (https://lnkd.in/gU3tERpW).
Since then, our studies have consistently identified the same mechanism in various viruses. Approximately 20% of COVID-19 deaths are attributed to antibodies that are already present in about 4% of individuals over the age of 70 (https://lnkd.in/gMwk9tmm)
Additionally, the Yellow fever vaccine can cause encephalitis, while the West Nile virus can cause encephalitis in about 40% of cases (https://lnkd.in/gFNU-Wzt).
Tick-borne encephalitis can cause encephalitis in about 10% of cases, and Powassan, Usutu, Ross River virus disease, and Chikungunya vaccine (VLA1553) can also cause encephalitis. (Figure: Groen & Hale Curr. Opin. Virol. 2026; https://lnkd.in/gsgXa_ME).
|
|
Scooped by
Gilbert C FAURE
August 12, 3:56 AM
|
It seems that autoimmunity and cancer have finally found common ground 🧐
|
|
Scooped by
Gilbert C FAURE
August 7, 10:04 AM
|
Access educational materials, eLearning activities, accredited Live webinar sessions with polls and chat on this fast Digital Library and Hybrid Virtual Event Platform powered by MULTILEARNING LMS.
|
|
Scooped by
Gilbert C FAURE
July 16, 10:22 AM
|
Macrophage activity is correlated with advanced fibrosis in AILD. To investigate the association between macrophage activation and fibrosis-associated transcriptional programs across AILD, we performed RNA-Seq of cryopreserved tissue samples from 64 clinically indicated liver biopsies of pediatric...
|
|
Scooped by
Gilbert C FAURE
June 22, 10:42 AM
|
Mass spectrometry reveals pneumonia type–specific protein signatures in bronchoalveolar fluid. To identify pneumonia type–specific biomarkers, we sampled BALF and plasma from individuals enrolled in the Successful Clinical Response in Pneumonia Therapy (SCRIPT) study at Northwestern Memorial...
|
|
Scooped by
Gilbert C FAURE
June 11, 1:45 PM
|
|
|
Scooped by
Gilbert C FAURE
May 26, 3:59 AM
|
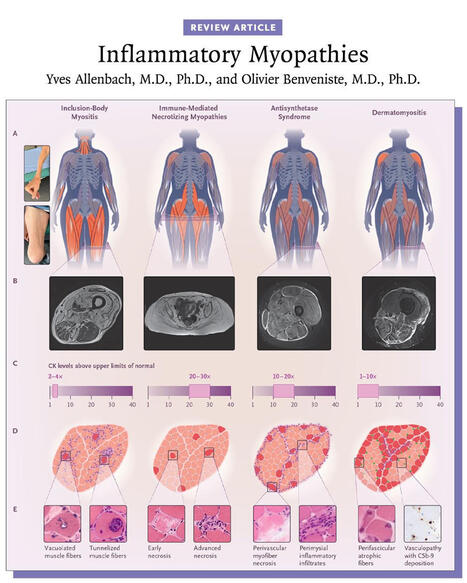
Inflammatory myopathies are typically associated with a myositis-specific autoantibody that determines the diagnosis and prognosis. Myositis subgroups have distinct pathomechanisms that now allow for targeted therapies. 👉 https://nej.md/49Iy9Oo
Inflammatory myopathies are a heterogeneous group of autoimmune diseases characterized by immune-mediated damage to skeletal muscle. They are classified into five major subtypes: inclusion-body myositis, immune-mediated necrotizing myopathies, antisynthetase syndrome, overlapping myositis, and dermatomyositis, each with distinct clinical features and outcomes.
Inclusion-body myositis and immune-mediated necrotizing myopathies primarily affect muscle, with prognosis largely determined by functional impairment, whereas antisynthetase syndrome, overlapping myositis, and dermatomyositis are systemic diseases that can involve the skin, joints, and lungs and may be life-threatening.
The majority of inflammatory myopathies are associated with myositis-specific autoantibodies, which inform diagnosis, subtype classification, and prognosis. Advances in understanding the distinct pathomechanisms underlying each subgroup now enable increasingly targeted therapeutic approaches.
Learn more in the Review Article “Inflammatory Myopathies” by Yves Allenbach, MD, PhD, and Olivier Benveniste, MD, PhD: https://nej.md/49Iy9Oo
#Neurology #Rheumatology
|
|
Scooped by
Gilbert C FAURE
May 13, 3:28 AM
|
Autoantibody flares are important drivers of pathology in systemic lupus erythematosus (SLE), highlighting the pivotal role of B cells in initiating and propagating chronic autoimmunity. Although autoreactive specificities are a normal feature of the naive B cell repertoire, these cells are normally suppressed by layered tolerance checkpoints that limit inappropriate activation. Autoimmune-prone environments can lower these tolerance thresholds, rendering naive autoreactive B cells more sensitive to aberrant cues. Cytokines and other microenvironmental signals shape tissue niches that direct autoreactive B cells towards either germinal-centre or extrafollicular differentiation pathways. Germinal centres support the entry, selection and diversification of autoreactive B cells, with T cell help sustaining these repertoires. By contrast, naive autoreactive B cells entering the extrafollicular pathway exhibit an attenuated requirement for cognate T cell help and strong dependence on complement and TLR signalling. Emerging evidence continues to refine our understanding of germinal-centre and extrafollicular responses as complementary sources of autoreactive effector cells. With this progress, investigations into the origin, development, longevity and tissue dynamics of autoreactive memory B cells as chronic sources of autoantibodies are warranted. Although broad B cell depletion therapies have yielded benefit, a key challenge now is developing precision strategies that selectively target pathogenic B cell subsets. Autoreactive B cells normally held in check by tolerance checkpoints can be driven towards germinal-centre or extrafollicular differentiation in autoimmune environments. This Review examines the cellular, molecular and contextual cues that shape these pathways and considers their implications for systemic lupus erythematosus pathogenesis and therapy.
|
|
Scooped by
Gilbert C FAURE
April 22, 9:47 AM
|
Listen to this episode from Rheumatology Notebooks on Spotify. Podcast on "2023 ACR/EULAR antiphospholipid syndromeclassification criteria".Created with NotebookLM.Intro and outro music created with Suno.Link to the paper: http:// dx.doi. org/ 10. 1136/ ard- 2023-224609
|


 Scoop.it!