Your new post is loading...

|
Scooped by
Gilbert C FAURE
December 27, 2013 10:35 AM
|
is the most recent part of Immunology! It appeared less than 40 years ago, while systemic immunity exploded 60 years ago. It is still a minor part of Immunology teaching and research, while the mucosal immune system is at the frontline of encounters with germs, antigens... in other words the environment. major keywords: > 450 posts IgA http://www.scoop.it/t/mucosal-immunity?q=IgA > 125 posts tolerance http://www.scoop.it/t/mucosal-immunity?q=tolerance > 400 posts : microbiome http://www.scoop.it/t/mucosal-immunity?q=microbiome july 2015: almost 2100 scoops, >1700 visitors, >3900 views november 2017 >10K views of >3300 scoops june 2020 >17.6K views, >5.5K visitors, >4.5K scoops may 2024 >22K views, >6.9 visitors, >5.2 scoops
|
|
Scooped by
Gilbert C FAURE
February 4, 6:39 AM
|
Ever had a client ask: "Why does my kitten need to come TWO times for vaccines? Can't we just do it all at once?"
Let me break down the science in a way that might change how it act
🧬 The "Goldilocks Problem" of Maternal Immunity
Kittens are born with almost NO immunity from their mother during pregnancy. Unlike humans, cats have a special type of placenta that blocks antibody transfer before birth. Instead, 90-95% of protective antibodies come through colostrum in those critical first 16 hours of life (Claus et al., 2006).¹
But here's where it gets tricky...
These maternal antibodies are both a blessing and a curse:
✅ They protect vulnerable kittens from deadly diseases
❌ But they ALSO attack vaccine antigens, preventing the kitten from building their own immunity
This creates what scientists call the "window of susceptibility", a period where kittens are:
-Too vulnerable to fight off real infections
-Yet unable to respond to vaccines
Consider these exposure risks for "indoor-only" cats:
-Panleukopenia virus survives for YEARS in the environment and can be tracked indoors on shoes and clothing
-Multi-cat households where ONE cat goes outside creates risk for ALL cats
Here's what evidence-based feline vaccination looks like in #2026:
For Kittens: → Start at 6-8 weeks, continue every 2-4 weeks until 16-20 weeks → Core vaccines: FPV, FHV-1, FCV → FeLV for ALL kittens (remember that age-resistance curve!) → Rabies at 12-16 weeks → yearly booster
For Adult High-Risk Cats: → Annual booster of Core and Rabies
What challenges do you face while Vaccination?
#mianpetsandvets #VeterinaryMedicine #FelineHealth #VetMed #CatVaccination #VeterinaryEducation #CatsOfLinkedIn
|
|
Scooped by
Gilbert C FAURE
January 24, 7:33 AM
|
Sign in or join now to see posts like this one and more.
|
|
Scooped by
Gilbert C FAURE
January 12, 9:07 AM
|
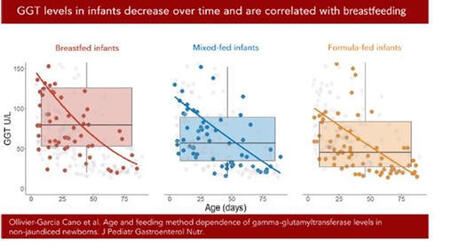
Une belle façon de démarrer 2026 ! Notre étude sur les taux de gamma-GT sanguins chez les nourrissons allaités vient d’être publiée dans le Journal of Pediatric Gastroenterology and Nutrition (JPGN). Ce travail, issu de la thèse d’Audrey Ollivier-Garcia Cano, a été mené en collaboration avec Marion Marlinge, Paul Guerry et Aurélie MORAND .
En médecine vétérinaire, le taux de gamma-GT est utilisé comme marqueur du transfert d’immunoglobulines via le colostrum chez les bovins (les IgG ne passant pas la barrière placentaire). Certaines études suggéraient par ailleurs que le lait maternel est riche en gamma-GT. Nous avons donc mené une étude rétrospective chez des nourrissons ayant eu un bilan hépatique et consultant aux urgences pédiatriques, en excluant ceux présentant une infection ou un ictère.
Les gamma-GT sériques étaient significativement plus élevées chez les enfants allaités (101 UI/l) que chez les non-allaités (64 UI/l), avec un niveau intermédiaire (77 UI/l) pour l’allaitement mixte. Nous avons également confirmé la diminution des gamma-GT avec l’âge.
Ces résultats soulignent l’importance d’interpréter les dosages de gamma-GT en fonction du mode d’allaitement. Ils rappellent aussi la richesse des approches pluridisciplinaires.
https://lnkd.in/dEnBgETK
|
|
Scooped by
Gilbert C FAURE
January 8, 1:43 PM
|
The gut virome is a complex ecosystem characterized by the interplay of diverse viral entities, predominantly bacteriophages and eukaryotic viruses. The gut virome has a critical role in human health by shaping microbial community profiles, modulating host immunity and influencing metabolic processes. Different viral metagenomics approaches have revealed the remarkable diversity of the gut virome, showing individual-specific patterns that evolve over time and adapt dynamically to environmental factors. Perturbations in this community are increasingly associated with chronic immune and inflammatory conditions, metabolic disorders and neurological conditions, highlighting its potential as a diagnostic biomarker and therapeutic target. The early-life gut virome is particularly influential in establishing lifelong health trajectories through its interactions with diet, immune pathways and others, thereby contributing to inflammatory and metabolic regulation. This Review synthesizes current knowledge of gut virome composition, dynamics and functional relevance, critically evaluating evidence distinguishing causal from correlative roles in disease pathogenesis. The interactions of the virome with other microbiome components and host immunity are examined, and emerging translational applications, including phage therapy and biomarker development, are discussed. Integrating these insights while acknowledging methodological challenges provides a comprehensive framework for understanding the complex roles of the gut virome in health and disease. The gut virome is a complex ecosystem and has a critical role in human health. This Review outlines gut virome composition and functional relevance, and its role in human health and disease. Methodological challenges in advancing our knowledge of the gut virome are also discussed.
|
|
Scooped by
Gilbert C FAURE
January 5, 4:21 AM
|
IgA friends at mucossl level and foes at systemic level… a new proof…
|
|
Scooped by
Gilbert C FAURE
January 2, 5:14 AM
|
I thought a banana was loaded with chemicals.
That’s until I found the ingredient list for human breast milk.
If you saw this list on a label, you might think it’s never been anywhere near a human.
And if you go by how they’re pronounced— you might be ready to starve an infant.
Good thing we don’t have anyone silly enough to believe that these chemicals are a bad thing…
——-
HUMAN MILK INGREDIENT LIST: Water, lactose, triacylglycerols [oleic acid, palmitic acid, linoleic acid, alpha-linolenic acid, stearic acid, lauric acid, myristic acid], phospholipids [sphingomyelin, phosphatidylcholine], cholesterol, free fatty acids [docosahexaenoic acid (DHA), arachidonic acid (ARA)]),
Oligosaccharides (2′-fucosyllactose, lacto-N-tetraose, lacto-N-neotetraose, 3′-sialyllactose, 6′-sialyllactose, fucosylated and sialylated oligosaccharides),
Milk Proteins (α-lactalbumin, lactoferrin, secretory immunoglobulin A, serum albumin, lysozyme, β-casein),
Minerals (potassium, calcium, chloride, phosphorus, sodium, magnesium, iron, zinc, iodine, copper, selenium, manganese),
Free Amino Acids (glutamic acid, glutamine, taurine, alanine, glycine, serine, threonine, valine, leucine, isoleucine, lysine, methionine, phenylalanine, tyrosine, tryptophan, cysteine, histidine),
Vitamins (vitamin A [retinol], vitamin D, vitamin E [α-tocopherol], vitamin K, vitamin C [ascorbic acid], thiamin [B1], riboflavin [B2], niacin [B3], pantothenic acid [B5], vitamin B6, folate [B9], vitamin B12),
Enzymes (bile salt–stimulated lipase, amylase, proteases),
Proprietary Blend (nucleotides, choline, phosphocholine, carnitine, inositol, polyamines),
Hormones & Growth Factor Blend (insulin, leptin, adiponectin, epidermal growth factor, insulin-like growth factor-1, transforming growth factor-β),
Cytokines & Immune Factor Blend (MicroRNAs, Living Cells (leukocytes, epithelial cells, stem-like cells)).
—-
#mammals #foodchemistry #foodscience #humanchemicalfactories #sciencerules | 80 comments on LinkedIn
|
|
Scooped by
Gilbert C FAURE
December 29, 2025 6:08 AM
|
Efficacy, Immunogenicity, and Safety of the Live-Attenuated Intranasal Pertussis Vaccine BPZE1: A Randomised, Placebo-Controlled Phase 2b Human Challenge Study in the UK:
The resurgence of pertussis is largely attributed to suboptimal vaccination coverage, particularly in countries that rely exclusively on acellular vaccines, which fail to induce mucosal immunity and generate minimal indirect (herd) protection. Consequently, sustained coverage levels above 95% are required to control transmission. BPZE1 is a live-attenuated Bordetella pertussis strain developed for intranasal administration, engineered through the genetic inactivation or deletion of three key virulence factors—pertussis toxin (PT), dermonecrotic toxin (DNT), and tracheal cytotoxin (TCT)—to safely prevent whooping cough while closely mimicking natural infection. This vaccine elicits robust Th1-biased cellular immunity alongside strong humoral responses. In a phase 2b human challenge study, intranasal BPZE1 vaccination prevented or markedly reduced infection following exposure to virulent B. pertussis, supporting its potential as a promising next-generation pertussis vaccine. Given its favorable safety profile, large-scale phase 3 clinical trials are warranted to confirm these findings and further assess its public health impact.
#pertussis
#pertussisvaccines
#mucosalvaccines
#nasalvaccines
https://lnkd.in/gukzy-aE
|
|
Scooped by
Gilbert C FAURE
December 24, 2025 8:10 AM
|
A mother's touch: microbial guardians of early immune imprinting
Trends in Immunology, Month 2025, Vol. xx, No. xx https://lnkd.in/gJuDgB4B
Group 3 Innate Lymphoid Cells (ILC3s) are a firmly established and universally accepted concept in immunology. They are considered the "innate counterparts" to T helper 17 (Th17) cells, as both share the master transcription factor, Retinoid-Related Orphan Receptor gamma t, and produce the cytokines IL-17 and IL-22.
This review:
· The Biological Paradigm: Infants are born with a pre-established "immune memory" despite developing in a relatively sterile environment. This in utero priming is driven by the maternal immune system and microbiota through a multi-modal exchange involving maternal microchimeric cells, IgG transfer, and microbiota-derived metabolites/antigens.
· Mechanisms of Action: Recent murine and human data demonstrate that maternal microbial products cross the placental barrier to actively fine-tune the fetal immune system. This results in antigen-specific immunological memory and epigenetic imprinting, effectively "programming" fetal immune cells before birth.
· Clinical Significance: This delicate priming process is highly susceptible to external stressors. Maternal dysbiosis, driven by diet, antibiotics, or infection, can disrupt these pathways, leading to aberrant immune development. Such prenatal perturbations are increasingly linked to the pathogenesis of autoimmune and immune-mediated disorders later in life.
Figure: Maternal factors that shape fetal immune priming.
During gestation, microbial and dietary antigens are trafficked across the placenta, partially via neonatal Fc receptor (FcRn)-mediated transport of immune complexes. These antigens are taken up by fetal dendritic cells (DCs) for priming of T cells, which are predisposed to differentiate into regulatory T cells (Tregs), thus establishing a level of immune tolerance toward commensals and dietary antigens before birth. Microbiota-associated metabolites, such as short-chain fatty acids (SCFAs) and tryptophan (Trp) derivatives, also cross the placenta and contribute to Treg priming, while maternal microchimeric cells take up residence in fetal tissues and promote tolerance of maternal antigens. Maternal interleukin (IL)-10 further promotes a tolerogenic immune milieu in the fetus, while, in situations of maternal immune activation (MIA), cytokines, such as IL-6 and IL-17, may skew newly activated T cells toward a more inflammatory profile, and alter the development of the intestinal epithelium and central nervous system. Dotted lines indicate pathways that are speculative.
|
|
Scooped by
Gilbert C FAURE
December 20, 2025 2:17 AM
|
|
|
Scooped by
Gilbert C FAURE
December 17, 2025 4:30 AM
|
The concept of structural immunity, as defined in this Perspective, posits that the first line of immune defence against foreign agents and tissue damage involves the preventative, physical reinforcement of tissue barriers and that this fundamental task can be directly or indirectly regulated by immune cells. Indeed, several types of leukocytes can help build protective barriers when required, potentially either by depositing matrix components themselves in certain circumstances or, more generally, by interactions with canonical structural cells and the existing extracellular matrix. This concept of structural functions of immune cells challenges the rigidity with which mammalian tissue organization and immune defence have been traditionally compartmentalized. Although there is strong momentum in the evidence for structural immunity that has been acquired so far, the field lacks a comprehensive overview of these data as well as a critical evaluation of this concept. Here, we place independent findings from several groups into a working model of immune cells as the architects of tissue barriers, to present a framework on which new concepts and findings in this area can develop. This Perspective presents a framework of ‘structural immunity’ that positions immune cells as architects of tissue structure. Beyond their roles in antimicrobial defence, we posit that immune cells contribute to tissue homeostasis by guiding structural composition and, in some cases, directly building barrier components.
|
|
Scooped by
Gilbert C FAURE
December 9, 2025 4:01 AM
|
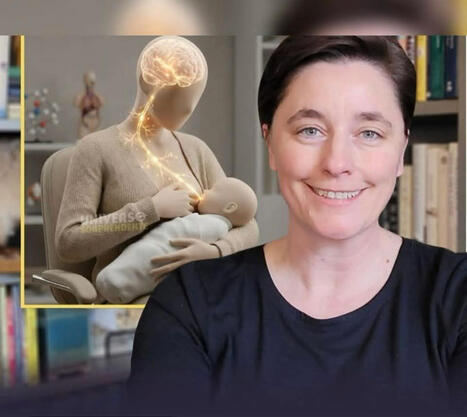
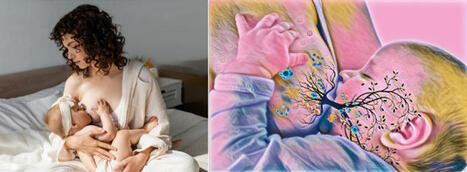
⚘️En 2008, la biologiste Katie Hinde a découvert quelque chose que la science avait ignoré pendant des siècles : le lait maternel n’est pas une recette fixe, c’est un message en perpétuel changement.
En étudiant des macaques en Californie, Hinde remarqua un motif étrange. Si la mère avait un petit mâle, son lait était plus épais, riche en graisses et en protéines (un carburant à haut indice d’octane). Si elle avait une petite femelle, le lait était plus abondant et chargé en calcium. Comment le corps de la mère savait-il modifier la formule chimique selon le sexe du bébé ?
Cela l’a conduite à découvrir le mécanisme le plus fascinant de la biologie humaine : le « flux rétrograde ».
Pendant des années, nous avons cru que le lait allait dans une seule direction (de la mère à l’enfant). Nous avions tort. Lorsqu’un bébé tète, le vide créé aspire une petite quantité de salive du bébé à l’intérieur du mamelon de la mère.
C’est là que se produit la magie : le tissu mammaire analyse cette salive. C’est un scanner biologique.
Si la salive contient des signaux indiquant que le bébé a de la fièvre ou une infection, le corps de la mère commence à fabriquer des anticorps spécifiques à cette maladie en quelques heures.
Si le bébé est stressé, le lait modifie ses niveaux hormonaux (comme le cortisol) pour influencer son tempérament.
Le lait change entre le matin et le soir. Il change si le bébé est malade. Il change selon qu’il est garçon ou fille.
Comme l’a conclu Hinde : « Le lait maternel est nourriture, médicament et signal ». C’est le système de communication le plus sophistiqué de la nature, une conversation silencieuse entre deux corps que même la technologie moderne n’a pas encore réussi à reproduire entièrement.
Validation historique et scientifique, Katie Hinde, PhD – Laboratoire de lactation comparée, Arizona State University.
vanhille.fr | 100 comments on LinkedIn
|
|
Scooped by
Gilbert C FAURE
December 3, 2025 3:48 AM
|
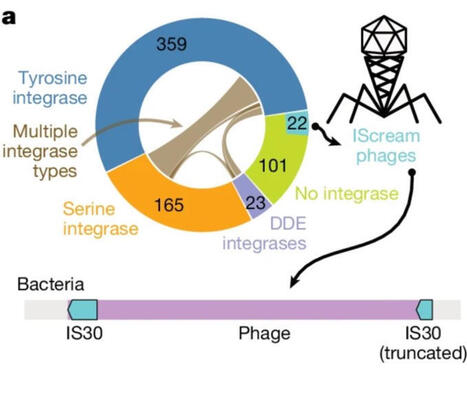
Gut Phageome: A New Frontier for Clinicians
A new Nature study using long-read metagenomics reveals that the human gut microbiome is far more dynamic than we thought
https://lnkd.in/dnVnetzX
Most gut bacteriophages (phages) are integrated in bacterial genomes, but a meaningful fraction are gained, lost, or even jump across bacterial species over time.
This means the gut microbiome is not just a community of bacteria - it’s an evolving genetic ecosystem shaped by phage–bacteria interactions.
Why it matters for clinical practice
Emerging evidence suggests that phage dynamics can influence:
• microbiome stability and dysbiosis
• inflammation and immune tone
• responses to antibiotics, diet, and microbiome-targeted therapies
Phage-aware diagnostics and therapeutics (including targeted phage cocktails) are already entering early clinical and translational research.
Take-home for clinicians:
1. The virome matters: Gut phages may become essential in interpreting microbiome results and understanding dysbiosis.
2. Therapies will evolve: Next-generation probiotics, FMT, and phage therapy will likely consider phage–bacteria interactions.
3. Expect personalization: Phage patterns may soon help stratify patients and guide individualized microbiome interventions.
Understanding the phageome is becoming a key part of understanding our gut
|
|
|
Scooped by
Gilbert C FAURE
February 4, 6:43 AM
|
Each year, vast clouds of dust journey from the Sahara to Europe. But they don't travel alone. They carry a hidden cargo of millions of microbes.
Now, a team from the University of Lisbon, powered by MGI's sequencing tools, is investigating how this invisible migration is reshaping Portuguese agriculture. Their discovery during Storm Célia—a bacterial genus with potential as a powerful bio-fertilizer—turns an environmental phenomenon into a beacon of biotechnological hope.
|
|
Scooped by
Gilbert C FAURE
February 1, 12:53 PM
|
Prior seasonal influenza virus immunity did not impair antibody responses or protection conferred by the intranasal H5N1 vaccine.
|
|
Scooped by
Gilbert C FAURE
January 14, 7:48 AM
|
GUT MICROBIOTA IN EARLY CHILDHOOD DEPENDS ON THE MICROBIOTA OF BREAST'S MILK
The establishment of the gut microbiome in early life is critical for healthy infant development.
Mother's milk is crucial for shaping the infant gut microbiome by delivering beneficial bacteria, prebiotics, antibodies, and immune cells, fostering the growth of helpful microbes like Bifidobacterium and reducing pathogens, which is vital for immune development, nutrient absorption, and protection against chronic diseases.
This maternal transfer, via a gut-milk-infant pathway, helps establish a stable, healthy gut ecosystem that supports long-term health.
In an Open Access paper in Nature Communications, the results of an important study on the relationship between intestinal microbiota and breast milk in early childhood.
In this study, the authors quantified the similarity between the maternal milk and the infant gut microbiomes.
They used 507 metagenomic samples collected from 195 mother-infant pairs at one, three, and six months postpartum.
Microbial taxonomic overlap between milk and the infant gut was driven by Bifidobacterium longum, and infant microbiomes dominated by B. longum showed greater temporal stability than those dominated by other species.
They also identified numerous instances of strain sharing between milk and the infant gut, involving both commensal (e.g. B. longum) and pathobiont species (e.g. K. pneumoniae).
Shared strains also included typically oral species such as S. salivarius and V. parvula, suggesting possible transmission from the infant’s oral cavity to the mother’s milk.
At one month, the infant gut microbiome was enriched in biosynthetic pathways, suggesting that early colonisers might be more metabolically independent than those present at six months.
Lastly, they observed significant overlap in antimicrobial resistance gene carriage within mother-infant pairs.
Together, these results suggest that the human milk microbiome has an important role in the assembly, composition, and stability of the infant gut microbiome.
Ferretti, P., Allert, M., Johnson, K.E. et al. Nat Commun 16, 11536 (2025). https://lnkd.in/eD92fRkM
|
|
Scooped by
Gilbert C FAURE
January 12, 8:57 AM
|
Deux études parues dans « Nature Cancer » décrivent comment des niveaux élevés de bactéries infiltrant les tumeurs affaiblissent la réponse immunitaire, favorisant une résistance à l’immunothérapie dans les cancers de la tête et du cou.
|
|
Scooped by
Gilbert C FAURE
January 7, 4:45 AM
|
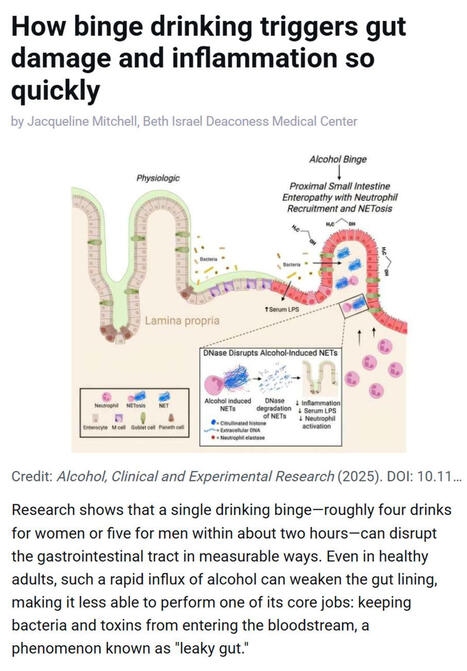
Research shows that even a single episode of binge drinking - about four drinks for women or five for men within two hours - can weaken the gut barrier, allowing #bacteria and #toxins to enter the bloodstream and trigger #inflammation, a process often referred to as “leaky gut.”
▫️ Investigators at Beth Israel Deaconess Medical Center (BIDMC), in work published in Alcohol: Clinical and Experimental Research, found that short bursts of high-dose #alcohol recruit immune cells called #neutrophils to the upper small intestine, where they release damaging structures known as NETs that disrupt the gut lining.
▫️ NETs stands for Neutrophil Extracellular Traps. They are web-like structures made of #DNA, histones, and antimicrobial proteins that are released by neutrophils to trap and kill #microbes. While NETs are part of the body’s innate immune defense, they can also damage surrounding tissues when produced excessively or inappropriately - such as after binge alcohol exposure - by disrupting barriers like the gut lining, promoting inflammation, and allowing bacteria or toxins to leak into the bloodstream.
▫️ The study, led by Scott Minchenberg, MD, PhD, a clinical fellow in #gastroenterology and #hepatology at BIDMC, showed that breaking down these NETs with an enzyme reduced gut damage and bacterial leakage.
▫️ As noted by senior author Gyongyi Szabo MD, PhD, Chief Academic Officer at BIDMC and Beth Israel Lahey Health, these findings highlight an early inflammatory pathway linking binge drinking to gut and liver injury.
🗃️ See comments section for reference.
|
|
Scooped by
Gilbert C FAURE
January 4, 3:51 AM
|
Mucosal glycans: key drivers of the development of inflammatory bowel disease and a potential new therapeutic target - Nature Reviews Gastroenterology & Hepatology
|
|
Scooped by
Gilbert C FAURE
January 1, 4:29 AM
|
Une découverte inattendue sur notre immunité ?
Des chercheurs japonais révèlent un rôle peu exploré de la salive.
📌 Ce qu’il faut savoir
Une équipe de l’Université de Tokyo a analysé la salive de 476 volontaires.
Leurs travaux, publiés dans Nature Communications, identifient des fragments génétiques jusqu’ici peu décrits, portés par certaines bactéries de la bouche.
➡️ Ces fragments, appelés Inocles, sont présents chez près de 3 personnes sur 4.
Il s’agit de petits morceaux d’ADN supplémentaires, distincts de l’ADN principal des bactéries.
Ils ne sont pas indispensables à leur survie, mais semblent leur conférer des capacités d’adaptation accrues, notamment pour faire face aux contraintes constantes de l’environnement buccal (alimentation, acidité, hygiène…).
👉 Pourquoi est-ce important ?
Parce que la bouche n’est pas qu’un simple point de passage. C’est un écosystème biologique dense et actif, où :
-un microbiote complexe cohabite en permanence
-certaines bactéries interagissent avec notre organisme
-ces interactions pourraient être associées à des variations de la réponse immunitaire
Ce que les chercheurs ont observé chez les personnes porteuses d’Inocles :
-une activité immunitaire différente
-notamment au niveau de cellules clés de l’immunité adaptative
Autrement dit, ce qui se passe dans la bouche pourrait influencer la manière dont notre système immunitaire se régule.
Quels liens ont-ils fait avec le cancer ?
Les chercheurs ont également observé que certaines personnes atteintes de certains cancers présentaient moins d’Inocles.
Il ne s’agit ni d’un lien causal, ni d’un traitement, mais d’une piste de recherche encore très précoce.
⚠️ À ce stade, ces résultats sont observationnels. Ils ouvrent de nouvelles questions, mais nécessitent encore de nombreuses études pour être confirmés. | 37 comments on LinkedIn
|
|
Scooped by
Gilbert C FAURE
December 27, 2025 10:43 AM
|
Head and neck #cancer is the seventh most common cancer worldwide.
This JAMA Review summarizes the epidemiology, clinical presentation, diagnosis, and treatment of head and neck squamous cell carcinomas (#HNSCC) of the upper aerodigestive tract.
https://ja.ma/4q6rxjn
|
|
Scooped by
Gilbert C FAURE
December 21, 2025 4:08 AM
|
Just as a curiosity.
"Chris Buck stands barefoot in his kitchen holding a glass bottle of unfiltered Lithuanian farmhouse ale. He swirls the bottle gently to stir up a fingerbreadth blanket of yeast and pours the turbulent beer into a glass mug.
Buck raises the mug and sips. “Cloudy beer. Delightful!”
He has just consumed what may be the world’s first vaccine delivered in a beer. It could be the first small sip toward making vaccines more palatable and accessible to people around the world. Or it could fuel concerns about the safety and effectiveness of vaccines. Or the idea may go nowhere. No matter the outcome, the story of Buck’s unconventional approach illustrates the legal, ethical, moral, scientific and social challenges involved in developing potentially life-saving vaccines."
https://lnkd.in/gdPZRTsV
|
|
Scooped by
Gilbert C FAURE
December 18, 2025 4:23 AM
|
Now published open access. ‘Since the early 1950s, national statisticians have regarded unpaid work as non-economic, excluding it from GDP. Feminist scholars argue this exclusion reflects a gender-biased view of progress that renders women’s non-market productivity invisible. As what gets measured drives policy priorities and resource allocation, breastfeeding highlights the need to account for women’s unpaid care work in economic statistics. This paper advances the Beyond GDP agenda by demonstrating how market-derived prices can improve the measurement and recognition of women’s lactation labour.’
|
|
Scooped by
Gilbert C FAURE
December 12, 2025 1:45 PM
|
We are proud to share newly published work from the Sjögren’s Foundation led by Foundation authors Kristie Cox, PhD and Matt Makara, MPH, now available in the Journal of Dental Research.
This review examines the connection between oral pathology and systemic disease in Sjögren’s disease, the current challenges in diagnosis and treatment, and the importance of integrated models of care that address both oral and systemic manifestations.
Highlights from the publication:
• A strong connection between oral pathology and systemic disease, including neuropathies, exists with Sjögren’s disease
• Current diagnostic and treatment paradigms are insufficient and there is a need for advanced and integrated approaches
• A multidisciplinary and patient centered model may improve outcomes and quality of life
Read the abstract:
https://lnkd.in/e2iBfjcg
See Figure 1 from the article on Salivary Gland Pathophysiology:
https://lnkd.in/eQaQUSjD
|
|
Scooped by
Gilbert C FAURE
December 5, 2025 7:10 AM
|
𝗡𝗲𝘄 𝗥𝗲𝘀𝗲𝗮𝗿𝗰𝗵: 𝗧 𝗰𝗲𝗹𝗹𝘀 𝗶𝗻 𝘁𝗶𝘀𝘀𝘂𝗲𝘀 𝗱𝗶𝗳𝗳𝗲𝗿 𝗺𝗮𝗿𝗸𝗲𝗱𝗹𝘆 𝗳𝗿𝗼𝗺 𝘁𝗵𝗼𝘀𝗲 𝗶𝗻 𝗯𝗹𝗼𝗼𝗱 - 𝗿𝗲𝘀𝗵𝗮𝗽𝗶𝗻𝗴 𝗵𝗼𝘄 𝘄𝗲 𝗲𝘃𝗮𝗹𝘂𝗮𝘁𝗲 𝘃𝗮𝗰𝗰𝗶𝗻𝗲𝘀 𝗮𝗻𝗱 𝗶𝗺𝗺𝘂𝗻𝗼𝘁𝗵𝗲𝗿𝗮𝗽𝗶𝗲𝘀
A new study in Immunity from Washington University School of Medicine in St. Louis reveals that #Tcells residing in tissues such as the #tonsils differ significantly from T cells circulating in the #blood. This challenges long-standing assumptions in #immunology and could transform how we assess immune responses to #vaccines, #infections, and #immunotherapies.
In one of the largest single-cell datasets of human T cells ever generated, researchers analyzed 5.7 million T cells from paired tonsil tissue and blood samples of 10 donors. Led by Dr. Naresha Saligrama, the team found profound differences in T cell subtypes and functions between compartments even within the same individual.
Why does this matter?
▪️ Less than 2% of the body’s T cells are actually in the blood, yet blood is currently the standard sample type used for immune monitoring.
▪️Many specialized T cells - including resident memory T cells and T follicular helper cells - exist almost exclusively in tissues, not blood.
▪️Tissue location can shape a T cell’s phenotype and its ability to recognize specific antigens.
🔍 Significance
This study highlights the need for a more tissue-aware approach to evaluating immune responses. Relying solely on blood samples may overlook critical populations of T cells that drive protection, disease progression, or therapeutic responses. Future vaccine design, #immunotherapy evaluation, and clinical diagnostics may need to incorporate location-specific immune profiling to truly understand human #immunity.
🗃️ See comments section for reference.
|
|
Scooped by
Gilbert C FAURE
November 29, 2025 5:07 AM
|
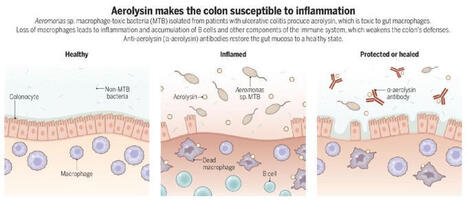
A toxin-secreting gut bacterium may fuel ulcerative colitis by killing protective immune cells that maintain intestinal homeostasis, according to a new study in Science.
The findings suggest potential for new treatment strategies.
📄: https://scim.ag/4oXOowT
#SciencePerspective: https://scim.ag/4a69oN6
|