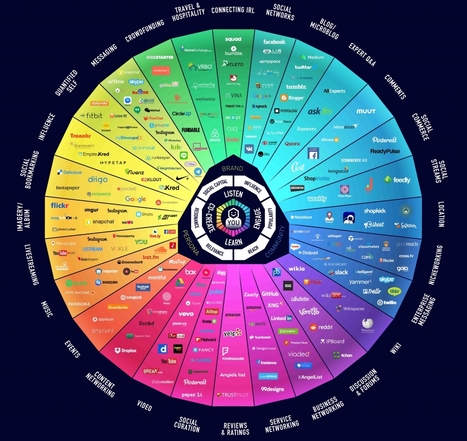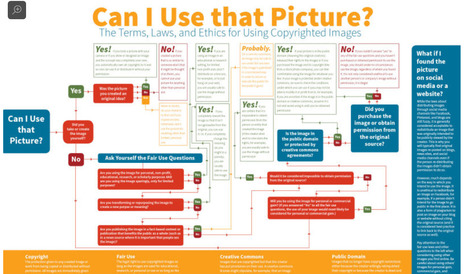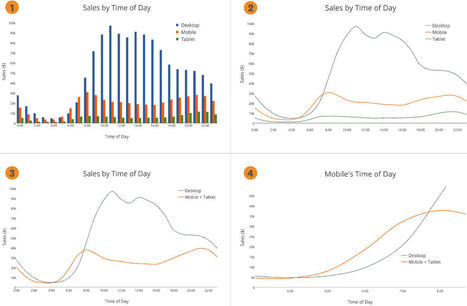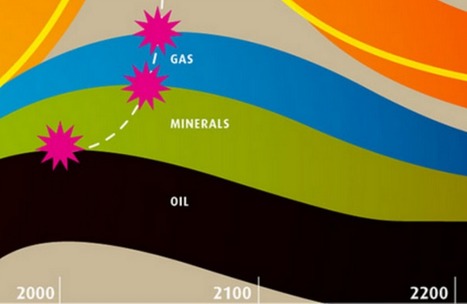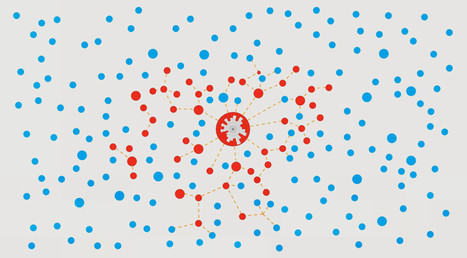
This video, the Value of Data Visualization, makes a compelling case for how infographics exploit visual clues like color, size, and graphic orientation to help us understand complex stories. Naturally, they use infographics to do it. . .
Get Started for FREE
Sign up with Facebook Sign up with X
I don't have a Facebook or a X account


This video, the Value of Data Visualization, makes a compelling case for how infographics exploit visual clues like color, size, and graphic orientation to help us understand complex stories. Naturally, they use infographics to do it. . .

 Your new post is loading...
 Your new post is loading...
Your new post is loading...
|
From
youtu

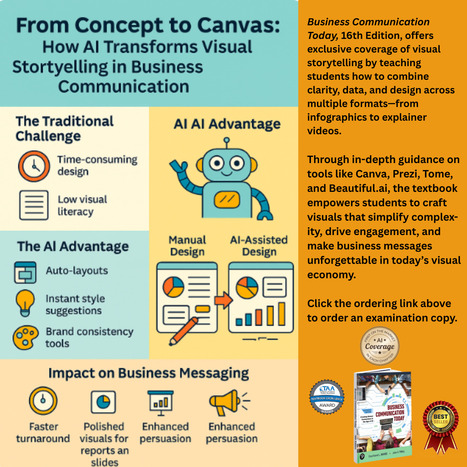
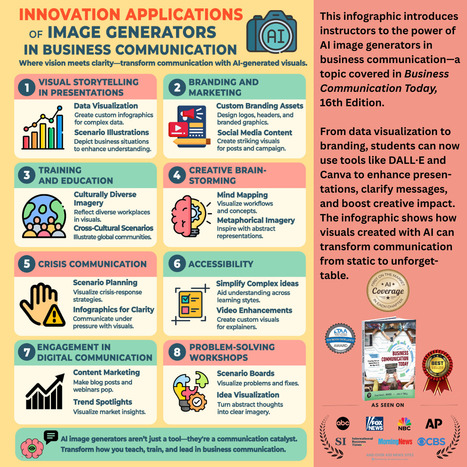
Imagine teaching a visual communication chapter that truly prepares students for today's AI-powered workplace. Chapter 9 of Business Communication Today, 16th Edition, by Bovee and Thill, delivers exactly that – and here's what makes it revolutionary.
Business Communication Today, 16th Edition, by Bovee and Thill, deliver exactly what students need to succeed in our AI-enhanced world. That's the promise of Chapter 9.

From
flippingbook
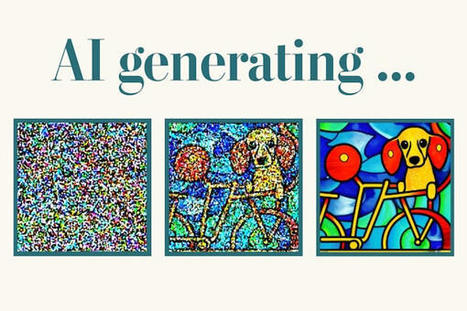
Learn how to use visuals to captivate, persuade, and stand out—with real examples of powerful visuals."
|