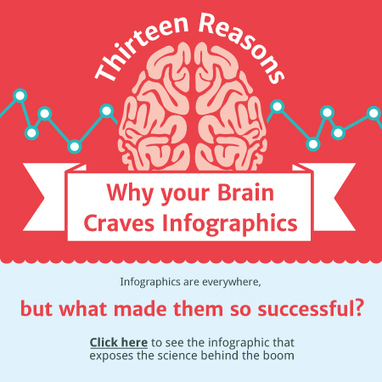

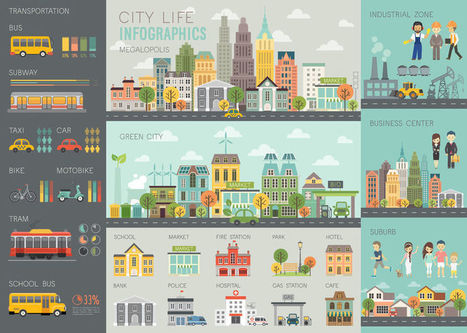
Enjoy our interactive infographic that exaplains why infographics are so successful today.

 Your new post is loading...
 Your new post is loading...
Your new post is loading...
Enjoy our interactive infographic that exaplains why infographics are so successful today. 
No comment yet.
Sign up to comment
Pinterest lets you organize and share all the beautiful things you find on the web. It's a social networking and social publishing site based on photos and videos. . .
Bovee & Thill's Online Business Communication Magazines's insight:
Hotels aren't always completely honest when it comes to the photos they post on their websites. Professional reviewers from hotel review website Oyster visited vacation properties from Barbados to Boston, and the photos they took didn't quite match up with the online fantasy. This latest collection of "photo fakeouts" serves as a cautionary tale for anyone planning a vacation and relying solely on hotel websites. Some of these photo "upgrades" are so egregious, you'll think you are looking at pictures of two completely different properties. Prepare to be shocked! . . .
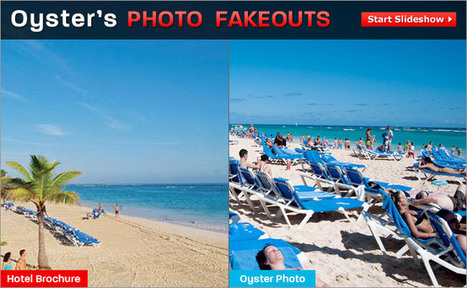
"Be sure to check out these visuals before your next trip."
Bovee & Thill's Online Business Communication Magazines's insight:
Oyster visits hotels in person, takes hundreds of photos of each, and posts them so our visitors know exactly what they're booking into. There's a huge difference between the photos we take and the ones on other travel sites.

The stunning designs you'll find via this blog post are proof that it's not PowerPoint or Keynote that are to blame for mediocre presentations, but the way they are used.
To quote the author: "There’s a certain art to putting together a solid presentation and PowerPoint and Keynote are the primary tools of the trade. The “art” comes into play when you’re trying to set yourself apart; so how you use the tools is of great importance.
Often it is the design of the presentation itself that does the trick. In an effort to help you put together a great-looking presentation, here are 28 examples of creative presentation designs using Powerpoint and Keynote." . . .
Bovee & Thill's Online Business Communication Magazines's insight:
Here is stunning computer-generated imagery. These are pictures created by professionals in the field, and the end results look like photographs. . .

Venezuelan artist Jesus Gonzales Rodriguez creates mind-twisting images by putting together multiple photographs of a person and cutting along the edges.
Every image is made up of a frontal and side-view photograph pieced together to form an optical illusion in which the portraits look normal at a glance, but only until your eyes detect the outlying visage. . . Via Barb Jemmott
Get inspired by the following 16 examples of data visualization that communicate interesting information with both style and substance.
Bovee & Thill's Online Business Communication Magazines's insight:
"Data can be very powerful. If you can actually understand what it's telling you, that is. "It's not easy to get clear takeaways by looking at a slew of numbers and stats. You've got to have the data presented in a logical, easy-to-understand way.
"Enter data visualization. The human brain processes visual information better than it processes text -- so using charts, graphs, and design elements, data visualization can help you explain trends and stats much more easily."
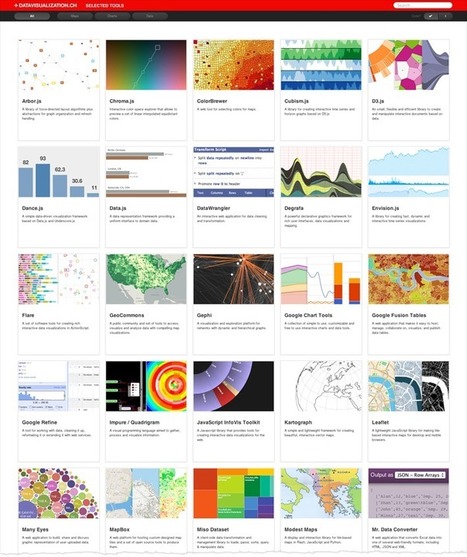
Here are libraries for plotting data on maps, frameworks for creating charts, graphs and diagrams and tools to simplify the handling of data. Even if you’re not into programming, you’ll find applications that can be used without writing one single line of code. Many of these tools are relatively simple to use, and others are more advanced. . .

This is a tutorial website in which the history of visual communication is covered from cave paintings to the present day digital systems. . .
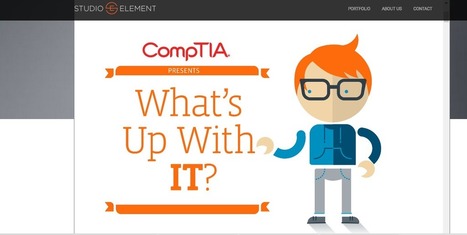
Effective visual storytelling requires rethinking your approach to visual hierarchy, investing time in designing the small visual details, and going beyond marketing’s perception of a brand. Here are 7 tips from Studio Element’s Brian Barrus on helping brands tell their story. Via José Carlos, Rosário Durão

"I’m sure I won’t blow your mind by saying that visuals are essential to creating content that will help your business stand out and draw in an audience. Not only do images help make text-centric content more readable, digestible, and memorable, but they can also be used to craft compelling messages that speak volumes without using a single word — just ask anyone who has posted a photo on Instagram or created a “Snap” to share a memorable moment with friends." Via Jeff Domansky
Bovee & Thill's Online Business Communication Magazines's insight:
"Nearly a year ago, I compiled a collection of best-practice tips from some of the industry’s most creative and design-minded content experts, along with helpful imaging tools and examples. But, considering how rapidly visual trends come and go, we at CMI felt it was time to take another look at how to let your brand’s photos, videos, and graphics do the talking. Tags:

Jeff Domansky's curator insight,
September 30, 2016 11:22 PM
Very useful resource for visual tips and tools to help you create compelling content.
Bovee & Thill's Online Business Communication Magazines's insight:
Who needs makeup when you can airbrush your photos? That's the question photography major Anna Hill, a senior at East Carolina University, is asking with her new photo series, "Beauty Is Only Pixel Deep," self-portraits that mock the beauty industry's overuse of airbrushing applications that many magazines and other media use to retouch images. "I taught myself Photoshop when I was 14, and ever since, my eye is trained to see exactly where models have been altered," Hill tells Yahoo Shine. . .
|
"For the first in any business communication text, a section is devoted to infographics."
Bovee & Thill's Online Business Communication Magazines's insight:
Infographics are a special class of diagrams that can convey both data as well as concepts or ideas. In addition, they contain enough visual and textual information to function as independent, standalone documents. They've become a staple of online communication in recent years and are becoming important business communication tools in such areas of process design, training, and even résumés.

Bovee & Thill's Online Business Communication Magazines's insight:
Video has become a core business medium. In fact, one could argue that video is almost as revolutionary as social media, given how many business messages that were once delivered in written format are now delivered via video. And just as document design, presentation slides, web writing, and other tasks moved out of the specialist realm and became mainstream skill expectations, many employees are now expected to be able to do basic video work for training courses, product demos, video news releases, customer service, and other routine applications. With companies such as Zappos encouraging video uploads from job applicants, video could become significant in employment communication as well.

Bovee & Thill's Online Business Communication Magazines's curator insight,
September 10, 2013 4:31 PM
This video discusses an important medium that has now, for the first time, been integrated into a business communication text's visual media chapter. And just as document design, presentation slides, web writing, and other tasks moved out of the specialist realm and became mainstream skill expectations, many employees are now expected to be able to do basic video work for training courses, product demos, video news releases, customer service, and other routine applications.
Bovee & Thill's Online Business Communication Magazines's curator insight,
September 26, 2013 7:01 PM
Video has become a core business medium. In fact, one could argue that video is almost as revolutionary as social media, given how many business messages that were once delivered in written format are now delivered via video. And just as document design, presentation slides, web writing, and other tasks moved out of the specialist realm and became mainstream skill expectations, many employees are now expected to be able to do basic video work for training courses, product demos, video news releases, customer service, and other routine applications. With companies such as Zappos encouraging video uploads from job applicants, video could become significant in employment communication as well. 
Powerful facts about visual communication, especially the way graphics affects us both cognitively and emotionally.
Bovee & Thill's Online Business Communication Magazines's insight:
Did you know that visuals are processed 60,000 times faster than text? Or how about the fact that they are processed simultaneously? Ever wonder why you can process visuals so much faster than text? This is because visuals are processed simultaneously whereas words are processed sequentially. Did you know that visual imagery is more powerful than words alone when used to communicate a message to an audience. . .
Humans are visual creatures. Most of us process information based on what we see. 65 percent of us are visual learners, according to the Social Science Research Network.
Bovee & Thill's Online Business Communication Magazines's insight:
Humans are visual creatures. Most of us process information based on what we see. 65 percent of us are visual learners, according to the Social Science Research Network.

From blogs to short 140-character tweets to pictures, social media content is transforming from text to images.
Bovee & Thill's Online Business Communication Magazines's insight:
Use visuals – pictures, images, infographics, videos, graphics, slideshows, and animations – to create emotional connections with a company, says Donna Moritz, a visual marketing specialist and founder of the blog Socially Sorted. Try to showcase not just your product, but also the culture and message behind a brand, she adds. NOTE: You'll find a full chapter on Designing Visual Communication in Business Communication Today, 11th Edition. It's the only business communication text on the market that helps students understand visual communication and teaches students visual design principles. Business Communication Today also (1) Discusses the principles of graphic design that ensure effective visuals, (2) Explains how to avoid ethical lapses when using visuals, (3) Explains how to choose which points in a message to illustrate, (4) Describes the most common options for presenting data in a visual format, (5) Describes the most common options for presenting information, concepts, and ideas, and (6) Lists the three criteria for reviewing visuals in order to verify the quality of the visuals. Order an examination copy of Business Communication Today now by emailing samplingdept@pearson.com.

Created by Bovee and Thill, the authors of the best-selling college textbooks in business communication for more than 25 years, and the recognized leaders in social and electronic media.

Visual communications, especially presentations, are an opportunity to distill complex information into digestible pieces. Here’s a collection of visual communication blogs to inspire your next great presentation.
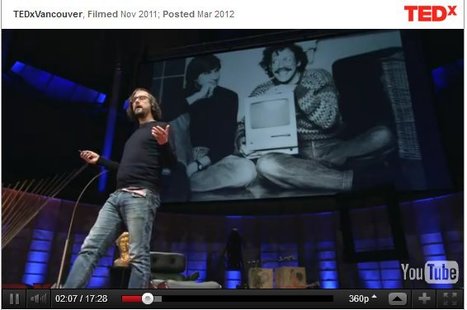
Jer Thorp creates beautiful data visualizations to put abstract data into a human context. At TEDxVancouver, he shares his moving projects, from graphing an entire year’s news cycle, to mapping the way people share articles across the Internet. . .
You can create infographics - visual representations of data - from scratch using free web tools. Educator Linda W. Braun takes you step by step.
Bovee & Thill's Online Business Communication Magazines's insight:
You can create infographics, visual representations of data, from scratch using free web tools. Library consultant and educator, Linda W. Braun, takes you step by step through making your own infographics using easel.ly and info.gram. . .

Winn Trivette II (mrenglish101@gmail.com)'s curator insight,
January 20, 2013 12:48 PM
very helpful! 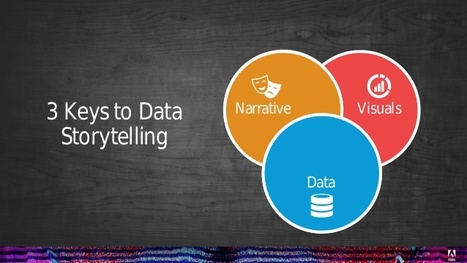
The hot new concept in data visualization is "data storytelling."
Bovee & Thill's Online Business Communication Magazines's insight:
Here are some important questions about data storytelling:
"The format alone virtually guarantees viral sharing provided you follow these steps to make sure your infographic doesn’t disappoint."
Bovee & Thill's Online Business Communication Magazines's insight:
"Put together the words “information” and “graphic”, and you have information conveyed in visual form. It is also commonly understood that infographics most often contain multiple, related facts about a single topic.
"When Pinterest first burst on the scene, the big viral share incentive used to be pictorially witty or wise quotes, but these have become over-used. If you really want people to share your information, present it as a well-thought-out infographic." . . .
Visit Bovee & Thill's Video Channel where you'll see more than 45 videos from Bovee & Thill, the authors of the world's leading textbooks in business communication and business writing.
|