Here are some of the points made this video:
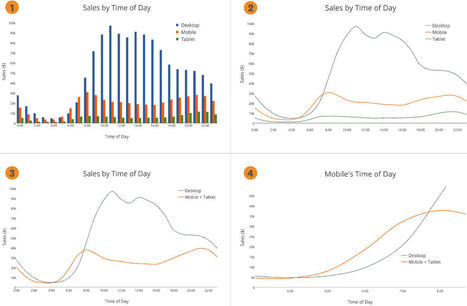
- Visual representations of data make comparative perspectives easier
- Scraping (gathering) and graphically representing them can make patterns far easier to notice
- One data set may offer a certain picture, but when combined with another data set, a very different
picture (eg. refining perspectives on statistics about a nation’s totals by checking again per capita)
- Evolving data sets can produce evolving infographics
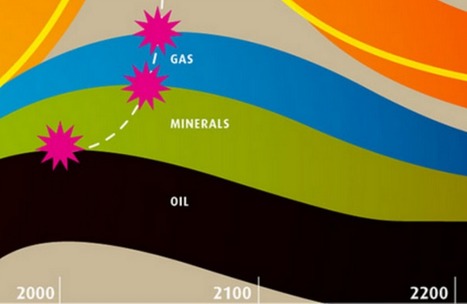
- Data can change thought and behavior. “Let my data set change your mindset.” – Hans Rosling
- Sometimes it’s emotionally easier to learn by visuals than by statement.


 Your new post is loading...