Primary geography
4.8K views |
+0 today


 Your new post is loading...
 Your new post is loading...
Your new post is loading...
 Scoop.it!
Aboriginal concepts connecting people to 'Country' and living things through a web of relationships have a lot in common with the English ter Via India Evans 

India Evans's curator insight,
March 22, 2016 9:16 PM
This video, made by the CSIRO, is slightly advanced video for Stage 3, however it is an excellent resource in demonstrating the close connection Indigenous Australians have to the land and to protecting the biodiversity. It is therefore necessary to crop the video into easily understandable sections, or to stop and start the video, with useful discussion of unknown definitions or concepts or context. The video shows a strong contrast between mainstream Non-Indigenous Australian attitudes waste and a low focus on reuse, to the strongly cemented ideals of reuse and the importance of a reciprocal relationship with the environment held by Indigenous Australian groups. Section 3:09 to 4:05 highlights this deeply ingrained Indigenous Australian belief in reuse, and that one item or plant may have a wide range of uses. The example given here are the many uses of one of the local tree species that has over 5 different uses within the community. This video is an appropriate Indigenous Australian resource as it has been made with input from multiple Indigenous Australian cultural groups, many Indigenous Australian ecological groups and the AIATSIS. The video also includes a disclaimer at the conclusion of the video for the maps used within the video. The information is balanced in nature and respectful of Indigenous Aboriginal culture. Dr Fiona Walsh, who is the speaker in this video, works closely with Indigenous Australian groups, rangers and organisations to improve the biodiversity and trends in ecological condition (CSIRO, 2015). CSIRO, (2015) Staff Directory - Dr Fiona Walsh, Accessed from http://people.csiro.au/W/F/Fiona-Walsh
Scoop.it!
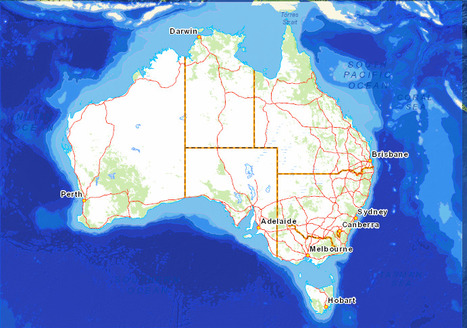
An interactive map that shows all the states and territories of Australia. It also details rivers, rainforests, deserts, lakes, etc. Great for engaging a stage 2 class. Via Anushka Vannitamby

Anushka Vannitamby's curator insight,
March 29, 2016 9:53 PM
Syllabus Links: GE2-1 - examines features and characteristics of places and environments - description of natural features of Australia eg deserts, rivers, mountains - location of Australia’s states, territories and major cities Why is this resource useful? - It can be implemented into activities to allow students to engage digitally in active, hands on learning. In the Linn (1997) study students showed preference using digital technologies over traditional methods when collecting. and presenting data. - It can be used to give students a visual depiction of Australia as a country, as teachers can either locate the states and territories or ask students to search and locate it themselves. - This resource can be used with a whole class, in small groups, or individually. - Students are integrating maps, illustrations and sketch maps into their geographical understanding. What does this resource include? This interactive map allows students to explore Australia and its physical features. The map provides detail by including: - rivers - rainforests - sand - lakes - railways - populated areas - recreational areas When can this resource be used? This resource can be used at the beginning of the topic to help students identify the location of states and territories. It can also be used when students start learning about the geographical features of each state e.g. desert, rivers How can this resource be used? - Sketch maps have been found to be effective in developing map concept skills in primary students (Taketa, 1996). Students can be provided with a large blank map in groups of 2-3. Using colours, students can differentiate between dry and wetland and can use symbols to mark where certain physical features and landforms are located e.g. Rivers, waterbodies. - Students can make judgements on the environmental features of different parts of Australia e.g. NSW will have a denser population and more water ways as opposed to Central Australia and make notes around the map provided. - The teacher can describe a location and students must find it on the interactive map. This can planned as a class game. References: BOSTES NSW. (2016). K-10 Geography Syllabus. Retrieved from http://syllabus.bostes.nsw.edu.au/hsie/geography-k10/ Linn, S. E. (1997). The effectiveness of interactive maps in the classroom: A selected example in studying Africa. Journal of Geography, 96(3), 164-170. Taketa, R. (1996) Using Field Sketch Mapping to Teach Basic Mapping Concepts in Elementary School Geography, Journal of Geography, 95:3, 126-130, DOI: 10.1080/00221349608978704
Scoop.it!

Maps are geographical tools that are used to locate, visualise, represent, display and record spatial data. Primary teachers can use an ICT such as Story Maps as part of a geographical inquiry. Develop and create geographic tools such as Story Map to represent, sythesise and communicate findings of a geographical inquiry.
Scoop.it!

The Mind of the Mapmaker: Purpose and Point of View in Maps. A blog post at "Teaching with the Library of Congress" on 2016-02-26.
Catherine Smyth's insight:
Geographical tools such as maps open up the world for primary students. Adapt teaching strategies from this American site for an Australian context.
Scoop.it!
Catherine Smyth's insight:
Examples of how to plan geographical inquiry for F-6 students.
Scoop.it!
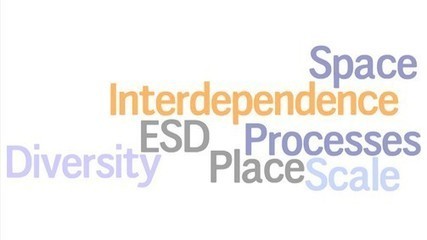
The GA supports primary and secondary geography teachers through teaching resources, geography journals, CPD events, Barnaby Bear, Worldwise and more.
Catherine Smyth's insight:
Drawing on current research and thinking, Liz Taylor, Lecturer in Geography Education at Cambridge university unpacks geographical concepts and reflects on how teachers develop geographical understanding with their students.
Scoop.it!
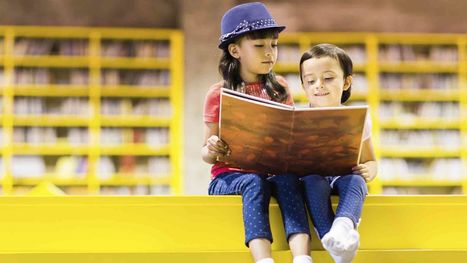
Spatially challenging picture books can help young children develop their ability to mentally manipulate objects, a skill connected to creative pursuits and

Jasmine Chan's curator insight,
April 9, 2016 9:28 AM
Outcome:
Inquiry question: Where are places located in Australia? This resource provides teachers with an insightful reflection on the importance of developing spatial skills through appropriate picture books. Especially for young students in Early Stage 1 and Stage 1, ‘spatially challenging picture books’ can develop spatial thinking and provide exposure to spatial language in an engaging way (Dillemuth In Kris, 2015). For young students, teaching mapping explicitly often proved to be problematic rather than beneficial (Liben & Downs, 1994, p. 557). As such, teachers can use the picture book to ignite interest and curiousity about geographical concepts. Teaching ideas: Some examples of appropriate picture books for Stage 1 are: - Lucy in the City: A story about developing spatial thinking skills by Julie Dillemuth - Henry’s map by David Elliot - Katy and the Big snow by Virignia Lee Burton - Piggies in the Pumpkin Patch by Mary Peterson and Jennifer Rofe Katy and the Big Snow portrays an amazing map of ‘Geoppolis’, which is revisited when the town is snowed in and Katy, the tractor must plow out sections of the town. Katy needs to figure out where she needs to go next and this book incorporates directions and spatial relationships between the city and its surroundings. After reading this book as a class, students will explore the city closely and draw their own maps of their ideal city using symbols and labels. Students will be able to use their creativity, as they think about ways in which places and spaces can be better designed (ACARA, 2011, p. 8). Teachers need to also ensure students draw to scale, being aware of the distance between the city services and shops and the size of buildings and smaller objects. This also addresses and links to Stage 1 Mathematics Outcome, ‘MA1-9MG measures, records, compares and estimates lengths and distances using uniform informal units, metres and centimetres’ (Board of Studies NSW, 2012, p. 22). References: Australian Curriculum, Assessment and Reporting Authority. (2011). The shape of the Australian curriculum: geography. Sydney, NSW. Retrieved 8th April, 2016 from http://www.acara.edu.au/verve/_resources/shape_of_the_australian_curriculum_geography.pdf ; Board of Studies NSW. (2012). NSW Syllabus for the Australian Curriculum: Mathematics K-10 Syllabus. Sydney, NSW. Retrieved 8th April, 2016 from http://syllabus.bostes.nsw.edu.au/mathematics/mathematics-k10/ ; Kris. F.D. (2015). KQED News: 15 Picture books that support children’s spatial skills development. Retrieved 8th April, 2016 from http://ww2.kqed.org/mindshift/2015/12/18/15-picture-books-that-support-childrens-spatial-skills-development/ ; Liben, L., & Downs, R. (1994). Fostering Geographic Literacy from Early Childhood: The contributions of interdisciplinary research. Journal Of Applied Developmental Psychology, 15(4), 549-567. Retrieved 8thApril, 2016 from https://www.researchgate.net/publication/222739971_Fostering_geographic_literacy_from_early_childhood_The_contributions_of_interdisciplinary_research
Scoop.it!
This animation is designed to help teachers to tune into the grand narrative of Australian Curriculum Geography.
Scoop.it!
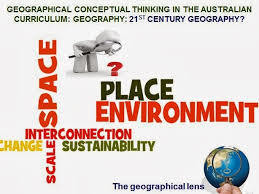
The Nature of Geography Via Maree Whiteley

Maree Whiteley's curator insight,
August 5, 2015 4:08 AM
Some very interesting definitions about 'Geography' and 'Why Geography?' in this article..." all geographic teaching and learning should relate to the human need to know, emphasizing "Why care?" The definition presented here identifies in simple, easily taught, and easily learned terms the extreme complexity of geography.
Scoop.it!
Catherine Smyth's insight:
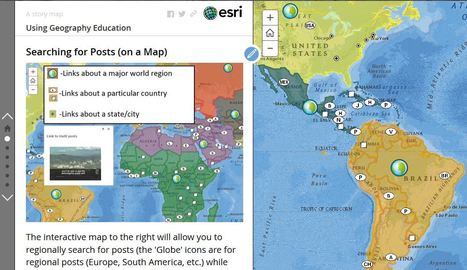
Shifting to a disciplinary-based approach to teaching geography in the primary classroom requires a clear grasp of the big ideas in the discipline. Explore how scoop.it curator Seth Dixon organises knowledge for geography education.

Ruth Reynolds's curator insight,
December 3, 2016 9:33 PM
Just getting familiar with ArcGis and lots of ideas picked up at #ncss16

Olivia Campanella's curator insight,
September 5, 2018 4:09 PM
This map is a very helpful, useful and fun guide on how to get the most of this website and to learn about geography and different places and facts of the world.

Dominic Mappas's curator insight,
June 5, 2019 6:41 AM
This source allows its viewers to select countries to direct them to a series of topic links. This allows the audience to interact and explore the world through visual representation of the globe. I can see this being implemented for warm up activities, quizzes and practice questions. Great source!
|
Scoop.it!
Vital Signs of the Planet: Global Climate Change and Global Warming. Current news and data streams about global warming and climate change from NASA. Via Ga eun Lee

Ga eun Lee's curator insight,
April 10, 2016 9:23 AM
Climate change tools What is this resource about? This particular resource is a geographical tool that display a world map with a series of visualizations, which shows how some of Earth's key climate indicators such as sea ice, levels, carbon dioxide and global temperatures are changing over time (Boek, 2016). The website is broken into 4 categories and each show the change from the past to 2015, with keys in Carbon dioxide and Global temperature to assist students with interpreting data. It would allow students to realize human influence on climate change through compare and contrast of the past images to the present. Why is this effective? The device would be an effectual resource to use with the website and video in the previous scoop, about pollution in our playground ‘Climate change starts from the pollution in our playground’ in order to clearly address the influence of human activity in changing our environment over time. The resource specifically addresses the outcomes and content of the syllabus through the differences in the statistics and images in comparison to the past, clearly depicting the firm bond between humans in altering the natural environment. Through the use of technological geographical tool, students can effectively examine human activity’s immense impact on our natural environment as it “enable students to use and experience powerful cognitive tools… used by students as ‘intellectual partners’, and as a device to analyze and interpret their understanding” (Herrington & Kervin, 2007, p.1). Also, engages students with English as a second language, special needs or lower achieving students to explore with the images, participate in the activity, helping their comprehension of the effects of climate change (Wakeman, Karvonen & Ahmuda, 2013, p.9). Also, the resource could support stage 3 students to be involved in higher order thinking as the tools require them to evaluate data (Herrington & Kervin, 2007, p.1). Activities with the geographical tool: 1. Divide students into groups and allocate topics of sea ice, sea levels, carbon dioxide and global temperatures. 2. For each of the topic, students are to use the geographical tool to collect data or as a supporting resource to the information they’ve found in their research. In this process, address the expectancy for students to visit sites appropriately (teachers should monitor students using the computers). 3. Students are to examine the cause, drawing back on their activity on pollution and effect by using the tools and additional research on the topic. Modification for ESL & special needs students: For research, ask students to use the tool and draw what has caused these changes, drawing on their prior knowledge from the previous activity (Strom, 2014) 4. Students are to present their topic as “formalized peer learning can help students learn effectively…enhance the quality of education,” encourage students to be responsible for their own learning and enhance their apprehension of the impact of pollution on climate change (Boud, Cohen & Sampson, 2002). Reference: Boek, M. (2016). Climate Time Machine. Retrieved 10 April, 2016, from http://climate.nasa.gov/interactives/climate-time-machine ; Boud, D., Cohen, R., & Sampson, J. (2002). WHAT IS PEER LEARNING AND WHY IS IT IMPORTANT?. Retrieved 9 April 2016, from https://web.stanford.edu/dept/CTL/Tomprof/postings/418.html ; Herrington, J & Kervin, L, Authentic learning supported by technology: 10 suggestions and cases of integration in classrooms. Educational Media International, 44(3), 219-236. Strom, E. (2014, 3 January). Understood for learning and attention issues. [Weblog]. Retrieved 9 April 2016, from https://www.understood.org/en/learning-attention-issues/treatments-approaches/educational-strategies/common-modifications-and-accommodations ; Wakeman, S., Karvonen, M., & Ahumada, A. (2013) Changing instruction to increase achievement for students with moderate to severe intellectual disabilities. Teaching Exceptional Children 46(2), 6-13. doi:10.1177/004005991304600201 
Rosie Paijmans's curator insight,
April 22, 2017 9:35 AM
In this resource students investigate how the natural environment influences people and places, for example: (ACHGK028). The activity I would use which utilizes this resources is designed to facilitate students learning and stimulate discussion concerning how climate influences the distribution of where people live. This resource allows students to view how global warming impacts and changes the natural landscape on a map. The resource has four maps one shows a rise in global temperatures from 1883 to 2015, another displays carbon dioxide increase from 2012 to 2014, there is also a map which displays the loss of sea-ice levels and another which maps the rise of sea levels in three areas around the world. These maps allows students to see the changes in climate, due to global warming and how this in turn affects the earth, as well as what these impacts could have on the lives of people around the world. This resource is easy for students to use and each different display of global warming, has a myriad of discussion topics that could lead of this. for example; in the 'rise in sea level map' questions such as "why do you think Amsterdam loses so much land in the 'sea level' interactive map?" this could lead on to topics about which areas would be most adversely affected by climate change such as pacific island countries, ect. This exercise should help students to understand how the natural environment can have a huge impact on people and place. In particular students should be shown that as sea levels rise people have to move inland. Students will also investigate how the natural environment influences people and places, for example: (ACHGK028) discussion of how climate influences the distribution of where people live. as well as adhering to content descriptor 'comparison of how landforms influence where and how people live in Australia and another countries'. References: Board of Studies, Teaching and Educational Standards NSW. (2015). HSIE K–6: Guide to the NSW History and Geography syllabuses. Sydney, Australia:
Scoop.it!

Michelle Ko's curator insight,
April 5, 2016 7:49 PM
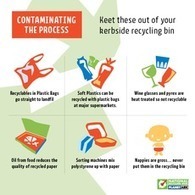
As a way of exploring and communicating with the world, geographers use ‘geographical tools’, such as graphs, statistics and visual representations. For that, in NSW K-10 Geography Syllabus, the importance of providing students with opportunities to ‘engage with each geographical tools during each Stages of learning’ (BOSTES, 2015, p.26) has been highlighted. Considering this, the National Recycling Week Planet Ark webpage can be a valuable resource that can be used by students in the elaboration stage of 5’E models (Krewaldt, Boon, 2012, p.136), for the topic ‘protection of environments’ of Stage 2 Geography. The website shares a number of pictograms and graphs, which state the facts about recycling and waste management issues within Australia. The data is well represented, and easy to read, which can encourage students’ access. Teachers may encourage students to use the website, especially the pictograms and the data, for research purpose to elaborate their understanding of the topic, by collecting and analysing the data (Kriewaldt and Boon, 2012, p.136). (Other related pictographs and visual data can be retrieved from this link) New South Wales. Board of Studies, Teaching and Educational Standards, author. (2015). Geography K-10 syllabus: NSW syllabus for the Australian curriculum. Board of Studies.
Scoop.it!

Travelbugs is an online community exclusively for school students to learn about different cultures around the world by communicating, collaborating and sharing information with children living in different countries. Students can view photos and written posts that other children publish as well as share their own knowledge by writing about their own country in which they live. Overall, students are able to explore and compare the daily life of people from different places in an authentic way which addresses outcome GE2-2 as students "describe the ways people, places and environments interact" (Board of Studies NSW, 2012). It also allows students to move from the local to a more global perspective which is important to help students make deeper connections and understandings of their world (Kriewaldt, 2012, p. 182). Links with English and ICT: There are links with English and ICT as students develop their literacy skills through reading and writing online posts as well as learning how to use and navigate websites. As Jacobs (2013) suggests, technology-rich environments help students to develop multiliteracies as they make meaning using a variety of cues including “visual, gestural, audio, spatial and linguistic modes” (pp. 100-102). Safe, responsible and ethical use of ICT: While the use of online blogs can enhance the learning environment, there could be potential teaching implications if teachers do not allocate time to teach students about the “safe and responsible use of the Internet” (Morgan, 2014, p. 380). For instance, students should be reminded not to reveal any private information and to be respectful at all times as published posts will be available for others to see and should be monitored closely by teachers. References: Board of Studies NSW. (2012). Geography K-10 syllabus: NSW syllabus for the Australian curriculum. Sydney Board of Studies NSW. Jacobs, G. E. (2013). Multi, Digital, or Technology? Journal of Adolescent & Adult Literacy, 57(2), 99-103. doi: 10.1002/JAAL.227 Kriewaldt, J. (2012). Progression in understanding in geography. In T. Taylor, C. Fahey, J. Kriewaldt & D. Boon. Place and Time. Explorations in Teaching Geography and History. Frenchs Forest: Pearson Australia Morgan, H. (2014). Taking advantage of web 2.0 technologies: Classroom blogging basics. Childhood Education, 90(5), 379-381. Via Jessica So
Scoop.it!
Geographical tools such as maps are used by geographers to acquire, process and communicate geographical information. Use maps in the classroom to locate, visualise, represent, display and record spatial data. Via Rachael Jack

Rachael Jack's curator insight,
April 5, 2016 7:45 AM
This resource is a geographical tool that provides students with information about the Australian continent. This resource is a map of the world that can be zoomed onto the Australian Continent and customised by adding text boxes and images onto the map. Using the resource: • This resource links to the following content: “location of Australia’s states, territories and major cities” (BOSTES, 2012, p. 47). • This resource links to the outcome GE2-1 "examines features and characteristics of places and environments" (BOSTES, 2012, p. 47). • Teachers should provide scaffolded instruction about how to use the map. • This is a great resource should be used in a summary lesson on the Australian Continent. This is because students can use the resource to illustrate their collected data on the Australian Continent through ‘zooming into’ Australia and customising the map by adding images and information about Australia’s natural features and cities, states and territories. This activity should be completed cooperatively, in small groups, as this will improve students’ motivation, social and geographical skills (Aydin, 2011). • Through presenting information on the map, students will develop their geographic understanding about the Australian continent. This is because students must process the information before presenting the data which requires students to “think critically about its meaning and significance” (Gilbert & Hoepper, 2014, p. 77). • Students will also develop important geographical skills in producing and interpreting maps and data selection (Gilbert & Hoepper, 2014). References: Aydin, F. (2011). Geography teaching and metacognition.Educational Research and Reviews, 6(3), 274. Board of Studies NSW (n.d.). Teaching Strategies and Practices in Human Society and Its Environment. Retrieved 9 April, 2016 from https://dei.eduone.net.au/gumflat/curriculum/HSIESyllabus/k6HSIEteachunitsofwork.pdf ; Gilbert, R., & Hoepper, B. (2014). Teaching humanities and social sciences: History, geography, economics & citizenship in the Australian curriculum (Fifth ed.). South Melbourne, Victoria: Cengage Learning Australia. National Geographic (n.d.). Map maker interactive. Retrieved 5 April, 2016 from http://mapmaker.nationalgeographic.org/?ls=000000000000
Scoop.it!
This definition of Geography was endorsed in November 2010 by the: Australian Academy of Science’s National Committee for Geography, Australian Geography Teachers’ Association, Geographical Society of New South Wales, Institute of Australian Geographers, Royal Geographical Society of Queensland, and Royal Geographical Society of South Australia.
Catherine Smyth's insight:
What is geography? What is geographic inquiry? How do geographers think about the world? These 3 questions are at the core of disciplinary knowledge.
Scoop.it!
Catherine Smyth's insight:
Practical teaching ideas for developing a sense of PLACE using photographs and sketches.
Scoop.it!
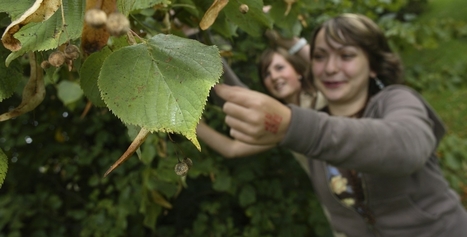
The GA supports primary and secondary geography teachers through teaching resources, geography journals, CPD events, Barnaby Bear, Worldwise and more.
Scoop.it!
Throughout 2011 and 2012, the Board of Studies NSW developed new K–10 syllabuses for English, Mathematics, Science (incorporating Science and Technology K–6) and History that incorporate agreed Australian Curriculum content.
Catherine Smyth's insight:
Sample units aligned to the BOSTES Geography K-10 syllabus.
Scoop.it!
The Queensland Spatial Educators’ Toolkit inspires teachers with ideas on how to use spatial technologies in the classroom.
Scoop.it!
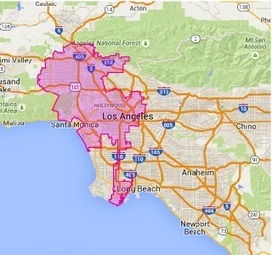
Today we have spent sometime going through our Map Tools archive and curated for you the collection below. These are some of the best tools out there that you can use with you students in class to create, annotate and share maps. We invite you to check them out and share with your colleagues. Via Gumersindo Fernández, Yashy Tohsaku
Catherine Smyth's insight:
Useful mapping tools for teaching geography in the primary classroom.

Jamie Mitchell's curator insight,
March 8, 2016 12:15 AM
Useful mapping tools for teaching geography in the primary classroom. |