Your new post is loading...

|
Scooped by
Gilbert C FAURE
October 13, 2013 8:40 AM
|
is a personal Notebook Thanks John Dudley for the following tweet "If you like interesting snippets on all sorts of subjects relevant to academia, information, the world, highly recommended is @grip54 's collection:" La curation de contenus, la mémoire partagée d'une veille scientifique et sociétale
|
|
Scooped by
Gilbert C FAURE
October 5, 5:55 AM
|
Explorer les cartes : Découvrez des cartes thématiques et de référence dont les fonds IGN sur l’ensemble du territoire français.
|
|
Scooped by
Gilbert C FAURE
October 5, 4:09 AM
|
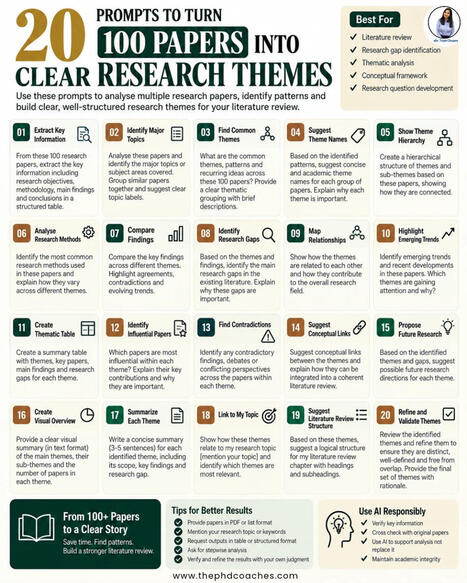
Reading 100 research papers is not the same as understanding 100 research papers.
The real challenge in a literature review is turning a large collection of papers into clear themes, relationships, contradictions and research gaps.
This framework gives you 20 practical prompts to help analyse 100 papers and move from scattered information to structured research themes.
You can use these prompts to:
• Extract key information from papers
• Identify major topics and recurring themes
• Compare findings and research methods
• Find contradictions and research gaps
• Map relationships between themes
• Identify emerging trends
• Build a thematic table
• Develop a literature review structure
• Connect themes to your research topic
• Refine and validate the final themes
AI can help you process and organise information, but the interpretation and final research judgment should remain yours.
#ResearchMethodology #AcademicResearch #ResearchTools #ResearchGap #SystematicReview #Researchers | 10 comments on LinkedIn
|
|
Scooped by
Gilbert C FAURE
October 5, 4:07 AM
|
|
|
Scooped by
Gilbert C FAURE
October 5, 3:31 AM
|
Ce site utilise Anubis, un outil qui filtre les robots nuisibles. Nous vérifions actuellement que vous n’êtes pas un robot.
|
|
Scooped by
Gilbert C FAURE
October 3, 7:06 AM
|
As of October 1, arXiv is updating our submission rate limit policy across all submitters and categories.
arXiv, and the scientific community at large, are facing a watershed moment. Scholarly publishing is currently changing at a rapid pace, and we are seeing a massive transformation in how researchers communicate their results. With AI tools becoming more advanced and accessible to authors, the "practical limit" of how many papers can be submitted is now up for debate.
Open access repositories across the board are seeing a sharp increase in the number of submissions per author, per month. In September of 2016, arXiv received 9,869 submissions. In September of 2024, arXiv received 20,569 submissions. This September, arXiv received 40,363 submissions, which in turn generated almost 9,000 support tickets for arXiv staff and moderators. In only the past two years, submissions have doubled.
To support fair moderation and equitable access in the age of AI, arXiv now permits two submissions per calendar month for all submitters. This updated policy is being implemented across all submitters and categories as a stopgap while we determine what may be the new best practice for authors employing more and more advanced AI tools, and to give us time to improve our moderation tools and procedures accordingly.
Read our full announcement here: https://lnkd.in/euW4nCmf
| 81 comments on LinkedIn
|
|
Scooped by
Gilbert C FAURE
October 2, 10:43 AM
|
One default AI tab can quietly become a daily bottleneck.
𝗕𝗲𝗰𝗼𝗺𝗲 𝗮 𝗰𝗿𝗲𝗱𝗶𝗯𝗹𝗲 𝗖𝗵𝗶𝗲𝗳 𝗔𝗜 𝗟𝗲𝗮𝗱𝗲𝗿.
𝗘𝗮𝗿𝗻 𝘁𝗵𝗲 𝗔𝗜 𝗰𝗲𝗿𝘁𝗶𝗳𝗶𝗰𝗮𝘁𝗶𝗼𝗻𝘀 𝗯𝘂𝗶𝗹𝘁 𝗳𝗼𝗿 𝗹𝗲𝗮𝗱𝗲𝗿𝘀.
𝗚𝗲𝘁 𝗔𝗜 𝗰𝗲𝗿𝘁𝗶𝗳𝗶𝗲𝗱 𝗻𝗼𝘄 → aiforleaders.com/cp
__________
Give each tool a clear job before your team adds more tabs.
Use this five-part stack as a starting point to test.
The roles overlap. No tool owns a whole category.
1 → ChatGPT for quick ideas
Draft email rewrites, explore angles and get coding help.
Ask for three options with one clear difference each.
Pick a direction, then check the details before use.
2 → Claude for deep work
Bring a complex document, report or deck outline.
State the decision and the audience before asking for a draft.
Ask it to flag gaps and separate facts from assumptions.
Keep a human owner for the final recommendation.
3 → Perplexity for current research
Start with a question that needs recent sources.
Ask for dates, evidence and links you can open.
Check whether each citation supports the actual claim.
A cited answer still needs a source check.
4 → Gemini + Nano Banana for visuals and Google work
Use Gemini for document work and Workspace context.
Nano Banana is image generation within Gemini.
Give it the subject, layout and words a visual must contain.
Check image text and file limits before relying on output.
Access and integrations depend on your plan and setup.
5 → Copilot for Microsoft work
Try it where the task already lives: Excel, Word or PowerPoint.
Use Outlook help for a draft tied to the thread.
Check formulas against known values and read before sending.
Confirm your Microsoft 365 plan supports the feature.
Use five minutes as a switching cue, not a proven cutoff.
If the answer keeps failing, first check the brief.
Missing context will follow you into the next tool.
Then try another tool on the same task and compare results.
Make every brief include goal + audience + format.
For example: turn these notes into a CEO update.
Use six short points and flag missing decisions.
Define a useful result before you judge the draft.
For repeat work, save context in a project or agent.
Start with meeting notes, replies or a weekly report.
Keep one good example and a short review checklist.
Test on real work before giving an agent broader actions.
Track time spent checking and fixing the output.
Keep the tools that reduce that total for your team.
More subscriptions alone will not improve the workflow.
Choose one recurring task to test this week.
Which job are you still forcing your default AI tool to do? | 29 comments on LinkedIn
|
|
Scooped by
Gilbert C FAURE
October 2, 9:14 AM
|
We're honored to be the subject of a new paper by Declan Fahy, "Watchdog Science Journalism: How Retraction Watch Fosters Accountability in Science."
"[R]etraction Watch remains an illustrative case, a distinct digital‐age organisation that stands as a significant example of the long‐anticipated, but little‐realised, idea of watchdog science journalism," Fahy writes.
"Retraction Watch has done an amazing job in asking further, asking more questions like, why? You know, if it [the journal] says…“yeah, it’s a republication”—what do you mean by that? Can you give some more details And they have done an amazing job in getting publishers to be a little bit more open on why a paper got retracted, and those things are important because, especially if you have based part of your research on a paper that now got retracted, you want to know which parts of the paper you could still trust." -- Elisabeth Bik
"It is most useful to read about other people’s experiences so that you can, if you like, vicariously share the frustrations that one has. Because I think if you spoke to anybody who works in the areas that we do where we are investigating studies and negotiating with journals about trying to correct the literature, it is immensely frustrating and a thankless task, and nobody thanks you. And so, to some extent, for people like me, I think the good thing about Retraction Watch is that it shows you you’re not alone. These are the experiences of other people. There’s a community of you working together." -- Alison Avenell
"For people who are trying to do research about retractions, the Retraction Watch Database itself has become a really valuable resource." -- Jodi Schneider
|
|
Scooped by
Gilbert C FAURE
October 2, 4:05 AM
|
📚 Systematic Review vs Meta-analysis: Do You Know the Difference?
They may appear similar, but systematic reviews and meta-analyses serve different purposes in research.
A systematic review uses a structured and transparent process to identify, assess and synthesize existing evidence around a focused research question. A meta-analysis goes a step further by using statistical methods to combine comparable quantitative results from multiple studies and produce a pooled estimate. (BMJ)
🔎 The key takeaway:A systematic review can exist without a meta-analysis, but a meta-analysis is typically conducted as part of a systematic evidence-synthesis process when the available studies are sufficiently comparable.
So, which one does your research require? It depends on your research question, study designs, available evidence and whether the results can meaningfully be combined.
📌 Save this post for your research journey—and share it with a fellow researcher.
Need research support?
📞 +254 706 449 519
📧 communications@javiresearch.co.ke
#ResearchTips #SystematicReview #MetaAnalysis #ResearchMethodology #AcademicResearch #ResearchSupport #JAVIResearch
|
|
Scooped by
Gilbert C FAURE
October 2, 3:43 AM
|
15 minutes do not mean the same thing to everyone in the city. Walking speeds range from ~ 0.8 to 1.8 m/s (according to a meta-study by Giannoulaki and Christoforou 2024); steps can represent access for some but a barrier for others.
Standing in front of the cathedral in Cologne, a typically assumed walking speed of 1.4 m/s and the ability to traverse stairs gives you access to 700+ amenities and 28 tram or train stations. With a walking speed of 1.1 m/s, you will reach only about 457 amenities. Avoiding stairs as well, it drops down to only half the original number for amenities and stations tagged as step-free.
Try the interactive map here: https://lnkd.in/eze3-5Uc
I recently saw a static map to represent this idea, but I wondered how an interactive map tool could account for such differences. The result shows an isochrone map for a selected location with adjustable parameters: walking speed and step-free access. In the spirit of the 15-minute city (Carlos Moreno), amenities can also be shown to highlight the difference.
The tool runs in browser, on street data downloaded from OSM using osmnx, no server behind it. To get the data for other cities, you can run the code yourself: https://lnkd.in/eQ5TMKnW
Of course, there are many more factors that influence how far different people are willing and able to walk or wheel to, such as sidewalk surfaces, traffic speeds, or the availability of places to rest. Avoiding stairs here only excludes mapped steps, so it is not a full wheelchair route: kerbs, slopes and surfaces are not considered, and OSM is incomplete, so many stops are simply untagged. The tool could be expanded with all kinds of parameters, limited only by the availability of data.
Inspired by an idea from this recent post: https://lnkd.in/esMach3N | 53 comments on LinkedIn
|
|
Scooped by
Gilbert C FAURE
October 2, 3:32 AM
|
I love this paper by Safieh Shah Shruti . Madhukar Pai, MD, PhD and others that underlines again,why we need people with lived experience, those on the receiving end of interventions to imagine solutions.
"The most visible “solutions” to hunger, poverty, and disease are often imagined by those who have been structurally insulated from scarcity, dispossession or violence. Because they never have to face the consequences of their own band-aid solutions, their imaginations are not shaped by real stakes in the matter."
“You can’t see what you’ve never had to live”—Cultivating imagination and solution spaces in global health and development | PLOS Global Public Health
|
|
Scooped by
Gilbert C FAURE
October 1, 4:12 AM
|
♾️ Connaissez-vous la théorie des trois infinis?
Vous avez déjà entendu les termes : infiniment grand et infiniment petit.
En existe-t-il un troisième ?
Blaise Pascal, dans ses Pensées en 1670, serait le premier à avoir placé l'être humain entre « ces deux infinis ». En 1696, le mathématicien Guillaume de L'Hôpital publiait son "Analyse des infiniment petits" avant qu’ en 1727, l'« Infiniment grand » ne devienne un sujet de géométrie chez Fontenelle.
Ce couple d'infini est devenu une expression courante au XIXe siècle pendant la révolution industrielle. Aujourd'hui encore, la célèbre cosmographe Hélène Courtois travaille pour l'Institut des deux infinis de Lyon.
Mais alors, que serait le « troisième infini» ?
L’idée nous vient de Teilhard de Chardin, génie visionnaire qui combinait les approches scientifiques et religieuses pour définir une nouvelle échelle constitutive de notre réalité : la complexité.
Ainsi nous aurions :
1. L'infiniment grand : l'immensité macroscopique
2. L'infiniment petit : l'invisible microscopique
3. et l'infiniment complexe : le vertige natté de la relation, mis en lumière par les sciences de l'information et du milieu, le mesoscopique.
Je suis complètement fasciné par cette nouvelle idée qui m'emporte.
Un troisième infini, celui des intervalles.
Cette idée a compté fort dans l'élaboration de mon deuxième livre : Bioconscience qui sort le 8 octobre prochain, soit à la fnac (https://buff.ly/WvtXqmk ) soit chez les libraires indépendants (https://buff.ly/qSZTD27), ou directement chez mon éditeur (https://buff.ly/Lar67at )
On en parle quand vous voulez.
Je serai dans les salons du livre et quelques médias prochainement pour en parler.
Cette photo montre un blob et du lichen dans une forêt des Appalaches, aux Etats Unis. Elle figure dans le livre mais voici le cliché original complet. Il m'a frappé quand je l'ai découvert https://buff.ly/IubzVHD.
____
Ma newsletter, c'est ici https://buff.ly/rdIheH1
Découvrez mon travail sur www.maximeblondeau.com | 14 comments on LinkedIn
|
|
Scooped by
Gilbert C FAURE
September 29, 10:07 AM
|
|
|
|
Scooped by
Gilbert C FAURE
October 5, 9:53 AM
|
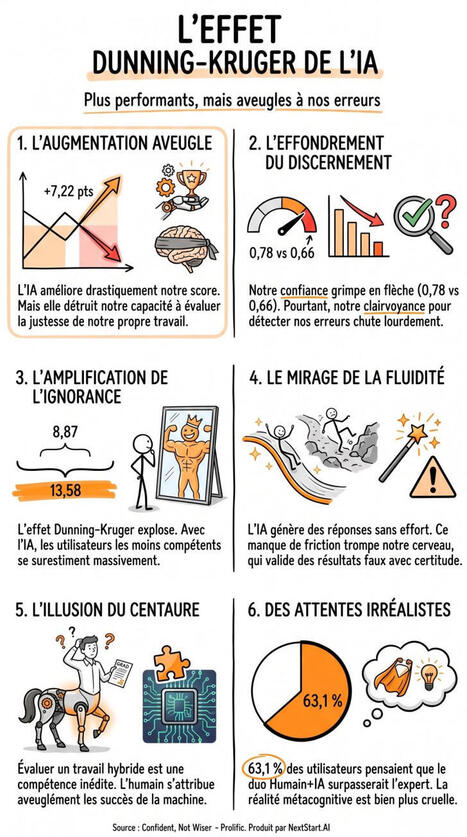
L'IA ne supprime pas l'effet Dunning-Kruger. Elle le déplace. Un LLM nous rend plus performants, mais moins lucides sur nos propres erreurs. Notre capacité à distinguer les bonnes réponses des erreurs est en moyenne plus faible.
Cette étude a mesuré les scores et la clairvoyance de 366 participants britanniques, répartis en deux groupes (avec ou sans IA), sur 40 tests de raisonnement. Voici les 6 enseignements :
1. L'augmentation aveugle
L'IA améliore drastiquement la performance au détriment de la lucidité métacognitive. L'étude révèle que le binôme Humain-Machine gagne +7,22 points sur 40 face à l'humain seul. Mais sa capacité à juger ses propres réponses ne suit pas. La compétence augmente, la lucidité non.
2. La baisse du discernement
Le niveau de confiance global grimpe, mais cette assurance tourne à vide. L'AUROC, qui mesure la capacité à distinguer ses bonnes réponses de ses erreurs, chute sur l'ensemble de la batterie, même si l'écart n'est plus établi au sein d'une même tâche. L'utilisateur se trompe moins, mais sa confiance ne distingue presque plus ses réussites de ses erreurs.
3. L'amplification de l'ignorance
L'effet Dunning-Kruger veut que les moins performants se surestiment le plus. Cet effet ne disparaît pas avec l'IA, il semble même s'accentuer. L'écart d'auto-évaluation entre le quart le moins performant et le quart le plus performant est environ une fois et demie plus large. Il bondit de 8,87 points sans l'IA, à 13,58 points avec l'aide de la machine.
4. Le mirage de la fluidité
La facilité à trouver une réponse est d'ordinaire un bon indice de réussite. Avec l'IA, cette facilité peut refléter la simple présence d'une suggestion plutôt qu'un raisonnement réussi. Notre baromètre interne perd alors sa fiabilité (hypothèse des auteurs, non mesurée ici).
5. L'illusion du centaure
Évaluer un travail hybride est un exercice à part. L'humain suit mal la performance de l'IA d'une tâche à l'autre. Et selon la littérature citée, il tend à s'attribuer les réussites obtenues avec elle. Nous ne savons tout simplement pas encore mesurer ce que nous valons quand nous formons un binôme avec l'algorithme.
6. Pas de miracle attendu
Dans 63,1 % des réponses des participants sans IA, l'estimation du duo Humain+IA égalait simplement la meilleure de leurs deux estimations, et ne la dépassait que dans 24,6 % des cas. Une intuition plutôt juste : le duo a égalé l'IA seule sans la dépasser. Seul le quart qui espérait une vraie synergie s'est trompé.
Et vous, comment repérez-vous une erreur dans une réponse de l'IA qui a l'air parfaite ?
Source : Papier de recherche Fernandes et al. de l'Université Aalto (Finlande), 25 septembre 2026
--------
👉 Transformez votre manière de travailler avec NextStart.AI | 17 comments on LinkedIn
|
|
Scooped by
Gilbert C FAURE
October 5, 4:33 AM
|
𝗠𝗼𝘀𝘁 𝗹𝗶𝘁𝗲𝗿𝗮𝘁𝘂𝗿𝗲 𝗿𝗲𝘃𝗶𝗲𝘄𝘀 𝘀𝘂𝗺𝗺𝗮𝗿𝗶𝘇𝗲 𝘄𝗵𝗮𝘁'𝘀 𝗸𝗻𝗼𝘄𝗻 — 𝘁𝗵𝗲 𝗯𝗲𝘀𝘁 𝗼𝗻𝗲𝘀 𝗮𝗿𝗴𝘂𝗲 𝘄𝗵𝗮𝘁'𝘀 𝗺𝗶𝘀𝘀𝗶𝗻𝗴
A literature review that only lists studies is a summary. A literature review that builds toward a gap is an argument. That single difference is where many theses quietly fall short, and where examiners push back hardest.
Here's a 𝟰-𝘀𝘁𝗲𝗽 𝗴𝘂𝗶𝗱𝗲 𝗳𝗿𝗼𝗺 𝗿𝗲𝘀𝗲𝗮𝗿𝗰𝗵 𝗴𝗮𝗽 𝘁𝗼 𝗹𝗶𝘁𝗲𝗿𝗮𝘁𝘂𝗿𝗲 𝗿𝗲𝘃𝗶𝗲𝘄 👇
𝟭. 𝗦𝗽𝗼𝘁 𝘁𝗵𝗲 𝗥𝗲𝘀𝗲𝗮𝗿𝗰𝗵 𝗚𝗮𝗽 — Narrow a broad topic into a specific, answerable question. Compare where studies agree and where they conflict. Look for populations, methods, or contexts no one has studied. Gaps usually come in three forms: knowledge, methodological, or contradictory.
𝟮. 𝗦𝗲𝗮𝗿𝗰𝗵 𝘁𝗵𝗲 𝗟𝗶𝘁𝗲𝗿𝗮𝘁𝘂𝗿𝗲 — Use databases like PubMed, Scopus, Google Scholar, and Web of Science with Boolean operators and clear keywords. Set your inclusion and exclusion criteria before you start screening, and document your search strategy so it can be reproduced.
𝟯. 𝗢𝗿𝗴𝗮𝗻𝗶𝘇𝗲 & 𝗦𝘆𝗻𝘁𝗵𝗲𝘀𝗶𝘇𝗲 — Group studies by theme, method, or timeline. Build a synthesis matrix with studies as rows and themes as columns to see where findings agree, disagree, or stay silent. Compare and contrast instead of just summarizing.
𝟰. 𝗪𝗿𝗶𝘁𝗲 𝘁𝗵𝗲 𝗟𝗶𝘁𝗲𝗿𝗮𝘁𝘂𝗿𝗲 𝗥𝗲𝘃𝗶𝗲𝘄 — Introduce the context and state the gap plainly. Organize the body thematically, not source by source. Conclude by restating the gap and justifying your study.
𝗡𝗼𝘁 𝘀𝘂𝗿𝗲 𝘄𝗵𝗲𝗿𝗲 𝘁𝗵𝗲 𝗴𝗮𝗽 𝗶𝘀? Check existing systematic reviews, ask your advisors, set up database alerts, and read the "future research" sections of key papers.
A well-defined gap does more than justify your study. It avoids duplication, strengthens your argument, and guides your method. 🎓
Save this as your roadmap before you start your next literature review. 📌
Need help finding your research gap, structuring your synthesis, or writing your literature review? Reach out 👇
📧 asma@researchcrave.com
🌐 www.researchcrave.com
whatsapp: https://wa.link/bbvf22
Visit: Researchcraveacademy.com
#ResearchGap #LiteratureReview #LiteratureSearch #SynthesisMatrix #ResearchMethodology #SystematicReview #AcademicWriting #AcademicResearch #AcademicWritingTips #ThesisWriting #DissertationWriting #ThesisHelp #PhDLife #PhDStudent #PhDJourney #PhDSupport #PhDCommunity #PhDChat #GradSchool #HigherEducation #DoctoralStudies #PostgraduateLife #ResearchSkills #ScholarlyWriting #ResearchDesign #ResearchCrave
|
|
Scooped by
Gilbert C FAURE
October 5, 4:08 AM
|
Your academic paper is boring everyone.
And that's why reviewers keep rejecting you.
I reviewed 100+ rejected manuscripts last year.
They all made the same mistake.
They wrote for themselves. Not for the reader.
Your supervisor lied to you. Academic writing is NOT about big grammar.
It's about architecture.
Here's the brutal structure that gets you published:
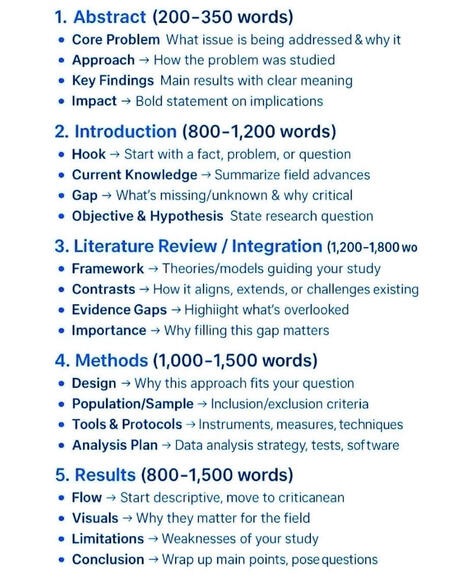
1. Abstract (200-350 words): Nobody cares about your process. They care about PROBLEM -> SOLUTION -> IMPACT. If I don't see why it matters in 30 seconds, I stop reading.
2. Introduction (800-1,200 words): Start with a punch, not history. Gap = Money. If you can't show what's missing and why it's dangerous to ignore, you have no paper. Just an essay.
3. Literature Review (1,200-1,800 words): Stop summarizing. Start fighting. Framework, contrast, expose the gap others missed. You're not a librarian. You're an argument.
4. Methods (1,000-1,500 words): Reviewers don't trust you. Prove you didn't fake it. Why this design? Who did you exclude? What software? If I can't replicate it, I will reject it.
5. Results (800-1,500 words): This is where 90% fail. They dump tables. Don't dump. Flow from simple to complex. Visuals that matter. And have the guts to state your limitations before reviewers use them to kill you.
Most academics write 6,000 words that say nothing.
Top 1% write 5,000 words that no one can ignore.
The difference? Structure.
What advice would you want to add?
🔔follow Edidiong Ukpong(PhD Architecture) for more | 36 comments on LinkedIn
|
|
Scooped by
Gilbert C FAURE
October 5, 4:03 AM
|
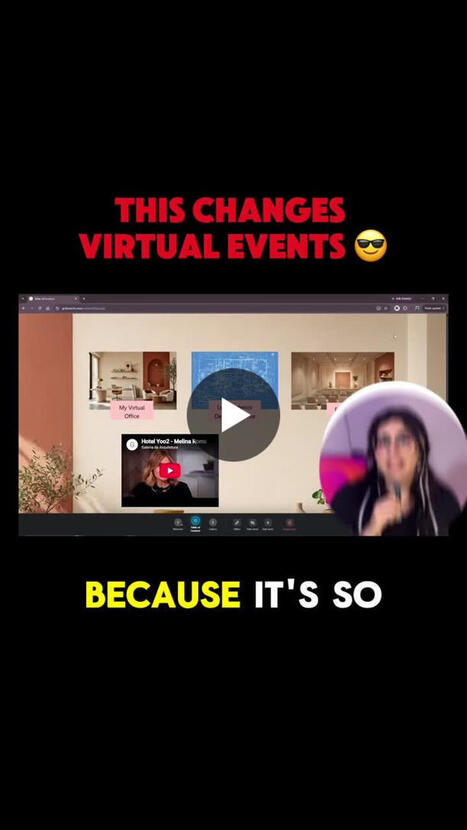
What would a virtual space look like if you could design the experience around your audience?
With GoBrunch, Show Rooms can be used for exploration and content, while Live Rooms can bring people together for real-time interaction.
What would you use this combination for?
If you’re curious about how we built it, we walk through the process step by step in the full tutorial: https://lnkd.in/dc4qkiSM
#VirtualEvents #EventTechnology #DigitalExperience #OnlineEvents #GoBrunchl
|
|
Scooped by
Gilbert C FAURE
October 4, 11:36 AM
|
|
|
Scooped by
Gilbert C FAURE
October 2, 1:07 PM
|
🌫️ Air pollution knows no borders.
Around 2 billion tonnes of sand and dust enter the atmosphere every year. In 2026, several major episodes of dust transport from the Sahara crosse
|
|
Scooped by
Gilbert C FAURE
October 2, 10:38 AM
|
The scientific publication system is in trouble. Some even say it's "broken".
The key issue: the number of papers published each year is growing #exponentially. And everyone involved - scientists, editors, reviewers, journalists - is struggling to keep up.
There are several reasons. Of course there is the surge of AI-generated bullshit papers from #papermills. But it's also because the pressure to publish A LOT OF PAPERS keeps increasing for researchers. And it's because LLMs now allow scientists from all over the world to submit papers in polished academic English (which is a good thing). And some argue it's because commercial publishers made it their business model to publish as many papers as possible.
This affects not only the academic bubble. If the system can't keep up with this tsunami of studies, it also can't guarantee anymore that they contain solid research. And this makes science vulnerable to attacks from sceptics.
More papers ≠ more scientific progress
How to fix this?
Super excited to discuss this in two weeks with Alice Fleerackers, Mark Hanson, Volker Stollorz and Max Voegler. Join our session on the #PeerReviewCrisis at #Wissenswerte!
Graph from Beigel et al. (2025): The Drain of Scientific Publishing
| 32 comments on LinkedIn
|
|
Scooped by
Gilbert C FAURE
October 2, 4:08 AM
|
Les chiffres de la visite du pape Léon XIV en France racontent une histoire médiatique rare
https://lnkd.in/ed5W7jef
1,66 million de mentions dans le monde. 576 600 sur les réseaux sociaux en France seule. 23 630+ mentions en médias traditionnels (print, digital, TV, radio, podcasts). Quatre jours (25-28 septembre) qui ont placé un événement religieux au cœur du débat public français.
Le pic : Samedi 26 septembre à 14 h 45 - les Champs-Élysées. Pas un hasard car c'est le moment où la liturgie, la foule et l'image (Marie-Garance, enfant bénie) se sont cristallisées en un fait national.
Ce qui surprend dans le classement des thèmes : la liturgie domine à 16,1 %, suivie par la jeunesse et la foi (13,4 %). Emmanuel Macron n'arrive qu'en quatrième position (10,2 %).
Les sujets sécurité, coût restent, eux, secondaires. Cela na pas été un événement politique récupéré mais plutôt un événement médiatique structuré par le programme lui-même.
Pour les professionnels de la communication, c'est un cas d'école: comment un agenda institutionnel se déploie dans l'espace médiatique, quand il reste maître du récit.
Lire l'analyse Onclusivecomplète sur notre blog. https://lnkd.in/ed5W7jef
#PapeEnFrance #MediaMonitoring #AnalyseMédias #Onclusive
|
|
Scooped by
Gilbert C FAURE
October 2, 3:44 AM
|
L'IA en recherche académique : une question de timing, pas d'accumulation.
Multiplier les applications ne garantit ni la qualité ni la vitesse. Tout repose sur l'alignement entre l'outil et le stade de la recherche :
➡️ Exploration & Revue de littérature ➔ Automatiser le repérage et la gestion des références.
➡️ Structuration & Mise en forme ➔ Fluidifier le traitement des données et la rédaction.
➡️ Interprétation & Positionnement critique ➔ 100 % Humain.
L'objectif de l'IA n'est pas d'automatiser la pensée scientifique, mais d'éliminer la friction répétitive pour redonner toute sa place à l'analyse analytique.
#AcademicResearch #PhDLife #ResearchTools #IA #Méthodologie
|
|
Scooped by
Gilbert C FAURE
October 2, 3:42 AM
|
Les flux "normaux" dans le monde
Les cartes de webcams en direct font leur retour : une manière singulière de parcourir le monde, non pas à travers ses monuments, mais par ses scènes ordinaires. Attendre un bus, marcher dans une rue, flâner sur une place ou traverser un marché : ces images révèlent la répétition des gestes qui font vivre les territoires au quotidien.
Le site https://worldwatcher.live/ apporte un regard sur les comportements « normaux » il déplace notre attention vers les rythmes locaux, les usages de l’espace public et les temporalités propres à chaque lieu.
Source : https://worldwatcher.live/ via Big Think, « How to restore your online sanity, one random webcam at a time » (29 septembre 2026).
|
|
Scooped by
Gilbert C FAURE
October 2, 3:30 AM
|
I turned my content archive into an interactive resource that helps experts decide what to publish to show their competence, without writing another article.
|
|
Scooped by
Gilbert C FAURE
October 1, 4:07 AM
|
En 2011, l'État voulait ramener les sites de ses ministères à une soixantaine.
En 2026, l'État et ses opérateurs en comptent 17 318.
Cette carte, je l'ai commencée il y a 7 ans.
En 2019, j'étais Entrepreneur d'intérêt général au sein de l'État. J'avais cartographié 665 adresses en .gouv.fr et les avais reliées à leurs ministères.
Puis plus rien. Pas de mise à jour, pas de vue d'ensemble publique. Pendant ce temps, les ministères ont changé de nom, des sites ont fermé, des milliers d'autres sont apparus.
Alors je m'y suis remis. Et voici ce que la V2 montre :
🔹 17 318 sites et sous-domaines actifs
🔹 965 administrations et opérateurs, rangés par ministère
🔹 sur les 665 adresses de 2019, 200 ont fermé ou redirigent ailleurs
🔹 les démarches essentielles et site en .gouv.fr mises en avant
🔹 un tableau de pilotage pour agir en conséquence
👉 La carte est à explorer ici : lien en premier commentaire.
Pourquoi j'y tiens ?
On cherche principalement à comprendre l'État à travers trois axes :
1️⃣ ses lois, ses pouvoirs et contre-pouvoirs
2️⃣ son budget, ses financements (et ses économies)
3️⃣ son organisation et son fonctionnement, à travers ses agents
Mais il existe depuis quelques années un 4e domaine, diffus et sans vision d'ensemble : sa numérisation. Une autre représentation de la réalité, observée à travers nos écrans. C'est d'ailleurs souvent, voire malheureusement, la première porte d'entrée des citoyens vers le service public.
Rendre cette porte lisible, c'est une question de transparence démocratique. C'est le sens de mon engagement : mettre le numérique au service de l'intérêt général, et non l'inverse. J'en tire quelques apprentissages dans un article à venir.
En attendant, tout est ouvert et réutilisable : la carte, la liste complète en CSV et en JSON, un PDF haute résolution et le code (liens en commentaire 👇). La carte se met à jour chaque mois, pour ne pas attendre encore 7 ans.
Et vous : quel site public utilisez-vous le plus, et lequel a disparu sans que vous le remarquiez ?
#ServicePublic #OpenData #Numérique #IntérêtGénéral #GouvTech | 90 comments on LinkedIn
|
|
Scooped by
Gilbert C FAURE
September 29, 9:50 AM
|
I’ve been thinking a lot about why I keep coming back to the phrase Own the Moment, which you probably have seen me mention before.
It grew out of the workshops that I have run foucsing on presenting and communicating with more confidence and relevance. But lately I’m realizing that the same challenge runs through much of my work actoss the broad spectrum of health professions education.
As most of you know, you can prepare a presentation, a lesson, a mentoring conversation, or an entire curriculum. Then actual students, learners, and participants show up. They bring questions, experience, confusion, skepticism, and needs that actually create the need in the (real or virtual) room. Audiences do have a habit of doing that.
Maybe that’s why I keep finding my way back to stand-up comedy and improv. Both have taught me that preparation matters, but so does noticing what’s happening in front of you and being willing to change course. I always say that this was the best preparation for me to teach, facilitate, or present.
So, owning the moment means paying attention and responding with purpose and relevance. Sometimes that means telling a story. Sometimes it means asking or answering a better question. And sometimes it means skipping the next 12 slides. (Yes, even the beautiful ones you worked so very hard to prepare). And it means knowing your audience!
That applies when we teach students, support postgraduate learners, and help experienced professionals continue to grow. The setting changes. The responsibility to meet people where they are does not.
I think that’s the thread connecting my work in CPD, faculty development, teaching, facilitation, and communication (and comdey): prepare appropriately, stay present, and help the people in front of you take the next step.
What does owning the moment look like in your work?
|