Your new post is loading...

|
Suggested by
Société Francaise d'Immunologie
May 22, 2019 2:21 AM
|
Cachexia manifests in cancer, chronic inflammation and infections. Bergthaler and colleagues show that CD8+ T cells mediate infection-associated cachexia in a manner dependent on T cell–intrinsic type I IFN signaling and antigen recognition.

|
Scooped by
Gilbert C FAURE
May 21, 2019 2:17 AM
|
|
|
Scooped by
Gilbert C FAURE
May 20, 2019 2:36 PM
|
|
|
Scooped by
Gilbert C FAURE
May 19, 2019 2:10 PM
|
|
|
Scooped by
Gilbert C FAURE
May 15, 2019 4:42 AM
|
Tumor-infiltrating lymphocytes are known to be critical in controlling tumor progression. While the role of T lymphocytes has been extensively studied, the function of B cells in this context is still ill-defined. In this review, we propose to explore the role of B cells in tumor immunity. First of all we define their dual role in promoting and inhibiting cancer progression depending on their phenotype. To continue, we describe the influence of different tumor microenvironment factors such as hypoxia on B cells functions and differentiation. Finally, the role of B cells in response to therapy and as potential target is examined. In accordance with the importance of B cells in immuno-oncology, we conclude that more studies are required to throw light on the precise role of B cells in the tumor microenvironment in order to have a better understanding of their functions, and to design new strategies that efficiently target these cells by immunotherapy.
|
|
Scooped by
Gilbert C FAURE
May 13, 2019 2:14 PM
|
One of the traditional dividing lines separating innate and adaptive immunity was the restriction of immune memory to adaptive immune cells. This paradigm has been challenged by accumulating evidence that memory responses can be evoked in natural killer (NK) cells from experimental animals, including mice and nonhuman primates. To determine whether human NK cells also exhibit memory responses, Nikzad et al . analyzed NK cells recovered from humanized mice or NK cells found in the viral antigen-challenged skin of adult volunteers who had chickenpox as children. Antigen-specific recall responses by human NK cells were observed in both experimental systems. These findings suggest that human NK memory responses contribute to acquired host protection after either natural infections or vaccine administration.
Adaptive immune responses are defined as antigen sensitization–dependent and antigen-specific responses leading to establishment of long-lived immunological memory. Although natural killer (NK) cells have traditionally been considered cells of the innate immune system, mounting evidence in mice and nonhuman primates warrants reconsideration of the existing paradigm that B and T cells are the sole mediators of adaptive immunity. However, it is currently unknown whether human NK cells can exhibit adaptive immune responses. We therefore tested whether human NK cells mediate adaptive immunity to virally encoded antigens using humanized mice and human volunteers. We found that human NK cells displayed vaccination-dependent, antigen-specific recall responses in vitro, when isolated from livers of humanized mice previously vaccinated with HIV-encoded envelope protein. Furthermore, we discovered that large numbers of cytotoxic NK cells with a tissue-resident phenotype were recruited to sites of varicella-zoster virus (VZV) skin test antigen challenge in VZV-experienced human volunteers. These NK-mediated recall responses in humans occurred decades after initial VZV exposure, demonstrating that NK memory in humans is long-lived. Our data demonstrate that human NK cells exhibit adaptive immune responses upon vaccination or infection. The existence of human memory NK cells may allow for the development of vaccination-based approaches capable of establishing potent NK-mediated memory functions contributing to host protection.
|
|
Scooped by
Gilbert C FAURE
May 11, 2019 1:46 PM
|
Natural killer (NK) cells are a population of lymphocytes which classically form part of the innate immune system. They are defined as innate lymphocytes, due to their ability to kill infected or transformed cells without prior activation. In addition to their cytotoxic abilities, NK cells are also rapid producers of inflammatory cytokines such as interferon gamma (IFN-γ) and are therefore a critical component of early immune responses. Due to these unique abilities, NK cells are a very important component of host protection, especially anti-tumour and anti-viral immunity. Obesity is a worldwide epidemic, with over 600 million adults and 124 million children now classified as obese. It is well established that individuals who are obese are at a higher risk of many acute and chronic conditions, including cancer and viral infections. Over the past 10 years, many studies have investigated the impact of obesity on NK cell biology, detailing systemic dysregulation of NK cell functions. More recently, several studies have investigated the role of NK cells in the homeostasis of adipose tissue and the pathophysiology of obesity. In this review, we will discuss in detail these studies and focus on emerging data detailing the metabolic mechanisms altering NK cells in obesity.
|
|
Suggested by
Société Francaise d'Immunologie
May 11, 2019 7:05 AM
|
Ten receptors for cytokines in the IL-6 family share the signal transducer gp130.
Some functions of these cytokines are redundant, but others are distinct and specific.
Murakami et al. review the IL-6 cytokine family from the viewpoints of structure,
signaling, and biological features and discuss mechanisms of their functional pleiotropy.
|
|
Scooped by
Gilbert C FAURE
May 10, 2019 6:25 AM
|
GM-CSF is a critical cytokine in the development of tissue inflammation. Komuzcki
et al. use a fate-mapping and reporter system to demonstrate that GM-CSF production
by CNS-infiltrating T helper cells is crucial for phagocyte invasion and neuroinflammation.
Pathogenicity was lost in the absence of GM-CSF expression despite the presence of
IFN-γ- and IL-17-producing T helper cells in the CNS.
|
|
Scooped by
Gilbert C FAURE
May 10, 2019 3:36 AM
|
J Leukoc Biol. 2018 Aug;104(2):275-284. doi: 10.1002/JLB.1MR1217-496R. Epub 2018 Feb 27. Research Support, Non-U.S. Gov't; Review

|
Suggested by
LIGHTING
May 7, 2019 2:34 PM
|
NK-cells are major players in the fight against viral infections and transformed cells, but there is increasing evidence attributing a disease-promoting role to NK-cells. Cytokines present in the tumor microenvironment shape NK-cell maturation, function and effector responses. Many cytokines signal via the JAK-STAT pathway that is also frequently altered and constitutively active in a broad range of tumor cells. As a consequence, there are currently major efforts to develop therapeutic strategies to target this pathway. It is therefore of utmost importance to understand the role and contributions of JAK-STAT molecules in NK-cell biology - only this knowledge will allow us to predict effects of JAK-STAT inhibition for NK-cell functions and to successfully apply precision medicine. We will review the current knowledge on the role of JAK-STAT signaling for NK-cell functions and discuss conditions involved in the switch from NK-cell tumor surveillance to disease promotion.
|
|
Scooped by
Gilbert C FAURE
May 5, 2019 1:42 PM
|
CD4+ T helper 17 (Th17) cells protect vertebrate hosts from extracellular pathogens at mucosal surfaces. Th17 cells form from naive precursors when signals from the T cell antigen receptor (TCR) and certain cytokine receptors induce the expression of the RORγt transcription factor, which activates a set of Th17-specific genes. Using T cell–specific loss-of-function experiments, we find that two components of the Polycomb repressive complex 1.1 (PRC1.1), BCL6 corepressor (BCOR) and KDM2B, which helps target the complex to unmethylated CpG DNA islands, are required for optimal Th17 cell formation in mice after Streptococcus pyogenes infection. Genome-wide expression and BCOR chromatin immunoprecipitation studies revealed that BCOR directly represses Lef1 , Runx2 , and Dusp4 , whose products inhibit Th17 differentiation. Together, the results suggest that the PRC1.1 components BCOR and KDM2B work together to enhance Th17 cell formation by repressing Th17 fate suppressors.
|
|
Suggested by
Société Francaise d'Immunologie
May 3, 2019 2:16 PM
|
|
|
|
Scooped by
Gilbert C FAURE
May 21, 2019 4:56 AM
|
|
|
Scooped by
Gilbert C FAURE
May 20, 2019 2:44 PM
|
New immune biomarkers of exposure to tuberculosis may require a rethink of evidence of Mycobacterium tuberculosis infection and control.
|
|
Scooped by
Gilbert C FAURE
May 20, 2019 1:35 AM
|
|
|
Scooped by
Gilbert C FAURE
May 15, 2019 3:18 PM
|
Abstract Malignant tumours show a marked degree of morphological, molecular and proteomic heterogeneity. This variability is closely related to microenvironmental factors and the location of the tumour. The activation of genetic alterations is very tissue‐dependent and only few tumours have distinct genetic alterations. Importantly, the activation state of proteins and signaling factors is heterogeneous in the primary tumour and in metastases and recurrences. The molecular diagnosis based only on genetic alterations can lead to treatments with unpredictable responses, depending on the tumour location, such as the tumour response in melanomas versus colon carcinomas with BRAF mutations. Therefore, we understand that the correct evaluation of tumours requires a system that integrates both morphological, molecular and protein information in a clinical and pathological context, where intratumoral heterogeneity can be assessed. Thus, we propose the term ‘tissunomics’, where the diagnosis will be contextualised in each tumour based on the complementation of the pathological, molecular, protein expression, environmental cells and clinical data. General Background of Tumour Pathology Despite constant progress in cancer research, mortality rates remain high.1, 2 Five‐year survival is greater than 80% for carcinoma of the breast, prostate and bladder, cutaneous melanoma and testicular and thyroid tumours, but less than 10% in pancreatic, liver, oesophageal, lung and stomach tumours and glioblastoma. If we focus on tumour stage, we observe that in luminal breast cancer, expected survival is greater than 90% in patients without metastases at diagnosis and less than 25% in patients with disseminated disease.3 With this in mind, early detection, histological typing and extent of dissemination are critical for treatment success. Furthermore, the more than 250 tumour types and hundreds of subtypes, on a background of thousands of genetic, epigenetic and microRNA alterations,4-6 highlight the importance of precise tumour sample evaluation in deciding the most appropriate clinical treatment. Inter‐ and intratumour heterogeneity (ITH)7, 8 act as a critical barrier to improving therapeutics: most of the targets and biomarkers approved by the United States Food and Drug Administration are not expressed uniformly throughout tumour tissue; for example, the human epidermal growth factor receptor 2 (HER2) in gastric adenocarcinoma,9, 10 progesterone and oestrogen receptors in breast tumours (considered positive when detected in 1% of tumour cells)11 and EML4–ALK translocation in lung adenocarcinoma (threshold of 15%),12 among others.13, 14 Current Situation and Challenges Why Are Malignant Tumours Heterogeneous? The paradigm of cancer as a genetic disease has existed since the early 1970s. For the last 50 years, cancer has been explained according to the somatic mutation theory (SMT),15 which states that genetic mutations accumulate in cells by inducing clonal expansion. Following Darwinian‐type evolution, an initial clone accumulates multiple mutations, resulting in malignant transformation characterised by growth independence and resistance to apoptosis. These clones have trunk and branch mutations, and may also have driver and passenger mutations.16-18 During tumour progression and after chemotherapy or radiotherapy, genetic alterations accumulate to select for the best‐adapted clone. Molecular heterogeneity has been described in renal adenocarcinoma, breast cancer and glioblastoma, among others.19 It is thought that these clones with greater proliferative advantages and resistance to local stresses then predominate.20-24 Other theories include the tissue organisation field theory (TOFT), which postulates that neoplasia arises from a local tissue disorder and may be due to a defect in interaction between cells and other tissue components,15, 25-27 where epigenetic or genetic changes affect both epithelial and stromal cells in multiple locations. Grouping together the evidence for these theories, it has been demonstrated that (i) many spontaneous somatic mutations accumulate in cells during their lifetime, (ii) oncogenes and tumour suppressor genes play a critical role in cancer development and (iii) environmental factors trigger cancer onset and progression.15 Regarding field cancerisation, some authors have proposed that cancer is a tissue disorder with similarities to abnormal embryonic development,15, 25 while others propose that cancer is a consortium of clones and local factors.28 It is understood that a single clone cannot harbour all the genetic alterations required for the invasive and metastatic tumour phenotype and that several clones acquire malignant properties that, synergistically, allow cells to grow, invade and metastasise. This consortium of tumour cell clones and microenvironment cells includes leucocytes, lymphocytes, fibroblasts and endothelial cells. A minimum number of cells is also required for a clone to be biologically viable – a phenomenon known as the Allee effect. This clonal cooperation has been proposed in pancreatic and breast cancer and melanoma and for circulating tumour cell (CTC) clusters.29-33 Some Oncogenic Alterations Are Tissue‐Specific Certain genetic alterations are only observed in the context of specific cell or tissue types;34 for example, alterations in the APC gene in colorectal cancer, CDH1 (E‐cadherin) in gastric carcinoma, the VHL gene in renal carcinoma or BCR/ABL in leukaemia.35, 36 These specific genetic alterations demonstrate that tissue type plays a role, which is currently not well understood and is under intensive investigation. The higher incidence of certain somatic mutations in some cell types might be explained by a cell‐ or tissue‐specific chromosome disposition during interphase. This, along with epigenetic imprinting, may serve as a mechanism of gene regulation and allow differential access of carcinogens to certain DNA regions, resulting in a higher probability of mutations and specific rearrangements in some cells but not others. Similarly, the accessibility of certain chromosomal regions might explain cell‐type‐specific chromosomal translocations such as BCR/ABL in leucocytes or VHL mutations in renal cell carcinoma.37, 38 Some mutations and genetic alterations are uniformly present in the entire organism, such as germline mutations, BRCA1 and BRCA2, VHL in Von Hippel Lindau syndrome and as many as 30 others, but they are usually only associated with tumours in specific tissues, such as BRCA1/2 in breast and ovarian tumours.39 This clearly indicates that driver, trigger or passenger mutations only exert an effect in certain tissues. Some Histopathological Features Suggest Oncogenic Alterations The specific morphological patterns observed in human tumours have helped to identify distinct genetic changes: for example, characteristic chromosomal translocations have been identified in desmoplastic round‐cell tumours, clear‐cell sarcoma, synovial sarcoma and rhabdoid tumours.40-42 Moreover, a simple haematoxylin and eosin stain can indicate the presence of a number of hereditary tumours with specific genetic alterations, such as medullary thyroid carcinoma, multiple endocrine neoplasia (MEN),43, 44 the cribriform‐morular variant of papillary thyroid carcinoma,45 familial adenomatous polyposis,46 medullary breast carcinoma, familial breast cancer associated with specific BRCA1 mutations,47 renal carcinoma, associated with SDHB mutations which shows flocculent cytoplasmic vacuoles,48, 49 hereditary leiomyomatosis and renal cell cancer syndrome,50 and sebaceous lesions associated with Muir–Torre syndrome in colon cancer.51, 52 Thus, hereditary cancer predisposition syndromes can be identified by immunohistochemistry, which has emerged as a cost‐effective strategy (see Table 1).53 Molecular alterations in tumors Principles of immunohistochemical staining in tumoral cells Examples Chromosomal translocation Overexpression of protein encoded by one of the genes involved in fusion or chimeric protein encoded by the two genes involved in fusion. Positive immunostaining in tumour cells BCL2 expression in follicular lymphoma Cyclin D1 expression in mantle cell lymphoma ALK expression in different tumour cells (anaplastic lymphoma, NSCLC) NUT expression in NUT midline carcinoma ERG expression in prostate carcinoma ROS1 expression in NSCLC Gene mutation Aberrant subcellular localisation of antigen or protein Nuclear translocation of B‐catenin in (CRC, desmoid fibromatosis, cribriform morular variant of PTC) Cytoplasmic expression of nucleophosmin in AML Cytoplasmic expression of BRCA1 in BC. Stabilisation and strong expression of the protein encoded by the gene mutated P53 in different tumour types (high grade serous ovary carcinoma) Mutation specific antibodies, the antibody do not recognize the WT form of the protein (gene) IDH1 R132H expression in gliomas EGFR L858R expression in NSCLC EGFR Del 19 expression in NSCLC BRAF V600E expression in different tumor types (Melanoma, PTC, CRC, others.) Presence or lack of mutation of certain genes give an overexpression of certain surrogate markers LCC without IGH mutation is associate with overexpression of ZAP‐70 Gene deletion or loss of function Inactivating mutation, deletion or promoter hypermethylation of gene gives a loss of protein expression of the encoded genes Loss of E‐cadherin staining in lobular breast carcinoma Loss of INI‐1 staining in rhabdoid tumor, and epithelioid sarcoma Loss of staining for any MMR proteins (MLH1, MSH2, MSH6, PMS2) in HNPCC with MSI Loss of staining for parafibromin in parathyroid Carcinoma Loss of staining for Rb in spindle cell /pleomorphic lipoma Lack of staining for SDHB in hereditary paragangliomas and gastrointestinal stromal tumor Loss of PTEN expression in endometrial cancer with PTEN mutation and Cowden Syndrome Gene amplification Increase in copy number of gene gives an overexpression of the encoded protein HER2 strong staining in breast and gastric cancer associated with HER2 amplification Strong staining for MDM2 or CDK4 associates with 12q14‐15 amplification in liposarcoma or well‐differentiated osteosarcoma. Strong MET expression in NSCLC Adapted from Chan et al.53. In contrast, other molecular alterations have been associated with tumours whose morphological characteristics are strikingly distinct, such as (i) the ETV6–NTRK3 translocation, detected in diverse tumour types including infantile fibrosarcoma, cellular mesoblastic nephroma and secretory breast carcinoma;54 (ii) translocation affecting the ALK gene, in anaplastic large‐cell lymphoma, lung adenocarcinoma, inflammatory myofibroblastic tumour and others;55 (iii) EWSR1–CREB1 translocation in clear‐cell sarcoma and angiomatoid fibrous histiocytoma;56 and (iv) BRAF mutations and translocations in benign nevi, malignant melanoma, colon adenocarcinoma, glioblastomas and pilocytic astrocytoma, as well as others.57 Thus, the association between genetic alterations and specific tumour types is not clear, but some histopathological patterns suggest certain genetic alterations and hereditary tumour syndromes. Problems and Barriers Bias and Limitations of Molecular Classification and Somatic Theory Intratumour heterogeneity and pitfalls in the interpretation of oncogenic factors in small biopsies Intratumour heterogeneity at the morphological, molecular and proteomic level is seen in most tumours. In melanoma, intratumour heterogeneity of BRAF mutations is described in more than 10% of cases11, 13, 14, 58 so, depending on the zone biopsied within a tumour, the determination of BRAF mutations may be wild‐type or mutant, with clear clinical implications (see Figure 1). This example can be extended to other targets and biomarkers, such as EGFR mutations in non‐small cell lung cancer (NSCLC),59 ALK rearrangement and others.60 Molecular and preneoplastic changes in the context of the adjacent tissue: field cancerisation Until now, tumour diagnosis has focused on histological and molecular features, yet it is well known that the surrounding cells and other areas of the tissue may display premalignant histological changes such as dysplasia; furthermore, many genetic alterations occur without cytological changes. These environmental changes can affect tumour progression by exerting evolutionary pressure on tumour cells and ultimately determining which mutations are selected.27 Examples of preneoplastic histological lesions include dysplasia (cytological atypia, large hyperchromatic nuclei or nucleoli) and in‐situ carcinomas (with no basement membrane invasion), which are observed in most carcinomas. It is noteworthy that some early neoplastic lesions such as colon adenomas and skin naevi are polyclonal. Progression to cancer probably involves the accumulation of multiple field cancerisation driver mutations among synergistically acting groups of mutations.27 In this regard, molecular studies of peritumour areas in normal ducts of the breast or prostate may show a high number of genetic alterations and driver mutations.61 The clinical meaning of these molecular changes remains unknown, and further large studies are needed to establish their correlation with tumour relapse. Nonetheless, two important conclusions can be drawn: (i) the study of non‐tumour tissue can be relevant in predicting prognosis and risk of second or multiple neoplasia and (ii) we must be very cautious making a diagnosis of malignancy based only on molecular data, as not all mutations in, for example, driver genes, are directly linked to cancer development. Mixed tumours as an example of the relevance of integrating molecular features into their morphological context Mixed tumours provide the most extreme examples of intratumour heterogeneity. They are composed of two or more histological components, each with a different natural history, and are occasionally detected in every organ of the human body. In most cases, the two biologically distinct tumour components are clonally related, and it is thought that the more aggressive component arises from the more indolent one and is usually responsible for the aggressiveness of the tumour. The amount of each component is also closely related to outcome. In a small proportion of cases the two components are not clonally related: they are not true mixed tumours, but collision tumours in which two distinct neoplasms have developed independently, with a different natural history. In a high proportion of mixed tumours, morphological appearance correlates with molecular diversity. For example, mixed endometrioid and serous carcinomas of the endometrium contain elements with the microscopic characteristics of endometrioid and serous carcinoma, and molecular analysis of microdissected tumour tissue shows that the two components have a different mutational profile. Other mixed tumours are ambiguous, and different microscopic features develop in tumour components with similar molecular alterations, probably as a result of interaction with the microenvironment.62 In some mixed tumours the microscopic diversity is extreme. This is the case in biphasic synovial sarcoma, carcinosarcomas and some mesotheliomas. In carcinosarcomas (named differently in different organs: metaplastic carcinoma, sarcomatoid carcinoma, carcinosarcoma) the malignant epithelial component gives rise to mesenchymal elements, and may even contain fully developed sarcomatoid features, such as malignant skeletal muscle, cartilage or bone elements. Integration of the molecular features into the appropriate microscopic context is essential to understand these tumours and accurately assess prognosis. Cancer‐type‐independent molecular classification of therapeutic targets Currently, precision oncology is based on the existence of alterations in certain specific therapeutic targets regardless of tumour location or type. Tumours with somatic mutations such as BRAF, EGFR or gene rearrangements such as ALK are considered therapeutic options regardless of tumour type or location, and tumours may even be characterised as BRAFomas or ALKomas. However, some clinical data have shown that, while BRAF inhibitors are effective in melanoma, the same inhibitors of the same BRAF mutations in colorectal cancer induce feedback loops in signalling pathways that can have a detrimental effect.63, 64 Cell signalling pathways are also highly regulated, often dependent on numerous positive and negative feedback loops, which are specific to the cell type and tumour environment. For this reason, BRAF inhibition in colorectal cancer indirectly results in EGFR receptor activation and subsequent PI3K–Akt pathway activation. Similarly, ALK alterations and their inhibitors do not have the same clinical response in lung tumours as in neuroblastomas.65 Further examples are inhibitors of EGFR, HER2 and HER3, depending on the tumour type and location. In a recent basket clinical trial, not all tumours were affected by the same HER mutations, and response to the HER2 inhibitor (neratinib) varied in different tissues: for example, colorectal or bladder cancer with HER2 mutations did not respond.66 In summary, specific drug treatment depends on the tissue context.34 Assessment and validation of molecular subtypes by protein expression Molecular classification based on mRNA expression profiling of gene groups is a frequent approach to identify and classify molecular subtypes of tumours. One of the major achievements of molecular classification has been the subcategorisation according to prognosis, and it is instrumental for the identification of new genetic alterations. However, mRNA‐based expression studies are often limited by a low reproducibility, depending on mRNA stability. Furthermore, single‐cell sequencing approaches are not feasible in routine diagnostics. Currently, samples are sequenced as the bulk of tumour cells and therefore do not provide information on ITH. In addition to these technical issues, monitoring gene expression at the mRNA level does not necessarily correlate with the function of a protein within a cell, as many post‐transcriptional modifications determine whether or not mRNA finally gives rise to a functional protein. Importantly, however, the different molecular subtypes based on enormous mRNA expression matrices can be validated according to protein or gene expression using just a few in‐situ hybridisation or IHC probes in most molecular cancer subtypes (see Table 2). Tumour type Molecular signature Classification Immunohistochemistry FISH Breast cancer Luminal A ER+, PR+, GATA+, FOXM+, Ki67 <15% Luminal B ER+, PR+, GATA+, FOXM+, Ki67 >15% HER2 enriched ER−, PR−, HER2+ ERB2 ampl. Basal‐like ER−, PR−, HER2−, CK5+, EGFR+ Claudin low ER−, PR−, HER2−, CD44+, Snail+ Normal breast‐like ER−, PR−, HER2−, CD36+ Colon cancer CMS1 (immune) FRMD6−, HTR2B−, ZEB1−, CDX2+ CMS2 FRMD6−, HTR2B−, ZEB1−, CDX2+ CMS3 FRMD6−, HTR2B−, ZEB1−, CDX2+ CMS4 (mesenchymal) FRMD6+, HTR2B+, ZEB1+ CDX2− Glioblastomas Proneural IDH mut, p53mut, OLIG2 PDGFRA ampl, CDK4 ampl, CDK6 ampl Mesenchymal CD44, NF1 EGFR ampl Classical EGFR vIII mut, p53− EGFR ampl, loss of PTEN and CDKN2A Neural – Medulloblastoma WNT‐activated β‐Catenin nuclear, GAB1−, YAP1+, Filamin A+ Monosomy chr. 6 SHH‐activated, TP53‐WT β‐Catenin cyto, GAB1+, YAP1+, Filamin A+ GLKi1 ampl, PTCH1 del SHH‐activated, TP53‐mut β‐Catenin cyto, GAB1+, YAP1+, Filamin A+, p53+ MYCN ampl, CLI2 ampl, 17p loss Group 3 (Gabaergic) β‐Catenin cyto, GAB1−, YAP1−, Filamin A− 17q ampl Group 4 (Glutaminergic) β‐Catenin cyto, GAB1−, YAP1−, Filamin A− MYC ampl, CDK6 ampl Endometrial Ultramutated (POLE) Hypermutated (MSI) MMRd (MLH1−) Copy number low Copy number high P53+ IHC, Immunohistochemistry; FISH, Fluorescence in‐situ hybridisation; FFPE, Formalin‐fixed paraffin‐embedded. Breast carcinoma According to the mRNA expression profile, six molecular subtypes are described: luminal A, luminal B, HER2+, basal‐like, claudin‐low and normal breast‐like.67, 68 However, RNA signatures can vary dramatically between patients with the same molecular subtype69 and, with the exception of the basal subtype, are not highly reproducible for diagnosis on microarray analysis.67, 70, 71 A high degree of ITH has been described, as assessed by immunohistochemical (IHC) studies,72 array‐CGH studies71 and massive parallel sequencing technologies.73 Given these problems in the exact diagnosis of breast cancer subtype by molecular characterisation, IHC‐based characterisations are recommended as a diagnostic approach in most of the consensus oncology guidelines.74 Additional IHC staining helps to distinguish luminal A and B subtypes, such as GATA3 and FOXM.75 CK5 and EGFR expression define the basal subtype of breast cancer,76 and CD44 and Snail expression determine the claudin‐low subtype.77 Finally, the normal breast‐like subtype is defined by low expression of the above‐mentioned markers and expression of factors such as CD36 in a low‐grade histological tumour.78 Colorectal carcinoma Molecular subtypes of colorectal carcinoma have been distinguished by genomic, epigenetic and transcriptomic parameters.79, 80 Four different colorectal carcinomas, CMS1–4, have been described according to immunohistochemistry. The molecular subtypes can be identified as mesenchymal type (CMS4), which has the worst prognosis, immune type (CMS1) and epithelial subtypes (CMS2/3), based on four proteins: CDX2, FRMD6, HTR2B and ZEB1. In all subtypes, the drivers and actionable genes must be studied according to approved protocols (e.g. RAS, BRAF).81, 82 Lung carcinoma Three molecular subtypes have been described based on DNA methylation [high, intermediate or low CpG island methylator phenotype (CIMP)], transcriptomics and RNA array: proximal proliferative, proximal inflammatory and terminal respiratory unit.83 Recently, using an integrative analysis with all available omics data, six different molecular subtypes have been described.84 Protein markers to distinguish those subtypes are still under way and that classification is not used in clinical oncology guides. Nevertheless, druggable genetic alterations can be observed in the different molecular subtypes, and current oncology guidelines follow a reasonable scheme based on druggable genes, combining polymerase chain reaction (PCR)‐based methods to identify EGFR and BRAF mutations, and in‐situ hybridisation or immunohistochemistry for the expression of BRAF V600E, ALK, ROS, HER2, RET and MET. Glioblastomas Four molecular subtypes have been described based on gene expression profile: proneural, mesenchymal, mixed and unknown,85 and up to six based on methylation arrays, recurrent driver genes and transcriptomics, by the DKFZ (Deutsches Krebsforschungs‐zentrum).86-89 These molecular subtypes are used currently in clinical oncology guides. In brief, according to the most recent World Health Organisation (WHO) classification,90 grade IV gliomas are classified as IDH‐mutant GB, IDH‐wt GB and midline glioma with H3 K27M mutation. In order to discriminate between subtypes the following can be analysed using IHC, fluorescence in‐situ hybridisation (FISH) or PCR: IDH1/IDH2, ATRX, TP53, FGFR, NF1, H3.1 and H3.3 mutations, EGFR and PDGFR amplifications, BRAF V600 mutation or translocations and CDKN2A/CDKN2B deletion. Medulloblastomas Medulloblastomas have four molecular subtypes with clear clinical differences (group 1 WNT activated; group 2 SHH activated; group 3 or GABAergic; and group 4 or glutaminergic). These subtypes can be assessed by immunohistochemistry or FISH, studying β‐catenin, GAB1, YAP1, Filamin A, p53, Glki1, 17q+ (group 3), MYC and CDK6 amplification.91-94 Endometrial carcinoma Two types of endometrial carcinoma have been described based on a combination of epidemiological, clinical, histological and molecular genetic data, distinguishing type I endometrioid endometrial carcinoma (EEC) and type II non‐endometrioid endometrial carcinoma (NEEC).95 A molecular classification of EC has been proposed based on The Cancer Genome Atlas Research Network (TCGA) study, published in 2013. TCGA analysis revealed four tumour groups:96 group 1, EEC with somatic inactivating mutations in POLE exonuclease and very high mutation rates (hypermutated) (7%); group 2, EEC with microsatellite instability (MSI), frequently with MLH‐1 promoter hypermethylation and high mutation rates (28%); group 3, EEC with low copy number alterations (39%), also called EEC with no specific molecular profile; and finally, group 4 (serous‐like or copy‐number high) (26%), with a low mutation rate but frequent TP53 mutations. These four types show different clinical, pathologic and molecular features. Urothelial bladder carcinoma Different molecular classifications are currently being explored. One of them, based on RNA genomewide studies, has characterised two main molecular groups of bladder cancer with prognostic and predictive impact.97 Group 1 basal subtype includes a subgroup of claudin‐low and is characterised by expression of the basal cytokeratins CK5, CK14 and CD44. Group 2 luminal subtype has mutations of the fibroblast growth factor receptor 3 (FGFR3) gene and urothelial differentiation markers such as CK20, GATA3 and uroplakins. The luminal subtype has a more favourable prognosis than the basal subtype.97 Recently, a prospective multicentre validation study with a 12‐gene signature progression score in non‐muscle‐invasive bladder cancer was demonstrated to have independent prognostic power beyond clinical and histopathological risk factors, and could help in stratifying patients to optimise treatment and follow‐up.98 Other molecular alterations have also been described, such as FGFR3 mutations in 80%,99 PI3KCA mutations in approximately 20% and mutations in the core promoter region of the human telomerase reverse transcriptase (TERT) gene in up to 85% of bladder tumours. Interestingly, FGFR3 and PIK3CA mutations have been demonstrated as biomarkers on liquid biopsy for disease surveillance for bladder cancer.100 Different cell cycle genes may be altered in invasive urothelial carcinoma, mainly tumour suppressor genes, including TP53, p16 and Rb.101 Finally, combinations of TP53, p21, p27 and pRb proved to be more precise in classifying bladder cancer patients into risk groups.102 Gene expression heterogeneity and environmental cells mRNA expression versus protein expression Molecular tumour subtypes based on mRNA expression profiles often show discordance with protein expression levels, depending on the RNA stability and the area sampled. It is well known that RNA studies are problematic regarding reproducibility, and that protein expression shows the real functional status of the targets. A classic example is breast cancer, in which mRNA profiles can define at least six different molecular categories. While this can be used as a general classification scheme, only IHC or FISH analysis of proteins in tumour cells within the individual subgroup can provide the exact diagnosis to guide treatment and prognosis. Some reports67 describe discord, when comparing mRNA and protein expression levels, of up to 50% of cases in HER2 status, and in more than 15% of cases when distinguishing between luminal A and luminal B. Tissue‐specific protein expression profiles The relation between tissue context and protein expression has recently been reported in an extensive gene expression study of 17 different tumour types in more than 8000 patients.103 The study encompassed massive studies of sequencing, mRNA expression, protein expression and engaged databases from the TCGA and the Human Protein Atlas. The authors also carried out in‐depth bioinformatics and systems biology analysis. Interestingly, more than 2700 genes correlated with prognosis, showing opposite prognostic effects depending on tumour type and location. Within the genes associated with worse prognosis, two groups were described. The first group comprised genes related to cell proliferation, of which more than 190 were identified (of the 314 described related to the cell cycle). This gives an idea of the great redundancy of gene alterations, especially the level of expression that may exist depending on tumour type. The second group comprised genes associated with tissue differentiation and their prognostic correlation. This is a point that has always been described in pathology, distinguishing tumours with a low degree of malignancy, i.e. histologically better differentiated, from those with a high degree of malignancy, i.e. poorly differentiated with a higher degree of cellular atypia. The study also found that more than 50% of the genes associated with prognosis were not related to Hanahan and Weinberg's classic hallmarks.6 Therefore, one of the conclusions was the enormous variation in gene expression profiles, both at an inter‐ and intratumour level. They described new sets of genes that, according to their expression, were associated with prognosis in the different tumour types, underlining the clinical importance and the validity of protein expression versus mRNA or genetic alterations. For example, in lung carcinoma, they proposed a prognostic correlation with the expression of the genes ERO1A, S100A16, S100A6, MKi67, SLC2A1, TACC3, ANLN, and CADM1.103-105 Assessment of intratumour heterogeneity based on protein expression Currently, the most robust readout for ITH assessment comes from IHC. A classic example is ITH of oestrogen receptors, which may be positive in just 1% of cells; in fact, this ITH has been reported to be associated with long‐term risk of fatal breast cancer.106 Other examples are the heterogeneous expression of cyclin D1 in mantle cell lymphomas, which otherwise carry a homogeneous CCND1–IGH translocation107 and the subtype of HER2+ breast or gastric tumours that can range from 10% to 100% positive cells.9, 108 Within an entire tumour, protein expression often depends on local factors such as hypoxia, nutrient starvation or oxidative stress, independently of the cell's genetic background. These environmental cues can alter entire signalling pathways downstream of well‐established oncogenic alterations.109 Many tumours may have activating mutations in the most upstream elements of certain signalling cascades, such as RAS, EGFR and HER2, but phosphorylation of downstream factors such as MAP‐kinases or mTOR may be inhibited by environmental factors;110 therefore, even if specific driver genetic alterations are inhibited, no effect will be observed in cells in which these signalling pathways are inhibited by such factors.109, 111 Evaluation of heterogeneity in immune checkpoints and inflammatory cells Primary tumours have heterogeneous epithelial cell content, and form an ecosystem with the environmental cells, including stromal cells, endothelial cells, leucocytes, lymphocytes, histiocytes and their secreted factors. In a pathological context, we can quantify and evaluate the expression of the immune checkpoints programmed cell death ligand 1 (PD‐L1) and programmed cell death‐1 (PD‐1) in epithelial and inflammatory parts of the tumour and use this information for clinical correlation studies. Similar to cell signalling pathways, key components of immune checkpoints, such as PD‐L1, can also have heterogeneous expression throughout the tumour.112 The PD‐L1 protein is expressed in a wide range of cell types, including lymphocytes, macrophages and dendritic cells, and is stimulated by variable and complex mechanisms. In contrast to other immune checkpoint components, PD‐L1 is rarely expressed in normal tissue but is induced in tumour‐associated tissue, is a tumour biomarker and is also an attractive drug target.113, 114 As many current treatment schemes are based on immunotherapy, pathological assessment should include immune checkpoint proteins. Furthermore, the heterogeneous and dynamic expression of factors such as PD‐L1 in basal conditions and in response to different treatments presents a challenge to predicting which patients will respond to anti‐PDL1 therapies. The assessment of CD4+, CD8+ cells, and tumour mutational burden (TMB) can also be helpful in clinical decision‐making. TMB has recently been proposed as a new biomarker to quantify the potential tumoral neoantigenicity, with the aim of predicting patients who will benefit from immunocheckpoint inhibitors. Nevertheless, different technologies and different thresholds have been proposed to define high versus low TMB in different tissue samples.115-117 Finally, the role of the microenvironment in carcinogenesis is gaining importance, although in small biopsies it is impossible to integrate the role of leucocytes, stromal cells and lymphocytes and the assessment of immune checkpoints. Discussion The Solution: To Integrate Clinical, Radiological, Molecular and Expression Data Within a Tissue Context We postulate that cancer formation is a consortium of tumour cell clones, microenvironmental cells and local stressors (such as hypoxia) that alter protein expression and enhance tumour heterogeneity. Therefore, we believe that cancer must be considered within the context of tissue type. The correct diagnosis of a tumour should assimilate the clinical, radiological, histopathological, molecular and proteomic data. As intratumour protein and molecules are highly heterogeneous and diagnostic biopsies are small, we envision that correlation with radiological imaging and nuclear medicine will be crucial to select areas that are more representative of the whole tumour. Determination of the exact histological type is crucial for an exact diagnosis; for example, in lung carcinoma there is a huge difference in prognosis and treatment between diagnoses of small‐cell carcinoma, adenocarcinoma or large‐cell carcinoma. Similarly, in ovarian carcinoma, prognosis and survival varies widely between types: high‐ or low‐grade serous carcinoma, endometrioid carcinoma, clear‐cell carcinoma or mucinous adenocarcinoma. Most tumours can be diagnosed according to histological criteria as high‐ or low‐grade. The distinction is based on the degree of cell differentiation, the intensity of cellular atypia and cell proliferation. A proliferation index, such as Ki67, can be used to quantify the percentage of replicative cells within a tumour. This simple protein can be detected regardless of which genetic alterations are inducing the proliferation. The above‐mentioned classical factors have all been validated by RNA and molecular data.103 Identification of master genes and funnel factors As described above, cellular stress can alter gene expression in tumour cells at several levels modifying biochemical signalling pathways and feedback loops,111 and protein expression can be heterogenous. While these biochemical changes are restricted to certain areas within the tumour, funnel factors such as p4E‐BP1 and peIF4E are usually expressed evenly throughout the tumour, regardless of the upstream oncogenic alterations and local environmental changes. The search for cellular targets expressed in most areas of tumours is becoming crucial to overcome tumour heterogeneity. Because of the huge amount of data and complex positive and negative feedback regulating the final signal and the biological effect, systems biology is becoming essential for the understanding and identification of the real nodes or factors which are drivers in specific tumours in individual patients. The proto‐oncogene myc in Burkitt lymphoma and the canonical nuclear factor kappa B heterodimer in diffuse large B cell lymphoma are classic examples of so‐called master genes.118-120 Advances in digital pathology Advances in digital pathology (whole slide imaging) now allow interpretation of digital slides on computer stations and integration of molecular features into the microscopic context. The differential expression of genes in different areas of the tumour can be interpreted precisely, and haematoxylin and eosin‐stained microscopic sections can be merged with multiple immunohistochemical stains for different proteins. Digital pathology also allows tumour annotation for microdissection for different tumour components, with appropriate cellularity assessment of tumour elements and the non‐neoplastic microenvironment. Digital pathology is essential to establish computerised algorithms to correlate molecular alterations with tumour phenotype. Tissue‐specific multiplex technology Given the numerous alterations in genes, protein expression and mRNA, it is clear that we will have to implement multiplex technologies that will allow us to study multiple factors simultaneously on the same histological sections. With this approach we can minimise the amount of tissue needed for molecular and protein studies and for quantification of the expression of different factors and their inter‐relationship. Different platforms are emerging, with different quantitative multispectral fluorescence approaches, or with mass spectrometry in situ, to allow the study and quantification of several dozen markers. Also, new next‐generation sequencing technologies are being implemented in routine testing combining DNA and RNA analysis from the same slide reducing the amount of tissue and also the ITH.121, 122 An interpretative and holistic data assessment with ‘deep learning’ (artificial intelligence with automatic learning) The main objective for the use of deep learning in pathology is to improve existing algorithms for biomarker quantification and to develop smart and robust algorithms. It can be based on three main areas or objectives: (i) tumour type classification, (ii) tumour prognosis (prediction system, learning from experience) and (iii) personalised treatment allocation system (also a reinforcement learning system). In fact, deep learning is already being applied in various tumour types, including breast, lung, melanoma and glioblastoma.123-126 The integration of such information and algorithms into everyday clinical practice can help to minimise subjective evaluations and improve the precise diagnosis for each tumour and patient (see Figure 2). Systems biology encompasses tools that hold great promise for deciphering the vulnerabilities of the tumour ecosystem as a whole. Studies are based on the premise that multiple oncogenic events converge on a number of cellular networks that may contain essential or synthetically lethal clinically targetable hubs or factors,127, 128 such as the eIF4F complex. Nonetheless, many contemporary systems biology approaches do not consider intratumour heterogeneity. This is relevant because key functional nodes within the metabolic, signal transduction and gene expression networks responsible for supporting the tumour phenotype are critically dependent on the heterogeneity of the tumour. These data can also help to classify tumours according to histopathological, biochemical and genomic features and thus help to tailor the diagnosis and clinical management to a patient's biological tumour profile. Accordingly, multidimensional molecular and gene expression data, which are associated with the response to antitumour treatments and clinical progress, are thought to facilitate the selection of patients who are more likely to respond to targeted or ‘precise’ therapies.129-131 The availability of systemwide data in a variety of cancers is facilitating the development of approaches that go beyond the classic, reductionist paradigms that associate single genes with cellular phenotypes and functions. Systems biology approaches consider the interplay between multiple molecular factors that underpin phenotype development. Accordingly, rather than a genetic disease, cancer is now perceived as a disease of ‘networks’,131 and to fully grasp the complexity of the tumour ecosystem the networks driving cancer need to be mapped and their dynamics and evolution over time deciphered. Emerging data show that these cancer networks are constantly rewired in part by clonal interactions, changing microenvironments and the acquisition of novel molecular alterations that are largely induced by anticancer treatments.127, 132 Therefore, minor subpopulations that are not readily detectable in bulk tumours or that can adapt to hostile environments may emerge following treatments that specifically target cancer‐driving mutations present in the predominant tumour subpopulations. Thus, in the coming years, systems biology implementation may be crucial for (i) detailed, clinically oriented subclassification of cancer types, (ii) mapping of oncogenic networks and identification of the critical nodes to overcome the effects of ITH and (iii) informing future preclinical research and design of Phase I clinical trials by anticipating therapy response in silico and predicting the best targets for each patient and tumour (personalised cancer therapy or precision medicine). Liquid biopsies As biopsies are associated with a degree of invasiveness and cannot always be repeated, new approaches have been proposed, such as the analysis of circulating tumour cells (CTCs), plasma‐derived cell‐free tumour DNA (cfDNA) or RNA and, more recently, DNA from circulating tumour exosomes in blood.133-135 This strategy enables a global assessment of the constellation of somatic genetic alterations in a tumour irrespective of its anatomical location, and is becoming a good alternative for the study of a tumour mutational landscape in situations where biopsies or surgical samples are difficult to obtain. Hence, liquid biopsy appears to be a very relevant tool for the identification of potential actionable genomic alterations and therapeutic targets, monitoring treatment response, predicting disease progression before clinical and radiological confirmation and identifying mechanisms of resistance in the particular context of patients with early‐stage and metastatic disease.136, 137 Furthermore, liquid biopsy provides additional cues on ITH, as reported in a recent pilot study in patients with early‐stage NSCLC.138 Conclusion Tumours show such a degree of morphological, molecular and proteomic heterogeneity, and a close relationship with microenvironmental factors, that for the accurate pathological evaluation of tumours an integrated approach seems essential: all genomic and proteomic data should be evaluated taking into account the heterogeneity and tissue type (Figure 3). We propose the integration of all such factors, along with the classical pathological factors, within the context of the tissue; we call this approach tissunomics. Acknowledgements S.R.Y.C. acknowledges support from Fondo de Investigaciones Sanitarias (FIS; PI17/02247 and PI14/01320), Centro de Investigación Biomédica en Red de Cáncer (CIBERONC; CB16/12/00363) and Generalitat de Catalunya (AGAUR; 2017 SGR 1799 and 2014 SGR 1131). Conflicts of interest All authors declare no conflicts of interest. References
|
|
Suggested by
Société Francaise d'Immunologie
May 13, 2019 2:43 PM
|
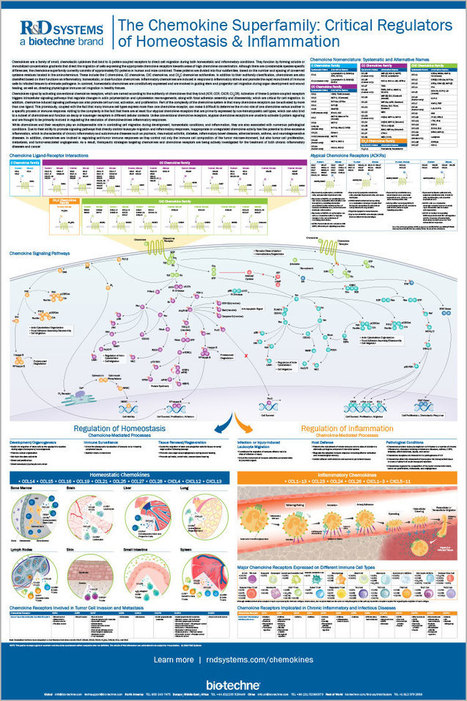
R&D Systems is a global resource for cell biology. Find quality proteins, antibodies, ELISA kits, laboratory reagents, and tools.
|
|
Scooped by
Gilbert C FAURE
May 11, 2019 2:19 PM
|
|
|
Suggested by
Société Francaise d'Immunologie
May 11, 2019 7:05 AM
|
Research ArticleImmunology Free access | 10.1172/jci.insight.126732 Differential transcriptome and development of human peripheral plasma cell subsets Swetha Garimilla,1 Doan C. Nguyen,2 Jessica L. Halliley,3 Christopher Tipton,4,5 Alexander F. Rosenberg,6 Christopher F. Fucile,7 Celia L. Saney,2 Shuya Kyu,2 Denise Kaminski,8 Yu Qian,9 Richard H. Scheuermann,9 Greg Gibson,1 Iñaki Sanz,4,5 and F. Eun-Hyung Lee2,5 First published April 2, 2019 - More info Abstract Human antibody-secreting cells (ASCs) triggered by immunization are globally recognized as CD19loCD38hiCD27hi. Yet, different vaccines give rise to antibody responses of different longevity, suggesting ASC populations are heterogeneous. We define circulating-ASC heterogeneity in vaccine responses using multicolor flow cytometry, morphology, VH repertoire, and RNA transcriptome analysis. We also tested differential survival using a human cell-free system that mimics the bone marrow (BM) microniche. In peripheral blood, we identified 3 CD19+ and 2 CD19– ASC subsets. All subsets contributed to the vaccine-specific responses and were characterized by in vivo proliferation and activation. The VH repertoire demonstrated strong oligoclonality with extensive interconnectivity among the 5 subsets and switched memory B cells. Transcriptome analysis showed separation of CD19+ and CD19– subsets that included pathways such as cell cycle, hypoxia, TNF-α, and unfolded protein response. They also demonstrated similar long-term in vitro survival after 48 days. In summary, vaccine-induced ASCs with different surface markers (CD19 and CD138) are derived from shared proliferative precursors yet express distinctive transcriptomes. Equal survival indicates that all ASC compartments are endowed with long-lived potential. Accordingly, in vivo survival of peripheral long-lived plasma cells may be determined in part by their homing and residence in the BM microniche. Graphical Abstract Introduction High-affinity IgG and IgA antibodies provide serological memory that affords protection against previously encountered pathogens. The serologic protection is mediated by long-lived plasma cells (LLPCs), which have been identified in human bone marrow (BM) and the gastrointestinal tract (1–3). Initial response to vaccination is mounted by proliferative antibody-secreting cells (ASCs), which are highly enriched for antigen-specific cells that undergo a massive expansion for approximately 5–14 days after immunization (4–7). Yet, a fundamental gap in understanding remains regarding whether intrinsic programs of the ASC or extrinsic environmental factors determine survival to become an LLPC. The classic ASC population in blood is based on the relative expression of CD38 and CD27 on CD19+ cells. However, heterogeneity of the circulating ASC populations has been described extensively (8–12). Characterization of the CD19+ ASCs has recognized both CD138+ and CD138– populations in the blood after vaccination (4, 9, 12–14) and during steady state (12). Additional markers such as HLA-DR, Ki-67, CD95, and CD126 demonstrate recent activation of the ASCs in the blood after immunization (13). However, by focusing only on CD19+ ASCs (after excluding CD20+ cells), the complexity of blood ASC subsets in healthy vaccine responses would not have considered the CD19– ASC populations that resemble LLPCs (1). In autoimmune patients, the CD19– ASCs appear in the blood of diseased patients during flares (15), and recently, CD19–ASCs were also described after vaccination of healthy adults (14). Interestingly, contrary to proposed models of the release of old PCs from BM microniches, the CD19– ASC subsets in the blood were shown to have a fraction of new ASCs generated in response to vaccination (14). The identification of CD19–CD38hiCD138+ LLPCs (1) suggests that unique surface markers may play a role in maintaining survival. For example, CD138 was shown to play a direct role in PC survival in mouse models (16). By contrast, the role of CXCR4 in long-lived survival may be related to BM homing rather than intrinsic mechanisms (11). Additionally, loss of markers such as CD19, HLA-DR, and BCR may play a role in survival, although there is little evidence for this observation. Another interpretation for the loss of some markers may actually reflect distinct changes in the intracellular pathways such as G2M checkpoints, metabolism, apoptosis, and autophagy that have been described to sustain LLPCs (1, 17, 18). Nonetheless, it is unclear whether the unique surface markers on heterogeneous ASC populations signify intrinsic differences in cell survival programs. Germinal center responses play a crucial role in LLPC generation. It is thus possible that specific blood ASCs are imprinted during priming in the germinal center by the local milieu consisting of IL-21 from T follicular helper (Tfh) cells, follicular dendritic cells, and other T cell help (19–23). Thus, ASC heterogeneity may have evolved to distinguish particular ASC subsets with unique intrinsic mechanisms that are programmed to become long-lived. In addition to intrinsic mechanisms, extrinsic factors appear to play a critical role in LLPC survival. The BM survival niche plays an important role in the maintenance of LLPCs. The specialized niche that consists of hypoxia, secreted factors from the BM mesenchymal stromal cells (MSCs), and the cytokine APRIL, has recently been shown to maintain human ASCs for over 50 days in culture (24). Whether this environment actually changes the phenotype of the peripheral circulating blood ASCs into LLPCs or merely provides survival factors is still unclear. In this study, we used FLOw Clustering without K (FLOCK), an automated flow cytometry analysis program (4), to identify 5 distinct populations of ASCs that can be consistently isolated from human blood. Our data validate 3 CD19+ and 2 newly described CD19– ASC populations after vaccination. We also show that the majority of circulating CD138+ ASCs (both CD19+ and CD19–) are active participants in new vaccine responses and have undergone recent proliferation. Next-generation sequencing (NGS) analysis of the VH repertoire shows oligoclonality with a large degree of interconnectivity among the 5 subsets, and despite unique RNA signatures distinguishing populations 2 and 3 (CD19+) from population 5 (CD19–), those 3 populations have similar long-lived survival potential. Results Heterogeneity of human ASC subsets in blood. Human antibody responses after vaccination strongly correlate with a transient increase in circulating ASCs characterized by a CD19+CD27hiCD38+ phenotype (4, 25–28). However, the exact contribution of such cells to the long-lived protective antibody production is unclear, in part due to incomplete characterization of the ASC response and over-reliance on the expression of CD19. To address these questions, we performed PBMC fractionation of CD19+ and CD19– populations within CD3–CD14– cells at the peak of the ASC response after tetanus toxoid and influenza vaccination (6–7 days after immunization) (6). Interestingly, CD19– fractions were detected, albeit smaller in frequency than the CD19+ fractions (Figure 1A). Given the high frequency of vaccine-specific ASCs in both fractions, CD19+ and CD19– cells were analyzed using flow cytometry, yielding 5 putative ASC subsets distinguished by their relative expression of CD38 and CD138; these are population (pop) 1 (CD19+CD38+CD138–), pop 2 (CD19+CD38hiCD138–), pop 3 (CD19+CD38hiCD138+), pop 4 (CD19–CD38hiCD138–), and pop 5 (CD19–CD38hiCD138+) (Figure 1A and Table 1). Figure 1 ASC subsets in human blood 7 days after tetanus vaccination. (A) Top panels divide the CD19+ and CD19– fractions. Lower panels represent subsets of CD19–IgD– (left) and CD19+IgD– (right) fractions. (B) Morphology of blood ASC subsets (×100 magnification) by Wright-Giemsa stain. Left column: Sorted blood ASC subsets on day 7 after tetanus vaccination. ASC populations (pops) 1 to 5 and naive B cells are shown. Right column: Percentage of intracellular BLIMP-1 staining per subset is shown in blue histograms (naive controls in red). (C) Percentage of each ASC subset and naive B cells (N) expressing IgG, IgA, or IgM isotypes after peak vaccination. (D) Quantification of each blood ASC subset (pops 1 to 5) in cells/ml (top) and percentage of PBMCs (bottom). (E) Quantitative RNA expression of 5,000 sorted ASC subsets and naive and memory B cells for Pax5 (top), BLIMP-1 (middle), and Xbp-1 (lower), normalized to GAPDH in blood. Relative mRNA expression is expressed in arbitrary units. Table 1 Phenotype of blood ASC subsets 1 to 5 (number, %) We also employed an unbiased automated flow-gating program, FLOCK, with CD19+ and CD19– fractions, and validated these 5 subsets. FLOCK clusters cells in multidimensional hyperdense regions for each of the markers and separates cells into different subsets if they differ from other clusters in at least one marker/dimension. Previously, we identified pop 1 within the CD19+ fractions using FLOCK (4), although it is a relatively minor fraction of the CD19+ ASCs. This unsupervised approach revealed no additional ASC subsets for 6 subjects (Supplemental Figure 1 and Supplemental Table 1; supplemental material available online with this article; https://doi.org/10.1172/jci.insight.126732DS1), demonstrating that our characterization using CD19, CD38, and CD138 is useful and consistent for elaborating the cellular basis of humoral immune responses. Morphology and expression of PC transcription factors. The nature of the ASC subsets identified by flow cytometry was validated by multiple approaches including morphology, expression of transcription factors involved in PC differentiation (BLIMP-1 and Xbp-1), and spontaneous antibody secretion. Morphology was ascertained by cytospin with Wright-Giemsa staining of each sorted ASC subset present in the blood after tetanus vaccination of 2 subjects (ages 50 and 59 years). Pops 1 to 5 had ASC characteristics including large size with big, eccentric nuclei and enlarged cytoplasm, distinct nucleoli, and a prominent Golgi zone (Figure 1B). Nearly all cells in pops 2 to 5 had intracellular BLIMP-1 protein detected by flow cytometry (Figure 1B). Interestingly, IgG isotypes were highest in ASC pops 2 to 5 except for pop 1 (Figure 1C). None were observed in naive B cells. Pop 1 had variable expression of BLIMP-1, suggesting it comprises an early or mixed population of ASCs. Pops 2 and 3 (CD19+ subsets) made up the largest frequencies of all the blood ASC subsets, and pops 4 and 5 (CD19– subsets) were the least abundant (Figure 1D). Additionally, pop 4 was quite heterogeneous; thus, additional backgating of the BLIMP-1–positive pop 4 cells showed no difference in forward or side scatter compared to other ASC populations (Supplemental Figure 2). All peripheral blood ASC populations (pops 1 to 5) were characterized by RNA expression of BLIMP-1 and Xbp-1 and absence of Pax5 (Figure 1E). In contrast, Pax5 expression was higher in naive versus memory B cells, neither of which expressed Xbp-1. BLIMP-1 was undetectable in memory B cells. The lack of Pax5 expression and increased BLIMP-1 expression in pop 1 suggests a process of differentiation from a B cell into an ASC. Xbp-1 is downstream of BLIMP-1 expression; thus, lower Xbp-1 expression observed in pop 1 compared with pops 2 to 5 also suggests that pop 1 may represent an earlier stage in ASC differentiation, or a mixed population of activated B cells that have already downregulated Pax5. A low level of BLIMP-1 expression was observed in naive B cells, which may have been due to a fraction of activated naive cells, or a small number of contaminating B1 cells, since only IgD and CD27 were used to discriminate the naive population, noting that a low level of BLIMP-1 expression has been reported in mouse B1 cells (29). Flow characteristics of blood ASC subsets. As B cells differentiate into ASCs, they undergo massive proliferation and lose features of B cells (such as CD20 and surface Ig), exit cell cycle, gain expression of BLIMP-1, and upregulate receptors for homing to the BM (30–32). Accordingly, we used multiparameter flow cytometry to evaluate these characteristics (Figure 2 and Table 1). As shown in Figure 2A, CD20 was downregulated on nearly every cell in pops 2 to 5, consistent with the loss of CD20 that begins as early as 7 days after vaccination in newly formed ASCs (4). However, pop 1 contained a mixture of cells positive for CD20, suggesting it is the earliest ASC phenotype with downregulation of Pax5 (Figure 1D). In contrast, surface Ig was highest on pop 1 and gradually downregulated in pops 2, 3, and 5 (~34%–45%; only ~8% in pop 4). These proportions of blood ASCs with surface Ig were higher than those found on LLPC (pop D) BM subsets (1). Interestingly, circulating ASC pops 2, 3, and 5 uniformly expressed high levels of CD27, a member of the tumor necrosis factor receptor (TNFR) family that is upregulated during B cell activation and is linked to PC differentiation (33), whereas the lowest frequencies of CD27 expression were found in pop 1 (~17%) (Figure 2A). Figure 2 Phenotype of blood ASC subsets on day 7 after vaccination. (A) CD20, surface Ig (kappa and lamda), and CD27 staining for blood ASC subsets and naive B cells (CD19+IgD+CD27–) illustrated in blue relative to controls in gray (also shown in right-hand panel). (B) HLA-DR and Ki-67 staining for blood ASC subsets. Far right: CD14+ peripheral blood monocytes served as controls for HLA-DR staining and naive B cells for Ki-67. (C and D) Frequency of CXCR4, CD28, IL-6R, FCGR2B, and BCMA in blood ASC subsets (pops 2 to 5) and naive B cells. Respective numbers of subjects are listed in Table 1. HLA-DR, a marker of cell activation previously shown to decrease during PC maturation (9), was highly expressed on nearly all blood ASC subsets (Figure 2B), which contrasts with its near absence on LLPC BM PC subsets (1, 2). We also found that Ki-67, a nuclear protein associated with recent cell division, was expressed by most cells in pops 2 to 5 and at a lower frequency of cells in pop 1 (Figure 2B). Thus, nearly all postvaccination ASCs in peripheral blood expressed Ki-67, consistent with the idea that these cells were recently generated, again in direct contrast to BM PCs (1). The relative expression of molecules involved in LLPC homing and survival were evaluated on blood ASCs (Figure 2C). For example, CXCR4, a chemokine receptor implicated in PC homing and retention in the BM (32, 34), was most commonly expressed in pop 1 and gradually decreased proportionately in pops 2 through 5 (Figure 2C). CD28, a costimulatory molecule associated with LLPC survival (35), which was known to have approximately 20% expression on BM LLPCs (1), was virtually absent on any of the blood ASC subsets. We previously reported that the IL-6R expression was very low on BM PC subsets despite the important role of IL-6 in PC survival (36). However, in the blood, ASC pops 3 to 5 expressed high levels of IL-6R (Figure 2C). Finally, the expression of the inhibitory FCGR2B, which promotes PC apoptosis (37), showed wide variation from subject to subject, but was typically low in blood ASC subsets compared with BM subsets (1) (Figure 2D). Lastly, B cell maturation antigen (BCMA), also known as TNFR superfamily member 17 (TNFRSF17), the receptor for APRIL, was uniformly expressed on pops 2–5 (Figure 2D), demonstrating the importance of this cytokine. Together, these results demonstrate that blood ASC subsets are Ki-67+ and HLA-DR+, suggestive of recent proliferation and activation. ASC subsets before and after vaccination in blood. Overall, compared with day 0 (~0.5%), we found that ASCs represented a larger fraction of circulating PBMCs 7 days after vaccination but with variable input from the different populations, as CD19+ (pops 1, 2, and 3) contributed in excess of 95%. This frequency is in keeping with the postvaccination levels of circulating ASCs previously established by enzyme-linked immunospot (ELISpot) analysis, which typically represent a 5- to 20-fold increase over steady-state levels (28). Therefore, we sought to determine the relative contributions of the different ASC subsets to this substantial increase after tetanus vaccination. We performed multicolor flow cytometry in 8 healthy adults prior to (i.e., steady state) and at peak vaccine responses. We removed pop 1 due to its low abundance and heterogeneity. The average total number of ASCs in each population increased after vaccination as follows: pop 2 increased by 7.6-fold, pop 3 increased 33-fold, and pop 5 increased by 13-fold. Thus, the relative abundance at steady-state and peak vaccine responses were different. During steady state, pop 2 (~60%–80%) dominated the ASC ratios with almost no pop 5; however, vaccination induced relative increases of expansions of pops 3, 4, and 5 in all 8 subjects, with corresponding decreases in pop 2 proportionally (Figure 3A). This appearance of CD19+CD138+ fractions (pop 3) for healthy adults after immunization is consistent with previous observations after tetanus vaccination (13). Figure 3 Ratios of ASC subsets in blood and BM. (A) Pie charts representing proportions of pops 2, 3, 4, and 5 in the blood from 8 different adult subjects at steady state (top) and at peak (days 6–7) ASC response in blood after tetanus vaccination. The proportion of each ASC subset is represented by the corresponding sector size of the pie chart. Kinetics of the ratios of the ASC in the blood after tetanus vaccination is shown for subject 3 (inset). (B) From 8 additional subjects, ratios of pops A, B, C, and D in the BM and blood pops 2, 3, 4, and 5 were matched at the time of the BM aspirate. ASC subsets in blood and BM (pops 1 and Z) are not included. Pops 2 and A, pops 3 and B, pops 4 and C, and pops 5 and D (LLPC subset) are shown in tan, red, blue, and green, respectively. Frequencies of ASC subsets in blood and BM. Direct comparison of the quality and quantity of the ASC subsets in 8 healthy asymptomatic adults (mean age 48.5, range 43 to 56 years) was also performed for matched blood and BM samples from the same subject. Pop A in the BM, which contains surface markers similar to those in ASC pop 2 in the blood, make up a markedly smaller percentage of BM ASC subsets compared with the blood (Figure 3B). The relative frequencies of the different ASCs were remarkably conserved in all 8 BM samples analyzed, with CD138+ (pops B and D) representing the most abundant subsets. Pop 5 could be detected in the blood in some subjects at steady state, but most of these cells were positive by Ki-67 staining (Figure 2B), thereby distinguishing them from BM pop D (Ki-67–) with the same surface markers (1). We found that at steady state, pop 5 had similar Ki-67+ staining that resembled the blood pop 5 during acute immune responses, implying that they are newly generated ASCs and not BM emigrants released in the blood from the BM niches. NGS of the VH antibody repertoire of ASC subsets. NGS was used to assess the complexity and connectivity of the antibody repertoire expressed by the different ASC subsets. Pops 1 to 5 were sorted from a 45-year-old adult after tetanus vaccination and 3,174; 5,000; 5,669; 2,550; and 1,994 cells, respectively, were collected. NGS was performed using Illumina MiSeq Amplicon sequencing with primers positioned in the framework region FR1 of the VH1–VH6 families, and in constant regions corresponding to the IgM, IgG, and IgA isotypes (Figure 4). Sequences were considered part of the same clonal lineage if they shared the same V and J gene segment rearrangement and a CDR3-H of identical length with at least 85% sequence similarity based on our previous studies (38). Total numbers of lineages for pops 1–5 were 984, 943, 825, 83, and 311, respectively. The overall degree of clonality was quantified using D50 or D20 scores calculated as the number of clonotypes accounting for the top 50% or 20%, respectively, of all size-ranked clones within a given population. For ASC pops 1 to 5 and memory B cells, the IgG D20 scores were 14, 2, 2, 1, 2, and 2, and D50 scores were 65, 4, 6, 3, 5, and 9, respectively, demonstrating that each subset at the peak of the vaccine response is dominated by a small number of substantially expanded ASC clones (Figure 4A). Switched memory (SWM) B cells were also oligoclonal, whereas the naive B cells were polyclonal with D20 and D50 scores of 910 and 3,674, respectively. The diversity of the VH-gene repertoire is demonstrated by the Hill diversity score and was highest in pop 1 compared with the other ASC subsets (Figure 4B). Finally, the composition of the isotypes of the VH sequences in the ASC subsets (Figure 4C) were switched between IgG and IgA sequences, with predominantly IgA compared with IgG in pop 1, whereas pops 2 to 5 and SWM B cells were higher in IgG. Very little IgM isotypes were found in the ASC subsets or SWM B cells, whereas naive B cells contained only IgM sequences, as expected. Figure 4 Next-generation sequencing (NGS) repertoire sequencing of blood ASC subsets. NGS was used to analyze the clonal repertoire of the ASC populations, naive B cells, and isotype-switched memory B cells. (A) Diversity of the repertoire is shown by plotting lineage (clone) size versus the cumulative percentage of sequences determined from size-ranked clones. Largest clones are found at the top of the plot and account for a greater area within the subdivided plots. More diverse repertoires, such as the naive population here, only contain small clones in a more even representation. (B) Hill diversity profiles for each population (with different levels of sampling) demonstrate the overall diversity of the repertoire in each of the ASC populations. (C) Relative quantities of IgM, IgG, and IgA sequences in each subset. Naive is predominantly IgM. Blood ASC subsets 1 to 5 and switched memory B cells show mostly IgG and IgA. (D) Circos plot shows interconnectedness of the ASC populations by plotting the sequences from each population in clonal size–ranked order, with the largest clones being in the most clockwise portion of each population segment. The outer-most track shows the isotype makeup of each clone by color. The next track in shows mutation frequency of each sequence, with more mutations represented as more distal from the center of the plot. The next track in shows the number of sequences, followed by the clonality displayed by a circular stacked bar plot. Here, only the largest 50% of the clones are colored to avoid blurring of small clones. The internal connections show clones found in multiple populations. (E) Stacked bar plots again demonstrate the diversity of the repertoire by showing size-ranked clones as segments taking up a percentage of the total repertoire. The largest 10 clones of all populations are colored and like-colors demonstrate the same clone in multiple populations. (F) The Morisita overlap index demonstrates the similarity of repertoires in various populations as a value from 0 (no similarity) to 1 (identical repertoires). The color strength is indicative of interconnectivity. Next, the actively expanded blood IgG, IgA, and IgM ASCs in response to immunization shared similar repertoires, as shown in the outer circos plot tracks (Figure 4D). Connectivity of the repertoires among subsets is also shown by the circos plot (39) (Figure 4D). Blood ASCs were largely oligoclonal with a repertoire dominated by a few clonotypes, many of which in ASC pops 2 to 5 were shared (Figures 4, D and E). The SWM B cells were also highly oligoclonal with many shared clones, in contrast to the naive B cell subset. Many of these same clones were also shared by ASCs in pop 1, but consisted of much smaller clonal populations (Figure 4E). Pops 1 to 5, as well as SWM B cells, were all highly interconnected as quantified by the high Morisita overlap indices (Figure 4F), but this was not the case comparing ASCs with naive B cells. In conclusion, the VH repertoire analysis demonstrates oligoclonality, rich interconnections, and predominately IgG isotypes among the circulating ASC subsets and SWM B cells on day 7. Mutation analysis and VH lineage analyses. On average, all blood ASC pops 1 to 5, which were mostly class switched to IgG or IgA, were highly mutated with similar average mutation frequency, as defined by the number of mutations in each sequence divided by length of that sequence (Supplemental Figure 3A). Intraclonal mutation analysis was also conducted to determine progression of ASC populations within individual clones. In this analysis, average mutation frequencies for each individual population were compared to average mutation frequencies of all populations in that same clone. By examining the mutation frequencies this way, we can get a better picture of which populations tend to have higher or lower mutation frequencies compared with other populations within the same clone. This analysis showed some deviations of the individual ASC populations’ mutation frequencies, namely that pop 4 tended to have the highest mutation frequencies in clones, while SWM and pop 2 tended to have the lowest (Supplemental Figure 3B). To follow the possibility of sequential acquisition of mutations for the different subsets, we analyzed the VH repertoire of 5 of the largest individual clones that shared lineages in pops 1 to 5 using IgTree (40) and PHYLIP phylogenetic analysis. Within the 5 clones, the number of nodes shared among the various populations of ASCs was striking. No apparent progression or sequential differentiation was found, but instead the ASC populations were highly intermixed throughout the phylogenetic tree. An example of one clone shows a deep IgTree structure with high interconnectedness between populations, illustrating the single origin of the multiple blood ASC subsets (Supplemental Figure 3C). Thus, we concluded that sequential increases in progressive accumulation of mutation did not occur from pops 1, 2, 3, 4, and 5, but each clone segregated into independent branches, demonstrating that both CD19+ and CD19– subsets arise from a common B cell progenitor. Tetanus IgG secretion in blood ASC subsets. The secretory function of different ASC subsets was validated by measurement of constitutive antibody secretion as well as participation in antigen-specific responses after tetanus vaccination. Spontaneous total IgG and tetanus-specific IgG without in vitro stimulation were assessed by ELISpot assays in 6 adults (mean age 44 ± 11 years, range 27–59 years) from blood after tetanus boosting. Cells constitutively secreting IgG were detected in all 5 ASC subsets but not every subject had adequate numbers of pops 4 and 5 for FACS analysis. Nonetheless, tetanus-specific IgG ASCs were highly enriched in both CD19+ (pops 1, 2, and 3) and CD19– (pops 4 and 5) ASC fractions when present (mean 19%, 29%, 33%, 33%, and 25% for pops 1 to 5, respectively) (Figure 5, A and B). Thus, all circulating ASCs (including the CD19– and CD138+ subsets) can contribute similarly to the short-term response to tetanus immunization. Figure 5 Vaccine-specific IgG ASC frequencies 7 days after tetanus vaccination. (A) ELISpot of total IgG (top) and tetanus-specific IgG (lower) ASC frequencies from sorted ASC subsets (pops 1 to 5) in the blood. Naive B cells and total PBMCs are also shown. The total number of sorted cells per well is indicated adjacent to each well. (B) Percentage of tetanus-specific IgG/total IgG ASC frequencies from sorted ASC subsets (pops 1–5) in blood ASC populations from 8 adults. Note: some patients had limited frequencies of pops 4 and 5, which could not be sorted. Comparative transcriptome analysis of 3 ASC subsets. The transcriptomes of pops 2, 3, and 5 were contrasted by analysis of variance of RNA sequencing (RNA-seq) profiles of 6 donors (labeled Sub 06 to 11). Two-way hierarchical clustering of 674 genes differentially expressed among the 3 ASC pops shows that pop 5 is significantly different from pops 2 and 3 (Figure 6A). This basic distinction between the CD19– and CD19+ ASCs is supported by principal component analysis (PCA), since PC1, which captures 56% of the gene expression variance, separates pops 2 and 3 from pop 5, while PC2 (7%) distinguishes pop 2 and pop 3 (Supplemental Figure 4). Furthermore, the 464 genes upregulated in both pops 2 and 3, and 210 genes downregulated relative to pop 5, lead to coclustering of the pairs of samples within individuals, implying that the 2 subtypes are transcriptionally closely related within subjects. Figure 6 Transcriptomic analysis of ASC subsets. (A) Heatmap of 672 transcripts differentially expressed among pop 2, pop 3, and pop 5 RNA-seq profiles from 6 subjects. Red color indicates relatively high expression, blue low expression. Two major blocks of genes upregulated or downregulated in pop 5 relative to pops 2 and 3 are indicated. Sample identities to the right show that pairs of samples from the same individual tend to cluster together. (B) Heatmap of PC1 of 29 gene sets found to be enriched in the differentially expressed genes also shows differentiation of pop 5 from pops 2 and 3, with only minor differences between the latter two. (C) Bubble plots show significantly biased gene sets in each pairwise comparison, with the size of the bubble proportional to the negative logarithm of the P value for the normalized enrichment score indicated along the x axis (see Supplemental Table 2 for full list of pathway names). Gene set enrichment analysis (GSEA) reinforces this similarity between pops 2 and 3 in comparison with pop 5 and highlights 29 gene sets that are differentially regulated. These gene sets summarize biological functions that are likely to differ between the pops, and are visualized in 3 different ways since raw summary statistics can misrepresent the relationship between upregulation of transcription and pathway activity. In Figure 6B (and Supplemental Figure 5), the first principal component, which in all cases explains over 45% of the variance in the gene set and has been polarized to ensure that positive values represent a preponderance of upregulated transcripts in the gene set, suggests upregulated pathways of cellular metabolism (adipogenesis, glycolysis, oxidative phosphorylation, fatty acid metabolism, and mTORC1 signaling), stress-induced pathways (DNA repair, UV response, and unfolded protein response), and cell cycle pathways (E2F targets, Myc targets, and G2M checkpoints) in pops 2 and 3. By contrast, several signaling pathways (JAK-STAT3, PI3K-AKT, IFN response, TGF-β signaling, and TNF-α signaling) as well as the hypoxic response appear to be elevated in pop 5. Figure 6C reinforces most of these conclusions by presenting the results of normalized enrichments scores for each pathway, but further reveals a gradient whereby pop 2 is more extreme than pop 3 for several pathways, namely downregulation of TNF-α signaling and upregulation of Myc and E2F target. G2M checkpoint regulators decreased expression with acquisition of CD138 and loss of CD19. This difference in dysregulated pathways suggests different cellular functions for pops 2 and 3 in comparison with pop 5. To visualize differentially expressed genes contributing to pathways, we used spider plots (Figure 7) to contrast the directions of all genes in a gene set whose transcript abundance significantly differed between 2 or more of the ASC subsets. We included some gene sets from which the hallmark pathways are derived and which were of a priori interest. For example, for apoptosis (contained within allograft rejection), hypoxia, TNF-α signaling, and the cell cycle (E2F targets, G2M checkpoints), pop 5 shows very clear upregulation of specific genes resulting in a green polygon that is more expanded along the arcs of the web, whereas the blue-colored pop 3 and pop 2 differential expression is more similar to one another, producing overlapping polygons. This analysis also indicates reduction in expression of all or most of the indicated genes encoding extracellular matrix (ECM) or unfolded protein response (UPR) functions in pop 5. It is not, however, simple to extrapolate transcript abundance to biological functions. For example, the hypoxic response engages 6 genes involved in autophagy; 3 inhibitors of the process (LDHA, PRKCB, and CYBB) are elevated in pop 2, whereas another, MAPK3, is elevated in pop 5, while PIK3CD and MTOR also regulate ER stress and autophagy, yet are expressed in opposite directions. Prediction of the consequences of differential expression awaits systems modeling that is sensitive to the precise nature of which genes are up- or downregulated jointly. Figure 7 Significantly differentially expressed genes in selected pathways. Spider plots of significantly differentially expressed genes in 6 selected pathways showing differences among the 3 ASC populations. Rays of each plot represent transcript abundance for the indicated gene, with low values in the center and high at the periphery. Polygons link observed transcript levels in each cell type, showing how pop 5 differs from pops 2 and 3. ASC survival potential in a human in vitro BM culture system. To discriminate the differential survival potential upon arrival in the BM microniche, we developed an in vitro cell-free culture system that mimics the human BM microenvironment, as previously described (24). For proof of concept using one abundant blood ASC pop 3, we performed long-term cultures and compared survival for 50 days in the BM MSC secretome alone or secretome with the addition of exogenous APRIL in normoxic or hypoxic conditions from a patient (age 23 years) 7 days after hepatitis A vaccination (Figure 8A). Pop 3 survival was barely maintained by day 50 in the secretome alone in normoxia, but a fraction of cells had better survival in secretome and hypoxia. Interestingly, survival was best overall with the secretome with the addition of exogenous APRIL in hypoxic conditions (Figure 8B). With optimal conditions for ASC survival similar to conditions previously shown with total blood ASCs (24), we sorted ASC pops 2, 3, and 5 from 2 subjects (38 and 25 years old) after tetanus toxoid or influenza vaccination, and cultured them in secretome with the addition of exogenous APRIL in hypoxia for 21 or 48 days, respectively (Figures 8, C and D). The low abundance and heterogeneity of pop 4 made them difficult to culture and maintain. The ASC subsets (pops 2, 3, and 5) were easily sustained in culture and pop 2 may have had a slight survival advantage earlier in culture (days 14–21); however, by day 48, pops 2, 3, and 5 had similar survival rates. Thus, both CD19+ (pops 2 and 3) and CD19– (pop 5) ASC subsets could be maintained in culture for nearly 2 months and all subsets have similar fractions of cells with LLPC potential. Figure 8 In vitro human BM microniche systems to measure long-lived survival of the subsets. (A) IgG ELISpots of pop 3 ASCs from a healthy adult after hepatitis A vaccine on days 0, 7, 35, and 50 in the BM MSC secretome (green) or BM MSC secretome with the addition of exogenous APRIL (red) in normoxia and hypoxia (blue open symbol or blue closed symbol). (B) Percentage of IgG ELISpots (relative to the maximal frequency) for pop 3 in MSC secretome in normoxia (green square), MSC secretome in hypoxia (open blue square), MSC secretome with the addition of exogenous APRIL in normoxia (red square), and MSC secretome with the addition of exogenous APRIL in hypoxia (blue square). (C) Percentage of IgG ELISpots from pops 2, 3, and 5 (relative to the maximal frequency for each population) from a healthy adult after tetanus vaccination on days 1, 7, and 21 in MSC secretome with the addition of exogenous APRIL in hypoxia. (D) Percentage of IgG ELISpots from pops 2, 3, and 5 (relative to the maximal frequency) from a healthy adult after influenza vaccination on days 1, 14, 28, and 48 in MSC secretome with the addition of exogenous APRIL in hypoxia. To understand if the ASC maturation required CD138 upregulation, we cultured FACS-isolated CD19+CD27hiCD38hi ASCs from a healthy adult in our BM mimic (MSC secretome, exogenous APRIL, and hypoxic conditions). We performed confocal staining of the ASCs before and 14 days after culture. We show an increased frequency of ASCs with CD138+ staining on day 14 (Supplemental Figure 6). Whether CD138– ASCs upregulated CD138 or CD138+ ASCs preferentially survived in the cultures will need additional studies. Nonetheless, increased frequencies of CD138+ ASCs are shown after culture in the BM microniche and are likely related to enhanced survival. Discussion LLPCs are the cornerstone of vaccinology and lifetime protective mediators of infection. It is widely accepted that during acute-recall immune responses, newly generated, proliferative ASCs with a short lifespan produce a transient burst of antigen-specific antibodies. After the initial response decays, pathogen-specific antibody production is sustained at lower levels by mature, nonproliferating, terminally differentiated PCs capable of surviving for many years in the BM (i.e., LLPCs) in the absence of additional antigenic stimulation. Whether all peripheral blood ASCs eventually evolve into LLPCs upon taking residence in BM survival niches, or if short-lived ASC and LLPC precursors are imprinted with a long lifespan based on the relative strength of antigenic signaling received by the corresponding precursor B cells, represent 2 distinct models (41). Discriminating between these 2 models is dependent on the ability to recognize different subsets of ASCs in the blood and their relationship with BM LLPCs. In this study, we demonstrate the heterogeneity of blood ASC subsets after vaccination by identifying both CD19+ and CD19– subsets with cell surface markers similar to BM PC subsets, as we have previously shown (1). Our results demonstrate significant heterogeneity of human ASC subsets in the blood after vaccination. These heterogeneous subsets include traditional plasmablasts (CD19+CD38hiCD27hi) and 4 newly defined ASC populations distinguished by their relative expression of the surface markers CD19, CD38, and CD138. Discovery and confirmation using FLOCK analysis (4) was essential to comprehensively identify all antibody-producing cells within these subsets. We also show that all circulating ASC subsets are active participants in recent vaccine/immune responses. Interestingly, peripheral CD19–CD138+ ASCs are universally proliferative (>90% Ki-67+) and contain antigen-specific responses with frequencies similar to conventional CD19+CD138– plasmablasts. Also, these antigen-specific ASCs with mature phenotypes are found in the periphery within a few days of immunization, arising at the same time as CD19+ ASCs. Most importantly, CD19– ASCs cannot be the result of displaced CD19– BM LLPCs, since BM LLPCs are almost universally Ki-67 negative (1). This conclusion is further supported by the high frequency of recent vaccine-specific cells and oligoclonality in the blood ASC subsets disclosed by VH repertoire studies within CD19– subsets. In contrast, VH repertoires of the BM PC subsets in healthy adults are highly polyclonal, representing an historical archive of a lifetime of exposures (1). Thus, the CD19–CD138+ ASC subsets in the blood are not displaced LLPCs from the BM microniche, but rather newer clones arising from the ongoing vaccine response. Composition of the antibody repertoire expressed by ASC and B cell subsets provides important clues regarding the origin, diversification, and selection of the compartments in question. Our results portray global repertoires expressed by multiple blood ASC subsets at the peak of vaccination, whereas previous studies had been limited to the analysis of a small number of randomly sampled single cells or global CD19+CD27hiCD38hi ASCs (instead of heterogeneous ASC subsets) (42, 43). The strong connectivity of the ASC subsets with the memory B cell fractions on day 7 may reflect the activated B cell phenotypes previously described as CD19+CD71+IgD–CD38lo/int (43). Consistent with single-cell studies, our global analyses demonstrate that responding ASCs were largely oligoclonal with highly variable rates of somatic hypermutation in the expanded clones, including some with rather low mutational load, a finding suggesting that some ASC clones might derive from recent differentiation of naive B cells. Nevertheless, the majority of expanded ASC clones were shared by all blood ASC populations and SWM B cells irrespective of the degree of mutation, which suggests they all derive from a common ancestral precursor B cell. Consistently, we also observe that, rather than forming a longitudinal gradient of progressive accumulation of mutation from pops 1 to 5 with shared VDJ clonotypes, individual clones within each ASC subset segregated into independent branches. These results indicate that all the circulating ASC subsets, including those with presumed mature phenotypes as indicated by the absence of CD19 and/or expression of CD138, derive from a common B cell progenitor. Then, they appear to develop through parallel differentiation of proliferating cells that acquire the characteristic cell surface phenotypes and divergent patterns of somatic hypermutation. Thus, ASC surface maturation (CD138 or loss of CD19) is likely independent of somatic hypermutation. Intriguingly, pop 1 had many IgA isotypes that predominated this subset with some connectivity to pops 2–5 and SWM B cells, albeit the least of all the subsets (Figure 4, A–F). Pop 1 ASCs were also the most diverse compared with the other ASC and SWM B cell subsets, suggesting that some ASCs in this population may originate differently. It is known that at steady state circulating ASCs are mainly IgA ASCs (44) (our unpublished data); however, the specificities remain unknown. Thus, pop 1 may contain both early vaccine-specific IgG ASCs and IgA ASCs from other sites. Whether they are homeostatic IgA ASCs specific to our microbial flora would be important to ascertain, but this will require further studies. Interestingly, pops 2, 3, and 5 had similar survival rates in our cell-free BM microniche system, implying equal survival potential upon arrival in a supportive niche in the body. Other models using in vitro differentiated ASCs had a massive attrition of ASCs in culture since they did not optimize conditions to mimic the human BM microniche that is the naturally occurring site of LLPC survival. Furthermore, they started with B cells that were differentiated to ASCs in vitro (14), compared with our studies that immediately cultured in vivo–differentiated ASCs, which is more physiologically relevant. Lastly, those models used MSC cell lines that are not likely to be as efficient as our validated human in vitro BM microniche system with primary BM MSC secretomes, exogenous cytokines, and hypoxic conditions to maintain human PCs (14, 24). Mouse models of LLPCs have been described in the BM demonstrating how homing and retention in the BM appears to be a major determinant for the persistence of human LLPCs (25). CXCR4 is important for PC migration and survival in the BM since BM stroma is rich in CXCL12 (45, 46). The CD19+ blood ASCs expressing higher CXCR4 levels may have potential for homing to supportive BM sites. At the same time, BM-resident LLPCs express very high levels of CXCR4, indicating that CXCL12 may also be involved in BM retention (1). Thus, with proper migration and retention, survival may be guaranteed given transcriptional programs intrinsic to the blood PCs. Since the BM-derived MSCs are an abundant source of CXCL12, whether CXCL12 also has a role in survival or just in retention will need further exploration. Our models could not discern a survival advantage of ASCs that may have intrinsic properties for BM homing because our system provides the same BM survival microniche equally to each sorted ASC subset (pops 2, 3, and 5). Therefore, the similar survival advantage of all 3 ASC subsets (Figure 8) may in fact reflect equal survival potential but not necessarily equal homing to or retention in the BM microniche. Recently, CD138, a heparin-sulfate glycoprotein (HSGP), has been shown to potentiate survival of ASCs (16). It was found that the ASCs lacking CD138 were more prone to apoptosis and reduced levels of IL-6 signaling. Evidence of increased ASC expression of surface HSGP is known to be important for the binding of survival factors, such as APRIL, hepatic growth factor (HGF), and epidermal growth factor (EGF), on malignant PCs (47–49); however, it is unclear if it is also important in normal LLPC development. More interestingly, IL-6 and APRIL protect ASCs from apoptosis in experiments using heparin sulfate chains to increase IL-6 and APRIL presentation on the ASC receptors (16). Although both CD138+ (pops 3 and 5) and CD138– (pop 2) ASC subsets had similar survival in our cultures, it was not clear if pop 2 also increased CD138 expression progressively within the in vitro BM microniche with higher concentrations of IL-6 and APRIL. These findings imply that the BM environment may play a role in altering the phenotype of an ASC through additional maturation. CD38+ ASC maturation appears to involve acquisition of CD138 in pop 3 (CD19+CD138+) and pop 5 (CD19–CD138+) cells, suggesting sequential maturation. B cells undergo massive proliferation and then differentiation to become ASCs (50). Our gene expression data indicated engagement of cell cycle, specifically G2M transition, genes among the various subsets, but it remains unclear whether pop 2 is the more proliferative subtype, as would be consistent with a maturation process that starts with pop 2 differentiating into pop 3. Furthermore, pops 2 and 3 showed elevated expression of caspase 3 and so are likely to undergo apoptosis, unless additional ASC maturation is orchestrated. Pop 5 ASCs are quite different from pops 2 and 3, with upregulation of hypoxia, TNF-α, and downregulation of UPR pathways. Because they have downregulated both oxidative phosphorylation and glycolysis, it will be interesting to understand the consequences for their survival, immune-related activity, and potential for ongoing maturation. Recent work by Neu et al. with single-cell transcriptomes of vaccine- versus non–vaccine-specific ASCs showed that the differences between these 2 subsets were in the glycosylation enzymes (51). These findings are interesting but address very different questions from our work. Our studies depict progression of ASC differentiation to a long-lived phenotype with the comparison of CD19+ and CD19– ASCs with upregulation of pathways such as hypoxia, TNF-α, and UPR involved in LLPC generation, whereas Neu et al. compared vaccine- versus non–vaccine-specific ASCs. Interestingly, the differences between vaccine- and non–vaccine-specific ASCs were relatively minor. One reason could be that similar transcriptomes of vaccine- versus non–vaccine-specific ASCs arise with short-lived (influenza) vaccines. Greater differences may have been observed between vaccine- and non–vaccine-specific ASCs in long-lived immunization such as tetanus. Nonetheless, additional studies are needed to further elucidate mechanisms of early ASCs to understand long-lived vaccine durability. Whether the local microenvironment is sufficient for LLPC generation is not known. In this study, we show that both CD19+ and CD19– ASCs have similar potential for longevity, suggesting that both extrinsic factors and intrinsic ASC programming may be essential. However, we also tested ASC subsets from vaccines with relatively long-lived protection such as tetanus (10 years), hepatitis A (25 years), and intermediate longevity for influenza vaccines (52, 53). We have not yet evaluated short-lived vaccines to test the imprinting models with differential strength of antigen signal, or costimulation with Tfh cells, to address this question. Hence, we show that the unique BM locale is necessary, but whether it is sufficient is still unclear. The improved survival in hypoxia within the BM microniche system was quite surprising. Clearly, the circulating ASCs in normoxic peripheral blood must adapt to hostile conditions of 2.5% oxygen. Whether these programs are intrinsic to the blood ASCs as they exit the germinal centers or whether they further differentiate to acclimatize to these microniches is not known. Moreover, mechanisms of how hypoxia provides a survival advantage will also need systematic evaluation of cultured ASCs. In conclusion, we find that significant heterogeneity of ASC subsets resides in the blood during active immune responses in healthy adults. Our results demonstrate that the timing of ASC subsets with markers of maturity (loss of CD19 and acquisition of CD138) are concurrent to CD19+ plasmablasts (CD19+CD27hiCD38hi) in the blood. Furthermore, both CD19+ and CD19– ASC subsets are newly generated, and all are participants of the new vaccine response. On aggregate, our results favor an ongoing evolution of ASCs once released into the peripheral blood and upon arrival to the BM niches. Thus, it is likely that the ASCs have intrinsic mechanisms of maturation (acquisition of CD138 and loss of B cells surface markers, such as CD19), which are further enhanced with extrinsic signals from the BM microniche such as IL-6 and APRIL. The surface surrogate markers may in fact be associated with important inflammatory mediators, such as IL-6, TNF-α, apoptotic pathways, along with metabolic pathway regulation to finally mature into LLPCs. Understanding these mechanisms will be important to study diseases of allergy, transplantation, and autoimmunity and to help develop better long-lived vaccines. Methods Subjects and study approval. Vaccinated and healthy asymptomatic adults (102 healthy adult subjects, 22 to 65 years old, mean 42 ± 11 years, 72 female, 30 male) were enrolled in this study at the University of Rochester Medical Center and Emory University during 2008–2017. Subjects received the tetanus toxoid Td or combination Tdap, influenza, or hepatits A vaccines as a part of routine medical care. PBMCs were isolated before vaccination, and on days 6–7 for all vaccination subjects. All studies were approved by the Institutional Review Boards at the University of Rochester Medical Center and at Emory University. Written informed consent from participants was obtained. BM aspirates. BM aspirates used for isolating ASC subsets were obtained from 8 healthy adults (43 to 56 years old, mean 49 ± 5 years, all female). Mononuclear cells were isolated by density gradient centrifugation. Peripheral blood was also collected from 8 subjects at the time of BM aspiration and PBMCs were isolated. Isolation and expansion of healthy BM-derived MSCs (from 2 unrelated healthy BM donors) and subsequent making of the MSC secretome were performed as previously described (24). Multicolor flow cytometry. PBMCs from peripheral blood or BM were isolated using a Ficoll density gradient and stained with the following anti-human antibody staining reagents: Ki-67–FITC (catalog, MHKI6701), CD3–PE-Cy5.5 (catalog, MHCD0318), CD14–PE-Cy5.5 (catalog, MHCD1418) (Invitrogen); CD20-Cy5 (catalog, 15-0209), CXCR4–PE-Cy5 (catalog, 15-9999), CD27–APC-eFluor 780 (catalog, 47-0279) (eBioscience); CD28-PE (BioLegend, catalog 302907); CD19–PE-Cy7 (catalog, 557835), IgD-PE (catalog, 555779), IL6R-PE (catalog, 561696), kappa- or lambda-PE (kappa, 555792; lambda, 555797), CD38–Pacific Blue (catalog, 561378), HLA-DR–Alexa Fluor 700 (catalog, 560743) (BD Pharmingen); CD138-APC (Miltenyi Biotec, catalog 130-091-250); and FCGR2B–Alexa Fluor 647 (custom conjugated by I. Sanz). The cells were analyzed on an LSRII flow cytometer (BD Biosciences). FLOCK analysis. FLOCK is a web-based program publically available for open use by the immunology research community through the Immunology Database and Analysis Portal—ImmPort (http://www.immport.org) (4). FLOCK is a novel multidimensional automated flow gating program that uses a density-based clustering approach to algorithmically identify cell populations from multiple samples in an unbiased fashion, thereby eliminating operator-dependent variability (4). FLOCK analysis was used for both total CD19+CD3–CD14– and CD19–CD3–CD14– PBMC populations from 6 blood samples to identify ASC subsets in an unsupervised fashion. These were subsequently isolated by sorting with cell-type specific antibodies. ASC subsets sorted by flow cytometry. CD3 and CD14 cells were removed by positive selection (CD3 and CD14 positive selection, Miltenyi Biotec; CD3, 130-050-101; CD14, 130-050-201) from the mononuclear cells isolated from blood or BM. CD3–CD14– cell fractions were stained with the following anti-human antibody staining reagents: IgD-PE (catalog, 555779), CD19–PE-Cy7 (catalog, 557835), CD38–Pacific Blue (catalog, 561378) (BD Pharmingen); CD3–PE-Cy5.5 (catalog MHCD0318), CD14–PE-Cy5.5 (catalog MHCD1418) (Invitrogen); CD138-APC (Miltenyi Biotec, catalog 130-091-250); and CD27–APC-eFluor 780 (eBioscience, catalog 47-0279). Naive and memory B cell fractions as well as multiple ASC subsets were collected (see Figure 1). Approximately 5,000 to 100,000 cells were collected for each population. Cytospins of sorted ASC subsets. Cytospins were performed from sorted ASCs in the blood at 1,300 rpm for 5 minutes on the Cytospin 4 (Thermo Fisher Scientific). Approximately 5,000 sorted cells per subset were dried overnight on albumin-coated slides and stained with Wright stain. Morphology was reviewed by a board certified pathologist and hematologist. In vitro culture systems for ASCs. In vitro cultures of human blood ASCs were performed as previously described (24). Briefly, ASCs were cultured in cell-free MSC secretome media in 96-well flat-bottom cell culture plates (Corning/Sigma) at 37°C in a humid, 5% CO2, 95% air (20% O2) incubator or in hypoxic culture conditions (2.5% O2) at 37°C in a modular incubator chamber (Billups-Rothenberg) that was infused with a preanalyzed gas mixture (AirGas) or in a cell culture incubator programmed for the desired O2 tension. The blood ASC survival and function were assessed by ELISpot assays, and their output values were expressed as the percentage of maximal IgG-secreting ASCs, which typically occurred on days 1–3. Total Ig and antigen-specific ELISpot assays. To assess survival and Ig secretion function of cultured ASCs, ELISpot assay was performed, as previously described (5, 6, 24, 28). Briefly, PBMCs, sorted ASCs, or B cell subsets were added to 96-well ELISpot plates coated with anti–human IgG (5 μg/ml, Jackson Immunoresearch), anti–human IgA (5 μg/ml, Jackson Immunoresearch), or tetanus toxoid (2 μg/ml, EMD Biosciences), and were incubated overnight. Wells were washed and bound antibodies were detected with alkaline phosphatase–conjugated anti–human IgG antibody (1 μg/ml, Jackson Immunoreseach), alkaline phosphatase–conjugated anti–human IgA antibody (1 μg/ml, Jackson Immunoreseach), and developed with a VECTOR Blue Alkaline Phosphatase Substrate Kit III (Vector Laboratories). Spots in each well were counted using the CTL immunospot reader (Cellular Technologies Ltd). Quantitative PCR for expression of select transcription factor genes from mRNA. Five thousand cells were sorted from each population as described above. Total cellular RNA was isolated using the RNeasy Mini Kit (Qiagen) by following the manufacturer’s protocol. Approximately 400 pg of RNA was reverse transcribed using the iScript RT Kit (Bio-Rad). Aliquots of the resulting single-stranded cDNA products were included with BLIMP-1, Pax5, or GAPDH TaqMan assays (assay IDs: Hs00153357_m1, Hs00172003_m1, Hs00231936_m1, and Hs02758991_g1; Life Technologies) using IQ Supermix (Bio-Rad) and amplified using a Bio-Rad CFX96 Real-time PCR Detection System for 50 cycles. Resulting Ct values were normalized to GAPDH levels and relative target mRNA for each population was calculated based on a standard curve created using total RNA from all populations. RNA transcriptome analysis. RNA was isolated from sorted ASC subsets from peripheral blood samples for 6 adult donors. RNA-seq was performed as recommended by the manufacturer (Illumina IIx). Briefly, first-hand cDNA was amplified using random hexamers. Following end repair, addition of adaptor ligation, agarose gel isolation of 200-bp cDNA, and PCR amplification of the 200-bp cDNA, the samples were sequenced on an Illumina HiSeq 2000. Over 25 million single-end sequences were obtained per sample, and aligned to the reference annotated human genome hg38 using STAR (54). Exon-level data for approximately 25,000 known gene sequences per sample were identified and consolidated using HTSeq (55) to yield gene-level expression values, then normalized to total counts per gene per million total aligned reads and subsequently TMM values in edgeR (56) that were converted to the log2 scale. The RNA-seq data have been deposited in the NCBI’s Gene Expression Omnibus database (GSE11697). Differential expression was assessed with the GLM ANOVA routine in JMP Genomics v8.0 (SAS Institute) after further normalization using the SNM procedure in R to remove batch effects with ASC population as the Biological variable and Batch as the adjustment variable with the Rm = True option (57). A lower threshold of 3 log2 units for inclusion was selected by plotting the coefficient of variance against average abundance. All analyses were qualitatively confirmed for the raw TMM values without SNM. Gene expression was visualized by hierarchical clustering using standardization of each gene across individuals and Ward’s method to weight the correlations in JMP Genomics. Pathway analysis. GSEA was performed using the Broad Institute’s preranked hallmark pathway gene lists (58, 59). For each of 29 significantly enriched pathways (FDR < 0.05; Kolgomorov-Smirnov nominal P < 0.05), the first principal component of the genes computed in R was used to visualize the overall regulation of the gene set. Because PC1 is somewhat arbitrarily signed, we compared these values with the direction of normalized enrichment and adjusted the sign to be concordant with an abundance of upregulation, contrasting pop 5 with pops 2 and 3. Because PC1 is dominated by strongly coregulated genes, it does not necessarily give the same results or significance values as normalized enrichment based on all of the genes in the pathway. An additional 6 pathways were excluded from further consideration because PC1 explained less than 20% of the variance, indicating little covariance; the 29 highlighted pathways all have PC1 explaining greater than 45% of the variance of the genes. Supplemental Figure 5 provides details for 12 gene sets (Allograft Rejection, Coagulation, Complement, DNA Repair, Heme Metabolism, IFNG Response, Mitotic Spindle, MTORC1 Signaling, Peroxisome, Spermatogenesis, UV Response Up, and Xenobiotic Metabolism) where there is some discordance between the two modes of analysis. Most cases are because PC1 is computed from both up- and downregulated genes that strongly differ among pops, whereas the enrichment score indicates the significance
|
|
Scooped by
Gilbert C FAURE
May 10, 2019 7:53 AM
|
Negative Co-stimulation Constrains T Cell Differentiation by Imposing Boundaries on Possible Cell States
|
|
Rescooped by
Gilbert C FAURE
from Hematology
May 10, 2019 4:24 AM
|
Megakaryocytes (MKs) are mostly recognized for their role in the generation of platelets. In this issue of Blood , [Campbell et al][1] demonstrate that MKs are also capable of preventing the spread of viral infection, suggesting that they too participate in immunity.[1][2]
![Figure][3]
MKs
|
|
Scooped by
Gilbert C FAURE
May 10, 2019 2:17 AM
|
J Leukoc Biol. 2018 Sep;104(3):535-541. doi: 10.1002/JLB.3MA0218-070R. Epub 2018 Apr 24. Research Support, N.I.H., Extramural; Review
|
|
Scooped by
Gilbert C FAURE
May 7, 2019 2:11 PM
|
In this Review, Greg Lemke explains how macrophages are able to sense and respond to dead and dying cells. The author discusses the physiological implications of such macrophage activity.
|
|
Suggested by
Société Francaise d'Immunologie
May 5, 2019 5:25 AM
|
This Review covers new insights into the immune roles of complement. The authors discuss the pathways that link complement signalling with homeostatic and pathological T cell responses and highlight how complement components act intracellularly to shape T cell responses.
|


 Scoop.it!