Your new post is loading...

|
Scooped by
Gilbert C FAURE
October 22, 4:07 AM
|
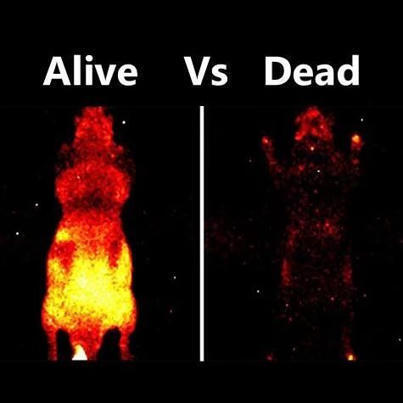
Did you know that a mouse glows slightly in total darkness?
But only if it is alive. Here’s the science behind it:
Every living mouse emits biophotons - in fact, it seems every living organism does.
You can’t see them with a naked eye, but only through ultra sensitive cameras.
Where do they come from?
This emission is a result of metabolic reactions happening inside the cells, especially mitochondria. Reactive oxygen species (ROS) are produced as a result of aerobic metabolism. These interact with cell components like DNA, lipids and proteins, causing them to enter an ‘excited’ state. When these biomolecules decay back to their ground state, they release that surplus energy as photons.
For decades, many biologists brushed this phenomenon off as useless metabolic noise. But new research shows it might tell us something.
It is possible that organelles like mitochondria are using these light pulses to coordinate cellular activities.
Scientists are also seeing this as a new way of real-time health monitoring. Damaged and stressed cells show distinct emission patterns compared to healthy ones.
It turns out light isn't just a metaphor for life. It might be part of the fundamental processes that keep it running.
Keep shining!
#STEM #PhDLife #Fascinating #BiologicalProcessesExplained | 29 comments on LinkedIn
|
|
Scooped by
Gilbert C FAURE
July 21, 4:10 AM
|
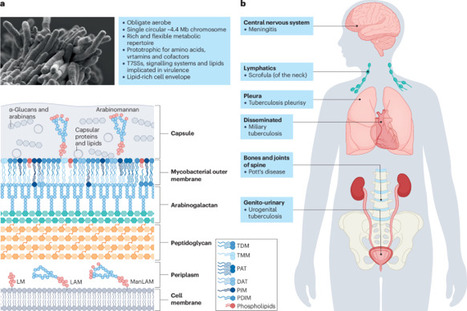
Since the release of the first Mycobacterium tuberculosis genome in 1998, major advances have been made in understanding the biology of this pathogen, the leading infectious cause of death in modern human history. In this Review, we outline the physiological and metabolic features thought to underpin the survival, evasion and subversion strategies employed by M. tuberculosis as it drives a cycle of transmission, infection and disease in its obligate human host. We also consider adaptations to key host innate immune effectors, including the roles of granulocytes, phagosomal damage and repair, autophagy and cell death in determining host–mycobacterium outcomes. Given the increasing awareness of the importance of asymptomatic M. tuberculosis infection and transmission, we advocate for the need to ensure greater intersection between laboratory and clinical research, taking into account the environmental context in which natural infection and disease occur. We identify knowledge gaps in the field and reflect on the opportunities and challenges for integrating host, bacterium and environment into future investigations to inform intervention strategies to control tuberculosis disease. In this Review, Warner, Barczak, Gutierrez and Mizrahi explore essential aspects of Mycobacterium tuberculosis physiology and biology, present recent advances related to its pathogenesis, metabolism and immune evasion mechanisms, and propose future directions for research.
|
|
Scooped by
Gilbert C FAURE
April 22, 8:36 AM
|
B cells have a surprising role in exercise endurance
Study in mice suggests that B cells help to regulate muscle performance.
- B cells are an essential component of humoral immunity, and B cell depletion therapies have clinically succeeded in eliminating cancerous B cells and treating autoimmune diseases.
- Using mouse models, the authors report an immune-independent function of B cells that drives exercise capacity.
- B-cell-deficient mice performed worse on strength and endurance tests than did mice with healthy B-cell counts.
- During exercise, B cell deficiency reduces transforming growth factor (TGF)-β1 production, which alters hepatic glutamate metabolism and decreases blood and muscle glutamate.
- Mechanistically, B cell-derived TGF-β1 transcriptionally upregulates hepatic glutaminase 2 (GLS2) and solute carrier family 7 member 5 (SLC7A5) expression, increasing glutamine catabolism and thus glutamate production in the liver.
- The resulting increase in glutamate fosters skeletal muscle calcium oscillations, calmodulin-dependent protein kinase (CaMK) kinase activity, and mitochondrial biogenesis, thereby improving exercise performance.
- These findings reveal an immune-independent function of B cells in controlling physical performance and unveil the phenomenon of “immunoexercise,” whereby exercise is modulated by immune cells or immunity.
- Main limitation of this study: there is currently no direct human data on B cells’ maintenance of hepatic Glu metabolism and its exercise improvement; future clinical studies are needed to validate this data in a human setting.
https://lnkd.in/dQ3tS8th
https://lnkd.in/dSN9GGHw
#immunology #Bcells #exercise #science #metabolism
|
|
Scooped by
Gilbert C FAURE
October 15, 2025 4:43 AM
|
Immunometabolism, the intersection of cellular metabolism and immune function, has revolutionized our understanding of T cell biology. Changes in cellular metabolism help guide the development of thymocytes and the transition of T cells from naive to effector, memory and tissue-resident states. Innate-like T cells are a unique group of T cells with special characteristics. They respond rapidly, reside mainly in tissues and express T cell receptors with limited diversity that recognize non-peptide antigens. This group includes invariant natural killer T (iNKT) cells, mucosal-associated invariant T (MAIT) cells and some populations of γδ T cells. Different subsets of innate-like T cells rely on specific metabolic pathways that influence their differentiation and function and distinguish them from conventional CD4+ and CD8+ T cells. Although there are differences between innate-like T cell types, they share metabolic and functional features. In this Review, we highlight recent research in this emerging field. Understanding how metabolic programmes differ between innate-like T cells and other T cells may open opportunities for tailoring innate-like T cell responses and adoptive T cell therapies for use in cancer, metabolic and autoimmune diseases. Functional and metabolic properties of innate-like T cells — namely, iNKT cells, MAIT cells and some γδ T cells — differ from those of conventional T cells. This Review describes how metabolic pathways support innate-like T cell properties such as acquisition of effector capability in the thymus, rapid responsiveness, tissue persistence, antigen adaptation and functional flexibility.
|
|
Scooped by
Gilbert C FAURE
December 30, 2023 7:45 AM
|
Lymph nodes are secondary lymphoid organs in which immune responses of the adaptive immune system are initiated and regulated. Distributed throughout the body and embedded in the lymphatic system, local lymph nodes are continuously informed about the state of the organs owing to a constant drainage of lymph. The tissue-derived lymph carries products of cell metabolism, proteins, carbohydrates, lipids, pathogens and circulating immune cells. Notably, there is a growing body of evidence that individual lymph nodes differ from each other in their capacity to generate immune responses. Here, we review the structure and function of the lymphatic system and then focus on the factors that lead to functional heterogeneity among different lymph nodes. We will discuss how lymph node heterogeneity impacts on cellular and humoral immune responses and the implications for vaccination, tumour development and tumour control by immunotherapy. This Review from Wolfgang Kastenmüller and colleagues highlights the heterogeneity that exists among lymph nodes at different anatomical locations. The authors consider the factors that contribute to lymph node heterogeneity and explain the relevance of this for the immune response, particularly in the contexts of vaccination and cancer.
|
|
Scooped by
Gilbert C FAURE
August 21, 2022 5:39 AM
|
SignificanceNF-κB is central to immune and inflammatory responses but a long-standing
question is if and how NF-κB integrates host responses against injury and microbial
pathogens by reprogramming cell metabolism. A recent flurry of studies has now partially
resolved this conundrum, underscoring how the NF-κB transcriptional machinery is inherently
hardwired to the metabolic programs that govern immune regulation, energy homeostasis,
and oncogenesis.
|
|
Scooped by
Gilbert C FAURE
August 4, 2021 4:56 AM
|
CD147, a member of the immunoglobulin (Ig) superfamily, is widely expressed in several cell types. CD147 molecules have multiple cellular functions, such as migration, adhesion, invasion, energy metabolism and T cell activation. In particular, recent studies have demonstrated the potential application of CD147 as an effective therapeutic target for cancer, as well as autoimmune and inflammatory diseases. In this study, we elucidated the functional epitopes on CD147 extracellular domains in T cell regulation using specific monoclonal antibodies (mAbs). Upon T cell activation, the anti-CD147 domain 1 mAbs M6-1E9 and M6-1D4 and the anti-CD147 domain 2 mAb MEM-M6/6 significantly reduced surface expression of CD69 and CD25 and T cell proliferation. To investigate whether functional epitopes of CD147 are differentially expressed on distinct leukocyte subsets, PBMCs, monocyte-depleted PBMCs and purified T cells were activated in the presence of anti-CD147 mAbs. The mAb M6-1E9 inhibited T cell functions via activation of CD147 on monocytes with obligatory cell-cell contact. Engagement of the CD147 epitope by the M6-1E9 mAb downregulated CD80 and CD86 expression on monocytes and IL-2, TNF-α, IFN-γ and IL-17 production in T cells. In contrast, the mAb M6-1D4 inhibited T cell function via activation of CD147 on T cells by downregulating IL-2, TNF-α and IFN-γ. Herein, we demonstrated that certain epitopes of CD147, expressed on both monocytes and T cells, are involved in th
|
|
Scooped by
Gilbert C FAURE
April 25, 2021 3:38 AM
|
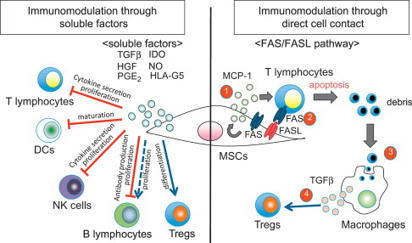
T Cell Proliferation T cell proliferation leads to formation of millions of T cells expressing specific cell membrane TCRs, capable of binding the most diverse antigens, including self-antigens. From: Epigenetic Principles of Evolution (Second Edition), 2019 Related terms: View all Topics Stem Cell-Based Approach to Immunomodulation Kathryn J. Wood, ... Ou Li, in Regenerative Medicine Applications in Organ Transplantation, 2014 61.3.4 Modulation of T-Cell Responses in Rejection by MSCs T-cell proliferation and activation are prerequisites for allograft rejection [2,85]. A large body of data demonstrate that MSCs can modulate T-cell proliferation, activation, and function both in vitro and in vivo[28,44,86–89]. Moreover, the capacity for MSCs to inhibit Th17 cell differentiation [90,91] or to shift the T-helper cell balance in favor of a more anti-inflammatory phenotype has been demonstrated in vitro [92–96]. The mechanisms utilized by MSCs in mediating these effects vary between in vitro and in vivo models. However, the secretion of soluble factors by MSCs is a common feature (English, 2012). IDO and PGE-2 have been implicated in MSC inhibition of Th17 differentiation [90,91]. In the case of PGE-2, the steps involved in the process require contact-dependent COX-2 induction of PGE-2 and direct inhibition through EP4 [90]. MSCs can also mediate this effect through suppressing the Th17 transcription factor RORγt and upregulating Foxp3 to induce a Treg phenotype producing IL-10 [96]. MSC-derived TGF-β has been shown to play a partial role in shifting the balance of Th1/Th2/Th17 and Treg in an autoimmune disease model [31]. A role for matrix metalloproteinase (MMP)2 and MMP9 secreted by MSCs facilitating cleavage of CD25 expressed on CD4+ T cells thereby inhibiting alloantigen driven proliferation and so preventing islet allograft rejection has also been described [44]. Other evidence suggests that MSC-derived MMPs also cleave CCL2 which subsequently inhibits Th17 activation via a STAT3-dependent pathway [97]. MSCs also have the capacity to expand or induce Treg in the setting of an alloimmune response [43,45,98,99] and in some cases can generate a state of Treg-dependent tolerance [30,45]. Both of these studies elegantly demonstrate the importance of Treg in MSC-induced tolerance using Treg depletion strategies with IDO potentially playing a significant role [30]. In vitro, MSC induction of Treg is thought to involve cell contact, PGE-2, and TGF-β [94]. In vivo, MSC-derived TGF-β was required for the generation of antigen-specific Treg and overall, TGF-β seems to be the major soluble factor involved in MSC promotion of Treg in vivo [29,31,100,101]. T-Cell Activation and Tolerance Erik J. Peterson, Jonathan S. Maltzman, in Clinical Immunology (Fifth Edition), 2019 Coreceptors Transduce Signals That Are Integrated With TCR Signals T-cell proliferation and the initiation of effector function require that the T cell must receive signals in addition to the TCR via other cell surface receptors.18 This requirement for multiple signals allows the T cell to be extremely sensitive to TCR binding while protecting against the inappropriate activation of potentially dangerous effector cells. Because T cells respond to antigens presented on APCs, stimulation under physiological conditions involves the potential engagement of multiple coreceptors on the T cell by cognate ligands on the APCs. Some coreceptors may function to increase the avidity of T cells for interacting APCs. However, many coreceptors exhibit intrinsic signal-transducing capacity. Some signal independently of the TCR; others intersect with TCR-driven signaling machinery. Additionally, coreceptors may function as recruiters of cytoplasmic signaling molecules, including adaptor proteins, as described above. The most intensively studied coreceptors are CD4 and CD8 (Chapter 4). CD4 or CD8 expression on peripheral T cells define subsets that respond to MHC class II- or class I-bound peptide antigens, respectively (Chapter 6). Either CD4 or CD8 can contribute to enhanced TCR signal strength because they each associate with LCK.19 This constitutive interaction, which occurs via specific residues within the CD4 and CD8 cytoplasmic domains, localizes a key effector enzyme to the TCR complex. Cytokines in Hematopoietic Stem Cell Transplantation Kate A. Markey, Geoffrey R. Hill, in Cytokine Effector Functions in Tissues, 2017 IL-6 IL-6 promotes T cell proliferation, the differentiation of cytotoxic T lymphocyte populations, and, when present in combination with TGF-β, promotes Th-17 development.65,66 Preclinical studies of IL-6 in GVHD and GVL confirm its key role as a pathogenic cytokine in GVHD. The absence of IL-6 in the donor T cell pool (using IL-6 deficient donor mice) or systemic blockade of IL-6 with an anti-IL-6R antibody results in decreased aGVHD with no loss of GVL effects in the models used.9,67 Recent data demonstrate that IL-6 is the major cytokine detectable in patient plasma early after BMT and that it appears to play a dominant role in conditioning-related pathology.68 Blockade of IL-6 with tocilizumab (soluble IL-6R) has now progressed through a successful phase I/II clinical trial with low levels of acute GVHD in comparison to historical controls.68 This represents a promising new strategy for GVHD prevention. Macrophages Galen B. Toews, in Asthma and COPD (Second Edition), 2009 Macrophages and Initiation of Antigen-specific T2 Immune Responses in Asthma Resident pulmonary AMs actively suppress T-cell proliferation induced by antigen or polyclonal stimuli [73]. Changes occur within the local inductive milieu of the lung in patients with asthma. AM suppression is reduced after exposure to allergens [106–108]. The tissue microenvironment is a crucial regulator of specific immune response generation (Fig. 11.1). The presence of IgE on APCs likely promotes the uptake and the processing of allergens and their eventual presentation to naïve T-cells. DCs express both FcεR I and FcεR II. These two receptors could function to capture allergen bound to allergen-specific IgE and thus focus the immune response through facilitated antigen presentation [109]. Antigens also deliver signals via quantitative variation in ligand density on APC. Peptide/MHC class II complexes that interact strongly with the TCR favor T1 responses, whereas weak interactions result in the priming of T2 responses. The overall binding affinity can be varied by modifying the peptide, which results in different signals. The mechanisms by which signals delivered via the TCR control differentiation is uncertain; differential TCR aggregation may result in differential intracellular signals that favor distinct cytokine gene expression or certain MHC–TCR interactions may favor differential co-receptor expression [110]. As noted above, co-stimulatory molecules may direct the polarization of T-cells into T1 or T2 cells; B7.2 provides only a moderate signal for T2 cell differentiation; and co-stimulatory signals may be delivered either by the APC that presents the antigen or by the bystander APC. Thus, macrophages may serve as bystander APC and influence DC-induced T-cell proliferation [111]. Soluble cytokines produced by cells of the innate immune response are likely the major regulators of T-cell differentiation (see “Innate Control of Adaptive Immune Responses” section). Immunotherapy in Transplantation Kentaro Akiyama, ... Takuo Kuboki, in Stem Cell Biology and Tissue Engineering in Dental Sciences, 2015 61.2.1.1 Interaction with T-Lymphocytes MSCs are known to inhibit T-cell proliferation by arresting the cell cycle in the G1/G0 phase and down-regulating cyclin D2 expression [6]. As part of the mechanisms involved in this process, MSCs produce a large number of soluble factors that work as anti-inflammatory agents. Di Nicola M et al. reported that human bone marrow MSCs inhibit both CD4+ and CD8+ T-lymphocyte proliferation by secreting transforming growth factor beta 1 (TGFβ1), hepatocyte growth factor (HGF), and prostaglandin E2 (PGE2) in vitro [7]. Another study showed that MSCs inhibit stimulated lymphocyte proliferation and mitogenic response independently of the major histocompatibility complex (MHC) [8]. MSCs also produce indoleamine 2,3-dioxygenase (IDO), which accelerates tryptophan degradation and kynureine synthesis resulting in inhibition of T-lymphocyte proliferation [9]. Nitric oxide (NO) is another immune regulation factor secreted by MSCs [10,11]. NO inhibits proliferation of T-lymphocytes by suppressing phosphorylation of transcription factor, signal transducer, and activator transcription-5 (STAT-5) [12]. Human leucocyte antigen-G5 (HLA-G5) from MSCs is a trigger for inhibition of T-lymphocyte function, followed by up-regulation of T-helper type 2 (Th2) and regulatory T-cell (Tregs) [13,14]. On the other hand, MSCs are able to inhibit T-lymphocyte proliferation by direct cell-to-cell contact [15–17]. Krampera et al. reported that MSCs physically hinder T-lymphocytes from contacting antigen presenting cells in a non-cognate fashion [18]. T-lymphocytes have several subsets. CD8+CTL plays an important role in MHC-dependent allogenic or virus- infected cell depletion. MSCs showed reducing CTL cytotoxicity by inhibiting CTL formation [19]. It has been indicated that the relationship between gamma-delta T-lymphocytes (γδT) and acute graft-vs-host disease (GvHD). MSCs suppress γδT-lymphocyte proliferation without any functional inhibition in vitro (Figure 61.1) [20]. Furthermore, some reports indicated that immunomodulation of MSCs are not only through inhibition of T-lymphocyte proliferation, but also by induction of T-lymphocyte apoptosis. A previous study demonstrated that MSCs secrete IDO, induce 3-Hydroxyanthranilic acid (HAA) synthesis during tryptophan metabolism, and induce cell apoptosis by inhibiting the NFκB pathway in T-lymphocytes [21]. Augello et al. reported that MSCs induce apoptosis of T-lymphocytes by activation of the programmed death 1 pathway [22]. More recently, MSCs have been demonstrated to induce T-lymphocyte apoptosis through the FAS/FAS ligand (FASL) pathway, and consequently lead to immunotolerance (Figure 61.1) [23]. Neuropeptides for Mucosal Immunity David W. Pascual, Kenneth L. Bost, in Mucosal Immunology (Third Edition), 2005 Tachykinins and VIP as costimulation factors for T lymphocytes Early studies showed that SP supports T-cell proliferation (Payan et al., 1983; Stanisz et al., 1986), suggesting that T lymphocytes can express NK1-R. In support of this possibility, recent investigations by several laboratories have demonstrated in vitro and in vivo expression of NK1-R by T lymphocytes. NK1-R mRNA expression by cultured murine (McCormack et al., 1996) and human T cells (Li et al., 2000) or T-cell lines has been reported. In addition, the functionality of NK1-R expression by T lymphocytes has been demonstrated in co-cultures with SP-producing dendritic cells (Lambrecht et al., 1999). It is interesting that NK1-R mRNA expression was observed in intraepithelial and lamina propria T lymphocytes but not in splenic T cells (Qian et al., 2001a). During the host response against respiratory syncytial virus, NK1-R expression was markedly increased in CD4+ T lymphocytes (Tripp et al., 2002). However, the most compelling evidence to date for the importance of NK1-R expression on T lymphocytes comes from studies by Weinstock and colleagues, using a murine model of schistosomiasis. Using NK1-R−/– mice, they observed significant reductions in the size of schistosome-induced granulomas in comparison with disease in wild-type mice (Blum et al., 1999). The limited IFN-γ production by infected NK1-R−/– mice suggested that T cells may be an important target for SP during schistosomiasis. Additional studies clearly demonstrated that the presence of NK1-R on T lymphocytes was largely responsible for schistosome antigen–induced IFN-γ production (Blum et al., 2003). Mechanistic studies demonstrated that schistosome antigen, as well as IL-12, could induce expression of NK1-R during murine schistosomiasis (Blum et al., 2001). Collectively, these studies clearly demonstrate the importance of NK1-R expression and activity during the host response to a parasitic infection. To further address the role of SP contribution to S-IgA responses, NK1-R−/– mice were orally immunized with an attenuated Salmonella construct expressing colonization factor antigen I (CFA/I). This vaccine construct has been shown to elicit a biphasic Th cell response (Pascual et al., 1999) supported by early robust IL-4- and IL-5-producing CD4+ T cells. When such a construct was used to orally immunize NK1-R−/– mice, a significant increase in antigen-specific S-IgA antibody titers was obtained (Trunkle et al., 2003). Surprisingly, no significant differences in IFN-γ production were observed between NK1-R/+/+ and NK1-R−/– mice, but increased production to IL-6 was obtained. This evidence suggests, minimally, that some intracellular infections are resolvable in the absence of NK1-R function, perhaps via increases in S-IgA antibody responses. VIP-containing nerve fibers also extend into the T-cell regions of the Peyer's patches (Ottaway et al., 1987) to affect the CD4+ T cells, whereby stimulation of CD4+ T cells by SP or VIP can affect Ig synthesis. While SP has been shown to exert stimulatory effects upon T cells, VIP has the opposite effect and will inhibit mitogen-induced T-cell proliferation (Stanisz et al., 1986; Ottaway and Greenberg, 1984). This effect apparently occurs through a reduction of IL-2 synthesis (Ottaway, 1987; Metawali et al., 1993) and an inhibition of IL-4 in anti-CD3-stimulated T cells incubated with VIP (Wang et al., 1996). These early studies suggested that VIP exhibited anti-inflammatory properties, but this was not confirmed until recently. As stated earlier, VPAC1 is constitutively expressed, whereas VPAC2 is inducible when T cells are stimulated with anti-CD3 antibody (Delgado et al., 1996). Upon stimulation, VPAC1 levels decrease, while VPAC2 levels are induced. This evidence suggests that VIP action on CD4+ T cells is via the effect of VPAC2 acting specifically upon Th2 cells. To begin to address the regulation of VPAC1 and VPAC2, a mouse deficient in VPAC2 was derived and exhibited enhanced delayed-type hypersensitivity (DTH) responses supported by increased IFN-γ production (Goetzl et al., 2001). To exacerbate Th2 cell function, a transgenic mouse was derived in which CD4+ T cells express the human VPAC2 (Voice et al., 2001). These mice showed increased serum IgE and IgG1 but not IgA antibodies. This Th2 cell bias was evidenced as enhanced susceptibility to TNP-induced cutaneous anaphylaxis and depressed DTH responses. Studies have yet to determine whether VPAC1 and VPAC2 are regulated in a similar fashion by Peyer's patch Th cells, in a manner analogous to that seen with splenic Th cells. Bone Marrow DANIEL A. ARBER, in Modern Surgical Pathology (Second Edition), 2009 T-CELL PROLYMPHOCYTIC LEUKEMIA T-PLL is a clonal T-cell proliferation that occurs most commonly in elderly patients and has a slight male predominance.328,372,373 The disease also occurs frequently in younger patients with ataxia telangiectasia.374 Patients have a markedly elevated white blood cell count as well as organomegaly and lymphadenopathy. Nodular or maculopapular skin lesions are also common. The peripheral blood white blood cell count is usually greater than 100 × 109/L with a predominance of medium-sized cells with abundant basophilic cytoplasm and a single prominent nucleolus (Fig. 43-27). These cells are similar to B-cell prolymphocytes but may have a more convoluted nucleus than in B-PLL. Normocytic anemia and thrombocytopenia are common. The bone marrow may not be involved to the degree that would be expected by the marked elevation in peripheral blood prolymphocytes. The pattern of involvement may be interstitial, diffuse, or mixed and reticulin fibrosis is frequently present (Fig. 43-28).353 In general, T-PLL is an aggressive disease with short survival. However, a subpopulation of patients with T-PLL, including many with ataxia telangiectasia, have an initial, indolent disease course that eventually transforms to the more typical aggressive disease.375 Immunophenotyping is necessary to distinguish T-PLL from B-PLL and is often helpful in excluding acute leukemia. T cell-associated antigens CD2, CD3, CD5, and CD7 are expressed by T-PLL and surface CD3 is present. Most cases are CD4+, but a subset of cases expresses CD8 or both CD4 and CD8. The absence of both CD20 and immunoglobulin light-chain expression excludes B-PLL. The lack of TdT and CD1a expression and the presence of surface CD3 exclude most cases of T-cell ALL. T-cell receptor gene rearrangements are uniformly detectable in T-PLL. Cytogenetic abnormalities in T-PLL include inv(14)(q11q32) and t(14;14)(q11;q32), involving the TCL1 gene in the region of the T-cell receptor α/β locus, iso(8q), trisomy 8, 12p13 deletions, and t(X;14)(q28;q11).375,376 Abnormalities of chromosome region 11q22-23, involving the ATM tumor suppressor gene that is consistently mutated in ataxia telangiectasia are present in some patients with T-PLL even in the absence of ataxia telangiectasia.377 Some T-cell chronic lymphoproliferative disorders have cells with morphologic features similar to those of B-CLL without the prominent nucleolus typical of usual-type PLL.378,379 Cases of this type are considered small cell variants of T-PLL, and the term T-cell CLL should no longer be used. Although the median age and white blood cell count are lower in these patients than in usual-type T-PLL, these cases have immunophenotypic and cytogenetic features similar to those of T-PLL and a similarly aggressive clinical course. Development of T Cell Immunity Jeong M. Kim, in Progress in Molecular Biology and Translational Science, 2010 E Granzyme Dependent Cytotoxicity Treg cell mediated inhibition of in vitro effector T cell proliferation was demonstrated to require cell-to-cell contact. Although the molecular basis for contact-mediated suppression is largely unknown, recent reports have revealed that Tregs also require cellular contact for target cell killing via the granule exocytosis pathway.150,151 Granule-mediated cytoxicity is dependent on granzymes, granule resident proteases, which initiate a cascade of apoptosis-promoting cleavage events. As in effector T cells, granzyme expression is induced in Tregs in response to T cell receptor signaling. While granzyme A is primarily expressed by activated human Tregs,151 granzyme B is the predominant granzyme induced in murine Tregs.150 Granzyme A and B differ in substrate specificity and the kinetics of cell death induction, but activated murine and human Tregs comparably induce effector T cell death at 1:1 ratio of regulatory to effector T cells. In vitro cytotoxicity was dependent on granzyme function, as suppression of effector T cell proliferation was severely compromised in cultures containing granzyme B deficient Tregs.150 Cytolytic granules also contain perforin, which is essential for target cell lysis in CD8+ CTLs and NK cells. The deposited perforin polymerizes on the target cell plasma membrane in a calcium dependent manner and generates holes that were hypothesized to serve as granzyme conduits into the target cell. However, accurate measurements of pores formed by perforin suggest that the diameter of polyperforin channels do not accommodate granzyme passage.152 Although the exact function of perforin remains unknown, phenotypic similarities in mice deficient in either perforin or granzyme B provide evidence that perforin plays a nonredundant role in targeted cytolysis by lymphocytes. In support of this idea, inhibiting perforin by either EDTA or concanamycin A treatment abrogates target cell killing by human Tregs. In contrast to these findings, perforin deficient murine Tregs were equally suppressive as its wild-type counterparts in vitro, suggesting that perforin is not essential for granzyme B dependent target cell lysis in murine Treg cells. These discrepant results may reflect the usage of different granzymes for target cell killing in mouse versus human Tregs. In this regard, granzyme A may be more dependent on perforin for killing that granzyme B. Alternatively, calicium chelators or concanamycin A may not be specific for perforin inhibition, affecting target cell cytolysis independent of perforin function. Human Tregs, additionally, have been demonstrated to kill monocytes, DCs, and activated CD8+ T cells151 (Fig. 3B). Murine Tregs are also capable of killing B cells in vitro.114 Assay for Antigen-Specific T-Cell Proliferation in Mice Şefik Ş. Alkan, in Immunological Methods, 1979 Publisher Summary This chapter discusses the assay for antigen-specific T-cell proliferation in mice. While lymphocyte proliferative responses to allogeneic cells or to mitogens in the mouse can be readily measured, the reliable assay of antigen-induced T-lymphocyte proliferation in culture has proved to be substantially more difficult to establish. The uncontrolled nature of proliferation and the contribution of B-cell responses have made these methods of questionable value as a T-cell assay. The novel features of the method are the use of only draining lymph node cells of primed mice instead of spleen cells and the use of horse serum in the culture medium instead of fetal calf serum. Only draining lymph node cells rich for antigen-reactive cells are used. Animals are sensitized by injecting antigen into the tail or footpads, the draining lymph nodes are removed, the cells are cultured in microculture plates in the presence or absence of antigens (and/or mitogens), and proliferation is measured by [3H] thymidine uptake. This technique can be used for several antigens, such as monovalent antigens and protein antigens. The Digestive Involvement in Systemic Autoimmune Diseases A.J. Czaja, in Handbook of Systemic Autoimmune Diseases, 2017 4.4 Regulatory T Cells Regulatory CD4+CD25+ T cells modulate CD8 T cell proliferation by exerting a direct suppressive effect on the production of IFN-γ while increasing secretion of IL-4, IL-10, and TGF-β [143–146]. They can also induce the apoptosis of inflammatory and immune cells [147], inhibit hepatic stellate cells [148], impair the secretion of IL-17 [149], and limit the proliferation of Th17 lymphocytes [149]. These cells have been decreased in number and function in the peripheral blood of patients with autoimmune hepatitis [144,150,151], and they have been less evident in the portal tracts of liver specimens (Table 2.3) [151]. A signaling defect that influences the function of the regulatory T cells may also contribute to regulatory failure [5]. Galectin 9 is a beta galactosidase–binding protein expressed on regulatory T cells, and its ligation with the mucin domain-3 receptor (TIM-3) on Th1 cells and dendritic cells induces the apoptosis of Th1 lymphocytes and dendritic cells [152,153]. In autoimmune hepatitis, the expression of galectin 9 on regulatory T cells and TIM-3 on Th1 cells is reduced, and these deficiencies may limit the ability of the regulatory T cells to restore immune tolerance [153]. Deficiencies in the function of regulatory T cells have also been described in the siblings and children of patients with PBC, and the suppressor activity of this subset may be modulated by genetic factors [146]. Regulatory T cells can be defined more rigidly by the phenotype CD4+CD25+CD127+(low)Foxp3+, and cells with this phenotype have had normal function in patients with autoimmune hepatitis. Furthermore, increased numbers of these cells have been described in the peripheral circulation and liver tissue of patients with autoimmune hepatitis [154]. These findings have challenged the hypothesis that perturbations in the regulatory T cell population are critical for the development of autoimmune hepatitis. The discrepant findings between studies may relate to differences in the phenotypic definition of the regulatory T cells, methods for the detection and evaluation of these cells, and the severity and treatment of the liver disease in the study population [155]. The abnormalities associated with regulatory T cells may be transient and improved by medications (corticosteroids, mycophenolate mofetil, or rapamycin) and the resolution of inflammatory activity [5,144]. Relative imbalances between the number and functions of the regulatory T cells and effectors cells may be the critical factor affecting the autoreactive response rather than the absolute number and function of an individual cell population.
|
|
Scooped by
Gilbert C FAURE
November 10, 2020 2:48 AM
|
Glucocorticoids (GCs) are small lipid hormones produced by the adrenals that maintain organismal homeostasis. Circadian and stress-induced changes in systemic GC levels regulate metabolism, cardiovascular and neural function, reproduction and immune activity. Our understanding of GC effects on immunity comes largely from administration of exogenous GCs to treat immune or inflammatory disorders. However, it is increasingly clear that endogenous GCs both promote and suppress T cell immunity. Examples include selecting an appropriate repertoire of T cell receptor (TCR) self-affinities in the thymus, regulating T cell trafficking between anatomical compartments, suppressing type 1 T helper (TH1) cell responses while permitting TH2 cell and, especially, IL-17-producing T helper cell responses, and promoting memory T cell differentiation and maintenance. Furthermore, in addition to functioning at a distance, extra-adrenal (local) production allows GCs to act as paracrine signals, specifically targeting activated T cells in various contexts in the thymus, mucosa and tumours. These pleiotropic effects on different T cell populations during development and immune responses provide a nuanced understanding of how GCs shape immunity. Glucocorticoid treatment is used to suppress the immune system in various disease settings. However, endogenous glucocorticoids are able to promote as well as inhibit different aspects of T cell immunity. Here, the authors discuss the many ways in which T cell responses are shaped by glucocorticoids.
Targeting Tumor and T-Cell Together The newly diversified experimental strategies to treat cancer include those that involve tweaks to host immunity. A recently described strategy, conducted in mou...
Via Krishan Maggon
|
|
Scooped by
Gilbert C FAURE
November 18, 2019 6:40 AM
|
Mycobacterium tuberculosis, the leading cause of death due to infection, has a dynamic and immunomodulatory cell envelope. The cell envelope structurally and functionally varies across the length of the cell and during the infection process. This variability allows the bacterium to manipulate the human immune system, tolerate antibiotic treatment and adapt to the variable host environment. Much of what we know about the mycobacterial cell envelope has been gleaned from model actinobacterial species, or model conditions such as growth in vitro, in macrophages and in the mouse. In this Review, we combine data from different experimental systems to build a model of the dynamics of the mycobacterial cell envelope across space and time. We describe the regulatory pathways that control metabolism of the cell wall and surface lipids in M. tuberculosis during growth and stasis, and speculate about how this regulation might affect antibiotic susceptibility and interactions with the immune system. Mycobacterium tuberculosis has a distinctive cell envelope that contributes to its resistance against the human immune system and antibiotic therapy. In this Review, Dulberger, Rubin and Boutte discuss mycobacterial cell envelope dynamics and their relevance for infection and drug treatment.
|
|
Scooped by
Gilbert C FAURE
September 27, 2019 6:32 AM
|
Dendritic cells (DCs) control innate and adaptive immunity by patrolling tissues to gather antigens and danger signals derived from microbes and tissue. Subsequently, DCs integrate those environmental cues, orchestrate immunity or tolerance, and regulate tissue homeostasis. Recent advances in the field of immunometabolism highlight the notion that immune cells markedly alter cellular metabolic pathways during differentiation or upon activation, which has important implications on their functionality. Previous studies showed that active oxidative phosphorylation in mitochondria is associated with immature or tolerogenic DCs, while increased glycolysis upon pathogen sensing can promote immunogenic DC functions. However, new results in the last years suggest that regulation of DC metabolism in steady state, after immunogenic activation and during tolerance in different pathophysiological settings, may be more complex. Moreover, ontogenically distinct DC subsets show different functional specializations to control T cell responses. It is, thus, relevant how metabolism influences DC differentiation and plasticity, and what potential metabolic differences exist among DC subsets. Better understanding of the emerging connection between metabolic adaptions and functional DC specification will likely allow the development of therapeutic strategies to manipulate immune responses.
|
|
Scooped by
Gilbert C FAURE
June 20, 2019 3:16 PM
|
Genetic, pharmacological and metabolomics experiments reveal that the malate–aspartate shuttle and mitochondrial citrate export support the differentiation of mouse T helper 1 cells, whereas succinate dehydrogenase enforces their terminal effector function.
|
|
|
Scooped by
Gilbert C FAURE
August 25, 8:37 AM
|
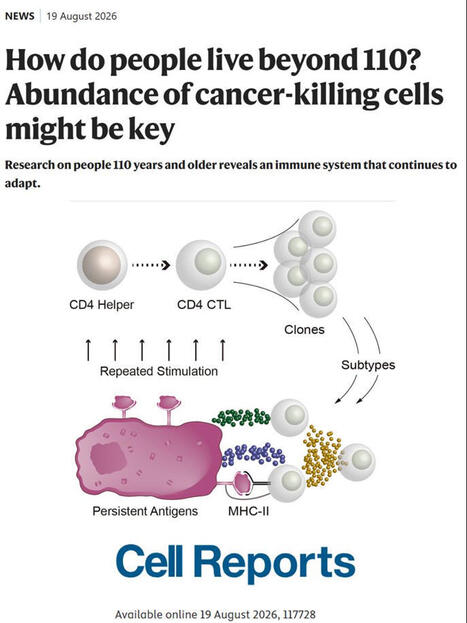
CD4 CTLs in supercentenarians: Signs of adaptive expansion in healthy aging
Research on supercentenarians—people aged 110 and older—reveals that their exceptional longevity and resistance to age-related diseases like cancer may be linked to a specialized population of immune cells known as CD4 cytotoxic T lymphocytes (CD4 CTLs). While these killer cells typically make up less than 5% of T cells in younger individuals, their numbers increase dramatically around age 100, accounting for roughly 10% of T cells in centenarians and 18% in supercentenarians. Genetic profiling shows that these cells undergo significant clonal expansion—cloning themselves into large populations of identical cells—in response to persistent antigen triggers, with receptor sequences matching those found in cancer patients, particularly those with lung cancer. Although these findings suggest that CD4 CTLs adaptively expand to suppress tumor growth or clear senescent cells, experts caution that direct tumor-killing activity in these individuals remains to be proven, as the precise targets and tissue destinations of these expanded immune cells are still under investigation. The original article was published in Cell Rep https://lnkd.in/d65eeX4n and a commentary in Nature https://lnkd.in/d3ysVud8
#genetics #genomics #epigenetics #epigenomics #precisionmedicine #genomicmedicine #dna #rna #brain #neurology #neuroscience #neurodegeneration #neuroinflammation #inflammation #immunity #aging #longevity #cognition #alzheimer #parkinson #movementdisorders #raredisease #dementia #autism #geroscience #ai #bioinformatics #lysosomalstoragedisease #psychiatry #neurodevelopment #neurogenesis #metabolism #lysosome #mitochondria #autophagy #omics #lipids #lipidomics #cellbiology #microbiome #metagenome #regenerativemedicine #environment #pollution #publichealth #physiology #biobank #health #drugs #drugrepurposing #drugdiscovery #drugdevelopment #biomarkers #therapeutics #biotechnology #innovation #research #science #sciencecommunication Instituto de Ciencias e Innovación en Medicina (ICIM UDD)
|
|
Scooped by
Gilbert C FAURE
June 6, 2:28 AM
|
The Immune System’s Greatest Plot Twist: When Losing MHC Class I Makes Cancer Cells More Vulnerable
For decades, immunology textbooks have taught a simple rule: MHC class I talks to CD8+ T cells. MHC class II talks to CD4+ T cells. End of story. But nature, as always, had other plans. In a stunning discovery published in Nature Immunology, researchers have flipped this paradigm on its head—showing that when target cells lose MHC class I, they become more susceptible to CD4+ T cell attack, not less. Think of it as a burglar cutting the alarm wires, only to accidentally trigger a much deadlier silent alarm.
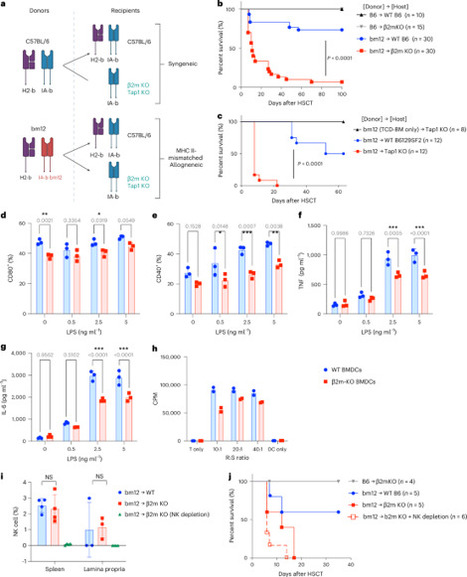
The team found that MHC I-deficient cells—whether gut cells during graft-versus-host disease or melanoma cells—are exquisitely sensitive to a fiery, iron-dependent form of cell death called ferroptosis. The mechanism is beautifully counterintuitive: without MHC I, cells become hyper-responsive to IFNγ signaling, ramping up lipid peroxidation and iron metabolism pathways that make them prime targets for CD4+ T cell-mediated destruction. In mouse models, MHC I-deficient tumors regressed significantly more when treated with tumor-specific CD4+ T cells. And in human melanoma and colon cancer datasets, patients with low MHC I expression but high CD4+ T cell infiltration had dramatically better survival on immune checkpoint therapy.
This isn't just a cool biology story—it's a potential game-changer for immunotherapy. Tumors that downregulate MHC I to escape CD8+ T cells (classic "immune cold" tumors) might actually be primed for CD4+ T cell attack. The authors suggest that we could design therapies to actively leverage this vulnerability, turning a common escape mechanism into an Achilles' heel. Whether in cancer, transplantation, or infectious disease, this work rewrites the rulebook on how MHC I shapes immune recognition. Sometimes, the best defense… is losing your armor.
#Immunology #CancerResearch #MHCClassI #CD4TCells #Ferroptosis #Immunotherapy #ParadigmShift #NatureImmunology #GVHD #CheckpointInhibitors
https://lnkd.in/gWFySUWm
|
|
Scooped by
Gilbert C FAURE
January 6, 1:02 PM
|
Long COVID (LC) involves a spectrum of chronic symptoms after acute severe acute respiratory syndrome coronavirus 2 infection. Current hypotheses for the pathogenesis of LC include persistent virus, tissue damage, autoimmunity, endocrine insufficiency, immune dysfunction and complement activation. We performed immunological, virological, transcriptomic and proteomic analyses from a cohort of 142 individuals between 2020 and 2021, including uninfected controls (n = 35), acutely infected individuals (n = 54), convalescent controls (n = 24) and patients with LC (n = 28). The LC group was characterized by persistent immune activation and proinflammatory responses for more than 180 days after initial infection compared with convalescent controls, including upregulation of JAK-STAT, interleukin-6, complement, metabolism and T cell exhaustion pathways. Similar findings were observed in a second cohort enrolled between 2023 and 2024, including convalescent controls (n = 20) and patients with LC (n = 18). These data suggest that LC is characterized by persistent activation of chronic inflammatory pathways, suggesting new therapeutic targets and potential biomarkers of disease. Long COVID (LC) involves a spectrum of chronic symptoms after resolution of acute severe acute respiratory syndrome coronavirus 2 infection. Barouch and colleagues show that LC is characterized by persistent activation of chronic inflammatory pathways and T cell exhaustion.
|
|
Scooped by
Gilbert C FAURE
February 15, 2024 3:09 AM
|
Visceral adipose tissue (VAT) is an energy store and endocrine organ critical for metabolic homeostasis. Regulatory T (Treg) cells restrain inflammation to preserve VAT homeostasis and glucose tolerance. Here, we show that the VAT harbors two distinct Treg cell populations: prototypical serum stimulation 2-positive (ST2+) Treg cells that are enriched in males and a previously uncharacterized population of C–X–C motif chemokine receptor 3-positive (CXCR3+) Treg cells that are enriched in females. We show that the transcription factors GATA-binding protein 3 and peroxisome proliferator-activated receptor-γ, together with the cytokine interleukin-33, promote the differentiation of ST2+ VAT Treg cells but repress CXCR3+ Treg cells. Conversely, the differentiation of CXCR3+ Treg cells is mediated by the cytokine interferon-γ and the transcription factor T-bet, which also antagonize ST2+ Treg cells. Finally, we demonstrate that ST2+ Treg cells preserve glucose homeostasis, whereas CXCR3+ Treg cells restrain inflammation in lean VAT and prevent glucose intolerance under high-fat diet conditions. Overall, this study defines two molecularly and developmentally distinct VAT Treg cell types with unique context- and sex-specific functions. Here, the authors characterize two distinct Treg cell populations in the visceral adipose tissue of lean and high-fat diet-fed mice. ST2+ Treg cells are dominant in male mice and are transcriptionally driven by GATA3 and PPARγ, regulators that limit the differentiation of the more female-dominant population of CXCR3+ Treg cells that are T-bet dependent. Functional distinctions are also evident in glucose tolerance and adipose inflammation.
|
|
Scooped by
Gilbert C FAURE
December 6, 2022 10:33 AM
|
Immune responses are governed by signals from the tissue microenvironment, and in addition to biochemical signals, mechanical cues and forces arising from the tissue, its extracellular matrix and its constituent cells shape immune cell function. Indeed, changes in biophysical properties of tissue alter the mechanical signals experienced by cells in many disease conditions, in inflammatory states and in the context of ageing. These mechanical cues are converted into biochemical signals through the process of mechanotransduction, and multiple pathways of mechanotransduction have been identified in immune cells. Such pathways impact important cellular functions including cell activation, cytokine production, metabolism, proliferation and trafficking. Changes in tissue mechanics may also represent a new form of ‘danger signal’ that alerts the innate and adaptive immune systems to the possibility of injury or infection. Tissue mechanics can change temporally during an infection or inflammatory response, offering a novel layer of dynamic immune regulation. Here, we review the emerging field of mechanoimmunology, focusing on how mechanical cues at the scale of the tissue environment regulate immune cell behaviours to initiate, propagate and resolve the immune response. This Review considers how the biophysical properties of a tissue are able to shape immune cell function through the process of mechanotransduction. There are multiple mechanotransduction pathways that operate in immune cells and the authors highlight these and the emerging field of mechanoimmunology.
|
|
Scooped by
Gilbert C FAURE
November 21, 2021 3:54 AM
|
Cancer progresses by evading the immune system. Elucidating diverse immune evasion strategies is a critical step in the search for next-generation immunotherapies for cancer. Here we report that cancer cells can hijack the mitochondria from immune cells via physical nanotubes. Mitochondria are essential for metabolism and activation of immune cells. By using field-emission scanning electron microscopy, fluorophore-tagged mitochondrial transfer tracing and metabolic quantification, we demonstrate that the nanotube-mediated transfer of mitochondria from immune cells to cancer cells metabolically empowers the cancer cells and depletes the immune cells. Inhibiting the nanotube assembly machinery significantly reduced mitochondrial transfer and prevented the depletion of immune cells. Combining a farnesyltransferase and geranylgeranyltransferase 1 inhibitor, namely, L-778123, which partially inhibited nanotube formation and mitochondrial transfer, with a programmed cell death protein 1 immune checkpoint inhibitor improved the antitumour outcomes in an aggressive immunocompetent breast cancer model. Nanotube-mediated mitochondrial hijacking can emerge as a novel target for developing next-generation immunotherapy agents for cancer. Cancer cells adopt a series of strategies to evade the immune response mounted by the organism against them. Here we find that tumour cells can hijack mitochondria from immune cells by forming physical nanotubes, and suggest that inhibiting this process might represent a potential immunotherapy approach.
|
|
Scooped by
Gilbert C FAURE
April 29, 2021 6:52 AM
|
Macrophages are a heterogeneous population of immune cells playing several and diverse functions in homeostatic and immune responses. The broad spectrum of macrophage functions depends on both heterogeneity and plasticity of these cells, which are highly specialized in sensing the microenvironment and modify their properties accordingly. Although it is clear that macrophage phenotypes are difficult to categorize and should be seen as plastic and adaptable, they can be simplified into two extremes: a pro-inflammatory (M1) and an anti-inflammatory/pro-resolving (M2) profile. Based on this definition, M1 macrophages are able to start and sustain inflammatory responses, secreting pro-inflammatory cytokines, activating endothelial cells, and inducing the recruitment of other immune cells into the inflamed tissue; on the other hand, M2 macrophages promote the resolution of inflammation, phagocytose apoptotic cells, drive collagen deposition, coordinate tissue integrity, and release anti-inflammatory mediators. Dramatic switches in cell metabolism accompany these phenotypic and functional changes of macrophages. In particular, M1 macrophages rely mainly on glycolysis and present two breaks on the TCA cycle that result in accumulation of itaconate (a microbicide compound) and succinate. Excess of succinate leads to Hypoxia Inducible Factor 1α (HIF1α) stabilization that, in turn, activates the transcription of glycolytic genes, thus sustaining the glycolytic metabolism of M
|
|
Scooped by
Gilbert C FAURE
January 9, 2021 6:27 AM
|
Significance Light zone (LZ) B cells are selected in germinal centers (GCs) in a cMyc-dependent manner, before dark zone (DZ) migration. Antigen affinity of B cells is enhanced during GC responses, and some differentiate into plasmablasts or memory B cells (MBCs). Currently, GC selection is presumed as a competitive affinity-dependent process. This cannot explain retention of GC B cells with varied affinities. We identified cMyc+ LZ B cell subpopulations enriched with either higher-affinity plasmablast precursors or lower-affinity MBC precursors and future DZ entrants, which diverged soon after permissive selection. Future DZ entrants’ affinity was enhanced through preferential proliferation of higher-affinity cells, and lower-affinity cells were retained in GCs. These findings elucidate mechanistically how GC selection ensures clonal diversity for broad protection. Abstract Affinity maturation depends on how efficiently germinal centers (GCs) positively select B cells in the light zone (LZ). Positively selected GC B cells recirculate between LZs and dark zones (DZs) and ultimately differentiate into plasmablasts (PBs) and memory B cells (MBCs). Current understanding of the GC reaction presumes that cMyc-dependent positive selection of LZ B cells is a competitive affinity-dependent process; however, this cannot explain the production of GC-derived lower-affinity MBCs or retention of GC B cells with varied affinities. Here, by combining single-cell/bulk RNA sequencing and flow cytometry, we identified and characterized temporally and functionally distinct positively selected cMyc+ GC B cell subpopulations. cMyc+ LZ B cell subpopulations enriched with either higher- or lower-affinity cells diverged soon after permissive positive selection. The former subpopulation contained PB precursors, whereas the latter comprised less proliferative MBC precursors and future DZ entrants. The overall affinity of future DZ entrants was enhanced in the LZ through preferential proliferation of higher-affinity cells. Concurrently, lower-affinity cells were retained in GCs and protected from apoptosis. These findings redefine positive selection as a dynamic process generating three distinct B cell fates and elucidate how positive selection ensures clonal diversity for broad protection. B cells substantially increase their affinity for the antigen during the course of T cell-dependent immune responses. This fine-tuning of antibody specificity is known as affinity maturation (1, 2) and occurs in germinal centers (GCs) through a bidirectional migration cycle between two phenotypically and anatomically distinct regions of GCs, light zone (LZ) and dark zone (DZ) (3). GC B cells exit cell cycle upon their transit from the DZ to the LZ where antigen-driven selection occurs in response to signals from B cell receptor (BCR) engagement and T follicular helper cells (TFHs). Positively selected GC B cells in the LZ acquire cMyc (avian myelocytomatosis virus oncogene cellular homolog) expression, a critical regulator for cell proliferation and GC maintenance, as “licensed” cells (4, 5), which are protected from apoptosis (6). The transient cMyc expression leads the positively selected LZ B cells to reenter the DZ where cells proliferate and hypermutate their BCRs to improve affinity for the antigen. In the currently favored model of affinity maturation, positive selection occurs in an affinity-dependent manner in the LZ (7, 8). GC B cells retrieve antigen displayed on follicular dendritic cells (FDCs), internalize the BCR that binds antigen, and present differing levels of antigen in the form of peptide major histocompatibility II in proportion to its affinity, which allows clones with relatively higher BCR affinity to receive more help from TFHs whose number is limited (8⇓–10). Indeed, positively selected cMyc+ GC B cells in the LZ express BCRs with higher affinity for the antigen compared with cMyc-negative LZ cells (4). cMyc+ GC B cells in the LZ restart the cell cycle and are primed to enter the DZ to complete cell division (4, 5, 11). Hence, the competitive advantage of the selected higher-affinity BCR clones is thought to occur only in the DZ where they undergo more rounds of cell division in enhanced tempo during prolonged dwell time (12, 13). However, this model cannot explain recent findings showing that GCs can retain cells expressing low- and moderate-affinity BCRs while antibody affinity is improved (14, 15). Additionally, within this model the roles of dividing LZ B cells that were observed in histology and two-photon microscopy experiments (7, 16⇓⇓–19) remain unknown. cMyc expression in GC B cells effectively defines positively selected B cells (4, 5). However, this population is suggested to be developmentally heterogeneous (20, 21), with at least one of the subfractions requiring strong signals derived from TFHs for its generation (21). Consistent with this, increased TFHs help drives plasmablast (PB)/plasma cell (PC) differentiation from GC B cells (10) that carry higher-affinity BCRs (22) through recently identified PC precursors (Bcl6loCD69hi LZ GC B cells) expressing cMyc transcripts at a relatively higher level than the other LZ B cells (23). Taken together, these observations suggest that the cMyc+ compartment contains PB/PC precursors as well as DZ entrants and therefore, is heterogeneous regarding B cell differentiation stage and BCR affinity. In contrast to PBs/PCs, memory B cells (MBCs) appear to be formed in response to a minimal amount of help from TFHs (24) and predominantly contain lower-affinity clones (24, 25). Together with the observation that MBC precursors are relatively quiescent (24⇓–26), MBCs are generally thought to arise from “nonpositively selected” LZ B cells. However, some MBC precursors have been found to carry higher-affinity BCRs (25), suggesting that a fraction of MBCs may also arise from positively selected LZ B cells. However, it remains unclear how MBCs are formed and thus, whether MBC precursors can emerge from positively selected cells. In this study, we identified positively selected cMyc+ LZ B cells that comprise subpopulations representing three distinct B cells fates (pre-PB/PCs, pre-MBCs, and DZ entrants), and these subpopulations emerged in a sequential order following cMyc-inducing signals. In-depth analyses of these subpopulations demonstrated that GC positive selection is permissive to retaining a large proportion of low-affinity clones that are protected from apoptosis despite their low-affinity BCR. Sequential molecular and mitotic events in the cMyc+ LZ B cell compartment determined B cell fates and improved affinity of future DZ entrants. Hence, the manner of such dynamic positive selection can be beneficial to maintain clonal breadth and also advantageous for selecting antigen-specific cells to differentiate into MBCs. Results Identification and Flow Cytometric Delineation of Positively Selected cMyc+ GC B Cell Subpopulations. To investigate the heterogeneity of cMyc+ GC B cell compartment, we utilized cMycgfp/gfp reporter mice that express a GFP-cMyc fusion protein from the endogenous cMyc locus and allow monitoring of cMyc expression by GFP fluorescence (27). Splenic cMyc+ GC B cells from cMycgfp/gfp mice were sorted by flow cytometry 10 d after immunization with (4-hydroxy-3-nitrophenyl)acetyl (NP) hapten conjugated to chicken gamma globulin (NP-CGG) and were subjected to single-cell RNA sequencing (scRNAseq) (Fig. 1A). Transcriptomic profiling and unsupervised clustering of 205 cells revealed 678 differentially expressed genes (DEGs) by multigroup comparison (P ≤ 0.05) and five clusters (cMyc+#1, #2, #3, #4, and #5) within cMyc+ GC B cells (SI Appendix, Fig. S1 A and B). The t-Distributed Stochastic Neighbor Embedding (t-SNE) plot indicated that cells in the cMyc+#5 cluster represented an intermediate state between the cMyc+#4 and cMyc+#2 clusters (SI Appendix, Fig. S1A). We excluded the cMyc+#5 cluster from the scRNAseq dataset and focused on cMyc+ clusters #1 to #4 for further analysis (Fig. 1B and SI Appendix, Fig. S1C) because clear-cut markers could not be identified for the cMyc+#5 cluster (SI Appendix, Fig. S1B). Transcriptomic analysis of cells in these clusters revealed 547 DEGs by multigroup comparison (P ≤ 0.05), and 9 or 10 representative DEGs per cluster were depicted after further filtering out the DEGs by two-group comparison (P ≤ 0.05) with more than twofold change (Fig. 1B). The representative DEGs of the clusters included activation marker genes (Cd86, Cd83, and CD69), early-response genes (Nfkbia), genes involved in cell cycle regulation (Ccnd2 and CDC37), immunoregulatory molecules (Fcer2a; encoding CD23 and Cr2; encoding CD21/CD35), and chemokine receptors (Cxcr5 and Cxcr4) (Fig. 1B). It has been shown that Cd86, Cd83, Fcer2a, and Cxcr5 are highly expressed in LZ B cells (10) and that CD69, Nfkbia, and Ccnd2 are up-regulated in cMyc+ GC B cells (4, 5). To investigate distinctive biological features of the clusters, we performed Gene Set Enrichment Analysis (GSEA). This analysis revealed that the cMyc+#1 cluster appeared to be associated with PBs/PCs due to the high level of expression of the genes involved with interleukin (IL)-6 production and activation of nuclear factor kappa B (NF-κB) signaling, which are known to have critical roles for differentiation of PBs/PCs (28, 29) (SI Appendix, Fig. S1B). The cMyc+#1 cluster also expressed Cd69 at the highest level among all the clusters (Fig. 1B), which was concordant with previously reported PB/PC precursors (23). In the cMyc+#2 cluster, genes associated with stress response caused by DNA damage and oxidation were significantly enriched (SI Appendix, Fig. S1D). Responses to DNA damage and oxidative stress are known to occur mainly in the DZ (30, 31), suggesting that the cMyc+#2 cluster represented cMyc+ DZ B cells. The cMyc+#3 cluster was characterized by high expression of the LZ markers Fcer2a (CD23) and Cd86 (Fig. 1B). The expression of CD23 on B cells is known to be increased by CD40 ligation (32) and IL-4 stimulation (33), suggesting that cells in the cMyc+#3 cluster represent a cMyc+ LZ B cell population that has received T cell help more recently. In support of this, the cMyc+#3 cluster was also found to be enriched with genes associated with both “B cell receptor signaling pathway” and “immunological synapse” and thus, may represent an LZ subpopulation in the very early activation following BCR engagement and GC B/TFH interaction (SI Appendix, Fig. S1D). The cMyc+#4 cluster was characterized by relatively high expression of Cdc37, an Hsp90 cochaperone, and was enriched in genes associated with protein synthesis (Fig. 1B and SI Appendix, Fig. S1D). Therefore, this cluster may represent a population of cMyc+ LZ B cells that had been activated less recently than the cMyc+#3 cluster and were preparing for intensive cycling in the DZ, which is in agreement with decreased expression of genes associated with “immunological synapse” in the cluster (SI Appendix, Fig. S1D). Fig. 1. Identification and flow cytometric delineation of positively selected cMyc+ GC B cell subpopulations. (A) scRNAseq workflow and gating strategy for isolating splenic cMyc+ GC B cells of cMycgfp/gfp mice. (B) Heat map illustrating highly representative DEGs in each cluster. These DEGs passed thresholds: first, the cutoff for P ≤ 0.05 by multigroup comparison and second, for P ≤ 0.05 by two-group comparison (the cluster vs. ≠ the cluster) and log2 fold change >1. Fcer2a was the eighth enriched gene in the cMyc+#1 cluster, but it is not listed in the cluster because it is shown as the second enriched gene in the cMyc+#3 cluster instead. Genes encoding key markers that are used for delineating flow cytometric cMyc+ GC B cell subpopulations (as described in D) are highlighted in red. (C) Heat map illustrating the five key marker genes used in D. The markers were selected from 76 DEGs (P ≤ 0.005, by multigroup comparison). (D) Representative flow cytometry plots illustrating gating strategy to delineate cMyc+ GC B cell subpopulations. Splenic GC B cells of C57BL/6 mice are shown in gray dots as cMyc-GFPneg control cells. Average ± SEM value (15 mice) is shown in each indicated gate. Splenic GC B cell response to SRBC on day 7 in cMycgfp/gfp mice. Having identified DEGs using cMyc+ GC B cell scRNAseq data, we sought out surface markers to subdivide the heterogeneous cMyc+ compartment by flow cytometry. Other than the well-established DZ/LZ distinguishing markers, CXCR4 and CD86, three other surface markers CD69 [a marker for PB/PC precursors (23)], CD23, and CD21/35 were selected from the 76 DEGs determined by multigroup comparison (P ≤ 0.005) (Fig. 1C). High expression of Cd69 was representative of the cMyc+#1 cluster, and Fcer2a and Cr2 expression effectively distinguished between the cMyc+#3, cMyc+#4, and cMyc+#2 clusters by high, intermediate, and low expression, respectively (Fig. 1C). Using the combination of these five surface markers, cMyc-GFP+ GC B cells isolated from cMycgfp/gfp mice 7 d after sheep red blood cells (SRBCs) immunization were initially subdivided into four subpopulations. Hence, a candidate cMyc+ PB precursor subpopulation was identified as CD69hicMyc+ GC B cells (“cMyc+prePB”; based on the cMyc+#1 cluster); the cMyc+ DZ subpopulation (based on the cMyc+#2 cluster) was defined by the DZ gating (CXCR4hiCD86lo) among cMyc+ GC B cells after gating out cells in the cMyc+prePB subpopulation; the cMyc+early subpopulation (based on the cMyc+#3 cluster) was identified as CD23hiCD21/35hi LZ B cells among cMyc+ GC B cells after gating out cells in the cMyc+prePB and cMyc+ DZ subpopulations; and the cMyc+late subpopulation (based on the cMyc+#4 cluster) was identified as CD23+/loCD21/35+/lo LZ B cells in the remaining cMyc+ LZ B cells (Fig. 1D). We noted that the cMyc+late subpopulation consisted of a mixed population containing a major CD23+CD21/35+ subpopulation and a small tail-like CD23loCD21/35lo subpopulation. To improve the quality of upcoming analysis, we further subdivided the population into CD23+CD21/35+ and CD23loCD21/35lo subpopulations, which were termed as cMyc+lateCD23int and cMyc+lateCD23lo, respectively. In agreement with CD23 being highly expressed in LZ B cells (10), CD23 expression was down-regulated in the cMyc+ DZ subpopulation (Fig. 1D). Enumeration of the five cMyc+ GC B cell subpopulations showed that the cMyc+early and cMyc+prePB subpopulations were relatively rare within the cMyc+ compartment (451 ± 79.0 and 389 ± 60.7, respectively; 3 to 5% of the cMyc+ compartment). The largest population of the cMyc+ compartment was the cMyc+lateCD23int subpopulation, followed by the cMyc+ DZ subpopulation (5,009 ± 871.9 and 3,691 ± 599.4; 37 to 53% and 28 to 39% of the cMyc+ compartment, respectively) (SI Appendix, Fig. S1E). cMyc+ LZ B Cell Subpopulations Emerge in a Sequential Order following Positive Selection Signals. Having delineated cMyc+ GC B cell subpopulations by flow cytometry, we explored what these subpopulations represent. We hypothesized that these cMyc+ LZ B cell subpopulations represent different stages of the transition of GC B cells from the beginning of positive selection to DZ entry. To investigate the hypothesis, we examined the expression levels of DZ/LZ distinguishing markers CD86 and CXCR4 of cells in cMyc+ GC B cell subpopulations. We found that CD86 expression showed a downward trend in the following order: cMyc+early, cMyc+lateCD23int, and cMyc+lateCD23lo (Fig. 2A). On the other hand, the CXCR4 expression was increasing in the same order (Fig. 2A). Accordingly, cells in the cMyc+lateCD23lo subpopulation were found in the immediate vicinity of the border between the DZ and LZ (Fig. 2A); it appeared that these cells were about to enter the DZ. Although the DZ/LZ markers were not used for its delineation, the cMyc+prePB subpopulation was predominantly LZ B cells (82.9 ± 1.6%) (Fig. 2B), and most cells were clustered around the border between the DZ and LZ (Fig. 2A). Fig. 2. cMyc+ LZ B cell subpopulations emerge in a sequential order following positive selection signals. (A) Representative flow cytometry plots of CD86 vs. CXCR4 expression in the cMyc+ GC B cell subpopulations. Total GC B cells are shown in gray dots (Upper). Cd86 and Cxcr4 MFI values of the cMyc+ GC B cell subpopulations (relative to cMyc+ DZ values). (B) Percentages of cells in the cMyc+prePB subpopulation in DZ or LZ gates as described in A. Splenic GC B cell response to SRBC on day 7 in cMycgfp/gfp mice (A and B). Pooled data from more than three experiments with 11 (A) or 16 mice (B). Error bars indicate SEM. Statistics were calculated with one-way ANOVA. *P < 0.05; **P < 0.01; ***P < 0.001. (C) The 3D PCA plots of RNAseq data from the four cMyc+ LZ B cell subpopulations: cMyc+early, cMyc+lateCD23int, cMyc+lateCD23lo, and cMyc+prePB. The sample clusters were visualized by connecting each sample with its nearest neighbors for distance 3, 4, and 6. (D) Bar graphs representing GSEA of a cMyc+ LZ B cell subpopulation compared with the other (see description) for gene sets: “cMyc+AP4+ LZ up-regulated compared with AP4+ DZ” and “AP4+ DZ up-regulated compared with cMyc+AP4+ LZ.” The size of the dots indicates false discovery rate (FDR) q values. NES, normalized enrichment score. (E) In silico kinetics of the GC response (model 0) are plotted over the in vivo results for the number of GC B cells, cMyc+ GC B cells, and cells in each cMyc+ GC B cell subpopulation. cMyc positivity was attributed to the cells that were positively selected and received T cell signal (“tc signal”) from TFH above the selection threshold (= cMyc+early subpopulation). Cells in the cMyc+early subpopulation progressed to the cMyc+prePB or cMyc+late subpopulations, according to an in silico probabilistic fate decision between differentiation into GC output or CBs, respectively. Cells in the cMyc+late subpopulation progressed to the cMyc+ DZ subpopulation at the time of in silico CB differentiation. Cells in the cMyc+ DZ subpopulation lost cMyc expression after a fixed time. At the bottom plot, the four cMyc+ GC B cell subpopulations are plotted together, and Inset shows a magnification of cMyc+prePB and cMyc+early subpopulations. (Right) Working model of the cMyc+ GC B cell subpopulation dynamics in silico; RSS and AICc values are shown (see SI Appendix, Fig. S2 B–E for the other tested models). Free parameters used to fit the model are shown in blue letters. All data points were normalized with respect to the maximum value obtained in the simulation of the GC B cell kinetics in GC B cell numbers shown in the plot GC B cells. Mean (full lines) and SD (shaded area) of 100 simulations are shown. Black dots and colored dots represent in vivo data. Next, we performed RNA sequencing (RNAseq) on the flow cytometry-delineated cMyc+ LZ B cell subpopulations and assessed the hypothesis by transcriptome analysis. To visualize how closely the subpopulations were correlated to each other, three-dimensional (3D) principle component analysis (PCA) plots were generated based on the distances in the space of all active variables (P ≤ 0.0005, multigroup comparison). In these PCA plots, each sample was connected with its nearest neighbors within the indicated distance. The analysis showed that each sample was tightly clustered within its own subpopulation (distance 3) (Fig. 2C). At a greater distance, the cMyc+early subpopulation was related to both the cMyc+prePB and cMyc+lateCD23int subpopulations, and the cMyc+lateCD23int subpopulation was connected with the cMyc+early and cMyc+lateCD23lo subpopulations (distances 4 and 6) (Fig. 2C). We also carried out GSEA using gene signatures specific for subsets of GC B cells, cMyc+AP4+ LZ B cells, and AP4+ DZ B cells (34), which represent positively selected LZ B cells and DZ B cells emerging immediately after the transit of positively selected LZ B cells into the DZ, respectively. GSEA results between the subpopulations found to be closely related to each other in the PCA results (Fig. 2C) revealed that the cMyc+early subpopulation was significantly enriched for the cMyc+AP4+LZ GC B cell gene signature compared with cMyc+lateCD23int and cMyc+lateCD23lo subpopulations (Fig. 2D). The enrichment for this gene signature decreased in the cMyc+lateCD23int subpopulation and more so in the cMyc+lateCD23lo subpopulation (NES for cMyc+early vs. cMyc+lateCD23int and cMyc+lateCD23int vs. cMyc+lateCD23lo; 2.48 and 2.12, respectively) (Fig. 2D and SI Appendix, Fig. S2A). The opposite was true for the gene signature of AP4+ DZ GC B cells, which was significantly more enriched in the cMyc+lateCD23lo subpopulation compared with the cMyc+lateCD23int and cMyc+early subpopulations (Fig. 2D and SI Appendix, Fig. S2A). Notably, the enrichment for this gene signature decreased in the cMyc+lateCD23int subpopulation and more so in the cMyc+early subpopulation (NES for cMyc+lateCD23int vs. cMyc+lateCD23lo and cMyc+early vs. cMyc+lateCD23int; −1.17 and −2.37, respectively) (Fig. 2D and SI Appendix, Fig. S2A). These data indicated that the cMyc+ LZ B cell subpopulations emerge in the following order from the beginning of positive selection to DZ entry (cMyc+early → cMyc+lateCD23int → cMyc+lateCD23lo), which in turn, indicates that the cMyc+early subpopulation has been more recently positively selected than the cMyc+late subpopulations. To further test the hypothesis, we investigated if the size of each cMyc+ GC B cell subpopulation in silico would be commensurate to the in vivo results. To this end, we exploited an extended version of agent-based model for GC reactions (35) that includes features of multiple contacts between B and T cells to collect signals (36) (Fig. 2E and SI Appendix, Fig. S2 B–E). In this in silico model, the ratio of the percentage of recycling cells as DZ B cells (= centroblast [CB]) to the percentage of differentiating cells from the selected GC B cells as output cells was fixed to be 90%:10%. Under this setting, five different possible models (zero to four) for the functional interdependence of cMyc+ GC B cell subpopulations were tested. Temporal cellular dynamics of GC B cells, cMyc+ GC B cells, and cells in cMyc+ GC B cell subpopulations were obtained by in silico immunization (Fig. 2E and SI Appendix, Fig. S2 B–E), and the simulation results of each model reproduced the size of cMyc+ GC B cell subpopulations. Subsequently, quantitative model selection ranked the five models. The best-performing model (model 0) (Fig. 2E) was selected based on the lowest Akaike information criterion (AICc) value and residual sum of squares (RSS). Model 0 was considerably in accordance with the in vivo time-course results (i.e., cMyc+ LZ B cells progress from the cMyc+early subpopulation to the cMyc+late subpopulation that, in turn, becomes the cMyc+ DZ subpopulation). The in silico model also suggested that the cMyc+prePB subpopulation is derived from the cMyc+early subpopulation. Altogether, the data clearly indicated that cMyc+ GC B cell subpopulations represent those which emerge in a sequential order following the reception of cMyc-inducing signals. A Fraction of cMyc+ GC B Cells in Each Subpopulation Completes Mitosis in the LZ. Current knowledge does not provide information on whether and how long cMyc positivity induced by the engagement of BCR and CD40 is sustained in GC B cells. To mimic such positively selected B cells in vivo, we pulsed GC B cells for 1 h with anti-immunoglobulin M (IgM)/IgG F(ab’)2 (fragment antigen-binding) as a mimicry of BCR engagement, together with anti-CD40 antibody and IL-4 as a mimicry of TFH help, and investigated the level of cMyc in the cultured cells in the presence or absence of the stimulants for an additional 8 h. During the 8-h culture with the stimuli, cMyc-GFP mean fluorescence intensity (MFI) further increased compared with the MFI of the pulsed cells before the culture (Fig. 3A). Notably, in the absence of further stimuli, the cMyc-GFP MFI of the pulsed cells was maintained at a high level in these cells compared with the cells cultured in media for 9 h without any pulse (Fig. 3A). These data indicated that continuous stimulus is not required for the maintenance of cMyc expression in GC B cells for at least 8 h after cMyc induction. We concluded that cMyc+ LZ B cells can potentially complete at least one round of cell cycle in the LZ because the cell cycle of GC B cells takes 6 to 8 h (18, 37). Fig. 3. A fraction of cMyc+ GC B cells in each subpopulation completes mitosis in the LZ. (A) Representative flow cytometric histograms of cMyc-GFP vs. relative cell number (RCN; Left). cMyc-GFP MFI values of GC B cells in the indicated time points (Right). Each circle indicates one sample. (B) Experimental design for C. (C) Representative flow cytometric plots of a DNA dye, FxCycle vs. Ssc in the cMyc+ GC B cell subpopulations after 1-h BrdU incorporation. Diploid (2n) and tetraploid (4n) gates were determined by DNA contents that were visualized with FxCycle staining. Percentage of cells in the diploid gate of the post–S-gated cells is shown. This ratio indicates duration of S phase under this experimental setting. Splenic GC B cell response to SRBC on day 6 (A) or day 7 (C) in cMycgfp/gfp mice. Data are from a representative experiment containing five samples per condition of two experiments (A) or three experiments with eight mice (C). Error bars indicate SEM. Statistics were calculated with unpaired Student’s t test between samples taken at different time points (A) or with one-way ANOVA (C). n.s., not significant. *P < 0.05; ***P < 0.001; ****P < 0.0001. To assess the course of cell cycle progression within cMyc+ GC B cell subpopulations, we used the 5-ethynyl-2′-deoxyuridine (EdU)/5-bromo-2′-deoxyuridine (BrdU) dual-labeling technique. GC B cells were pulsed with EdU for 1 h and then labeled with BrdU for an additional 1 h, which enabled us to separate cells based on the cell cycle status (i.e., early synthesis [S] phase [EdUnegBrdU+], mid/late S phase [EdU+BrdU+], and post-S phase [EdU+BrdUneg]) (Fig. 3B and SI Appendix, Fig. S3A). When we closely analyzed the cell cycle status of each cMyc+ GC B cell subpopulation, we found varied dynamics between them: the percentage of cells in the nonreplicating gap 1 (G1) phase was greater in the cMyc+lateCD23int subpopulation, whereas the percentage of cells in the post-S (gap 2 [G2]/mitosis [M]) was increased in the cMyc+early subpopulation (SI Appendix, Fig. S3B). On the other hand, the percentage of cells in the early S phase was increased within the cMyc+ DZ subpopulation (SI Appendix, Fig. S3B), suggesting that the speed of S-phase entry in this subpopulation was faster than cMyc+ LZ B cell subpopulations. A previous study has shown that the ratio of EdU+BrdU+/EdU+BrdUneg × 1 h (interval time) can indicate duration of the S phase when the injection interval between EdU and BrdU is 1 h in dual-labeling experiments (38). Using this analysis, we found that the cMyc+prePB subpopulation exhibited the longest duration of the S phase, which was attributed to an increased percentage of cells in the mid-/late S phase (SI Appendix, Fig. S3 B and C). We also noted that the duration of the S phase for the cMyc+lateCD23lo subpopulation was nearly twofold longer than those of the cMyc+early and cMyc+lateCD23int subpopulations. However, the percentage of early S phase in the cMyc+lateCD23lo subpopulation was higher than those in the cMyc+early and cMyc+lateCD23int subpopulations (SI Appendix, Fig. S3 B and C). Considering the previous prediction that positively selected GC B cells return to the DZ before reaching the G2/M phase (35), this result may be partially attributed to the LZ to DZ transmigration of a fraction of cells within the cMyc+lateCD23lo subpopulation during the S phase to become cMyc+ DZ cells. Consequently, the duration of the S phase for the cMyc+ DZ subpopulation determined in this way may be overestimated. These data were also supported by GSEA for cell cycle genes between cMyc+ LZ B cell subpopulations (SI Appendix, Fig. S3D). Coupling a DNA-labeling dye to measure DNA contents with the EdU/BrdU dual-labeling technique allowed us to determine the cell cycle dynamics in detail. Analysis of EdU+BrdUneg cells in the post-S phase (G2/M) of each cMyc+ GC B cell subpopulation revealed that all cMyc+ LZ B cell subpopulations contained post–S-phase cells and that a fraction of these cells had completed cytokinesis as indicated by the DNA content measurement (2n and 4n represented cells that were at G1 after cell division and were at G2/M, respectively) (Fig. 3C). This finding was further substantiated by the time-course examination of DNA contents of EdUnegBrdU+ cells (cells that had entered S phase) within each cMyc+ LZ B cell subpopulation. The analysis showed that DNA contents of EdUnegBrdU+ cells doubled up to the G2/M level (4n) from the early S phase (2n) (described as “S1” at 1 h after BrdU injection) 5 h after BrdU injection (i.e., within 4 h) (SI Appendix, Fig. S3 E and F). Histone H3 is specifically phosphorylated on Ser10 at prophase and is swiftly dephosphorylated by the end of mitosis. Therefore, phospho-histone H3 (pH3) at Ser10 is a specific marker for cells undergoing mitosis. In agreement with previous reports observing pH3+ mitotic GC B cells in the LZ (17, 19), we found pH3+GL7+ GC B cells in the CD35hi LZ region (SI Appendix, Fig. S3G). Approximately 50% of pH3+ LZ B cells coexpressed cMyc at low levels (SI Appendix, Fig. S3G) in accordance with prior knowledge that levels of cMyc are drastically reduced during the brief period of mitosis (39). Notably, the percentage of cells that had completed cytokinesis (2n) of the post–S-phase gate had a nearly twofold increase in the cMyc+ DZ subpopulation compared with all the cMyc+ LZ B cell subpopulations (Fig. 3C). These data indicated that the G2/M phase progresses faster in the cMyc+ DZ subpopulation than the cMyc+ LZ B cell subpopulations and thus, that the tempo of cell cycle is likely to be different between the LZ and the DZ. Altogether, these data demonstrated that a fraction of cMyc+ LZ B cells completes cell cycle in each subpopulation in the LZ before migration to the DZ. Transit to a Subsequent cMyc+ LZ B Cell Subpopulation Can Be Accompanied by Cell Division. Given that a fraction of cMyc+ GC B cells in each LZ subpopulation completes mitosis, we aimed to examine whether the phenotypic change of cMyc+ LZ B cells is accompanied by cell division. For this purpose, B cells derived from Mycgfp/gfp reporter mice crossed with SWHEL mice that express the hen egg lysozyme (HEL)-specific immunoglobulin heavy chain knock-in and light chain transgene (HyHEL10 BCR) (40) were transferred into CD45.1+ congenic recipient mice. We studied the response of SWHEL B cells to HEL after both donor and recipient mice were immunized with HEL-SRBC. One day after immunization, donor-derived CellTrace Violet (CTV)-labeled B cells were transferred into the immunized recipient mice (Fig. 4A). Seventy hours after the cell transfer, we analyzed the donor-derived HEL-specific B cells that had undergone cell division based on CTV dilution: CTVdiv4, CTVdiv5, CTVdiv6, and CTVdiv7+ (Fig. 4B). cMyc+ GC B cells located in these four CTV-based compartments were further resolved into the five cMyc+ GC B cell subpopulations (Fig. 4 B and C). Comparison of the percentage of each cMyc+ GC B cell subpopulation between the CTV compartments in sequence of division enabled us to calculate the proportion of cells transiting between subpopulation boundaries over time. The CTVdiv4 compartment consisted of a high proportion of cells in the cMyc+early subpopulation among total cMyc+ GC B cells; however, the percentage of cells in the subpopulation decreased nearly by half per round of cMyc+ B cell division: 34.5 ± 2.69% (CTVdiv4), 17.9 ± 1.71% (CTVdiv5), and 9.30 ± 1.45% (CTVdiv6). The percentage of cells comprising the cMyc+lateCD23int subpopulation increased significantly between CTVdiv4 and CTVdiv5, and it decreased mildly after CTVdiv5: 29.2 ± 3.03% (CTVdiv4), 39.0 ± 2.26% (CTVdiv5), and 37.2 ± 0.994% (CTVdiv6). In contrast, the percentage of the cMyc+lateCD23lo and cMyc+ DZ cells increased in every cell division: cMyc+lateCD23lo: 6.29 ± 1.02% (CTVdiv4), 11.0 ± 1.33% (CTVdiv5), and 19.4 ± 2.09% (CTVdiv6); cMyc+ DZ: 7.51 ± 1.33% (CTVdiv4), 11.9 ± 1.28% (CTVdiv5), and 14.8 ± 1.31% (CTVdiv6). Cells in the cMyc+prePB subpopulation maintained similar percentage throughout cell division (Fig. 4C). Collectively, these data suggested that cell division is correlated with the transit of a fraction of cells to a subsequent cMyc+ LZ B cell subpopulation. Fig. 4. Transit to a subsequent cMyc+ LZ B cell subpopulation can be accompanied by cell division. (A) Experimental design for B and C with a representative flow cytometric plot of B cells used for adoptive transfer. Intraperitoneal (i.p.) and intravenous (i.v.) injections in mice. (B) Representative flow cytometric plots. SWHEL cMycgfp/gfp donor-derived HEL-specific B220+ B cells were divided into four gates by cell division number based on dilution of CTV: CTVdiv7+, seven division and more; CTVdiv6, six division; CTVdiv5, five division; CTVdiv4, four division. cMyc-GFP+ GC B cells of each CTV gate were further resolved into the five subpopulations by the gating described in Fig. 1D. SWHEL control mouse-derived GC B cells are shown in gray dots to identify the cMyc-GFPneg population. (C) Percentages of cells of the five cMyc+ GC B cell subpopulations in each CTV gate. Pooled data from more than three experiments with 13 mice (C). Error bars indicate SEM. Statistics were calculated with one-way ANOVA. N.S., not significant. *P < 0.05; **P < 0.01; ***P < 0.001; ****P < 0.0001. Permissive Selection Occurs at the Start of Positive Selection Followed by Affinity-Dependent Proliferation in the LZ. In the currently favored model, positive selection occurs in an affinity-dependent manner in the LZ (7, 8). To investigate if BCR affinity differs between cMyc+ GC B cell subpopulations, we endeavored to measure it. B cells derived from Mycgfp/gfp SWHEL mice were transferred into CD45.1+ congenic recipient mice, followed by immunization with an HEL mutant protein, HEL3× conjugated to SRBC (Fig. 5A). HyHEL10 BCR binds to HEL with high affinity (2 × 10¹⁰ M−1), whereas it binds to HEL3× with an affinity 13,000-fold lower (41), which allows us to assess affinity maturation in mice after HEL3×-SRBC immunization. As previously shown, donor cells hardly respond to SRBC (42). Eight days after immunization, high-affinity SWHEL B cell clones bound to HEL3× more intensely (top diagonal gate), whereas low-affinity clones bound to it less intensely (bottom gate) (Fig. 5B). Flow cytometric analysis showed that high-affinity clones were almost exclusively enriched within class-switched IgG1+ cells but not in IgM+ cells (Fig. 5B). Thereafter, we restricted the analysis to IgG1+ cells, which also ensures that IgM+ naïve B cells were excluded from the analysis. We looked at the ability of cMyc+ GC B cell subpopulations to bind HEL3× and found that the cMyc+early subpopulation predominantly contained lower-affinity clones, whereas the cMyc+prePB subpopulation comprised higher-affinity cells (Fig. 5C). To ensure that the cMyc+early subpopulation did not contain a significant fraction of recent GC entrants, we sorted this subpopulation derived from cMycgfp/gfp reporter mice 10 d after immunization with NP-CGG by flow cytometry and investigated the number of mutations in the NP-binding IgG1 VH186.2 gene sequence. Only 8.6% of the total sequenced IgG1+ clones in the cMyc+early subpopulation were detected as unmutated (162 clones sequenced; results from pooled three independent sorting; unmutated clone number/total sequenced: sort#1, 6/45; sort#2, 3/56; sort#3, 5/61). This indicated that the cMyc+early subpopulation is mainly derived from GC residents that have undergone somatic hypermutation rather than from cells that have recently entered the GC, in keeping with the previous observation that only B cell clones with a competitive advantage in affinity can join preexisting GCs (43). The ratio of IgG1+ high/low HEL3× binding cells was increased by approximately fourfold when the values were compared between the cMyc+early and the cMyc+lateCD23lo subpopulations (Fig. 5C). Although it is generally assumed that only high-affinity clones are actively positively selected from the beginning of the process, our data revealed that positive selection starts permissively to retain lower-affinity cells. Cells in cMyc+ GC B cell subpopulations were not apoptotic despite the fact that most of the cells in the cMyc+early and cMyc+lateCD23int subpopulations carried low-affinity BCR (Fig. 5C and SI Appendix, Fig. S4A). In agreement with previous reports showing that high-affinity GC B cells proliferate more than low-affinity ones (12, 25), a greater percentage of high-affinity cells incorporated EdU than low-affinity ones within each cMyc+ GC B cell subpopulation (Fig. 5D). This could not be determined for the cMyc+early subpopulation due to limitation in high-affinity cell numbers at the experimental time point (Fig. 5D). As a result of preferential proliferation of higher-affinity clones, BCR affinity was enhanced in the LZ, while cMyc+ LZ B cells were phenotypically changing to cMyc+ DZ B cells (i.e., from cMyc+lateCD23int to cMyc+lateCD23lo and from cMyc+lateCD23lo to cMyc+ DZ) (Fig. 5 B and C). Because the relationship between the cMyc+prePB and the rest of the cMyc+ LZ B cell subpopulations was not well defined (described below), we excluded the cMyc+prePB subpopulation from the model. In summary, these data suggest a revised model for the positive selection process: GCs are permissive to selecting lower-affinity cells at the start of positive selection, followed by affinity-dependent proliferation in the LZ. Clonal diversity is ensured by protecting lower-affinity cells from undergoing apoptosis, while the affinity of future DZ entrants is increased in the LZ before DZ entry. Fig. 5. Permissive selection occurs at the start of positive selection, followed by affinity-dependent proliferation in the LZ. (A) Experimental design for B. (B) Representative flow cytometric plots. SWHEL cMycgfp/gfp donor-derived cMyc+ GC B cells 8 d after HEL3×-SRBC immunization were divided into high-affinity (top diagonal gate) and low-affinity (bottom gate) gates based on binding ability of BCR (IgM or IgG1) to HEL3× (Upper). Representative flow cytometric plots of HEL3× binding vs. IgG1 expression in the cMyc+ GC B cell subpopulations (Lower). (C) IgG1+ high-/low-HEL3× binding ratio in the cMyc+ GC B cell subpopulations. (D) Percentages of EdUpos cells in the cMyc+ GC B cell subpopulations that were further divided based on the BCR affinity as shown in B 6 h after i.v. injection with EdU. Splenic GC B cell response to HEL3×-SRBC immunization on day 7. Due to the limitation of the number of high-affinity cells in the cMyc+early subpopulation, percentages of EdUpos cells were unable to be determined (U.D.). (E) cMyc-GFP MFI values of the cMyc+ GC B cell subpopulations. SWHEL cMycgfp/gfp donor-derived HEL-specific cells 8 d after HEL3×-SRBC immunization were divided into IgG1pos high affinity and low affinity. Statistics calculated with unpaired Student’s t test between low- and high-affinity cells of each cMyc+ GC B cell subpopulation. (F) CD40 MFI values (relative to cMyc+ DZ values). Fo-B cells were defined as B220+CD38hiCD95negCD23hiCD21/35lo cells. Splenic GC B cell response to SRBC on day 7 in cMycgfp/gfp mice. Pooled data from more than three experiments with 38 mice (C), 12 mice (D), 18 mice (E), or 19 mice (F). Error bars indicate SEM. Statistics were calculated with one-way ANOVA. N.S., not significant. *P < 0.05; **P < 0.01; ***P < 0.001; ****P < 0.0001. Levels of cMyc Expression Reinforce the Potential for cMyc+ GC B Cell Subpopulations to Emerge Sequentially. A previous report has demonstrated that the level of cMyc protein is highest in B cells that have just received cMyc-inducing signals (44). Hence, the level of cMyc expression is a good indicator for how long the cells have received cMyc-inducing signals. We found that the cMyc-GFP MFI was highest in the cMyc+early subpopulation and decreased in the following order: cMyc+early, cMyc+lateCD23int, cMyc+lateCD23lo, and cMyc+ DZ subpopulations for both low- and high-affinity cells (SI Appendix, Fig. S4B). This result reinforced our hypothesis that the cMyc+early subpopulation emerges earliest, and the cMyc+lateCD23int and cMyc+lateCD23lo subpopulations follow it in this order. Previous work showed that the level of cMyc protein in GC B cells is also dependent on the amount of T cell help (45), which in turn, is dependent on BCR affinity. As expected, high-affinity cells expressed more cMyc protein than low-affinity cells when the comparison was made within the same cMyc+ GC B cell subpopulation (Fig. 5E). Despite that, the low-affinity cells of the cMyc+early subpopulation exhibited a similar level of cMyc-GFP expression compared with the high-affinity cells of the cMyc+lateCD23int subpopulation and even higher than that of the high-affinity cells in the cMyc+lateCD23lo and cMyc+ DZ subpopulations (Fig. 5E). A similar observation was made in mice immunized with SRBC, in which the cMyc+early subpopulation exhibited higher cMyc-GFP MFI compared with cMyc+late and cMyc+ DZ subpopulations regardless of its larger proportion of low-affinity clones (SI Appendix, Fig. S4C). In order to understand how cells in the cMyc+early subpopulation can be positively selected despite the enrichment of low-affinity clones, we investigated the expression of CD40 that is a key molecule for cMyc induction (46). In cMyc+ GC B cell subpopulations derived from cMycgfp/gfp mice on day 7 of the response to SRBC, cells in the cMyc+early subpopulation expressed higher surface levels of CD40 than cMycneg LZ B cells and any other cMyc+ GC B cell subpopulation (Fig. 5F and SI Appendix, Fig. S4D). These data suggested that CD40 is up-regulated in low-affinity LZ B cells before and/or during receiving signals from TFH to allow them to receive increased T cell help and pass a threshold (i.e., cMyc induction) for positive selection. Cells in the cMyc+prePB subpopulation expressed cMyc as high as cells in the cMyc+early subpopulation (Fig. 5E and SI Appendix, Fig. S4 B and C), and also, the cMyc+prePB subpopulation was more closely related to the cMyc+early subpopulation than any of the other cMyc+ LZ B cell subpopulations according to the 3D PCA plots (Fig. 2C). These data together with in silico models (Fig. 2E and SI Appendix, Fig. S2 B–E) suggested the possibility that the cMyc+prePB subpopulation may be selectively derived from high-affinity cells within the cMyc+early subpopulation. However, cells in the cMyc+prePB subpopulation were comparatively more enriched in the cMyc+AP4+ LZ positively selected GC B cell gene signature than the cMyc+early subpopulation (Fig. 2D). Thus, we currently cannot exclude the possibility that cMyc+prePB subpopulation may be generated independently of the cMyc+early subpopulation. Altogether, these results strongly reinforced our hypothesis that cMyc+ GC B cell subpopulations represent those which emerge in a sequential order following cMyc-inducing signals. The process of positive selection starts in the cMyc+early subpopulation, which is predominantly composed of low-affinity clones and proceeds through preferential proliferation of high-affinity clones in the subsequent cMyc+late subpopulations to outcompete the low-affinity ones in the LZ. Specific cMyc+ GC B Cell Subpopulations Contain MBC and PB/PC Precursors. We next examined transcriptomic profiles to investigate whether cMyc+ LZ B cell subpopulations are associated with B cell differentiation. First, within the DEGs identified by multigroup comparison (P ≤ 0.04) between the four cMyc+ LZ B cell subpopulations from bulk RNAseq data, we analyzed those genes that are known to be associated with PB/PC or MBC differentiation (23, 47⇓–49). Cells in the cMyc+prePB subpopulation had increased expression of PC-associated genes, including Batf, Socs2, Nfkbia, Myc, Id2, Cd40, and Ccnd2, but reduced expression of Id3, Sell, Cr2, Cd83, and Ccr6, which is in agreement with the low expression of these genes in PCs (23, 47, 49) (Fig. 6A). The increased expression of Nfkbia in the cMyc+prePB subpopulation was an indication of enhanced NF-κB signaling, an essential pathway for the differentiation of PB/PC from GC B cells (28). Then, we performed GSEA on the cMyc+prePB subpopulation, which displayed significant enrichment of a PC gene signature and the expression of IRF4 target genes in PCs (Fig. 6B). These results suggested that the cMyc+prePB subpopulation contains PB precursors. Although the gene expression of Prdm1 or Irf4 was not significantly up-regulated in this subpopulation, we found that cMyc+prePB subpopulation had an increased percentage of Blimp1-GFP+ cells (50) and relatively higher levels of IRF4 compared with the other cMyc+ GC B cell subpopulations (SI Appendix, Fig. S5 A and B). Surprisingly, genes associated with MBCs such as Il9r, Ccr6, Sell, Pecam1, S1pr1, Gpr183, Klf2, and Hhex (47, 48, 51) were up-regulated in the cMyc+early subpopulation (Fig. 6A), which was accompanied by a significant enrichment of an MBC gene signature in this subpopulation (Fig. 6B). Fig. 6. Specific cMyc+ GC B cell subpopulations contain MBC and PB/PC precursors. (A) Heat map for selected genes known to be associated with PB/PC or MBC differentiation. Only genes that have passed the threshold of P ≤ 0.04 by multigroup comparison are shown. (B) GSEA of differential gene expression in the cMyc+prePB subpopulation vs. the cMyc+early subpopulation for gene sets: “up-regulated in MBC compared with PC,” “up-regulated in PC compared with MBC,” “IRF4 target in PC compared with mature B cell,” and “NFκB activation.” Nominal enrichment score (NES), enrichment score (ES) and false discovery rate (FDR) q values. (C) Percentages of cells within the indicated populations after gating on CCR6pos GC B cells as shown in SI Appendix, Fig. S5C (Left). Percentage of cells within the cMyc+ GC B cell subpopulations after gating on CCR6pos cMyc+ GC B cells (Right). (D) Percentage of CCR6pos cells in the cMyc+ GC B cell subpopulations after gating as shown in SI Appendix, Fig. S5C. (E) Representative flow cytometric plots of HEL3× binding vs. IgG1 expression in CCR6pos and CCR6neg cells of the cMyc+early and cMyc+lateCD23int combined populations (Left). IgG1pos high-/low-HEL3× binding ratio in the indicated cell populations as gated in Left (Right). (F) Representative flow cytometric plots of CD38 vs. EdU incorporation in CCR6pos and CCR6neg cells of the cMyc+early and cMyc+lateCD23int combined populations that were further divided based on the BCR affinity as shown in E and IgG1pos MBCs 6 h after intravenous injection with EdU. Percentages of EdUpos cells in the indicated cell populations (Lower Right). SWHEL cMycgfp/gfp donor B cells on day 8 (C–E) or day 7 (F) after HEL3×-SRBC immunization. Pooled data from two experiments with 10 mice (C–E) or 11 mice (F). Error bars indicate SEM. Statistics were calculated with one-way ANOVA (C and D) or unpaired Student’s t test (E and F). N.S., not significant. **P < 0.01; ***P < 0.001; ****P < 0.0001. MBC precursors are reported to be quiescent and express lower-affinity BCR (24⇓–26), whereas cMyc+ GC B cells have been known to be proliferative and carry higher-affinity BCR (4, 5). Hence, it has been counterintuitive to link MBC precursors to positively selected cMyc+ GC B cells. However, the analysis of the bulk RNAseq data showed a significant enrichment of genes associated with MBCs in the cMyc+early subpopulation. We thereby investigated whether MBC precursors defined by CCR6 expression (25) were present within cMyc+ GC B cell subpopulations. To this end, we adoptively transferred B cells from SWHEL Mycgfp/gfp mice and first examined if donor-derived CCR6pos GC B cells expressed cMyc 8 d after HEL3x-SRBC immunization. We found CCR6pos cells within cMyc+ LZ B cells (2.0 ± 0.17% of total CCR6pos GC B cells) (Fig. 6C) despite the enrichment of CCR6pos GC B cells within cMycneg LZ B cells (Fig. 6C and SI Appendix, Fig. S5C). We next examined which cMyc+ GC B cell subpopulation represented CCR6pos GC B cells and found that the cMyc+lateCD23int subpopulation comprised over 60 of the cMyc+ CCR6pos GC B cells (62 ± 1.6%) (Fig. 6C). In contrast, the cMyc+ DZ subpopulation was not enriched with CCR6pos GC B cells (Fig. 6C and SI Appendix, Fig. S5C). These results are concordant with the previous observation that CCR6pos GC B cells are predominantly located in the LZ (25). When the proportion of CCR6pos B cells within each cMyc+ GC B cell subpopulation was determined, the cMyc+early subpopulation contained the highest percentage of CCR6pos GC B cells (19 ± 4.3% in SWHELMycgfp/gfp mice and 18 ± 2.6% in Mycgfp/gfp mice) (Fig. 6D and SI Appendix, Fig. S5D, respectively). Hence, cMyc+CCR6pos MBC precursors were present, and these cells were mostly contained in the cMyc+early and cMyc+lateCD23int subpopulations. Accordingly, we performed further analysis of MBC precursors using these combined subpopulations. The cMyc+CCR6pos MBC precursors were predominantly composed of low-affinity clones (Fig. 6E) in agreement with the previous finding that MBCs are mostly derived from low-affinity cells (24, 25). Indeed, higher-affinity clones became dominant in GCs over time (SI Appendix, Fig. S5E), and the percentage of MBC precursors found within cMyc+ GC B cell subpopulations 15 d after HEL3x-SRBC immunization was highly reduced (SI Appendix, Fig. S5F) compared with those after 8 d after immunization (Fig. 6D). This finding is consistent with the knowledge that MBCs mostly arise at earlier stages of the GC reaction (52). Next, we investigated if the cMyc+CCR6pos MBC precursors were less proliferative as previously reported for MBC precursors (25, 26). To examine the proliferation status of CCR6neg GC B cells and CCR6pos GC B cells within the low- and high-affinity cMyc+early and cMyc+lateCD23int combined subpopulations, we performed EdU incorporation assays. Within the cMyc+ GC B cell combined subpopulations, a significantly lower percentage of low-affinity cMyc+CCR6pos MBC precursors incorporated EdU compared with low-affinity cMyc+CCR6neg GC B cells (Fig. 6F). These data demonstrated that low-affinity cMyc+CCR6pos MBC precursors are less proliferative than the rest of the cMyc+ GC B cells (Figs. 5D and 6F). In summary, we identified CCR6pos MBC precursors within cMyc+ GC B cells. This identification provides a biological rationale for permissive positive selection, by which antigen-specific MBCs bearing low-affinity BCR can be efficiently produced. Discussion This study redefines GC B cell–positive selection as a dynamic process that ensures maintenance of a broad range of affinities in GCs. We found that affinity-dependent cell division occurred in the LZ and therefore, that such process is not restricted to the DZ. Newly positively selected LZ B cells form the cMyc+early subpopulation, which consists predominantly of low-affinity cells that are protected from apoptosis. These cMyc+ LZ B cells give rise to subsequent cMyc+late subpopulations in which high-affinity cells divide more than low-affinity cells. Such an affinity-based proliferation in the LZ allowed the enrichment of high-affinity clones before DZ migration. This mode of positive selection can be advantageous for retaining varied affinity clones in GCs, which ultimately may contribute to the production of GC-derived MBCs (SI Appendix, Fig. S6). Cells in each cMyc+ LZ B cell subpopulation are proliferative, although their cell cycle dynamics varied in each subpopulation. This proliferative status of cMyc+ LZ B cell subpopulations is consistent with previous observations of a fraction of dividing LZ B cells made by histology, two-photon microscopy, and flow cytometry (7, 16⇓⇓–19) and also with dividing LZ B cells (S/G2/M) being located at the border of LZ/DZ (53). Although these results may also reflect the arrival of dividing DZ B cells to the LZ, our flowcytometric data demonstrated that a fraction of positively selected LZ B cells initiated and completed cell division locally. Immunofluorescence results showed that mitotic pH3+cMyc+ GC B cells exist in the LZ (SI Appendix, Fig. S3G), and accordingly, a fraction of cMyc+ GC B cells divides in the LZ. However, we are currently unable to identify spatial distribution of cells in each cMyc+ subpopulation due to technical limitations. Recently, a proliferative CXCR4+CD83+ GC B cell subset, “grey zone (GZ) B cells,” has been discovered with a new gating strategy, and this subset is transcriptionally distinct from the rest of GC B cells, namely CXCR4negCD83+ LZ B cells and CXCR4+CD83neg DZ B cells (54). Approximately one-third and two-thirds of GZ B cell subset are LZ B cells (CXCR4neg/+CD83+) and DZ B cells (CXCR4+CD83neg/+), respectively, when cells are delineated using the conventional gating strategy (54). A large fraction of cells in the cMyc+ subpopulations were shown to be located in the CXCR4+CD86+ region (Fig. 2A). Because it is most likely that this region is equivalent to the CXCR4+CD83+ GZ region, the GZ B cell subset perhaps includes most cells from the cMyc+ subpopulations. Approximately 3 to 7% of GC B cells are cMyc+ LZ B cells, which is proportionally much smaller than constantly dividing DZ B cells. Therefore, cell division of a small number of cMyc+ LZ B cells may be underestimated particularly when GC B cells are treated with potent exogenous cell cycle inducers (45). Considering the cell number and transition of high-/low-affinity ratio between the three cMyc+ LZ B cell subpopulations (cMyc+early, cMyc+lateCD23int, and cMyc+lateCD23lo), some clones bearing high-affinity BCR perhaps divide more than once in the LZ. This is consistent with our finding showing that a fraction of cells completes cell division within a specific cMyc+ LZ B cell subpopulation. We revealed that GC B cells can retain cMyc expression in the absence of continued stimulation for at least 8 h after reception of cMyc-inducing signals (Fig. 3A). Given that GC B cells divide every 6 to 8 h (18, 37), multiple rounds of division of LZ B cells are theoretically possible. Our data suggested that the phenotypic change of cMyc+ LZ B cells can be accompanied by cell division. However, given that the number of cell division of cMyc+ LZ B cells with low-affinity BCR is fewer than those with high-affinity BCR, we assume that the phenotype associated with the cMyc+ LZ B cell subpopulations is perhaps altered in the absence of cell division as well. Due to limitations of the current technology, we are so far unable to determine whether a cell divides in every cMyc+ LZ B cell subpopulation and accordingly, how many times cMyc+ LZ B cells divide before migrating to the DZ. Further investigation is required for the elucidation of these points. Abrogation of FoxO1 and CXCR4, key molecules to maintain the DZ program and to define DZ positioning of GC B cells, results in generating DZ-null GCs according to surface marker profile (19⇓–21, 55). Notably, the effect caused by the loss of either molecule on cell cycle status is minimal, indicating that neither DZ access nor the FoxO1-governing DZ program are required for cell proliferation (19, 20, 55). These data suggest that the DZ is not the only site for cell proliferation in agreement with our data and with earlier observations of proliferative cells in the LZ (7, 16⇓–18, 37). Since Foxo1-null LZ-like B cells are defective in antigen presentation due to a significantly lowered expression of BCR compared with control LZ B cells (21), positive selection in these mice is impaired. As a result, a reduced percentage of high-affinity clones or antigen-specific cells is observed in Foxo1-deficient mice compared with control mice (20, 55). Nonetheless, Sander et al. (20) found a similar percentage of high-affinity clones between IgM+ NP-specific Foxo1-null GC B cells and control IgM+ NP-specific GC B cells. It is thus tempting to speculate that this finding may be attributable to proliferation of positively selected LZ B cells independently of the DZ proliferation program. It remains unclear how the cMyc+prePB subpopulation is generated. The cMyc+prePB subpopulation expressed lower levels of CD40 than the cMyc+early subpopulation (Fig. 5F and SI Appendix, Fig. S4D). This result can be interpreted as that CD40 internalization had started more recently in the cMyc+early subpopulation than the cMyc+prePB subpopulation (i.e., the former subpopulation is an ascendant subpopulation of the latter). GSEA results supported this interpretation because the signature of genes up-regulated by CD40 signaling was found to be enriched in the cMyc+prePB subpopulation compared with the cMyc+early subpopulation. Moreover, the in silico model also indicated that the cMyc+prePB subpopulation is derived from the cMyc+early subpopulation (Fig. 2E). In such a case, cells in the cMyc+prePB subpopulation are likely to be derived from high-affinity cells within the cMyc+early subpopulation. MBCs are enriched with low-affinity clones and appear to require only minimal levels of signals derived from TFH (24, 25). Therefore, it is broadly assumed that MBCs arise from nonpositively selected LZ B cells as the TFH help provided is below a threshold for positive selection (24). To understand the origin of MBCs, intensive analysis using scRNAseq identified a pre-MBC subset in virus-infected mouse spleens (51) and human tonsils (56). The pre-MBC subsets are characterized by the expression of CCR6 in the both cases, and the mouse pre-MBC subset has relatively higher Mki67 expression than MBC subsets (51). This finding suggests that some CCR6+ pre-MBCs are able to divide before differentiation into MBCs. Here, our data indicate that MBCs can emerge from CCR6+cMyc+ GC B cells that are still dividing. Our flow cytometric analysis and GSEA results revealed that cells within the combined subpopulations of cMyc+early and cMyc+lateCD23int, which are mostly composed of low-affinity clones, are a source of CCR6+ MBC precursors (Fig. 6 A–D and SI Appendix, Fig. S5 C and D). Low-affinity CCR6+cMyc+ MBC precursors were less proliferative compared with low-affinity CCR6negcMyc+ LZ B cells within the combined subpopulations (Fig. 6F). Proliferation of high-affinity CCR6+cMyc+ MBC precursors was comparable with that of high-affinity CCR6negcMyc+ LZ B cells within the same combined subpopulations (Fig. 6F); however, this does not exclude a possibility that a small fraction of high-affinity MBCs can emerge from CCR6+cMyc+ LZ B cells carrying high-affinity BCR. For the MBC fate decision in cMyc+ GC B cells, coexpression of cMyc-interacting proteins perhaps plays a key role. We recently discovered that cMyc binds to the transcription factor MIZ1 to restrict positively selected GC B cells from forming MBCs and favor expansion of GC B cells (57). Hhex, an important transcription factor for MBC differentiation (51), can interact with cMyc to decrease its activity, including cell proliferation and metabolism in tumors (58). Further investigation on inte
|
|
Scooped by
Gilbert C FAURE
July 8, 2020 1:16 PM
|
Delayed skin-wound healing in AD-HIES patients. Aberrant postinfection healing of the lung parenchyma leading to formation of pneumatoceles and frequent postsurgery complications experienced by patients with AD-HIES (7–9) indicate major deficiencies in processes involved in wound healing and tissue remodeling. In order to gain insights into mechanisms underlying these abnormalities, we developed a human skin-wound–healing model in which we analyzed healing of skin biopsy wounds created by removing cylindrical pieces of skin using a 2-mm diameter punch biopsy tool (Figure 1A and Supplemental Figure 1; supplemental material available online with this article; https://doi.org/10.1172/JCI135490DS1). Histological examination of the traumatized tissue obtained by repeated 3-mm punch biopsy performed at day 7 after injury revealed histologic features consistent with a delayed wound-healing process in AD-HIES patients. In control patient wounds, abundant dermal collagen (highlighted by Masson’s trichrome stain) was present within the wound granulation tissue. By comparison, at day 7, AD-HIES wounds were still composed of mostly poorly organized granulation tissue, with nearly absent or minimal amounts of dermal collagen (Figure 1, A–C, and Supplemental Figure 1, C and D). While control fibroblasts in active granulation tissue during wound healing formed abundant collagen fibers (Figure 1C) and were surrounded by a higher density of blood vessels (Figure 1, D and E, and Supplemental Figure 1B), AD-HIES fibroblasts formed less collagen (Figure 1C) and the granulation tissue contained many fewer blood vessels (Figure 1, D and E). In summary, the analysis revealed abnormalities in skin-wound healing in AD-HIES patients that were characterized by delayed formation of granulation tissue, delayed reepithelialization, deficient neovascularization, and delayed restoration of dermal collagen by dermal fibroblasts. Deficiencies in these wound-healing processes may contribute to many of the AD-HIES pathologies, including inefficient repair of damaged soft tissues and structural abnormalities of connective tissues and arterial vessel walls. Figure 1 Delayed skin-wound healing in AD-HIES patients after tissue injury. (A) Overview of human cutaneous wound-healing model. A skin defect was created using a 2-mm-diameter skin punch biopsy tool (2 mm core biopsy of skin is excised to the depth of the deep dermis/dermal subcutaneous junction). Three or 7 days after the initial biopsy, a 3-mm skin punch biopsy of skin surrounding the original punch biopsy site was performed and the wound-healing process analyzed by Masson’s trichrome and immunohistochemistry. Upper: representative images of wounds at days 3 and 7. Lower: representative images of perpendicularly bisected biopsies. Dark blue staining indicates abundant collagen. Red color indicates early granulation tissue (GT) with much less collagen (asterisks). (See also Supplemental Figure 1, A and B.) (B–E) Delayed GT formation, collagen restoration, and vascularization during skin-wound healing in AD-HIES patients. Three AD-HIES patients and 3 matched controls were analyzed. (B) At day 7, AD-HIES sections contain larger areas of less mature GT that lacks collagen. Data are plotted as percentages of biopsy section area occupied by GT with no or low collagen (n = 3). See also Supplemental Figure 1, C and D. (C) AD-HIES fibroblasts generate less collagen at day 7 after injury. Representative Masson’s trichrome stain of GT (magnification of area labeled with asterisk in A). Scale bars: 50 μm. Collagen fibers show dark blue staining in the control, but weak to minimal staining in AD-HIES skin. (D) Decreased efficiency of new blood vessel formation in GT of AD-HIES. Representative images of staining for CD31 (a vascular endothelial cell marker) showed decreased vascularity and decreased endothelial cell staining in dermis. Scale bars: 1 mm. (E) Impaired vascularization and STAT3 signaling in GT of AD-HIES patients. Left: representative images of staining for CD31, STAT3, and p-STAT3. Scale bars: 50 μm. Locations of the images are indicated by asterisks in A. Right: Quantification of the images (see Methods for details) (n = 3). Decreased CD31 content indicates deficient angiogenesis during wound healing. While almost all cells in GT express STAT3 protein both in control and in AD-HIES, percentages of cells that express p-STAT3 are greatly reduced in AD-HIES. Data are represented as mean ± SEM. *P < 0.05; **P < 0.01, 2-tailed unpaired t test (B and E). See also Supplemental Figure 1. See Supplemental Table 1 for information about patient samples used. Characterization of STAT3 signaling in human primary skin fibroblast culture model. In order to better understand the mechanisms underlying the nonimmune abnormalities of AD-HIES, we isolated fibroblasts from skin biopsies of healthy volunteers and AD-HIES patients (Supplemental Table 1) and analyzed the changes that AD-HIES mutations introduced into cell signaling networks. We first confirmed intact STAT3 signaling and its responsiveness to IL-6 and TNF-α in our skin fibroblast cell culture model (Supplemental Figure 2). TNF-α overproduction by AD-HIES patient peripheral blood mononuclear cells, neutrophils, and dendritic cells upon stimulation by LPS and impaired antiinflammatory STAT3-mediated IL-10 signaling in response to Staphylococcus aureus and peptidoglycan have been previously shown (29–31). Additionally, previous studies identified an important role for the interaction between TNF-α and STAT3 signaling during the initial steps of establishing a proper inflammatory and immune response following tissue injury (32). Therefore, in addition to basal conditions, we used TNF-α to mimic the local environment to which fibroblasts would be exposed in the damaged tissues. Our analysis showed that control fibroblasts expressed phosphorylated STAT3 under basal conditions and that the phosphorylation was increased by its direct activator IL-6 and by TNF-α (Supplemental Figure 2A). The TNF-α–induced STAT3 phosphorylation was prevented by the IL-6R antagonist, indicating that the effect is mediated by an autocrine signaling loop through TNF-α–induced secretion of IL-6 (Supplemental Figure 2A). Indeed, measurement of IL-6 in cell culture medium confirmed that both control and AD-HIES skin fibroblasts increased IL-6 secretion in response to TNF-α (Supplemental Figure 2B). Following the verification of normal STAT3 signaling in the primary skin fibroblast culture model, we moved on to analyze the changes that AD-HIES mutations introduced in the STAT3 signaling networks. RNA-Seq identifies a deficiency in cell signaling related to wound healing, angiogenesis, and ECM remodeling in AD-HIES skin fibroblasts. To study signaling pathways that could be affected by STAT3 mutations in AD-HIES during wound healing and to identify promising therapeutic targets, we performed RNA-Seq and subsequent gene set enrichment analysis (GSEA) (33) (Pathway Studio, Elsevier) and pathway-enrichment analysis (Figure 2 and Supplemental Figure 3) using primary skin fibroblasts isolated from skin biopsies of patients with AD-HIES as well as from normal control volunteers (Supplemental Table 1). We compared global gene expression under basal conditions and after exposure to TNF-α. RNA-Seq analysis identified many genes differentially expressed in AD-HIES fibroblasts relative to in the control, both in basal conditions and after treatment with TNF-α (Figure 2A). Many transcriptional changes were similar to the changes identified in previous analyses of patient leukocytes (4, 29, 30, 34, 35), demonstrating overlaps in signaling pathways affected by AD-HIES STAT3 mutations in different cell types. Specifically, we found upregulation of many genes related to IFN signaling and host defense in skin fibroblasts from AD-HIES patients (Supplemental Table 2) and abnormal patterns of cytokine and chemokine expression (Supplemental Table 2). However, our analysis also identified additional pathways affected in AD-HIES skin fibroblasts that were consistent with AD-HIES nonimmune pathologies and seemed a promising target to investigate for a clinically impactful therapy for these pathologies. Thus, GSEA showed that multiple pathways related to wound healing, tissue development, and tissue remodeling were downregulated in AD-HIES skin fibroblasts, both in basal conditions and in the presence of TNF-α (Figure 2B). Targeted GSEA confirmed concordant decreased expression of genes related to both wound healing (Figure 2C) and the positive regulation of angiogenesis (Figure 2D). Further pathway analysis performed on genes that were differentially expressed in AD-HIES identified the ECM-remodeling pathway as the most affected (Supplemental Figure 3 and Supplemental Table 2). Decreased expression of several MMPs, ECM proteins, and growth factors that participate in ECM metabolism, tissue remodeling, and angiogenesis during wound healing (Supplemental Table 2 and refs. 36–38) is consistent with nonimmunological abnormalities of AD-HIES patients, such as reduced ability to repair damaged lungs after infection, connective tissue abnormalities, vascular abnormalities (7–11, 13, 14), and impaired skin-wound healing (Figure 1 and Supplemental Figure 1). The relevance of the identified signaling changes to AD-HIES patients’ nonimmunological features is supported by a number of hereditary connective tissue disorders with overlapping clinical presentations that are caused by mutations in ECM proteins regulated by the affected MMPs (Supplemental Figure 3, Supplemental Table 2, and refs. 39, 40). Thus, patients with Ehlers-Danlos syndromes, caused by mutations in collagens, present with joint hyperextensibility, facial dysmorphism, frequent fractures, aneurysms, and impaired wound healing that resemble some of the AD-HIES nonimmunological abnormalities (39, 41, 42). Figure 2 Deficiency in cell signaling related to wound healing, angiogenesis, and ECM remodeling in AD-HIES skin fibroblasts. Cultured skin fibroblasts generated from 3 AD-HIES patients and 3 normal volunteers were treated with or without TNF-α for 8 hours, and mRNA expression profiles were analyzed by RNA-Seq. (A) Overview of the differences in mRNA expression in AD-HIES and control (CT) skin fibroblasts. Expression data are plotted in the form of a volcano plot that plots fold difference versus P value of the difference for each expressed gene (n = 3). (B–D) Biological processes and pathways related to wound healing, including tissue remodeling, angiogenesis, and growth factor signaling, are downregulated in AD-HIES skin fibroblasts. (B) Biological processes that were identified by GSEA as significantly downregulated in AD-HIES skin fibroblasts. For each gene set, name of biological process is shown on the left with number of genes included in the set. Bars on the right plot P values for the gene set enrichment representing the degree of confidence for concordant decrease of expression of the genes in the set. Analysis was performed with Pathway Studio software. (C) Top: enrichment plot for the wound-healing gene signature (Gene Ontology [GO] 0042060) in AD-HIES compared with WT. Bottom: visualization of the expression of the signature genes. (D). Top: enrichment plot for the positive regulation of angiogenesis gene signature (GO 0045766) in AD-HIES compared with control. Bottom: visualization of the expression of the signature genes. GSEA for C and D was performed with Broad Institute software. See also Supplemental Figure 3 and Supplemental Table 2. See Supplemental Table 1 for information about patient samples used in these experiments. Normal signaling related to wound healing and angiogenesis in AD-HIES HUVECs. Endothelial cells are executers of angiogenesis in the wound-healing process that form new blood vessels in response to growth factors, cytokines, and ECM proteins released by immune cells and fibroblasts (43). Therefore, the attenuated vascularization of granulation tissue that we observed during skin-wound healing (Figure 1 and Supplemental Figure 1) could be caused by both deficient support with ECM proteins and proangiogenic factors released by immune cells and fibroblasts as well as by intrinsic deficiencies in the angiogenic responses of endothelial cells, which are themselves elicited by AD-HIES STAT3 mutations. Therefore, we next performed RNA-Seq of pathways dysregulated in HUVECs isolated from umbilical cords of healthy babies and babies born with AD-HIES STAT3 dominant negative mutations (Supplemental Figure 4). GSEA demonstrated that, as in skin fibroblasts (Supplemental Table 2) and immune cells (3, 4), AD-HIES HUVECs have increased expression of genes related to IFN signaling (Supplemental Figure 4, C and D). However, unlike fibroblasts, HUVECs did not show deficiencies in pathways related to wound healing and angiogenesis and even demonstrated significant upregulation of these pathways (Supplemental Figure 4, B and C). Consistently, AD-HIES HUVECs performed similarly to control HUVECs in an endothelial cell tube formation assay performed in medium fully supplemented with proangiogenic growth factors, suggesting preserved intrinsic angiogenic potential (Supplemental Figure 4E). The responses identified in these experiments analyzing HUVECs with AD-HIES STAT3 mutations are similar to previous findings from endothelial-specific Stat3-knockout mice showing exaggerated inflammatory response and normal performance in an endothelial cell tube formation assay (44). Therefore, we proceeded with more detailed studies of deficiencies that AD-HIES fibroblasts display in paracrine support of ECM remodeling and angiogenesis during repair of tissue damages. Confirmation of STAT3 dependence of changes detected by RNA-Seq in AD-HIES skin fibroblasts. By targeted quantitative PCR (qPCR), we confirmed reduced expression of MMP1, MMP3, MMP9, and VEGFR2 mRNAs in AD-HIES fibroblasts (Supplemental Figure 5A). We also confirmed that this deficiency is STAT3 dependent; it could be rescued by expressing WT STAT3 in the AD-HIES fibroblasts (Supplemental Figure 5B) and reproduced by shRNA-mediated knockdown of STAT3 in control fibroblasts (Supplemental Figure 5C). MMP1, MMP3, and MMP9 genes are direct targets of STAT3 (45). ChIP assay demonstrated that the binding efficiency of STAT3 to promoters of these genes is diminished in AD-HIES fibroblasts (Supplemental Figure 5D), confirming that their reduced expression in AD-HIES fibroblasts is STAT3 dependent. Decreased ability of AD-HIES skin fibroblasts to support angiogenesis in cell culture models. Following the identification via RNA-Seq of a global decrease in the gene expression of processes related to tissue remodeling and angiogenesis, we aimed to verify these findings functionally. We demonstrated, via RNA-Seq and qPCR, decreased mRNA expression of several MMPs (Supplemental Figure 3, Supplemental Figure 5A, and Supplemental Table 2) and major angiogenesis-related growth factors (FGF-2, PLGF, and VEGFA) in AD-HIES skin fibroblasts (Supplemental Table 2 and Figure 3A). This corresponded to decreased secretion of these MMPs and several growth factors by the fibroblasts into surrounding cell culture media (Figure 3B). Correspondingly, cell culture medium collected from AD-HIES fibroblasts had a reduced ability to support angiogenesis in the endothelial cell tube formation assay (Figure 3C). Figure 3 Decreased ability of AD-HIES skin fibroblasts to support angiogenesis in cell culture and mouse models. (A) AD-HIES skin fibroblasts (SFs) have decreased mRNA expression of angiogenic factors (n = 5). (B) AD-HIES skin fibroblasts secrete fewer angiogenic factors (n = 3–9). (C) Cell culture medium collected from AD-HIES fibroblasts has reduced ability to support angiogenesis in endothelial cell tube formation assay. HUVECs were cultured in culture medium collected from control and AD-HIES SFs. Left: representative images. Scale bars: 100 μm. Right: quantification of tubule structures (n = 8). (D) AD-HIES SFs fail to promote growth and vessel formation of AD-HIES iPSC–derived teratomas. iPSCs generated from 3 control and 3 AD-HIES SFs lines were injected alone or as mixture with SFs into hind limbs of NSG mice. In 8 weeks, teratoma weights (n = 10–18) and percentages of CD31+ cells (n = 7–11) were analyzed. See also Supplemental Figures 6 and 7. (E–G) AD-HIES fibroblasts fail to support restoration of blood perfusion after femoral artery ligation in NSG immunodeficient mice. HLI was induced by ligation of the femoral artery. Control, AD-HIES fibroblasts, or PBS was injected into calf muscle of ligated hind limb 1 day after surgery. (E and F) Estimation of blood flow by laser Doppler imaging. (E) Representative Laser Doppler images. (F) Quantification (n = 5–6). (G) Estimation of capillary density. Left: representative images of immunostaining with anti-CD31. Scale bars: 50 μm. Right: quantification (n = 3). Blood flow and capillary density are increased after injection of control fibroblasts but not after injection of AD-HIES fibroblasts or PBS. Data are represented as mean ± SEM. *P < 0.05; **P < 0.01; ***P < 0.001, Mann-Whitney rank sum test (A); 2-tailed unpaired t test (B); 1-way ANOVA followed by Holm-Šidák multiple comparisons test (C, D, and G); Kruskal-Wallis test followed by Dunn’s multiple comparisons test (F). See Supplemental Table 1 for information about patient samples used. Decreased ability of AD-HIES skin fibroblasts to support angiogenesis in iPSC-derived teratoma model. We next tested the proangiogenic potential of AD-HIES fibroblasts by studying their ability to promote the growth of teratomas derived from iPSCs after subcutaneous injection into NOD/SCID-γ (NSG) immunodeficient mice (46). For these experiments, we used iPSCs generated from our control and AD-HIES skin fibroblast cell lines (47). Surprisingly, compared with teratomas derived from control iPSCs, teratomas derived from AD-HIES iPSCs were small and avascular, suggesting a deficiency in blood vessel formation, thus providing us a model for investigating angiogenic capacities of human cells (fibroblasts) transplanted into human tissue (teratoma) (Figure 3D and Supplemental Figure 6A). Despite being very small, AD-HIES iPSC–derived teratomas contained structures representing all 3 lineages, indicating similar differentiation potential (Supplemental Figure 6B). Indeed, mixing of AD-HIES iPSCs with normal skin fibroblasts resulted in restoration of the teratoma growth rate (Figure 3D and Supplemental Figure 6C), accompanied by more efficient blood vessel formation, evidenced from increased proportion of CD31+ cells (Figure 3D and Supplemental Figure 7). However, AD-HIES skin fibroblasts failed to provide such support for teratoma growth (Figure 3D, Supplemental Figure 6C, and Supplemental Figure 7), consistent with the decreased ability of AD-HIES fibroblasts to secrete proangiogenic factors. Decreased ability of AD-HIES skin fibroblasts to support angiogenesis in mouse hind-limb ischemia model. To further investigate the ability of AD-HIES fibroblasts to support angiogenesis in the setting of tissue damage and remodeling, we used the murine model of hind-limb ischemia (HLI). In this model, surgical ligation of the femoral artery stops blood supply to the hind limb and stimulates angiogenesis in the calf muscles, leading to increased capillary density (48, 49). We tested the ability of AD-HIES fibroblasts to facilitate recapillarization after femoral artery ligation in NSG mice. At baseline, NSG immunodeficient mice have decreased recapillarization ability and require additional support with proangiogenic factors to be able to restore blood perfusion after femoral artery ligation (50). Injection of control fibroblasts into the calf muscle after femoral artery ligation stimulated angiogenesis, leading to restoration of blood perfusion (Figure 3, E and F) due to increased capillary density (Figure 3G). However, injection of AD-HIES skin fibroblasts failed to increase capillary density (Figure 3G) and did not restore blood perfusion (Figure 3, E and F). These results indicate that AD-HIES fibroblasts were not able to provide proangiogenic factors that were missing in immunodeficient mice due to lack of normal immune response initiated by injury, while normal skin fibroblasts were able to compensate for this deficiency by secreting necessary proangiogenic factors (Figure 3, E–G). HIF-1α–signaling deficiency in AD-HIES fibroblasts predicted by RNA-Seq. After confirmation of the RNA-Seq–predicted angiogenesis deficiency at a functional level, we sought to identify specific STAT3-dependent signaling targets that mediate such dysregulation. Among the biological processes that we identified by GSEA as significantly downregulated in AD-HIES skin fibroblasts was response to hypoxia (Figure 2B). HIF-1α, a master regulator of the hypoxic response (51–53), is also implicated in the regulation of a wide range of conditions characterized by ischemia and inflammation, including wound healing and tissue remodeling (54, 55). Indeed, GSEA showed a concordant decrease in mRNA expression of HIF-1α transcriptional targets in AD-HIES fibroblasts both in basal conditions and after stimulation with TNF-α (Supplemental Figure 8A, Figure 4A, and Supplemental Table 2), indicative of a STAT3-dependent decrease of HIF-1α transcriptional activity in AD-HIES skin fibroblasts. Indeed, Western blot analysis showed that the HIF-1α protein level was increased in response to TNF-α in control but not in AD-HIES fibroblasts (Figure 4B), paralleled by increased transcriptional activity in control fibroblasts but not in AD-HIES fibroblasts (Supplemental Figure 8B). At the same time, response to hypoxia was largely preserved: the HIF-1α protein level in the AD-HIES fibroblasts increased in response to hypoxia to the same degree as that of the control fibroblasts (Figure 4C) and transcriptional activity was also increased, but to slightly lower levels than in control fibroblasts (Supplemental Figure 8B). Figure 4 Deficient HIF-1α signaling in AD-HIES SFs at transcriptional and protein stabilization levels. (A) RNA-Seq pathway map showing decreased expression of many HIF-1α transcriptional targets in AD-HIES fibroblasts (P = 5.3E-12; FDR = 4.2E-9; GeneGo Metacore software). See Supplemental Table 2 for expression changes. (B) AD-HIES fibroblasts are deficient in ability to stabilize HIF-1α protein in response to cytokines. Cells were treated with TNF-α and IL-6 for 8 hours. Representative Western blot (upper panel) and quantification by densitometry (lower panel) are shown (n = 8). (C) AD-HIES SFs stabilize HIF-1α under hypoxic conditions (1% O2 for 8 hours). Representative Western blot and quantification (n = 3). (D) TNF-α increases STAT3 binding to promoter of HIF1α gene in control SFs but not in AD-HIES (ChIP; see Supplemental Figure 9 and Supplemental Table 3). Data are plotted as fold increase of STAT3 binding after treatment with TNF-α (see Methods) (n = 3). (E) HIF-1α mRNA levels were decreased in AD-HIES fibroblasts. (n = 6). (F–H) TNF-α decreased degradation rate of HIF-1α in control fibroblasts, but not in AD-HIES, indicating STAT3-dependent stabilization of HIF-1α and that this stabilization is STAT3 dependent. To measure rate of HIF-1α protein degradation, de novo protein synthesis was inhibited with cycloheximide (CHX). (F) Experimental design for estimation of HIF-1α stability. To increase level of HIF-1α, cells were treated with PHD inhibitor dimethyloxalylglycine (DMOG) that was washed out before addition of CHX. (G) Representative Western blot images showing dynamics of HIF-1α decrease after addition of CHX. (H) Quantification of Western blots (n = 3; asterisks, relative to control; pound signs, relative to 0 time). See also Supplemental Figure 8D. Data are represented as mean ± SEM. *,#P < 0.05; **P < 0.01; ***P < 0.001, 2-tailed unpaired t test (B, D, E, and H); 1-way ANOVA followed by Holm-Šidák multiple comparisons test (C). See Supplemental Table 1 for information about patient samples used. STAT3-dependent decrease in HIF-1α transcription in AD-HIES skin fibroblasts. We explored 2 possible mechanisms for the decreased expression level of HIF-1α protein in AD-HIES: decreased transcription and increased rate of degradation. Such mechanisms and possible STAT3 involvement have been demonstrated in a number of previous studies (56–58). The promoter of the HIF1α gene contains several STAT3-binding sites (Supplemental Figure 9) and binding of STAT3 to the HIF1α promoter has been demonstrated both in cancer cells (57) and mouse T cells (56). Our analysis showed that STAT3 binds to the HIF1α promoter in normal skin fibroblasts, but that binding is impaired in AD-HIES (Figure 4D). Consistently, a smaller amount of HIF-1α mRNA is present in AD-HIES fibroblasts (Figure 4E). Analysis of HIF-2α mRNA expression, the functions of which substantially overlap with those of HIF-1α (59), demonstrated that HIF-2α was expressed at lower levels compared with HIF-1α mRNA, was not differently expressed in control and AD-HIES cells, and was not affected by TNF-α (Figure 4E), suggesting that it is less likely to be a main contributor to AD-HIES phenotypes. To confirm the STAT3 dependence of reduced expression of HIF-1α, we performed knockdown and overexpression experiments. Consistent with the STAT3 dependency, siRNA-mediated knockdown of STAT3 in control fibroblasts decreased HIF-1α mRNA and protein levels (Supplemental Figure 10, A–C), while expression of WT STAT3 in the AD-HIES fibroblasts elevated HIF-1α mRNA and protein levels (Supplemental Figure 10, D–F). In addition, HIF-1α mRNA knockdown in control fibroblasts decreases MMPs and KDR mRNA (Supplemental Figure 8C). Similar results were seen with mRNA knockdown of STAT3 (Supplemental Figure 5C). Taken together, these results indicate that both STAT3 and HIF-1α regulate transcription of relevant genes. These results demonstrate that STAT3-dependent deficiency in the regulation of HIF-1α transcription in AD-HIES is a contributing mechanism to the decrease in target genes (Figure 4A, Supplemental Figure 8A, and Supplemental Table 2). STAT3-dependent decrease in HIF-1α protein stability in AD-HIES skin fibroblasts. Another possible mechanism for increase of HIF-1α protein level is one that operates in response to hypoxia through its stabilization due to decreased activity of prolyl hydroxylases (PHDs) that hydroxylate HIF-1α protein and target it for von-Hippel Lindau–dependent (VHL-dependent) ubiquitination and degradation (52). Therefore, in the next series of experiments, we determined whether AD-HIES mutations affected HIF-1α protein stability. Our measurements of HIF-1α protein degradation rates demonstrated that TNF-α stabilizes HIF-1α protein in normoxic conditions in control fibroblasts, but fails to do so in AD-HIES fibroblasts (Supplemental Figure 8D and Figure 4, F–H). Similar deficiency in stabilization of HIF-1α protein in response to TNF-α occurs when the level of STAT3 is decreased by siRNA in control fibroblasts, confirming that stabilization is STAT3 dependent (Supplemental Figure 10G). These results indicate that HIF-1α destabilization in AD-HIES contributes to deficiencies in its signaling network in response to TNF-α. Mechanistic analysis demonstrated that deficient HIF-1α signaling in AD-HIES skin fibroblasts is caused by dysregulation of its expression on both transcriptional and protein stability levels. Decreased HIF-1α expression during skin-wound healing and in coronary arteries of AD-HIES patients. Having found deficient HIF-1α signaling in cultured AD-HIES skin fibroblasts, we aimed to verify whether these findings can be confirmed in AD-HIES patients in vivo. Immunohistochemical analysis demonstrated decreased HIF-1α protein expression in granulation tissue of AD-HIES skin wounds (Figure 5A) and in coronary arteries from AD-HIES patients (Figure 5B). Consistent with RNA-Seq and qPCR results in fibroblasts, we found decreased expression of MMP1 and MMP3 mRNAs in AD-HIES coronary arteries (Figure 5C and Supplemental Figure 11B). Figure 5 Analysis of HIF-1α expression, vascularization, and ECM composition in skin wounds and coronary arteries of AD-HIES patients. (A) Decreased HIF-1α expression in granulation tissue during skin-wound healing of AD-HIES patients. Immunostaining of skin biopsy sections 7 days after initial biopsy. See Figure 1 for experiment details. Left: representative images. Scale bars: 50 μm. Right: quantification (see Methods) (n = 3). (B) Decreased HIF-1α expression in coronary arteries of AD-HIES patients. Immunostaining for HIF-1α protein. Scale bars: 500 μm. (C) Decreased levels of MMP1 and MMP3 mRNA in AD-HIES coronary arteries (in situ hybridization RNAscope assay). Top: representative images. Bottom: Quantification of MMP1 (n = 6 [control], n = 4 [AD-HIES]), and MMP3 (n = 9 [control], n = 5 [AD-HIES]) mRNA expression. Scale bars: 10 μm. See Supplemental Figure 11B for more images. (D) Decreased vasa vasorum perfusion in CA in adventitia. Left: representative images of CA sections stained for CD31 to identify vasa vasorum (black arrows). Scale bars: 100 μm. Right: image quantification: number of vasa vasorum vessels per mm2 of adventitia and blood perfusion presented as percentages of adventitia area occupied by vasa vasorum (n = 10 [control], n = 5 [AD-HIES]). (E) Increased elastic fibers (black) in adventitia of AD-HIES arteries. (F) Analysis of individual components of ECM by immunostaining with antibodies for elastin, collagen I, collagen IV, and laminin. Bottom: representative images of stainings. Top: quantification. Intensity of DAB staining is measured in the intima, media, and adventitia. Results presented relative to the average intensity in sections from control coronary arteries (n = 3–8). Scale bars: 100 μm. See also Methods and Supplemental Figure 11A for details of analysis. Data are represented as mean ± SEM. *P < 0.05; **P < 0.01; ***P < 0.001, 2-tailed unpaired t test. See Supplemental Table 1 for information about patient samples. Decreased blood perfusion by the vasa vasorum in the coronary artery walls of AD-HIES patients. To find out whether vascular structural abnormalities could be promoted by deficient angiogenesis, we analyzed the angiogenic response and perfusion of AD-HIES coronary arteries through the analysis of the vasa vasorum, a vascular network located in the adventitia that supplies oxygen and nutrients to larger arteries (diameter > 0.5 mm). Both the formation of the vasa vasorum during normal arterial growth and expansion of the vasa vasorum during pathological arterial wall remodeling are driven by local secretion of proangiogenic factors by medial smooth muscle cells (SMCs) and adventitial fibroblasts in response to hypoxia and inflammation (60). Vasa vasorum density as well as overall blood perfusion was reduced in AD-HIES coronary arteries as compared with control coronary arteries (Figure 5D), consistent with deficient angiogenesis. Altered ECM composition in the coronary artery walls of AD-HIES patients. Arterial tortuosity, dilatation, and aneurysms in patients with AD-HIES are not accompanied by inflammation or calcification. In addition, the response to atherosclerosis is abnormal (13, 14, 61), suggesting intrinsic ECM abnormalities as a likely etiology. Unlike in the skin-wound–healing process, in which fibroblasts play a major role in ECM remodeling, arterial wall ECM’s master regulators are SMCs. We hypothesized that the dysregulation of ECM remodeling and angiogenesis-related gene networks seen in AD-HIES fibroblasts (Figure 2 and Supplemental Figure 3) could be similar in SMCs and translate to altered ECM composition and mechanical properties of the arterial walls in AD-HIES patients. Indeed, immunohistochemical analysis of coronary arteries from AD-HIES patients showed an abnormal composition of major ECM components in the arterial wall (Figure 5, E and F, Supplemental Figure 11A, and ref. 62). Specifically, AD-HIES coronary arteries contained more collagen I and elastin in the adventitia, more collagen I and collagen IV in the intima, and fewer laminins in all layers of the arterial wall (Figure 5, E and F). Correlation analysis revealed strong associations between the abundance of elastin and the perfusion of the coronary artery wall (R = –0.82, P = 0.003), with clear separation of control and AD-HIES coronary artery (CA) walls on the correlation curve (Supplemental Figure 11C), suggesting existence of coordinated interdependent regulation of these structural components of the vessel walls in a STAT3-dependent manner. In summation, the changes in ECM composition and blood perfusion of the arterial walls mediated by STAT3-dependent signaling in medial SMCs and adventitial fibroblasts could be an underlying cause of the arterial tortuosity and aneurysms observed clinically in AD-HIES patients. Pharmacological stabilization of HIF-1α restores ability of AD-HIES skin fibroblasts to support angiogenesis in cell culture. Verification of decreased HIF-1α protein expression in AD-HIES patients in vivo during wound healing (Figure 5A) and in their coronary arteries (Figure 5B) suggested that pharmacological stabilization of HIF-1α could correct AD-HIES–related abnormalities. The degradation of HIF-1α protein, which occurs under normoxic conditions, is mediated by PHDs (63, 64). We used 2 inhibitors of PHDs, dimethyl fumarate (DMF) and daprodustat (26, 55), to stabilize expression of HIF-1α protein and to test the effect of HIF-1α signaling restoration on angiogenesis in AD-HIES. Treatment of AD-HIES fibroblasts with both daprodustat and DMF stabilized HIF-1α protein under normal cell culture conditions and hypoxia as well as in the presence of TNF-α (Figure 6, A and B). Stabilization of HIF-1α by DMF increased its transcriptional activity in a hypoxia response element (HRE) luciferase assay (Figure 6C). Both DMF and daprodustat were able to increase mRNA levels (Figure 6D) and secretion of proangiogenic factors (VEGF-A and FGF-2) in cell culture medium (Figure 6E). Consistently, cell culture media collected from AD-HIES fibroblasts after treatment with DMF acquired an ability that it otherwise lacked (Figure 3C) to support angiogenesis in an endothelial cell tube formation assay (Figure 6F). Increased VEGFA secretion by AD-HIES fibroblasts was a major contributor to such improvement, given that the neutralization of VEGFA by addition of the anti-VEGF monoclonal antibody bevacizumab prevented the beneficial effect of the DMF treatment (Figure 6F). Figure 6 Pharmacological stabilization of HIF-1α protein increases expression of proangiogenic factors and restores the ability of AD-HIES fibroblasts to support angiogenesis. To stabilize HIF-1α, cells were treated with 2 PHD inhibitors: DMF and daprodustat (DD). (A and B) DMF and DD stabilize HIF-1α under regular cell culture conditions, under hypoxia, and in the presence of TNF-α in AD-HIES fibroblasts. (A) Representative Western blot images. (B) Quantification (n = 3–4). (C) DMF increases HIF-1α transcriptional activity in both control and AD-HIES fibroblasts. Luciferase reporter assay with construct containing HRE was performed under basal conditions (n = 8). (D) DMF and DD increase mRNA levels of proangiogenic factors (n = 4–9). (E) DMF and DD increase secretion of proangiogenic factors by AD-HIES fibroblasts (15-hour treatment, n = 11). (F) DMF improves ability of cell culture medium collected from AD-HIES fibroblasts to support angiogenesis in an endothelial cell tube formation assay with VEGFA being a major contributor. To neutralize VEGFA, the cell culture medium was supplemented with bevacizumab (see Methods). Top: representative images of HUVECs taken 9 hours after seeding on Matrigel. Scale bars: 200 μm. Bottom: Quantification of different features of tubule structures (n = 7). Data are represented as mean ± SEM. *P < 0.05; **P < 0.01; ***P < 0.001, 1-way ANOVA followed by Holm-Šidák multiple comparisons test (B and F), 2-tailed unpaired t test in (C), Kruskal-Wallis test followed by Dunn’s multiple comparisons test (D and E). See Supplemental Table 1 for information about patient samples used. Vascular structural abnormalities and deficient angiogenesis and wound healing in an AD-HIES mouse model. Having found that HIF-1α stabilization is able to improve the proangiogenic properties of AD-HIES human skin fibroblasts in culture, we then tested the ability of HIF-1α stabilizers to correct angiogenesis and wound-healing deficiencies in the AD-HIES mouse model. The mouse model of AD-HIES that expresses a dominant negative mutation in STAT3 recapitulates multiple aspects of AD-HIES immunological features, including elevated serum IgE and the failure to generate Th17 cells (65). Nonimmunological features of AD-HIES have not been accessed in this model before. Casting of the coronary arterial network in the AD-HIES mice identified structural abnormalities in the coronary arteries that resemble vascular abnormalities seen in AD-HIES patients, such as increased tortuosity and abnormal branching (Figure 7, A–C, Supplemental Figure 12, A and B, and Supplemental Videos 1 and 2). Consistent with the AD-HIES angiogenesis defects identified in human fibroblasts, these mice have a diminished ability to activate recapillarization and restore blood perfusion after ligation of the femoral artery when compared with WT mice (Figure 7, D and E). Similarly to deficient skin-wound healing in AD-HIES patients (Figure 1 and Supplemental Figure 1), healing in the mouse model was also delayed (Figure 7, H and I, and Supplemental Figure 12, C–E). Figure 7 HIF-1α stabilizers improve angiogenesis and wound healing in AD-HIES mouse model. (A–C) Structural abnormalities of AD-HIES mouse CAs resemble AD-HIES patients. (A) Left: representative images of the hearts. Left CAs (LCAs) filled with silicon are seen. Right: representative images of CA 3D reconstruction. (B) Increased LCA tortuosity (n = 4). (C) Examples of abnormalities in secondary branches. (D and E) Angiogenesis abnormalities in AD-HIES mice: mice failed to restore blood perfusion after ligation of the femoral artery (FA). (D) Quantification by Doppler imaging (WT, n = 3; AD-HIES, n = 5). (E) Left: Representative images of CD31 staining. Scale bars: 50 µm. Right: quantification of capillary density (n = 3). (F–M) Stabilization of HIF-1α by PHD inhibitors improves angiogenesis and wound healing. Treatment with DMF by gavage: (F) improved recapillarization after FA ligation (left: representative images of CD31 staining, original magnification, ×100; right: quantification of capillary densities, n = 5) and (G) restored growth of teratomas from AD-HIES–derived iPSCs (n = 6). (H–M) Topical treatment with DMF and daprodustat (DD) improved deficient skin-wound healing. (H) Representative images. (I) Quantification of wound closure rates. (n = 8 for no-treatment groups; n = 4 for DMF and DD groups). Slower wound closure in AD-HIES mice was accelerated by DMF and DD. (J–M) Histological analysis of the wounds demonstrating (J) deficient reepithelialization and fibroblast infiltration, (K) increased STAT3 phosphorylation, and (L and M) increased HIF-1α expression by DMF treatment. Representative images and quantification of HIF-1α stainings are shown (n = 4). Data are represented as mean ± SEM. *P < 0.05; **P < 0.01; ***P < 0.001, 2-tailed unpaired t test (B, D, I, and M), 1-way ANOVA followed by Holm-Šidák multiple comparisons test (E–G). See also Supplemental Figure 12 and Supplemental Videos 1 and 2. HIF-1α stabilizers improve angiogenesis and wound healing in an AD-HIES mouse model. We then tested the ability of HIF-1α stabilizers to improve angiogenesis-related deficiencies in AD-HIES mice. Treatment by daily gavage with DMF improved recapillarization after ligation of the femoral artery in the AD-HIES mice (Figure 7F) and restored growth of teratomas from AD-HIES–derived iPSCs in NSG mice (Figure 7G). To study skin-wound healing in mice, we used a splinted wound-healing model (66, 67). Wound splinting minimizes skin contraction (a main mode of wound healing in mice) and stimulates healing through epithelialization and granulation tissue formation, which resembles the human skin-wound–healing process (Figure 7H and Supplemental Figure 12, C–E). We used 2 HIF-1α stabilizers, DMF and daprodustat, to decrease the possibility that off-target drugs effects would be the main contributors for observed changes. Topical treatment of wounds with both DMF and daprodustat accelerated wound closure in AD-HIES mice (Figure 7, H–J). Immunohistochemical analysis demonstrated tissue-wide phosphorylation of Stat3 in the wound area, but not in undamaged skin (Figure 7K), verifying the importance of Stat3-dependent signaling in the wound-healing process. Effectiveness of topical treatment with DMF for increasing the HIF-1α level in granulation tissue was verified by immunostaining (Figure 7, L and M). HIF-1α stabilizers improve TH17 differentiation. The ability of HIF-1α stabilization to normalize the STAT3 dominant negative phenotype was not limited to angiogenesis. DMF also improved the differentiation of naive STAT3LOF CD4+ T cells isolated from AD-HIES patients into Th17 cells, a process that is affected by HIF-1α activity (56) and is otherwise highly impaired in AD-HIES, potentially underlying AD-HIES patients’ susceptibility to Candida and staphylococcal infections (ref. 68 and Supplemental Figure 13).
|
|
Scooped by
Gilbert C FAURE
November 27, 2019 6:20 AM
|
Exciting new discoveries have transformed the view of the lysosome from a static organelle dedicated to the disposal and recycling of cellular waste to a highly dynamic structure that mediates the adaptation of cell metabolism to environmental cues. Lysosome-mediated signalling pathways and transcription programmes are able to sense the status of cellular metabolism and control the switch between anabolism and catabolism by regulating lysosomal biogenesis and autophagy. The lysosome also extensively communicates with other cellular structures by exchanging content and information and by establishing membrane contact sites. It is now clear that lysosome positioning is a dynamically regulated process and a crucial determinant of lysosomal function. Finally, growing evidence indicates that the role of lysosomal dysfunction in human diseases goes beyond rare inherited diseases, such as lysosomal storage disorders, to include common neurodegenerative and metabolic diseases, as well as cancer. Together, these discoveries highlight the lysosome as a regulatory hub for cellular and organismal homeostasis, and an attractive therapeutic target for a broad variety of disease conditions. Lysosomes are mainly associated with cellular waste disposal. But it has recently been discovered that by integrating various environmental cues, they have a broader role as regulatory hubs for cellular and organismal homeostasis. The modulation of lysosome function could thus be a promising therapeutic strategy for the treatment of cancer as well as metabolic and neurodegenerative disorders.
|
|
Scooped by
Gilbert C FAURE
November 11, 2019 11:28 AM
|
Subjects Download PDF In a recent study published in Cell Research, Dr. Xu Song’s group reported the potent antibacterial activity of three coagulation factors (VII, IX, and X) against gram-negative bacteria and hence discovered a novel class of endogenous host antimicrobial proteins.1 At present, antimicrobial resistance (AMR) poses significant challenges for clinical care and seriously threatens human health.2,3 Among the clinical pathogens, gram-negative bacteria are particularly problematic in terms of drug resistance because their lipopolysaccharide (LPS)-rich outer membrane reduces cellular permeability and acts as a target for antibacterial resistance development.4 Gram-negative bacterial infections have attracted worldwide concern in recent years, and new antibacterial drugs and novel therapeutic strategies that can address this healthcare issue are urgently needed. Although many efforts have been made to develop novel antimicrobial agents, some endogenous host proteins with innate antibacterial activity may have been underappreciated. The coagulation factors VII, IX, and X are initiators of the clotting process; however, patients deficient in these factors were found to have bacterial infectious diseases (sepsis and pneumonia, for example) in addition to blood-clotting disorders.5 This finding leads to the assumption that the coagulation factors VII, IX, and X may have antibacterial function. Research conducted by Song et al. showed that the coagulation factors VII, IX, and X possess antimicrobial activity against gram-negative bacteria, even extensively drug-resistant (XDR) pathogens, such as Pseudomonas aeruginosa and Acinetobacter baumannii.1 Both pathogens were recently listed among the 12 bacteria that pose the greatest threat to human health because of their antibiotic resistance by the World Health Organization.6 The coagulation factors VII, IX, and X are composed of two separate domains, i.e., a heavy chain (HC) and a light chain (LC). Their well-known role in the initiation of blood clotting is associated with the HC, which possesses serine protease activity.7 However, their antimicrobial activity revealed in this study is attributed to the LC. Using factor IX and its LC as an example, this study suggested that while serine protease activity of the factors is thermostable, their antibacterial activity is sensitive to heat treatment. Heat treatment is a major process for viral inactivation in manufacturing plasma-derived coagulation factor products,8 which may explain why the antibacterial activity was not observed for the widely used plasma-derived factors VII, IX, and X in patients with bleeding disorders. Examining the antibacterial mechanism further, the authors demonstrated that, unlike current antimicrobial agents that aim at cellular metabolism or the cytoplasmic membrane,3,9 the LC of the coagulation factors functions by hydrolyzing LPS in the bacterial outer membrane, leading to thorough damage of the bacterial morphology (Fig. 1). This unique mechanism renders bacteria less likely to develop resistance to the coagulation factors, and as LPS is present in almost all gram-negative bacteria, these factors should have general efficacy against gram-negative isolates, including XDR pathogens.10 Moreover, considering their origin from humans, these factors should have almost no toxicity toward mammalian cells. Sepsis is a major reason for morbidity and mortality in bacterial infections, which is characterized by excessive and uncontrolled immune and coagulation responses, with LPS serving as a critical factor in the pathogenesis of gram-negative bacterial sepsis. Sensing of LPS by innate immune cells is vital for host defense against gram-negative bacteria, and dysregulation of the innate immune system (as seen in severe sepsis) will cause dramatic consequences for the infected host. No antimicrobial agents have been found to act by hydrolyzing LPS. Therefore, LPS hydrolysis triggered by the coagulation factors VII, IX, and X represents a new and promising strategy for antisepsis therapy. The coagulation factors VII, IX, and X should have certain levels of antibacterial efficacy under physiological conditions, and in the case of injury, their recruitment to wounds will cause increased local concentrations and elevated antibacterial activities. Clotting disorders are associated with many diseases, such as stroke, and factors VII, IX, and X may act in the pathogenesis of these diseases by their functions in both blood clotting and anti-infection when massive bacterial infection occurs. Thus, a proper local concentration of these factors is critical for creating a balance between their positive and side effects. Traditional antibacterial agents include antibiotics produced by microorganisms and semisynthetic derivatives or de novo-synthesized compounds. The seminal work of Song et al. identified a novel class of endogenous host antimicrobial proteins, the coagulation factors, which have broad prospects in clinical application and will also expand our knowledge of implying the coagulation system to host defense. However, there are still questions to be further explored, and these important results will stimulate researchers from different laboratories to produce exciting discoveries over the next few years. References 1. Chen, J. et al. Coagulation factors VII, IX, and X are antibacterial proteins against drug-resistant Gram-negative bacteria. Cell Res. https://doi.org/10.1038/s41422-019-0202-3 (2019). CAS Article Google Scholar 2. Marston, H. D. et al. Antimicrobial resistance. JAMA 316, 1193–1204 (2016). CAS Article Google Scholar 3. Brown, E. D. & Wright, G. D. Antibacterial drug discovery in the resistance era. Nature 529, 336–343 (2016). CAS Article Google Scholar 4. Gruenheid, S. & Le Moual, H. Resistance to antimicrobial peptides in Gram-negative bacteria. FEMS Microbiol. Lett. 330, 81–89 (2012). CAS Article Google Scholar 5. Girolami, A. et al. Acquired isolated FVII deficiency: an underestimated and potentially important laboratory finding. Clin. Appl. Thromb. Hemost. 22, 705–711 (2016). CAS Article Google Scholar 6. Tacconelli, E. et al. Discovery, research, and development of new antibiotics: the WHO priority list of antibiotic-resistant bacteria and tuberculosis. Lancet Infect. Dis. 18, 318–327 (2018). Article Google Scholar 7. Zhong, D. et al. The N-terminal epidermal growth factor-like domain in factor IX and factor X represents an important recognition motif for binding to tissue factor. J. Biol. Chem. 277, 3622–3631 (2002). CAS Article Google Scholar 8. Franchini, M. et al. Treatment of hemophilia B: focus on recombinant factor IX. Biologics 7, 33–38 (2013). 9. Maffioli, S. I. et al. Antibacterial nucleoside-analog inhibitor of bacterial RNA polymerase. Cell 169, 1240–1248 (2017). CAS Article Google Scholar 10. Raetz, C. R. Biochemistry of endotoxins. Annu. Rev. Biochem. 59, 129–170 (1990). CAS Article Google Scholar Download references Author information Affiliations Beijing Key Laboratory of Antimicrobial Agents, Institute of Medicinal Biotechnology, Chinese Academy of Medical Sciences & Peking Union Medical College, 100050, Beijing, China Congran Li & Xuefu You Authors Search for Congran Li in: PubMed • Google Scholar Search for Xuefu You in: PubMed • Google Scholar Corresponding author Correspondence to Xuefu You. Rights and permissions Open Access This article is licensed under a Creative Commons Attribution 4.0 International License, which permits use, sharing, adaptation, distribution and reproduction in any medium or format, as long as you give appropriate credit to the original author(s) and the source, provide a link to the Creative Commons license, and indicate if changes were made. The images or other third party material in this article are included in the article’s Creative Commons license, unless indicated otherwise in a credit line to the material. If material is not included in the article’s Creative Commons license and your intended use is not permitted by statutory regulation or exceeds the permitted use, you will need to obtain permission directly from the copyright holder. To view a copy of this license, visit http://creativecommons.org/licenses/by/4.0/. Reprints and Permissions About this article Cite this article Li, C., You, X. Coagulation factors: a novel class of endogenous host antimicrobial proteins against drug-resistant gram-negative bacteria. Sig Transduct Target Ther 4, 46 (2019) doi:10.1038/s41392-019-0083-4 Download citation Received 30 August 2019 Revised 18 September 2019 Accepted 23 September 2019 Published 08 November 2019 DOI https://doi.org/10.1038/s41392-019-0083-4
|
|
Scooped by
Gilbert C FAURE
August 9, 2019 1:23 PM
|
Immunotherapy with immune checkpoint blockers (ICBs) has revolutionized cancer treatment. Unfortunately, ICB therapy usually benefits <15% of patients and causes immune-related adverse events in a substantial number of patients. Another immunotherapy—engineered chimeric antigen receptor (CAR) T cells that specifically target tumor-associated antigens—has transformed the treatment of multiple hematological cancers and exhibited therapeutic potential in solid tumors. Emerging data show that the function of blood vessels associated with tumors is critical in the response to these immunotherapies (1, 2). The vasculature in tumors is abnormal, which impairs blood flow and limits the delivery of oxygen, nutrients, and therapeutics, including antibodies and immune cells (3) (see the figure). The resulting hypoxia (low oxygen concentration) and low pH can in turn induce the production of immunosuppressive molecules, such as transforming growth factor–β (TGFβ), vascular endothelial growth factor (VEGF), and adenosine in the tumor microenvironment (TME). Some of these molecules lower the expression of adhesion molecules on tumor vascular endothelium, the lining of vessel walls that normally supports immune cell adhesion and transmigration into tissues. Reducing the expression of adhesion molecules therefore interferes with the ability of immune cells to adhere to and migrate across the vessel wall, preventing their entry into the tumor. In addition, pro-angiogenic molecules produced by cancer, stromal, and immune cells up-regulate Fas ligand on endothelial cells and thereby induce the apoptosis of infiltrating immune cells. VEGF can hinder maturation of dendritic cells (DCs), which are needed to present tumor-associated antigens and activate effector immune cells. Furthermore, hypoxia directly up-regulates the expression of immune checkpoint molecules [e.g., programmed cell death protein ligand 1 (PD-L1)], which suppress effector T cell activation, on various cells in the TME, including myeloid-derived suppressor cells (MDSCs) and DCs. Hypoxia also promotes the recruitment of immunosuppressive regulatory T lymphocytes (Treg cells) and reprograms tumor-associated macrophages (TAMs) from an antitumor to a protumor phenotype. Notably, the immunosuppressive molecules generated in the TME can enter the circulation and cause systemic immunosuppression. Given the consequences of malfunctioning blood vessels, multiple therapeutic strategies to improve the function of the tumor vasculature have been developed (4). Because excess VEGF contributes to vascular abnormalities, it was proposed that the judicious use of anti-VEGF agents could normalize tumor vessels and thereby improve oxygenation and drug delivery. This was supported by experiments showing that low-dose anti–VEGF receptor 2 (VEGFR2) treatment enhances trafficking of immune cells to tumors, reprograms TAMs to an antitumor phenotype, and improves outcomes of vaccine therapy in mouse breast cancer models (5). A number of preclinical studies have now shown the benefit of combining anti-VEGF agents with various immunotherapies, including ICBs and adoptively transferred engineered CAR T cells (3). Anti-VEGF–induced vascular normalization is transient, which limits efficacy. Thus, a number of strategies are emerging to extend the window of normalization. One such strategy is to target angiopoietin-2 (ANG-2), which begins to increase toward the end of the normalization window. Importantly, dual blockade of VEGF and ANG-2 prolonged the duration of normalization and survival in a number of mouse tumor models, compared with inhibiting either molecule alone. Relevant for immunotherapies, VEGF and ANG-2 dual targeting reprogrammed TAMs to an antitumor phenotype (6) and enhanced tumor response to ICBs (7). Furthermore, circulating ANG-2 concentrations are initially elevated or increase in melanoma patients with an unfavorable response to ICBs. Moreover, blood ANG-2 concentrations inversely correlate with response to ICBs with or without anti-VEGF therapy in melanoma patients (3), providing additional rationale for VEGF and ANG-2 dual inhibition. A number of other agents that target endothelial cells and/or pericytes, which support the structure and function of blood vessels, have been shown to transiently normalize tumor vessels. These targets include the receptor tyrosine kinase TIE-2, Notch signaling, endothelial cell metabolism, and oxygen sensors (4). Other strategies that can induce vessel normalization—either directly or indirectly—include restoring perivascular nitric oxide gradients, some chemotherapeutics such as eribulin, and aerobic exercise. Notably, two recent studies showed that ICBs can normalize tumor vessels in breast cancer models in mice (8, 9), which is intriguing because it implies that T cells can directly affect vascular function. These studies showed that the increased vessel perfusion by ICB is positively correlated with its efficacy (9). Future efforts will determine whether these agents can be combined with particular ICBs in specific cancer types. Physical forces generated by cells and the extracellular matrix (ECM) in tumors can also impair the function of blood and lymphatic vessels through compression (4). This is particularly the case in desmoplastic tumors, which are characterized by excessive fibrosis and activated stroma [e.g., pancreatic ductal adenocarcinoma (PDAC) and triple-negative breast cancer] and which generally have abundant carcinoma-associated fibroblasts (CAFs) and ECM. Killing cells with cytotoxic agents or depleting specific ECM components by using enzyme-based drugs can reopen these vessels. However, as cancer cells become resistant to cytotoxic agents and begin to proliferate, vessels collapse again. Similarly, enzymes that target a single ECM component (e.g., hyaluronan), become ineffective when other ECM components (e.g., collagen I) begin to contribute to compressive forces. Agents that reprogram CAFs so that they stop producing multiple ECM components can overcome this compression. For example, angiotensin system inhibitors (ASIs) are a class of molecules commonly used to treat hypertension that also reprogram CAFs and have been shown to improve the function of tumor vessels as well as the delivery and efficacy of various therapeutics (10). Moreover, these widely used drugs can activate both innate and adaptive antitumor immune responses in mouse models and patients (10). On the basis of a successful phase II clinical trial, this approach is now being tested in a randomized clinical trial in patients with locally advanced PDAC (NCT03563248). Because ASIs can cause hypotension, new formulations are needed to lower the systemic exposure of these drugs. Recently, valsartan—an ASI linked to pH-sensitive polymers—was shown to reprogram CAFs in the acidic tumor environment to alleviate antitumor immunosuppression and improve T lymphocyte activity without adverse hypotension. This approach improved the response to ICBs in mice bearing primary and metastatic breast tumors (2). Other strategies are also emerging for targeting CAF-mediated desmoplasia and vessel compression. For example, blocking C-X-C motif chemokine 12 (CXCL12)-C-X-C chemokine receptor 4 (CXCR4) signaling in mouse models of primary and metastatic breast cancer reduces fibrosis, vessel compression, and hypoxia while alleviating immunosuppression, which enhances the efficacy of ICBs (1). Similarly, the activity of tumor-associated immunosuppressive cells and the highly desmoplastic stroma in PDACs are fueled by cancer cell focal adhesion kinase (FAK) activity. Selective FAK inhibitors normalized the fibrotic TME, improved T cell infiltration of the tumor, and increased survival of tumor-bearing mice (11). Endothelial cells present in tertiary lymphoid organs (organized structures consisting of lymphocytes and stromal cells that form outside of the spleen or lymph nodes) within tumors can also regulate antitumor immunity. By combining VEGFR2 and PD-L1 antibodies, it is possible to induce the formation of specialized vessels called high endothelial venules (HEVs) in some tumor models, which improved survival (12). HEVs facilitate the entry of immune cells into lymph nodes and might serve a similar function in tumors. Moreover, depletion of Treg cells can induce the formation of HEVs outside of lymph nodes and the spleen, where they are normally found. When HEVs form in tumors, they can support lymphocyte infiltration and subsequent tumor cell killing by cytotoxic T lymphocytes (13). Lymphatic vessels are the routes from tissue to lymph nodes and back to the blood circulation. Therefore, lymphatic endothelial cells (LECs) are among the first cells to contact antigens that drain from tissue. LECs can control DC maturation and migration as well as directly present antigens on major histocompatibility complex class I (MHC I) and MHC II molecules to T cells (14). They also produce cytokines that modulate the immune response. Numerous lines of evidence demonstrate that LECs help limit and resolve effector T lymphocyte responses, modulate leukocyte function, and maintain peripheral tolerance, which prevents autoimmune responses (14). In cancer, LECs also suppress immune cell antitumor responses (14). Paradoxically, tumors that contain LECs (even in the absence of functional lymphatic vessels) show better responses to ICBs. Tumors with more intratumoral LECs have more T cells, but they become quiescent. These dysfunctional yet antigen-educated T cells can be reawakened by ICBs to produce antitumor immunity. Immune-related toxicities are a major problem with ICB and CAR–T cell immunotherapies. However, discontinuing or reducing the dose of these agents can reduce or even abrogate these toxicities. Improving the function of tumor blood vessels can improve the delivery of antibodies and cells and thus may lower the required immunotherapy dose. Such approaches hold promise for reducing toxicities while improving efficacy. However, one of the biggest challenges in realizing this goal is the lack of validated biomarkers for guiding the dose and schedule of drugs that directly or indirectly target blood vessels. This is further complicated by the recently described “paradoxical effects of obesity.” Obesity is known to fuel tumor progression, desmoplasia, hypoxia, immunosuppression, and resistance to various therapies, including chemotherapies and anti-VEGF therapies (3). Yet in mouse models of melanoma and lung cancer, and in various human cancers, obesity is associated with improved response to ICBs (15). Given the epidemic of obesity, a better understanding of the mechanisms underlying these paradoxical effects are likely to yield strategies to improve immunotherapy further. Combining strategies that improve function of tumor vessels with ICBs holds promise. For example, three recent phase III trials have shown the benefit of combining PD1 or PD-L1 antibodies with anti-VEGF or anti-VEGFR agents, leading to U.S. Food and Drug Administration approvals for the combination in lung and kidney cancers (NCT02684006, NCT02853331, and NCT02366143). However, the relative contribution to patient survival from immunomodulatory versus nonimmunomodulatory effects of VEGF blockade with ICBs in these trials is not known. The ongoing trial that aims to test the role of adding losartan—a safe, inexpensive, and widely prescribed antihypertensive ASI shown to decompress tumor blood vessels—to chemo-radiation and PD1 antibody therapy will reveal the potential of this approach in improving the treatment outcome in patients with PDAC (NCT03563248). http://www.sciencemag.org/about/science-licenses-journal-article-reuse This is an article distributed under the terms of the Science Journals Default License. References and Notes ↵ I. X. Chen et al., Proc. Natl. Acad. Sci. U.S.A. 116, 4558 (2019). ↵ V. P. Chauhan et al., Proc. Natl. Acad. Sci. U.S.A. 116, 10674 (2019). ↵ D. Fukumura et al., Nat. Rev. Clin. Oncol. 15, 325 (2018).OpenUrlCrossRefPubMed ↵ J. D. Martin et al., Annu. Rev. Physiol. 81, 505 (2019).OpenUrl ↵ Y. Huang et al., Proc. Natl. Acad. Sci. U.S.A. 109, 17561 (2012). ↵ J. Kloepper et al., Proc. Natl. Acad. Sci. U.S.A. 113, 4476 (2016). ↵ M. Schmittnaegel et al., Sci. Transl. Med. 9, eaak9670 (2017). ↵ L. Tian et al., Nature 544, 250 (2017).OpenUrlCrossRef ↵ X. Zheng et al., J. Clin. Invest. 128, 2104 (2018).OpenUrl ↵ M. Pinter, R. K. Jain, Sci. Transl. Med. 9, eaan5616 (2017).OpenUrl ↵ H. Jiang et al., Nat. Med. 22, 851 (2016).OpenUrlCrossRefPubMed ↵ E. Allen et al., Sci. Transl. Med. 9, eaak9679 (2017). ↵ C. F. Sautès-Fridman et al., Nat. Rev. Cancer 19, 307 (2019).OpenUrl ↵ K. Maisel et al., Adv. Drug Deliv. Rev. 114, 43 (2017).OpenUrl ↵ Z. Wang et al., Nat. Med. 25, 141 (2019).OpenUrl Acknowledgments: L.L.M. and R.K.J. thank Z. Amoozgar, D. G. Duda, D. Fukumura, Y. Huang, and T. Padera for helpful comments. R.K.J. received honorarium from Amgen; consultant fees from Chugai, Enlight, Merck, Ophthotech, Pfizer, SPARC, and SynDevRx; owns equity in Enlight, Ophthotech, and SynDevRx; and serves on the Boards of Trustees of Tekla Healthcare Investors, Tekla Life Sciences Investors, Tekla Healthcare Opportunities Fund, and Tekla World Healthcare Fund. The Massachusetts General Hospital has applied for patents related to concepts discussed in this article. L.L.M. owns equity in Bayer AG.
|