Your new post is loading...

|
Suggested by
Société Francaise d'Immunologie
June 16, 2019 5:44 AM
|
Summary T cells are a fundamental component of the adaptive immune response in the context of both acute and chronic viral infection. Tight control over the metabolic processes within T cells provides an additional level of immune regulation that is interlinked with nutrient sensing and the continued balancing of co‐stimulatory and co‐inhibitory signals. Underpinning T cell responsiveness for viral control are a number of phenotypic and functional adaptations ensuring adequate nutrient uptake and their utilization. T cells responding to persistent viral infections often exhibit a profile associated with immune cell exhaustion and a dysregulated metabolic profile, driven by a combination of chronic antigenic stimulation and signals from the local microenvironment. Understanding alterations in these metabolic processes provides an important basis for immunotherapeutic strategies to treat persistent infections. Introduction Viral infections present a constant challenge to the host’s immune system; at any given moment, an individual is on average infected with 8–12 chronic viruses 1, in addition to any acute ones contracted. It is therefore essential that the adaptive immune response, that aims to eradicate or at least control infection, is tightly regulated. The intricacies of the success or failure of the anti‐viral response are entrenched in cellular metabolism, and with advancing technologies providing novel insights into lymphocyte biology it is now hard to deny that anti‐viral T cells excel in ‘bioenergy management’. T cells constantly process numerous signals to orchestrate the six key metabolic pathways (glycolysis, tricarboxylic acid cycle, pentose phosphate pathway, fatty acid oxidation (FAO), fatty acid synthesis and amino acid metabolism) for their expansion and effector function 2. In this review, we will explore how CD8+ T cells – the key effectors of the anti‐viral immune response – process cell‐intrinsic and ‐extrinsic signals to fine‐tune the immune response. Predictably, the metabolic demands placed on a T cell following activation shift from an energy‐orientated quiescent profile, providing host immunosurveillance, to an anabolic, biosynthetic profile, capable of supporting cell division 3. Metabolically inactive naive CD8+ T cells use glucose catabolism and oxidative phosphorylation (OXPHOS) driven by FAO to fuel their homoeostatic cell turnover. Upon antigen recognition, naive CD8+ T cells undergo profound reprogramming whereby they increase glucose and amino acid uptake, reducing their reliance on OXPHOS and lipid oxidation and differentiate into an effector CD8+ T cell (Teff) 4. These adaptations allow Teff to meet the increased biosynthetic demands for clonal expansion and to facilitate transcription (and translation) of key cytolytic mediators and non‐cytolytic chemokines and cytokines. After antigenic clearance Teff contract, leaving behind a long‐lived memory CD8+ T cell (Tmem) pool that is adept at secondary recall when rechallenged. Tmem revert to a state that is largely dependent on endogenously synthesized fatty acids and OXPHOS, increased mitochondrial mass and an enhanced spare respiratory capacity (SRC) 5. In order to translate environmental cues into metabolic changes, lymphocytes are reliant on a number of critical transcriptional mediators, including c‐Myc, mammalian target of rapamycin (mTOR) and AMP‐activated protein kinase (AMPK). c‐Myc is a transcriptional regulator required by T cells for glycolytic reprogramming upon antigenic stimulation, and binds a number of genes involved in glycolysis and nutrient uptake 6. Additional rheostats for control of T cell function include mTOR, which has two distinct complexes – mTOR complex 1 (mTORC1) and (mTORC2) – that sense nutrients and growth factor availability, and promote mRNA translation and lipid synthesis 2. Finally, the kinase AMPK is a critical sensor and regulator of the cellular ATP pool. Upon nutrient deprivation, AMPK is activated and promotes catabolism, for example of fatty acids, while simultaneously inhibiting mTOR activity and limiting immune cell activation 7. Effector cell function and nutrient sensing Viruses can modulate the metabolism of both their host cell and neighbouring cells 8, leading to functional and phenotypic changes that impact the anti‐viral T cell response. Varying the bioavailability of nutrients (whether exogenous or endogenous glucose, amino acids, fatty acids or cholesterol/oxysterols) has profound effects on the metabolic fitness and structural integrity of the cell. When nutrient availability is restricted, T cells are forced to undergo adaptations and/or compensatory changes in phenotype or fuel source in order to retain functionality and survive. Thus, the local milieu provides an additional dimension of immune cell regulation that can interact with transcriptional programmes to support differential cell fate. Modulation of mTORC1 activity can drive asymmetric division of CD8+ T cells during the first round of division following interaction with cognate peptide presented by antigen‐presenting cells (APC). The emerging daughter cells have differential metabolic profiles: the daughter cell proximal to the APC differentiates into an effector‐like CD8+ T cell that is more glycolytic. In comparison, distal daughter cells phenotypically and functionally resemble CD8+ Tmem, with an increased propensity for lipid metabolism, greater SRC and up‐regulated expression of anti‐apoptotic molecules. These features underpin their long‐term maintenance and survival 9, 10. Glucose metabolism and its role in infection Teff make increased use of glycolysis, converting glucose to pyruvate and lactate. Despite the significantly lower yield of ATP produced per glucose molecule in glycolysis compared to OXPHOS, the reaction has three key advantages: (1) a high rate of ATP production per unit time, as glycolysis is faster than mitochondrial energy production and not easily saturated 11; (2) its independence of oxygen availability, enabling T cells to adapt better to hypoxic environments; and (3) the rapid generation of biological building blocks needed for clonal expansion 12, 13. Consequently, a hallmark of T cell activation is the de novo production and increased surface expression of glucose transporters to fuel the glycolytic pathway. In humans, this transporter family has 14 members, referred to as Glut1‐14 (or Slc2a1‐Slc2a14) 14. T cells primarily use Glut1 and Glut3 for the uptake of exogenous glucose 15; however, many persistent viruses interfere with the regulation of glucose uptake and down‐stream metabolism to suit their own needs and to enhance the production of viral progeny. For example, infection of primary CD4+ T cells with human immunodeficiency virus 1 (HIV‐1) leads to increased glycolysis (Table 1), which directly supports viral production 16. In line with this, Glut1 is up‐regulated on the surface of CD4+ T cells isolated from patients with HIV‐1 infection irrespective of treatment status, with transporter expression directly correlating with disease progression 17 (Fig. 1b). In vitro, metabolically active CD4+ T cells expressing Glut1 preferentially harbour HIV‐1 18. Other viruses, such as human T lymphotropic virus (HTLV), directly interact with Glut1 and use it as an entry receptor 19. Upon infection, HTLV stimulates further up‐regulation of Glut1 for its own advantage (Fig. 1b & Table 1). A number of latent viruses also respond to metabolic cues 20; hypoxia and glucose deprivation can cause reactivation of HTLV within T cells 20 and Epstein–Barr virus in B cells 21. These findings demonstrate the intimate relationship and dependence of viral infection and propagation on host cell metabolism. While the majority of viruses do not directly infect T cells, many can interfere with T cell function by indirect modulation of metabolic pathways, as discussed below. Virus Host cells Metabolic modulation Reference HCV Hepatocytes Increases CD98 and mTORC1 signalling, CD98 acts as co‐factor for HCV entry and is needed for viral propagation 53, 91 Drives alteration in cholesterol synthesis HBV Hepatocytes Induces Ca2+ release from mitochondria, supporting viral replication 92, 93 HIV‐1 T cells T cells: increased glycolysis and Glut1 expression. Glut1hi CD4+ T cells harbour HIV‐1, with viral transcription linked to cholesterol metabolism via SREBP2 and enhanced fatty acid synthesis 16-18 51, 52 HIV‐1 Monocytes Increased glucose metabolism and surface Glut1 and Glut 3 expression 94 HTLV T cells T cell up‐regulation of Glut1. Glut1 acts as HTLV entry receptor 95, 96 EBV B cells Activation of the PI3K/Akt pathway and enhanced HIF‐1α expression increasing glucose uptake and glycolytic flux 97, 98 CMV HF cells Glut4 up‐regulation increasing lipid biosynthesis. With increased mitochondrial ATP production by Ca2+ modulation accelerating viral replication 54, 99 KSHV Endothelial cells Increased glycolysis via induction of HIF‐1α 100 HPV Cutaneous epithelial cells Disruption of p53 signalling and stabilization of HIF‐1α enhancing glycolysis and glucose uptake 101, 102 HCV = hepatitis C virus; HBV = hepatitis B virus; HIV‐1 = human immunodeficiency virus‐1; HTLV = human T lymphotropic virus; EBV = Epstein–Barr virus; CMV = cytomegalovirus; KSHV = Kaposi’s sarcoma‐associated herpesvirus; HPV = human papillomavirus; HIF‐1a hypoxia‐inducible factor 1‐alpha. T cell control of amino acid bioavailability Although glucose is a critical substrate, essential amino acids provide the building blocks for protein and nucleotide biosynthesis. Their uptake and utilization are critical for T cell development, homoeostasis, activation, differentiation and induction of a long‐lasting memory response. The dependence on amino acids necessitates tight regulation of transporter expression and flux of nutrients in and out of the cell, exemplified by the fact that mTORC1 activity is acutely sensitive to the availability of certain amino acids (including leucine and arginine) 22, 23. Glutamine availability is also essential for mTORC1 activity; activated T cells up‐regulate members of the glutamine transporter family, including Slc38a1 and Slc1a5, consistent with active uptake of exogenous glutamine (Fig. 1a) 22, 24. Deprivation of glutamine from the microenvironment impairs both T cell proliferation and effector function 25, 26 (Fig. 1c). More specifically, Slc1a5 deficiency on activated CD4+ T cells was recently shown to decrease glutamine uptake upon T cell receptor (TCR) engagement and coupled with an impaired ability to utilize OXPHOS appropriately, resulting in impaired differentiation in vitro and in vivo. Intriguingly, the authors suggested that Slc1a5 deficiency was dispensable for T cell proliferation and interleukin (IL)‐2 production 24. Glutamine availability is also essential for T cell function, as it is required for the efficient uptake of other amino acids. For example, the neutral amino acid transporter, Slc7a5, functions as an obligate anti‐porter, efluxing glutamine to allow import of large neutral amino acids 27. Further evidence for T cell reliance on amino acid uptake comes from an elegant study by Sinclair et al., which details the role for Slc7a5 and CD98 (Slc3a2) as a critical checkpoint governing the metabolic response of T cells to antigenic stimulation. In line with this, an Slc7a5 deficiency, and an associated abrogation of leucine uptake, restricts reprogramming and clonal expansion of T cells 23, 28. Slc7a5‐deficient T cells also fail to adequately increase glucose and glutamine uptake on demand and have impaired mTORC1 activity. Notably, glutamine and glucose are the nutrients consumed the quickest by proliferating T cells 29. However, T cells also require methionine to provide methyl donors for protein and nucleotide methylation; tryptophan for cellular proliferation; arginine as a precursor for polyamines and protein biosynthesis; and leucine, which functions as an mTORC1 activator 23, 30-32. As a result, reduced availability of any one of these amino acids could negatively impact the magnitude of the anti‐viral response. Virus‐specific T cells regulate differential expression of nutrient transporters in vivo as an additional rheostat to directly modulate the intracellular concentrations of amino acids. Studies in patients with either chronic hepatitis B virus (HBV) or HIV‐1 infection have both revealed enzymatic depletion of arginine and tryptophan by myeloid‐derived suppressor cells (MDSC), that potently inhibit the anti‐viral T cell response 33, 34. An accumulation of granulocytic MDSC and the consequent elevated concentrations of the enzyme arginase‐I results in a local deprivation of arginine 33, 35, 36. Complete absence of arginine from the microenvironment prevents T cell proliferation and aerobic glycolysis in vitro 37, 38 and is sensed by the cell via Slc38a9, leading to inhibition of mTORC1 activity 39 (Fig. 1c). Cytomegalovirus (CMV)‐reactive T cells also have increased expression of the nutrient transporters Glut1 and CD98, compared to global T cells, consistent with prior antigen experience 33, 40. A further study revealed a secondary degree of modulation of arginine within the T cell itself whereby elevation of intracellular arginine concentrations, via modulation of mitochondrial arginase‐II, skewed T cell metabolism from glycolysis towards OXPHOS, enhancing memory formation, function and survival in vivo 41. Fatty acid and lipid metabolism Fatty acids and lipids represent an important energy source for cellular metabolism, but also constitute an essential component of the T cell plasma membrane and lipid rafts. Lipid rafts are highly organized cell surface microdomains that consist largely of cholesterol, glycosphingolipids and sphingomyelin, and facilitate the formation of the immunological synapse between T cells and APC. Upon T cell activation, the TCR and associated signalling molecules localize within lipid rafts, enabling TCR clustering to enhance down‐stream signalling 42. The regulation of cholesterol and fatty acid availability is crucial for T cell function. A decrease in cholesterol availability limits proliferation, membrane lipid raft formation and the strength of TCR signalling 43. In contrast, an excess of cholesterol promotes CD8+ and CD4+ T cell expansion 44. Thus, cholesterol and fatty acid homoeostasis is tightly regulated by two key transcription factors: the sterol regulatory element‐binding proteins (SREBP) and liver X receptors (LXR; Fig. 1a). Upon activation, T cells switch to a programme dependent on increased cholesterol and fatty acid synthesis, enhanced SREBP signalling and suppression of the LXR pathway 45, 46. An absence of SREBP signalling in CD8+ T cells leads to a reduced frequency of virus‐specific Teff in the context of lymphocytic choriomeningitis virus (LCMV) infection 46. Accordingly, a lack of the negative regulatory pathway LXRβ enhances the functionality of adenovirus‐specific CD8+ T cell responses 45. Tmem have an increased SRC compared to Teff that is largely associated with increased mitochondrial biogenesis and expression of Carnitine Palmitoyltransferase 1A (CPT1α) – a rate‐limiting enzyme of mitochondrial FAO 47. However, using a mouse model with CPT1α deletion, Raud et al. recently demonstrated that CPT1α is not required for the formation of Teff or Tmem, and suggest that the previously described effect of the CPT1α inhibitor etomoxir on T cell differentiation and function is likely due to off‐target effects of etomoxir on mitochondrial respiration 48. Tmem engage FAO to a greater extent than Teff, yet Tmem take up fewer long‐chain fatty acids compared to Teff, as they preferentially use exogenous glucose to support FAO and OXPHOS 5. Besides FAO, fatty acid synthesis itself is important for T cells. Modulation of fatty acid synthesis in the effector phase through deletion of Acetyl‐CoA carboxylase 1 (the rate‐limiting enzyme in de novo synthesis of long‐chain fatty acids) impairs T cell persistence and proliferation. Importantly, supplementation with exogenous fatty acids can rescue T cell proliferation in vitro 49, 50. Finally, local concentrations of cholesterol not only impact the magnitude of anti‐viral T cell responses, but can also have a direct effect on viruses themselves (Table 1). Several viruses are known to directly alter the lipid and fatty acid metabolism within the host cell for their own benefit, including HIV‐1 51, 52, hepatitis C virus (HCV) 53 and CMV 54 (Table 1). Certain viruses, including HIV‐1, utilize the organized lipid raft structure at the T cell plasma membrane for entry and assembly, with both processes requiring the presence of cholesterol 55. In support of this, the cholesterol content of the plasma membrane of dendritic cells, B cells and macrophages in HIV‐1 non‐progressors is reduced compared to rapid progressors, with the cholesterol content of the cell correlating with the capacity of HIV‐1 to undergo cell‐to‐cell spread 56, 57. Tissue residency In light of mounting evidence showing that a subset of Tmem persist and patrol within lymphoid and non‐lymphoid tissues 58, it is important to consider the immunometabolic requirements of lymphocytes found locally at the site of disease. Tissue‐resident memory T cells (Trm) are compartmentalized away from the circulating pool via the expression of the tissue‐retention signals CD69 and/or CD103 58. This is particularly pertinent, as many persistent viruses exhibit tissue‐specific tropism. CD8+ Trm provide rapid antigen‐specific recall responses in situ and therefore act as highly functional defence specialists, with adaptations imposed by their local niche. They can be directed against viruses that invade these sites: for example, HBV‐specific CD8+ Trm have been found in the human liver 59, murine herpes simplex virus 1‐specific Trm in the lamina propria of the vagina 60 and human influenza A‐specific T cells in the lung 61. Consequently, virus‐specific Trm are forced to function within the confines of the specific metabolic environment of the niche, which can often be hypoxic or nutrient‐restricted. Liver‐resident CD8+ Trm, have for example, been shown to exhibit increased expression of CD98 59 and up‐regulate glycolysis, probably in response to local arginine deprivation 33 and the hypoxic hepatic environment 40, respectively. Further evidence for metabolic control over CD8+ Trm emanates from studies of murine CD8+ Trm generated by skin vaccinia virus, where increased expression of fatty acid binding protein 4 and 5 (FABP‐4 and ‐5), along with CD36, enable CD8+ Trm to increase uptake of exogenous free fatty acids to fuel oxidative metabolism to promote long‐term survival in the tissue 62. Interestingly, the uptake of exogenous free fatty acids is not only vital for CD8+ Trm survival but also for immunosurveillance. Antigen‐specific CD8+ Trm cells lacking expression of FABP‐4 and FABP‐5, or when FAO is impaired by the addition of the pharmacological agent etomoxir, no longer provide T cell‐mediated protection within a tissue against viruses such as vaccinia virus [54]. Metabolic alterations in T cell exhaustion Growing evidence suggests that metabolic changes are not only a response to cellular activation but can drive T cell function, as well as regulate the progression of T cell dysfunction and exhaustion 63, 64. T cell exhaustion is characterized by a stepwise reduction in proliferation and effector function, culminating in the deletion of the most severely exhausted cells 65. Exhaustion is associated with chronic TCR signalling, as is characteristic of persistent viral infection 65, the tumour microenvironment and autoimmunity 64. Indeed, in the setting of chronic infection, HBV appears to drive lymphocyte exhaustion by producing high amounts of non‐infectious subviral particles at 1000–100 000 fold excess over infectious virus 66. Recently, it has been suggested that even low levels of antigenic stimulation (as could be found in some cancers) can lead to T cell exhaustion where cells are simultaneously exposed to prolonged metabolic stress 12 – a process described as ‘metabolic exhaustion’ 64, 67. The most prominent metabolic deficiency described in exhausted T cells is mitochondrial dysfunction (Fig. 1c), which may result directly from environmental stresses such as hypoxia and nutrient deprivation and/or an excess of co‐inhibitory signalling 68. Changes to mitochondrial function can already be observed early during the establishment of murine LCMV persistency 63 and are maintained in long‐term chronic viral infection 40, 69 – a situation that is also observed in cancer 67. Interestingly, mitochondria in exhausted T cells have an increased mass but are typically depolarized and T cells have a lower oxygen consumption rate (OCR) and SRC (Fig. 1c) 40, 63 while reactive oxygen species production is increased 64. Low mitochondrial function can be promoted by signalling through the co‐inhibitory receptor programmed death‐1 (PD‐1) in early chronic LCMV infection 63. In line with this, PD‐1hi peripheral human T cells have a lower SRC than PD‐1lo cells 40. The level of PD‐1 expression correlates with the degree of exhaustion, with high expression associated with exhausted T cells in HBV, HCV and HIV‐1 65. In CD4+ T cells the expression of PD‐1 is associated with a down‐regulation of glycolysis and an up‐regulation of FAO and lipolysis 70. In HIV‐1, T cells expressing lower levels of PD‐1 are more polyfunctional (i.e. capable of producing more than one cytokine) and are found in long‐term non‐progressors 71. Interestingly, while genetic deletion of PD‐1 in human TCR‐redirected transgenic T cells leads to an increased capacity for virus‐specific killing, the complete genetic absence of PD‐1 is correlated with reduced survival of the T cell pool in the context of chronic infection 72, 73. In addition to promoting T cell exhaustion, the presence of a chronic viral infection also leads to the accumulation of terminally differentiated senescent T cells. T cell senescence is characterized by critical telomere shortening due to the loss of telomerase expression which, in turn, terminates cellular proliferation 74. In contrast to exhaustion, senescent T cells are capable of producing significant quantities of cytokine, are often present in large numbers and do not necessarily express increased coinhibitory receptors. Instead, they are phenotypically distinguished by the expression of CD57 and KLRG1. Recently, senescent T cells have been shown to harbour dysfunctional mitochondria and become more dependent on glycolysis 75. During the normal process of immune cell ageing, for example, mitochondrial function is generally reduced and probably impacts the anti‐viral T cell response 76. Two characteristic viruses known to drive T cell senescence are CMV and HIV‐1. CMV‐specific CD8+ T cells accumulate in large numbers over time and single clones can often dominate the T cell pool in the blood. This inflated CMV response is thought to contribute to the reduced immune response towards new pathogens in elderly people 77. Telomere shortening was documented in CD4+ and CD8+ T cells in HIV‐1 patients, with accumulation of these cells demonstrated in progressors compared to non‐progressors 78. Interestingly, patients on anti‐retroviral therapy also accumulated senescent T cells, suggesting that long‐term low‐level antigenic stimulation was a driving force 74. Future perspectives for immunotherapy The development of new, effective therapies for chronic viral infections is of major clinical importance to improving patient care. The success of immunotherapy has been demonstrated in recent cancer treatment trials, and offers a novel therapeutic approach to enhance the functionality of present but exhausted anti‐viral T cells or to induce de novo Teff. Several strategies have focused on the blockade of inhibitory immune checkpoints, such as PD‐1 or cytotoxic T lymphocyte‐associated protein 4 (CTLA‐4), and have shown clinical benefit in boosting anti‐tumour responses 79. However, immunotherapy targeting chronic viral infections is still in its infancy; as the mechanisms behind T cell exhaustion and dysfunction in tumours and persistent viral infection share many similarities, developments in anti‐tumour immunotherapies also hold promise for the treatment of chronic viral infections. Due to the multi‐faceted immune dysfunction in the context of chronic antigenic stimulation, data from early trials have suggested that targeting more than one pathway may be necessary to achieve long‐lasting clinical results. Further exploration will be required to understand what determines treatment responsiveness. Interestingly, several studies have demonstrated the influence of the gut microbiome and their metabolites on the outcome of anti‐PD‐1 therapy in cancer patients; for example, certain bacterial species skew CD4+ T cell responses towards proinflammatory cytokine production 80-82. Furthermore, potential complementary effects of modulating T cell metabolism have been highlighted by metabolic changes observed following checkpoint blockade. The addition of an inhibitor to Acyl‐CoA cholesterol acyltransferase – an enzyme involved in cholesterol esterification – demonstrated reduced tumour growth and increased survival when combined with anti‐PD‐1 therapy 83. Experimentally, enhancing FAO through treatment with rapamycin results in a higher frequency and improved functionality of virus‐specific CD8+ T cells in acute LCMV infection 84. Rapamycin also enhances Tmem responses after vaccinia virus vaccination in non‐human primates 85. Addressing the mitochondrial dysfunction of exhausted CD8+ T cells in patients with chronic HBV infection, mitochondria‐targeted anti‐oxidants 69 as well as stimulation with inflammatory cytokines 40, 86 and modulation of amino acid availability 33 designed to restore HBV‐specific T cell functionality, have been successfully tested in vitro. Additionally, metabolic modulators can directly influence viral replication and release, and thus may have the potential to control viral infection. Statins that inhibit cholesterol synthesis have an inhibitory effect on the replication of several different viruses in vitro, including HCV 87 and CMV 88, while blockade of CD36 on macrophages inhibits the release, and therefore transmission, of HIV‐1 particles 89. Another potential approach is to enhance T cell metabolism in vitro prior to T cell therapy. The supplementation of amino acids (e.g. arginine 41) or cytokines (e.g. IL‐7, IL‐12 40, 90), or the modulation of mitochondrial biogenesis (e.g. via an enhanced expression of PPARγ co‐activator1α 67) with or without checkpoint inhibition, are all promising targets to improve in vivo survival and effector function of transferred anti‐viral T cells. In summary, immunometabolism is a new and fast‐moving field with a constant development of novel analytical approaches, from large‐scale studies including metabolomics, proteomics and lipidomics to in‐depth single‐cell analysis of nutrient uptake. These will provide new insights with the potential to progress promising novel immunotherapeutic approaches for the treatment of chronic viral infections and tumours in the future. Disclosures The authors declare no conflicts of interest. References

|
Scooped by
Gilbert C FAURE
June 15, 2019 12:38 PM
|
Il1rl1 (also known as ST2) is a member of the IL-1 superfamily and its only known ligand is IL-33. ST2 exists in two forms as splice variants: a soluble form (sST2), which acts as a decoy receptor, sequesters free IL-33, and does not signal, and a membrane bound form (ST2), which activates the MyD88/NF-κB signaling pathway to enhance mast cell, Th2, regulatory T cell (Treg), and innate lymphoid cell type 2 (ILC2) functions. sST2 levels are increased in patients with active inflammatory bowel disease, acute cardiac and small bowel transplant allograft rejection, colon and gastric cancers, gut mucosal damage during viral infection, pulmonary disease, heart disease, and graft-versus-host disease (GVHD). Recently, sST2 has been shown to be secreted by intestinal pro-inflammatory T cells during gut inflammation; on the contrary, protective ST2 expressing Tregs are decreased, implicating that ST2/IL-33 signaling may play an important role in intestinal disease. This review will focus on what is known on its signaling during various inflammatory disease states and highlight potential avenues to intervene in ST2/IL-33 signaling as treatment options.
|
|
Suggested by
Société Francaise d'Immunologie
June 15, 2019 6:43 AM
|
Author summary Natural killer (NK) cells–as their name implies–are the immune system’s ready to respond ‘killers’, being able to help control viral infection by cytolytic killing of infected cells and secretion of pro-inflammatory cytokines to activate and direct the immune response.
|
|
Suggested by
Société Francaise d'Immunologie
June 13, 2019 2:29 PM
|
Over the last ten years, immunologists have recognized the central importance of an emerging group of innate lymphoid cells (ILCs) in health and disease. Characterization of these cells has provided a molecular definition of ILCs and their tissue-specific functions. Although the lineage-defining transcription factors, cytokine production, and nomenclature parallel those of T helper cells, ILCs do not require adaptive immune programming. Both environmental and host-derived signals shape the function of these evolutionarily ancient cells, which provide pathogen protection and promote tissue restoration. As such, ILCs function as a double-edged sword, balancing the inflammatory and reparative responses that arise during injury and disease. This Review highlights our recent understanding of tissue-resident ILCs and the signals that regulate their contribution to inflammation and tissue repair in health and disease.
|
|
Scooped by
Gilbert C FAURE
June 12, 2019 9:30 AM
|
Both antibody secreting cells (ASCs) and memory B cells are essential for the maintenance of humoral immunity. To date, limit studies have focused on the two populations in Kawasaki disease (KD). To address the status of humoral immunity during KD, our current concentration is on the variations of...
|
|
Suggested by
Société Francaise d'Immunologie
June 11, 2019 1:03 PM
|
Methods Mol Biol. 2019;2020:77-89. doi: 10.1007/978-1-4939-9591-2_6.
|
|
Suggested by
Société Francaise d'Immunologie
June 11, 2019 4:45 AM
|
Eur J Immunol. 2019 Jun 8. doi: 10.1002/eji.201848026. [Epub ahead of print]
|
|
Scooped by
Gilbert C FAURE
June 10, 2019 1:32 PM
|
Exercise is known to have beneficial effects on the immune system. In this Review, Janet Lord and colleagues discuss the evidence that exercise can prevent diseases associated with ageing by protecting against immunosenescence.
|
|
Scooped by
Gilbert C FAURE
June 8, 2019 1:29 AM
|
|
|
Suggested by
Société Francaise d'Immunologie
June 7, 2019 2:00 AM
|
In this Review, the authors discuss the biology of canonical and non-canonical inflammasomes and inflammasome-forming genes in the kidney, including their different functions in the various kidney compartments and their potential as therapeutic targets.
|
|
Scooped by
Gilbert C FAURE
June 7, 2019 12:31 AM
|
|
|
Suggested by
Société Francaise d'Immunologie
May 24, 2019 3:48 AM
|
KEY POINTS Under inflammatory conditions, CRP is not only a marker but also a driver of inflammation by human macrophages. CRP enhances inflammatory cytokine production via FcγR-induced metabolic reprogramming through kinases Syk, PI3K, and AKT2. Abstract C-reactive protein (CRP) is an acute-phase protein produced in high quantities by the liver in response to infection and during chronic inflammatory disorders. Although CRP is known to facilitate the clearance of cell debris and bacteria by phagocytic cells, the role of CRP in additional immunological functions is less clear. This study shows that complexed CRP (phosphocholine [PC]:CRP) (formed by binding of CRP to PC moieties), but not soluble CRP, synergized with specific TLRs to posttranscriptionally amplify TNF, IL-1β, and IL-23 production by human inflammatory macrophages. We identified FcγRI and IIa as the main receptors responsible for initiating PC:CRP–induced inflammation. In addition, we identified the underlying mechanism, which depended on signaling through kinases Syk, PI3K, and AKT2, as well as glycolytic reprogramming. These data indicate that in humans, CRP is not only a marker but also a driver of inflammation by human macrophages. Therefore, although providing host defense against bacteria, PC:CRP–induced inflammation may also exacerbate pathology in the context of disorders such as atherosclerosis. Footnotes This work was supported by research funding from the Dutch Arthritis Foundation (ReumaNederland Grant 14-2-302) and the Academic Medical Center (AMC Fellowship 2015). Grants were given to J.d.D. The online version of this article contains supplemental material. Received February 13, 2019. Accepted April 25, 2019. Copyright © 2019 by The American Association of Immunologists, Inc.
|
|
Scooped by
Gilbert C FAURE
May 22, 2019 3:42 PM
|
Atherosclerosis is a chronic autoimmune inflammatory disease that can cause coronary artery disease, stroke, peripheral artery disease, depending on which arteries are affected. At the beginning of atherosclerosis plasma lipoproteins accumulate in the sub-endothelial space. In response, monocytes migrate from the circulation through the endothelium into the intima where they differentiate into macrophages. These early events trigger a complex immune response that eventually involves many cellular subtypes of both innate and adaptive immunity. The Notch signaling pathway is an evolutionary conserved cell signaling system that mediates cell-to-cell communication. Recent studies have revealed that Notch modulate atherosclerosis by controlling macrophages polarization into M1 or M2 subtypes. Furthermore, it is known that Notch signaling controls differentiation and activity of T-helper and cytotoxic T-cells in inflammatory diseases. In this review, we will discuss the role of Notch in modulating immunity in the context of atherosclerosis and whether targeting Notch may represent a therapeutic strategy
|
|
|
Scooped by
Gilbert C FAURE
June 15, 2019 2:21 PM
|
Hypervariable T-cell receptors (TCRs) recognise a vast diversity of pathogen-derived antigens; this study shows that TCRs responding to ongoing immune challenges can be identified using a statistical null model based on sequence similarity.
|
|
Scooped by
Gilbert C FAURE
June 15, 2019 12:37 PM
|
Regulatory T cells (Tregs) are important for the induction and maintenance of peripheral tolerance therefore, they are key in preventing excessive immune responses and autoimmunity. In the last decades, several reports have been focussed on understanding the biology of Tregs and their mechanisms of action. Preclinical studies have demonstrated the ability of Tregs to delay/prevent graft rejection and to control autoimmune responses following adoptive transfer in vivo. Due to these promising results, Tregs have been extensively studied as a potential new tool for the prevention of graft rejection and/or the treatment of autoimmune diseases. Currently, solid organ transplantation remains the treatment of choice for end-stage organ failure. However, chronic rejection and the ensuing side effects of immunosuppressant represent the main limiting factors for organ acceptance and patient survival. Autoimmune disorders are chronic diseases caused by the breakdown of tolerance against self-antigens. This is triggered either by a numerical or functional Treg defect, or by the resistance of effector T cells to suppression. In this scenario, patients receiving high doses of immunosuppressant are left susceptible to life-threatening opportunistic infections and have increased risk of malignancies. In the last 10 years, a few phase I clinical trials aiming to investigate safety and feasibility of Treg-based therapy have been completed and published, while an increasing numbers o
|
|
Suggested by
Société Francaise d'Immunologie
June 15, 2019 6:43 AM
|
The virus responsible for chickenpox and shingles employs a powerful strategy of immune evasion, inhibiting the ability of natural killer cells to destroy infected cells and produce molecules that help control viral infection, according to a study published June 13 in the open-access journal PLOS...
|
|
Scooped by
Gilbert C FAURE
June 12, 2019 9:33 AM
|
Immunology. 2018 Jul;154(3):329-330. doi: 10.1111/imm.12956.Editorial...
|
|
Suggested by
Société Francaise d'Immunologie
June 11, 2019 1:03 PM
|
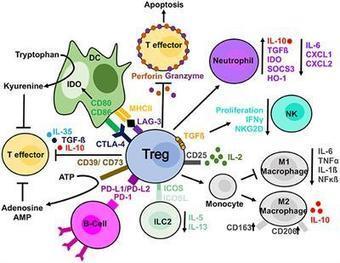
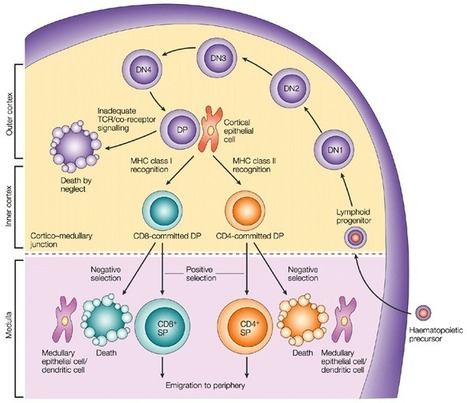
T Lymphocytes Development and markers for major T cell subtypes It is well established that CD4-CD8- T cell precursors migrate to the thymus where they undergo the following phenotypical stages: CD44+CD25- (DN1), CD44+CD25+ (DN2), CD44-CD25+ (DN3), and CD44-CD25- (DN4), followed by the progression of DN4 cells into the double-positive CD4+CD8+ T cells [5] (Figure 1). Infection by various pathogens causes activation and proliferation of naïve T cells, which differentiate into lineages with effector and memory fates. Naive CD4+ T cells recognize antigens presented by major histocompatibility complex (MHC) class II on antigen-presenting cells. Depending on the specific stimuli, the CD4+ T cells can differentiate into various subtypes, including the helper TH1, TH2 and TH17 cells and regulatory T cells (Tregs). A subset of TH2 cells differentiate into allergic disease-related H2A cells, with a CD45RBlow CD27− phenotype and coexpression of the chemoattractant receptor CRTH2, the natural killer cell marker CD161, and the homing receptor CD49d [6]. Memory T cells vary in their surface receptor expression, effector and trafficking abilities. There are four major subsets of memory T cells: central memory, effector memory, tissue-resident memory and stem memory T cells. Multiple signals regulate the differentiation of CD4+ T cells into central and peripheral memory cells. CD4+ T central memory cells express CD62L and CCR7, which are important for their migration [7]. The peripheral T stem cell memory cells express CXCR3 and CD95 molecules. In addition, both naive and memory T-cell subsets express a variety of functional molecules (Table 1). Process Antigen Function Costimulation/Survival CD27 Costimulation CD28 Costimulation CD127 IL-7 signaling PD-1 Inhibition of effector function CD122 IL-2/IL-15 signaling CD132 γc cytokine signaling KLRG-1 Inhibition of effector function Activation HLA DR Peptide presentation CD38 Calcium flux/signal transduction CD69 Proliferation Adhesion CD11a Adhesion to APC/endothelium CD58 Adhesion to APC CD99 Transendothelial migration Migration CD62L Secondary lymphoid tissues homing CD103 Gut homing CCR4 Chemokine response/TH2 associated CCR5 Homing to inflamed tissues CCR6 Chemokine response/TH17 associated CCR9 Gut homing CCR10 Skin homing CXCR3 Homing to inflamed tissues CXCR4 Homing to bone marrow CLA Skin homing Cytolytic molecules Granzyme A Cleavage of cellular proteins Granzyme B Cleavage of cellular proteins Perforin Pore-forming Miscellaneous CD161 Regulation of proliferation/cytotoxicity IL-18Ra 18Ra Response to IL-18 c-Kit Response to SCF CD130 Response to IL-6 The second major group of T cells, CD8+ T cells, mediates direct killing of antigen-presenting target cells. Naive CD8+ T cells are activated upon recognition of antigens presented by MHC class I on dendritic cells in the spleen or lymph nodes. Activated CD8+ T cells expand and become effector CD8+ T cells. The majority of the T cells bear α and β chains in their T cell receptor (TCR). However, there is a population of T cells, which have TCR formed by γ and δ chains. These cells, gamma delta T cells, are significantly enriched in epithelia [9, 10]. Gamma delta T cells regulate immune responses by various mechanisms, including suppression of effector T cell and TH1 cell functions, blockage of neutrophil influx and regulation of antigen-presenting cell activity. Markers for maturation processes Naive T cells are considered as precursors of the majority of antigen-activated T cell subpopulations. Human naïve CD4+ T cells express CD45RA, CCR7, CD62L and CD27. Upon recognition of antigens presented by major histocompatibility complex (MHC) class II on antigen-presenting cells, naïve CD4+ T cells undergo proliferation and differentiation into functionally different T cell subsets including IFN-γ producing helper T cell-1 cells (TH1), IL-4-producing TH2, IL-17-producing TH17 cells, and inducible regulatory T cells (iTregs) (Figure 2). Each T cell subset expresses specific transcription factors, such as T-bet (TH1), GATA3 (TH2), RORγt (TH17), and Foxp3 (CD25+ Tregs). With regard to TH17 cells, their differentiation is under control TGF-β and IL-6-induced differentiation, IL-21-induced activation, and IL-23-regulated stabilization [11, 12]. As to iTregs, FOXP3 was found to an important marker of natural CD4+CD25+ regulatory T cells. Moreover, transfection of CD4+CD25- T cells with Foxp3 stimulates their regulatory activity [13]. In addition, TGF-β was found to be crucial for the differentiation of naive CD4+ T cells into Foxp3+ Tregs [14]. Also, IL-2 is commonly required for TGF-β-regulated iTreg differentiation [15]. With regard to cytotoxic T cells, there are several peripheral subsets of different subsets of CD8+ T cells based on the expression of CD45RA and CCR7: a CD45RA+CCR7+ subset of naive cells, a CD45RA-CCR7+ subset of antigen-experienced memory T cells, a CD45RA-CCR7- effector memory cell subset, and a CD45RA+CCR7− subset of differentiated, antigen-experienced effector cells. Also, there are effector memory CD8+ T cells expressing CD69 and CD103 and residing in non-lymphoid tissues [16, 17]. A subpopulation of CD8+ T cells shows a memory cell phenotype: CD62L-/+CCR7+CD27-/+. Activated cytotoxic CD8+ T cells downregulate expression of L-selectin and CCR7 and upregulate surface expression of CD44, LFA-1 and/or α4β1 integrin. Additional phenotypical markers of Tregs There are several additional phenotypical markers expressed in both human and mouse Tregs. They include CTLA-4, CD103, GITR and OX40. In particular, CTLA-4 is important for both inhibitory functions and homeostasis of Tregs. Intracellular expression of CTLA-4 was observed in CD4+CD25+ human Tregs [18]. Another marker, integrin α (CD103) is expressed by Tregs and CD4+CD25+CD103+ Tregs were demonstrated to produce IL-10 actively [19]. In addition, GITR (CD357) is expressed in CD4+CD25+ human Tregs in peripheral blood [20]. Also, OX40 (CD134) was shown to stimulate the proliferation of CD4+FoxP3+ Tregs [21]. Moreover, OX40 stimulates migration of Tregs into the peripheral lymphoid and other tissues during inflammation [22]. T cell subsets that regulate B cell functions in the germinal centers Several specific T cell subsets, including follicular B helper T cells (TFH), follicular regulatory T cells (TFR) and cytotoxic CD8+ T cells, reside in the germinal centers and regulate the B cell proliferation [23]. Among these T cell subpopulations, TFH cells belong to CD4+ T cells and assist follicular B cells located in secondary lymphoid tissues, such as lymph nodes, spleen, and tonsils. Concerning the specific markers, high expression of CXC-chemokine receptor 5 (CXCR5) characterizes TFH cells [24]. Its interaction with CXC-chemokine ligand 13 (CXCL13) produced by follicular stromal cells mediates the homing of TFH cells into lymphoid follicles [24]. The development of TFH cells is strongly dependent on IL-2 production, as naїve IL2-secreting CD4+ T cells are destined to differentiate into TFH cells, while other CD4+ T cells, which do not produce IL-2, develop into non-TFH cells [25]. In addition to a universal T cell marker Thy1 (CD90) and CXCR5, TFH cells express ICOS and PD-1 molecules. Upregulation of CXCR5 expression stimulates TFH cells to migrate into the germinal centers, where these cells stabilize their phenotype by contacts with local B cells via ICOS-ICOSL binding [26]. Concerning the regulation of TFH functions, γδ T cells (TCRγδ+CXCR5+ T cells), which also reside in the lymph nodes, have recently been shown to present antigens to TFH cells and induce their activation [27]. Cellular interactions with TFH cells regulate the proliferation and maturation of B cells in the germinal centers [28]. Besides, TFH cells secrete Il-4 and IL-21 cytokines, which are crucial for the functioning of the germinal centers [28]. Moreover, in the germinal centers, TFH cells are represented by two distinct subpopulations: IL-21+ T cells regulating the selection of high-affinity B cells and IL-4+ T cells promoting differentiation of plasmocytes [29]. Several studies have shown that chronic viral infection strongly induces differentiation of TFH, which leads to non-specific B cell activation [30]. In addition to TFH cells, researchers have identified TFR cells in the germinal centers. This subset of T cells expresses Foxp3 and also regulates the activity of germinal centers [31]. TFR cells suppress the proliferation of B cells and the production of IgM and IgG antibodies [31, 32] and diminish the secretion of IL-4 and IL-21 by TFH cells in the germinal centers [33]. Measurement of T cell immune responses The standard methods for measurement of T cell immune responses include Enzyme-Linked Immuno Spot assay (ELISpot), Intracellular Cytokine Staining assay (ICS), Tetramer assay and Flow Cytometry. The ELISpot and ICS assays apply in vitro stimulation to analyze the cytokine expression profiles of responding cells. The ELISpot method detects spots of cytokines secreted by individual cells, and ICS examines surface markers and produced cytokines. Multiple approaches can measure the proliferation of T cells in response to specific antigens, including thymidine incorporation assay, flow cytometric analysis of CD38 expression or ELISA detection of BrdU incorporation into DNA of proliferating T cells. T cell immunotherapy T cell immunotherapy has yielded promising results for cancer treatment. Generally speaking, there are two main methods of T cell immunotherapy: 1) application of genetically modified T cell receptors (TCRs) recognizing tumor antigens in relation to HLA and 2) application of chimeric antigen receptors (CARs), which allow binding antigens without HLA recognition [34]. In contrast to CARs, TCRs may recognize both membrane and intracellular antigens. The α and β chains of TCRs recognize T cell targets, and genetic modification of TCR chains modifies antigen specificity. In particular, TCR for MART-1, gp100, and NY ESO-1 have shown anti-cancer activity in patients with melanoma [35]. Other tumors sensitive to TCR modification therapy include lymphoma [36], neuroblastoma [37] and sarcoma [38]. CARs also modify antigen-specific T cell functions and were effective for the treatment of B cell malignancies [39]. The insertion of co-stimulatory signaling regions into the cytoplasmic domain of CARs significantly upregulated the activity of CAR-modified T cells [40, 41]. These co-stimulatory regions include different domains, such as CD28 [42] and OX40 [43], and can modify the T cell cytotoxic activity, proliferation, and survival. The therapeutic method of applying cells expanded ex vivo is named adoptive cell transfer. This treatment uses specific T cells isolated from fragmented tumor tissues. Isolated T cells can be expanded with the help of IL-2, selected and adoptively transferred into patients. Before the adoptive cell transfer, the patients undergo lymphodepletion by either chemotherapy or irradiation [44]. B Lymphocytes Markers for major B cell subtypes There are three main subsets of naïve B lymphocytes: follicular B cells, marginal zone B cells and B1 B cells. Mature follicular B cells migrate through blood and lymph, reside in specific B cell areas of lymph nodes, Peyer’s patches, and the spleen and may present T-dependent antigens to T cells. Marginal zone CD19+CD21+CD23-CD24+IgM+ B cells reside in the marginal sinus of the spleen and mediate the transport of antigen in immune complexes. B1 cells are involved in the development of IgM responses to bacterial T cell-independent antigens. These cells can migrate from the peritoneum and reside in mesenteric lymph nodes. Memory B-cells are represented by three subsets: pre-switch IgD+IgM+CD27+ B cells, IgD-IgM+CD27+ B cells, post-switch IgA+CD27+ and IgG+CD27+ B cells and IgA+CD27- and IgG+CD27- memory B cells [45]. Circulating plasmablasts can be identified by the expression of CD38 and CD138 [46]. Expression of BCR expression is highly important for maintaining B cells in the peripheral immune system. However, only 30% of B cells in spleen develop into mature B cells. Moreover, mice, which have mutations in genes encoding BCR-related proteins, including BLNK, Btk, and Vav, show disruption of the maturation process [47, 48]. B cell maturation markers Lymphoid progenitors Lin-KITlowCSA1lowIL-7R+ are considered to be a lymphoid progenitor group and can differentiate into both B and T cells. Also, in vitro studies have demonstrated that B220-CD19+ cells can differentiate into myeloid or B cells [49] and Lin-KITlowSCA1lowIL-7R+FLT3+CD34- cells or B220-KITlowSCA1+CD24+CD43+ cells contain increased numbers of B cell precursors [50, 51]. Early B220+ precursors of B cells do not express cell surface immunoglobulin (Ig), reside in the bone marrow and include pre-pro-B cells, pro-B cells, and pre-B cells. Immature pre-B cells migrate to the spleen, where they differentiate into mature B cells and plasmocytes (Figure 3). Peripheral B cell subsets, including transitional, mature, memory and antibody-secreting cells, express different surface markers (Table 2). Name Type Phenotype Markers to sub-fractionate Functions Transitional T1 IgD+CD27neg CD10+CD24highCD38highMTG+ Precursor to T2; IL10 production (?) T2 IgD+CD27negCD10+CD24high/+CD38high/+MTG+ Precursor to T3; IL10 production (?) T3 IgD+CD27negCD10negCD24+/lowCD38+/lowMTG+ Precursor to mature-naive; IL10 production (?) Mature-naive IgD+CD27negCD10negCD24+/lowCD38+/lowMTGneg CD23, CD69, CD80, CD86 Precursor to GC, memory, and antibody-secreting cells Memory Double-negative IgDnegCD27neg CD21, CD24, CD95, CXCR3 Recall responses Non-switched IgD+CD27+ CD1c, CD21, CD24 Immunoprotective self antibody, regulatory IgM-only IgM+IgDnegCD27+ CD1c, CD21, CD24 Immunoprotective self antibody, regulatory Switched IgMneg IgDnegCD27+ CD21, CD24, CD95, CXCR3 Pathogen protection; autoimmune pathology Antibody-secreting cell Plasmablast IgDnegCD27highCD38highCD138neg CD20, HLA-DR Antibody secretion Plasma cell IgDnegCD27highCD38highCD138+ CD20, HLA-DR Antibody secretion In addition to IgG production, a subpopulation of splenic B cells can possess regulatory functions. Regulatory B cells (Bregs) affect various parts of the immune system with IL-10 playing a key role in these processes. The B10 subgroup of B cells was shown to act as regulatory cells in experimental models of lupus and autoimmune encephalomyelitis [53]. Moreover, IL-10 producing Bregs with the surface phenotype CD19+CD24hiCD38hi were found in the peripheral blood in SLE patients [54]. In addition, regulatory phenotypes CD19+, CD24+CD27+ and CD19+IgD+CD24hiCD38hiCD5hi were shown to have suppressive functions in humans [55, 56]. Regulatory B cells Several subsets of Bregs were characterized in human peripheral blood. These subsets include B cells with different levels of maturity: transitional CD19+CD24hiCD38hi Bregs [57, 58], CD19+CD27intCD38+, plasmablasts [59] and CD19+CD25+CD71+ B regulatory 1 cells [60]. Recent studies suggest that differentiation and stimulation of Bregs are likely to be induced by inflammation associated with either infection or autoimmune reactions. In particular, toll-like receptor agonists of bacterial origin were shown to activate Bregs in vitro [61, 62]. In addition, the proliferation of Bregs was reported in a murine model of autoimmune arthritis [63]. In addition to the subsets of Bregs mentioned above, Tim-1+ B cells were also shown to regulate immune reactions, since Tim-1 mucin domain-mutated mice develop autoimmune disorders [64]. Tim-1+ Bregs were identified within different B cell subpopulations, including CD19+CD1dhiCD5+, MZ and B1 cells [65]. Also, human CD73−CD25+CD71+ BR1 cells were demonstrated to be involved in the development of allergen tolerance [60]. Membrane regulatory molecules expressed by Bregs include CD25, CD71 and CD274 [54, 66, 67]. Measurement of antibody production One of the most important functions of B cells is antibody production. Enzyme-linked immunosorbent assay (ELISA) can analyze secreted antibodies, plaque-forming cell (PFC) assays can detect antibody-secreting B cells, and ELISPOT can indicate the number of antibody-producing B cells. Antibodies against T and B Cell Markers in the Literature Labome surveys formal publications to develop Validated Antibody Database (VAD). Table 3 lists the most cited antibodies against T cell markers and B cell markers among the 60,000 articles Labome has surveyed as of Jan 2019. Protein Gene ID Num Top three suppliers B220 5788 4117 Invitrogen 14-0452-86 (116), BioLegend 103202 (103), BD Biosciences 560777 (56) c-kit 3815 338 BioLegend 313201 (16), Cell Signaling Technology 3074 (15), Invitrogen MA5-12944 (9) CD1C 911 81 BioLegend 331501 (15), Miltenyi Biotec 130-090-508 (12), Invitrogen AHS0198 (5) CD1D 912 745 BD Biosciences 339186 (79), BioLegend 350302 (3), Santa Cruz Biotechnology sc-19632 (2) CD4 920 2492 Invitrogen MHCD0400 (118), BD Biosciences 555344 (86), BioLegend 317404 (37) CD5 921 147 Invitrogen MA5-13308 (21), Beckman Coulter IM2637U (6), BD Biosciences 644487 (6) CD8 925 2364 Invitrogen MHCD0800 (153), BD Biosciences 339188 (71), Dako M7103 (62) CD10 4311 225 Invitrogen MA5-14050 (56), BD Biosciences 555373 (15), BioLegend 312202 (10) CD11a 3683 74 Invitrogen MA1-19003 (7), BD Biosciences 555381 (4), Abcam ab52895 (3) CD19 930 1362 BioLegend 302202 (53), BD Biosciences 564457 (52), Invitrogen MHCD1921 (39) CD21 1380 89 Invitrogen MA5-11417 (11), BD Biosciences 555421 (9), Dako M0784 (5) CD23 2208 64 Invitrogen MA5-14572 (11), BD Biosciences 550386 (3), Santa Cruz Biotechnology sc-18910 (1) CD24 100133941 311 Invitrogen MA5-11833 (72), BD Biosciences 555428 (26), BioLegend 311102 (5) CD25 3559 778 BD Biosciences 560356 (57), BioLegend 302602 (27), Invitrogen MHCD2506 (17) CD27 939 641 BD Biosciences 561408 (33), Invitrogen 14-0271-82 (26), BioLegend 302839 (25) CD28 940 392 BioLegend 302902 (18), BD Biosciences 556620 (16), Invitrogen 16-0289-85 (13) CD38 952 542 BD Biosciences 646852 (27), Invitrogen MA1-19316 (24), BioLegend 303502 (24) CD44 960 2374 BioLegend 103002 (106), Invitrogen 14-0441-81 (89), BD Biosciences 550392 (31) CD45RB 5788 4117 Invitrogen 14-0452-86 (116), BioLegend 103202 (103), BD Biosciences 560777 (56) CD49d 3676 102 BD Biosciences 555501 (7), BioLegend 304302 (6), R&D Systems BBA37 (6) CD58 965 11 BD Biosciences 555921 (3), Beckman Coulter IM3702 (2), BioLegend 330902 (1) CD62L 6402 306 Invitrogen MA1-10259 (27), BD Biosciences 555542 (22), BioLegend 304802 (15) CD69 969 360 BioLegend 310902 (27), BD Biosciences 560740 (24), Invitrogen MA1-207 (14) CD71 7037 870 Invitrogen 13-6800 (435), BD Biosciences 555534 (13), BioLegend 334102 (4) CD73 4907 173 BD Biosciences 550257 (45), Invitrogen 41-0200 (4), Santa Cruz Biotechnology sc-32299 (3) CD80 941 300 BD Biosciences 557223 (22), BioLegend 305201 (19), Invitrogen MA1-19215 (15) CD86 942 489 Invitrogen MA1-10293 (33), BioLegend 305402 (29), BD Biosciences 555656 (21) CD95 355 334 BD Biosciences 555670 (24), EMD Millipore 05-201 (14), BioLegend 305614 (11) CD99 4267 32 Dako M3601 (16), Invitrogen MA5-12287 (5), BioLegend 915603 (1) CD103 3682 85 Invitrogen 14-1038-82 (7), BioLegend 350202 (7), Beckman Coulter IM1856U (4) CD130 3572 9 BioLegend 362003 (1), BD Biosciences 555757 (1) CD134 7293 27 BD Biosciences 555838 (4), BioLegend 350002 (3), Invitrogen 14-1347-82 (1) CD138 6382 133 Dako M7228 (15), Abcam ab34164 (11), BD Biosciences 650660 (11) CD161 3820 127 BioLegend 339902 (14), BD Biosciences 556079 (9), Miltenyi Biotec 130-092-676 (4) CD127 3575 270 Invitrogen 14-1278-82 (26), BioLegend 351302 (20), BD Biosciences 552853 (16) CD274 29126 338 BioLegend 329701 (16), Invitrogen 14-5983-80 (14), Abcam ab205921 (5) CD357 8784 12 Invitrogen 12-5875-42 (3), BioLegend 311610 (1) CCR4 1233 49 BD Biosciences 551121 (11), BioLegend 359402 (5), R&D Systems MAB1567-100 (4) CCR5 1234 102 BD Biosciences 555991 (12), BioLegend 313712 (4), Invitrogen 12-1957-42 (1) CCR6 1235 154 BD Biosciences 559560 (16), BioLegend 353402 (15), Invitrogen 14-1969-82 (4) CCR7 1236 314 BD Biosciences 552174 (31), BioLegend 353202 (26), Invitrogen 14-1979-82 (13) CCR9 1238 8 R&D Systems MAB1364 (3), BD Biosciences 561607 (2) CCR10 1238 8 R&D Systems MAB1364 (3), BD Biosciences 561607 (2) CLA 6404 25 BD Biosciences 550407 (4), BioLegend 328805 (2), Abcam ab68143 (1) CXCR3 2833 156 BioLegend 353702 (16), BD Biosciences 557183 (8), R&D Systems MAB160-100 (2) CXCR4 7852 275 BioLegend 306502 (16), Invitrogen 35-8800 (15), BD Biosciences 555971 (12) CRTH2 11251 23 BioLegend 350102 (4), BD Biosciences 558412 (4), Beckman Coulter A07413 (1) FoxP3 50943 506 Invitrogen 14-4776-82 (56), Abcam ab20034 (34), BioLegend 320102 (12) Granzyme A 3001 21 BioLegend 507202 (9), BD Biosciences 557449 (1) Granzyme B 3002 320 Invitrogen MA1-80734 (53), BD Biosciences 561151 (28), BioLegend 515406 (21) IL-18Ra 8809 26 BioLegend 313802 (4), R&D Systems MAB840-100 (4), Invitrogen MA1-20257 (1) KLRG-1 10219 27 BioLegend 138429 (6), Santa Cruz Biotechnology sc-32755 L (1), Miltenyi Biotec 130-103-638 (1) MTG 5646 PD-1 5133 509 BioLegend 329902 (42), Invitrogen 14-2799-80 (11), BD Biosciences 562138 (11) Perforin 5551 89 BioLegend 308102 (12), Invitrogen 14-9994-82 (9), BD Biosciences 556434 (8) SCA1 836 1941 Cell Signaling Technology 9664 (362), Novus Biologicals NB100-56708 (41), BD Biosciences 559565 (34) Of Note CD45, also called leukocyte common antigen(LCA), regarded as a pan-immune marker, has also been found in rare epithelial cells in mouse intestine [68], more specifically in tuft-2 cells [69].
|
|
Suggested by
Société Francaise d'Immunologie
June 11, 2019 1:02 PM
|
Research ArticleInfectious disease Free access | 10.1172/jci.insight.126207 TLR9/MyD88/TRIF signaling activates host immune inhibitory CD200 in Leishmania infection Ismael P. Sauter,1 Katerine G. Madrid,1 Josiane B. de Assis,2 Anderson Sá-Nunes,2 Ana C. Torrecilhas,3 Daniela I. Staquicini,4 Renata Pasqualini,4 Wadih Arap,5 and Mauro Cortez1 First published May 16, 2019 - More info Abstract Virulent protozoans named Leishmania in tropical and subtropical areas produce devastating diseases by exploiting host immune responses. Amastigotes of Leishmania amazonensis stimulate macrophages to express CD200, an immunomodulatory ligand, which binds to its cognate receptor (CD200R) and inhibits the inducible nitric oxide synthase and nitric oxide (iNOS/NO) signaling pathways, thereby promoting intracellular survival. However, the mechanisms underlying CD200 induction in macrophages remain largely unknown. Here, we show that phagocytosis-mediated internalization of L. amazonensis amastigotes following activation of endosomal TLR9/MyD88/TRIF signaling is critical for inducing CD200 in infected macrophages. We also demonstrate that Leishmania microvesicles containing DNA fragments activate TLR9-dependent CD200 expression, which inhibits the iNOS/NO pathway and modulates the course of L. amazonensis infection in vivo. These findings demonstrate that Leishmania exploits TLR-signaling pathways not only to inhibit macrophage microbicidal function, but also to evade host systemic immune responses, which has many implications in the severity of the disease. Graphical Abstract Introduction Macrophages initiate the innate immune response against parasitic infections. After detecting parasites, signaling pathways triggered by the interaction of pathogen-associated molecular patterns (PAMPs) with Toll-like receptors (TLRs) are activated in macrophages, leading to pathogen elimination and recruitment of immune cells to restrain the remaining infection and inflammation (1, 2). Throughout the infection period, a delicate balance between activating and controlling the immune system preserves the integrity of the host to restore homeostasis. Yet, many pathogens have evolved to exploit these control mechanisms to escape host defenses and establish infection. The protozoan parasite Leishmania, which causes various clinical forms of leishmaniasis, constitutes a prime example of a pathogen that successfully adapted to live inside macrophages, thereby escaping their inherent cellular antimicrobial attributes (3, 4). Several clinically relevant models are available (5) including inbred and deficient mice (6) that allow studying all steps of the disease, from infection to the progression of lesions and ultimately death. Leishmaniasis comprises a range of tropical diseases that cause cutaneous, mucocutaneous, and visceral pathologies in humans and other animals (7, 8). Leishmania parasites are transmitted by infected hematophagous female sandflies (9). Parasite-host interactions are multifaceted, involving several pathogenicity factors for host immune responses and different species of Leishmania. In Brazil, Leishmania amazonensis is known to be the causative agent of cutaneous and diffuse cutaneous leishmaniasis (10). It was demonstrated that these parasites inhibit innate immune responses and promote their virulence by inducing expression of CD200 (also known as the OX-2 membrane glycoprotein), an immunoregulatory molecule that downregulates the leishmanicidal response of macrophages (11). CD200 and its cognate receptor (CD200R) are cell surface glycoprotein members of the immunoglobulin superfamily. CD200 is broadly expressed in many cell types, including thymocytes, B cells, activated T cells, neurons, and endothelial cells (12–14). On the other hand, CD200R expression is limited to myeloid cells and specific T cell populations (15–17). Activation of CD200R by CD200 suppresses the inflammatory response of macrophages and cytotoxic T cells, which induces tolerance and activates regulatory T cells (18, 19). During L. amazonensis infection, expression of CD200 in murine macrophages supports the growth of intracellular amastigotes by downregulating nitric oxide (NO) production by inducible nitric oxide synthase (iNOS), the main mechanism of parasite control (11, 20, 21). However, these reports did not reveal the molecular machinery that triggers these responses. We hypothesized that L. amazonensis activates TLR-mediated signaling to increase parasite virulence in experimental models. Results CD200 expression requires phagocytosis-mediated internalization. Amastigotes of L. amazonensis induce expression of CD200 in bone marrow macrophages (BMMs) at early stages of the host cell–parasite interaction (11). Notably, axenic amastigotes, which are obtained from axenic culture, and lesion amastigotes obtained from cutaneous lesions of infected mice, induced similar levels of CD200 expression in infected BMMs (Figure 1A), as shown by tandem immunoprecipitation (IP) followed by Western blot analysis with a specific anti-CD200 antibody. To investigate whether parasite attachment or internalization triggers intracellular inhibitory signaling pathways mediated by CD200 expression, we used BMMs derived from C57BL/6 mice treated or not with cytochalasin D (Cyto-D), a drug that affects actin polymerization and inhibits phagocytosis (22). We noted a marked inhibition of CD200 expression in BMMs treated with Cyto-D and infected with L. amazonensis amastigotes. We observed high CD200 expression in infected and nontreated BMMs (Figure 1B). In contrast, noninfected BMMs and noninfected BMMs treated with Cyto-D showed only basal levels of CD200 expression. To evaluate the effect of actin polymerization on cell invasion, we determined the number of intracellular parasites per infected cell compared to the number of parasites attached but not internalized. We identified attached parasites from internalized parasites under immunofluorescence (IF) analysis in nonpermeabilized infected cells. In this assay, attached parasites were stained with a polyclonal anti-Leishmania antibody followed by a secondary fluorophore-conjugated antibody (green), while only the nuclei and kinetoplasts of internalized parasites showed propidium iodide staining (red), as seen in Figure 1C. Treatment with Cyto-D reduced the number of internalized amastigotes by approximately 40% in BMMs, whereas it increased the number of attached parasites (Figure 1D), showing no effect on the total number of parasites associated with BMMs (Figure 1E). Because phagocytosis is an active process in macrophages that promotes internalization of parasites either live or dead, we reasoned that parasite viability would require inducing CD200 expression in BMMs. To address this possibility, we next incubated BMMs with live or dead amastigotes of L. amazonensis. We employed 2 different methods to kill the parasites: fixing with paraformaldehyde (PFA) or heating at 65°C degrees for 45 minutes. Parasite viability after treatment is shown in Supplemental Figure 1; supplemental material available online with this article; https://doi.org/10.1172/jci.insight.126207DS1 We only observed phagocytosis-induced CD200 expression in BMMs infected with live parasites (Figure 1F), despite the similar percentages of phagocytosed live and dead parasites (Figure 1, G and H). These results indicate that phagocytosis of live amastigotes is essential for activating intracellular pathway(s) that ultimately induce CD200 expression in BMMs infected by L. amazonensis. Figure 1 Macrophage CD200 expression induced by Leishmania amazonensis requires phagocytosis of viable parasites. (A) BMMs infected with axenic (Axe) or lesion (Les) amastigotes of L. amazonensis for 1 hour. (B) BMMs pretreated with cytochalasin D (Cyto-D) and infected (+) or not (–) with lesion amastigotes for 1 hour. CD200 protein levels analyzed by IP/Western blot. Actin from IP-input sample served as loading control. (C) Representative immunofluorescence images of the amastigote in vitro infection, showing attached (blue arrowheads) or internalized (white arrowheads) parasites. Amastigotes were stained sequentially with anti-Leishmania antibodies and anti–rabbit IgG Alexa Fluor 488 (green). Nuclei were stained with propidium iodide (red). (D) Percentage of the attached (white bars) or internalized (black bars) amastigote infection after Cyto-D treatment in BMMs. Results correspond to the mean ± SD of 3 independent experiments. **P < 0.01 (2-way ANOVA). (E) Total number of amastigotes in infected BMMs pretreated or not with cytochalasin. The data correspond to the mean ± SD of triplicates. Results expressed as amastigotes per 100 infected BMMs representative of 3 independent experiments. (F) IP/Western blot of CD200 in samples from BMMs incubated with live or dead amastigotes (either by PFA or heat treatment). (G) Representative images of BMMs incubated with live or dead amastigotes and processed as in C. Scale bars: 10 μm (C and G). (H) Percentage of infection for attached (white bars) or internalized (black bars) amastigotes for the in vitro assay shown in E. At least 300 cells per coverslip were counted for each assay. Results correspond to the mean ± SD of 3 independent experiments. Endosomal TLR9/MyD88/TRIF activation induces CD200 expression. Among the TLRs involved in innate immune responses against Leishmania spp., the most studied are TLR2 and TLR4 localized on the cellular plasma membrane and TLR3 and TLR9 localized on the membrane of endosomal compartments (23). To investigate whether induced CD200 expression is associated with downstream signaling pathways activated by TLRs, we treated BMMs with specific agonists: gram-positive bacterial peptidoglycan (PGN, a TLR2 agonist), polyinosinic-polycytidylic acid (poly I:C, a TLR3 agonist), gram-negative bacterial lipopolysaccharide (LPS, a TLR4 agonist), and unmethylated CpG motifs (CpG, a TLR9 agonist). We observed a marked and specific increase in the levels of CD200 expression only after treatment with the TLR9 agonist CpG (Figure 2A). This effect is confirmed by densitometric analysis of the bands (CD200/actin ratio). Indeed, the CpG-induced CD200 expression in BMMs occurred as early as 60 minutes after incubation, which corresponded to BMMs infected with amastigotes of L. amazonensis (11). Figure 2 Leishmania amazonensis–induced CD200 expression requires TLR9, MyD88, and TRIF signaling pathways in macrophages infected with amastigotes. (A) A TLR9 agonist induces significant upregulation of CD200. IP followed by Western blot (WB) of CD200 performed in BMMs stimulated for 1 hour with different TLR agonists: TLR2 (peptidoglycan), TLR3 (poly I:C), TLR4 (LPS), and TLR9 (CpG). WB with an actin mAb was used as a sample input control. Densitometric analysis of CD200/actin input ratio is presented in every WB. (B) BMMs from WT and TLR-deficient mice were infected for 1 hour with amastigotes, lysed, and subjected to CD200 IP/Western blot. (C) The number of amastigotes in infected BMMs from WT compared with BMMs from TLR–/– mice or (D) MyD88–/– and TRIF–/– mice. The data correspond to the mean ± SD of triplicates. Results expressed as amastigotes per 100 infected BMMs representative of 3 independent experiments and at least 300 cells per coverslip were counted for each assay. (E) Level of CD200 expression analyzed as in B in infected BMMs from WT and MyD88–/– and TRIF–/– mice. Densitometric analysis of CD200/actin input ratio is presented on the right. While TLRs expressed on the plasma membrane recognize surface PAMPs, endosomal TLRs recognize primarily microbial nucleic acids (24, 25). To evaluate whether L. amazonensis amastigotes induce CD200 expression through TLR activation, we used BMMs derived from TLR2-null, TLR3-null, TLR4-null, and TLR9-null mice. We detected high CD200 expression in infected BMMs derived from wild-type (WT), TLR2–/–, TLR3–/–, and TLR4–/– mice, whereas we observed no induction of CD200 expression in TLR9–/–-derived BMMs (Figure 2B). Among the tested BMMs, we found no significant differences in the percentage of infection (Supplemental Figure 2) or in the number of parasites per infected cell after 1 hour (Figure 2C). The TLR-associated signaling cascade is dependent on recruitment of 2 major adaptor proteins: MyD88 and TRIF (26). Although TLR9 activation promotes recruitment and signaling outcomes through recruiting MyD88, TRIF can serve as an alternative signaling route via TLR9 (27). To evaluate these TLR adaptor proteins in L. amazonensis–induced CD200 expression, we used BMMs derived from WT, MyD88-null (MyD88–/–), or TRIF-null (TRIF–/–) mice in infection assays, which showed no difference in the number of intracellular parasites after 1 hour of infection (Figure 2D). We only detected CD200 expression in infected BMMs from WT mice, not in BMMs from MyD88–/– or TRIF–/– mice (Figure 2E). These data show that parasite internalization is not affected by the absence of MyD88 or TRIF and suggest that TLR9-induced CD200 expression requires both adaptor proteins, MyD88 and TRIF. Taken together, the data indicate that intracellular parasites engage TLR9 signaling pathways through MyD88 and TRIF to induce expression of CD200 in BMMs upon infection with L. amazonensis amastigotes. TLR9-dependent CD200 expression inhibits iNOS/NO microbicidal responses. TLR9 recognizes unmethylated CpG DNA sequences (28, 29). To investigate TLR9 activation by L. amazonensis, we incubated BMMs from WT mice with different concentrations of total DNA purified from amastigotes and analyzed CD200 expression. We observed elevated expression of CD200 in macrophages incubated with 1 μg/ml of total parasite DNA (Figure 3A). Since the signaling pathways triggered by TLR9 induce expression of CD200, we hypothesized that TLR9 activation by L. amazonensis DNA would inhibit iNOS expression and NO production. Therefore, we primed BMMs with LPS and then incubated them with either the parasite (L.a) or purified parasite DNA (L.a DNA). We then analyzed the levels of iNOS and NO. As a control, we used recombinant CD200-Fc, which inhibits iNOS expression (11, 30). Purified L. amazonensis DNA inhibited iNOS expression in LPS-activated macrophages (Figure 3B) and NO production (Figure 3C) to similar levels after exposure to intracellular parasites or recombinant CD200-Fc. To correlate the involvement of TLR9 signaling and the iNOS/NO mechanism, we analyzed the levels of iNOS transcripts at initial time points of Leishmania infection in macrophages from WT and TLR9–/– mice by quantitative PCR (qPCR). Interestingly, an opposite response of iNOS transcripts was observed between WT and TLR9–/– infected macrophages. While iNOS transcripts decreased from 1 hour to 3 hours of infection in macrophages from WT mice, the levels of these transcripts were significantly higher after 3 hours in TLR9–/– infected macrophages, suggesting that without TLR9, induction of CD200 expression is inhibited, and consequently the levels of iNOS increase, favoring parasite elimination (Figure 3D). To verify that TLR9–/– BMMs are responsive to iNOS, we verified the production of nitrite in WT and TLR9–/– macrophages activated by LPS or CpG agonists. As expected, WT and TLR9–/– macrophages produced nitric oxide when stimulated with both agonists, with slightly higher production in TLR9–/– macrophages stimulated with LPS (Figure 3E). However, this effect is drastically inhibited in the presence of recombinant CD200-Fc (Figure 3F), indicating that TLR9 is directly associated with the expression of CD200, but independent of the iNOS/NO inhibition induced by this ligand. Because CpG induced CD200 expression in macrophages (Figure 2A), we expected a similar inhibitory effect on nitric oxide production. However, CpG increased the levels of nitrite, suggesting that parasite DNA and CpG induce signaling pathways through TLR9 that results in CD200 expression. Importantly, CD200 induced by CpG is not involved in macrophage iNOS/NO inhibition. These results suggest that DNA of L. amazonensis amastigotes specifically inhibits the iNOS/NO pathway by inducing TLR9-dependent CD200 expression in BMMs. Figure 3 Parasite DNA induces host CD200 and downregulates iNOS/NO. (A) CD200 protein levels in BMMs stimulated for 1 hour with different concentrations of Leishmania amazonensis DNA (0.1, 0.5, and 1 μg/ml) and densitometric analysis using CD200/actin input ratio. (B) Expression of iNOS in the protein extract from untreated or LPS-treated BMMs and infected with amastigotes (L.a) or treated with CD200-Fc (2 μg/ml) or with amastigotes-DNA (1 μg/ml). Densitometric analysis of iNOS/actin ratio is presented on the right. (C) NO levels in the supernatant of BMMs treated and processed as in B. Results correspond to the mean ± SD of triplicates. ***P < 0.001 (2-way ANOVA). (D) iNOS transcript levels determined by qPCR in BMMs from WT and TLR9–/– mice infected for 1 or 3 hours with axenic amastigotes of L. amazonensis. The data correspond to the mean ± SD of triplicates. ***P < 0.0002 (Student’s t test). (E) NO levels in the supernatant of BMMs from WT and TLR9–/– mice treated with LPS or CpG (1 μg/ml) and incubated for 24 hours. Results correspond to the mean ± SD of triplicates. WT: (–) vs. LPS, **P = 0.0017; (–) vs. CpG, *P = 0.0175; TLR9–/–: (–) vs. LPS, ****P < 0.0001; (–) vs. CpG, ***P = 0.0006 (2-way ANOVA). (F) NO levels in the supernatant of LPS-treated BMMs and treated with CD200-Fc (2 μg/ml) or CpG (1 μg/ml) and incubated for 24 hours. Results correspond to the mean ± SD of triplicates. Untreated: (–) vs. CpG, ***P < 0.0001; +LPS: (–) vs. CD200Fc, *P = 0.0394; (–) vs. CpG, ****P < 0.0001 (2-way ANOVA). L. amazonensis amastigote–secreted EVs induce host CD200. Several reports have demonstrated secretion of extracellular vesicles (EVs) in different species of Leishmania (31–33). These vesicles can be classified into microvesicles (mVEs: 100–1000 nm) or exosomes (40–100 nm) according to their size and density (34, 35). Parasite-derived EVs carrying active proteins and nucleic acids can have modulatory effects in macrophage signaling and function (33, 36, 37). Given the similarities in EV contents in vivo and in vitro (38), we investigated TLR9 activation by EVs secreted by axenic amastigotes of L. amazonensis. To evaluate EV shedding, we incubated parasites in culture media for 2 hours followed by scanning and transmission electron microscopy (SEM and TEM, respectively). We analyzed the supernatant containing secreted EVs by nanoparticle tracking analysis (NTA). As predicted, we observed numerous amastigote-associated EVs (arrows) budding from different locations on the surface of the parasite plasma membrane by SEM (Figure 4A) and TEM (Figure 4B). By NTA analysis, we observed that EVs recovered from the supernatant were mostly composed of mVEs varying from 94 nm to 216 nm in diameter (Figure 4C). Next, we loaded L. amazonensis amastigotes with carboxytetramethylrhodamine (TAMRA), a rhodamine-based fluorescent dye, and performed time-lapse mVE release experiments during BMM infection. By using confocal microscopy, we visualized punctate fluorescence corresponding to released mVEs (white arrowhead) at early time points of parasite contact with the macrophages (Figure 4, D and E). This time period corresponds to the rapid induction of CD200 in infected BMMs. Figure 4 Leishmaniaamazonensis amastigotes release DNA-containing EVs for CD200 induction. (A) Scanning electron (SEM) and (B) transmission electron microscopy (TEM) images showing the mVEs (arrowheads) generated on the membrane of L. amazonensis amastigotes. Scale bars: 10 μm (A) and 200 nm (B). A cropped image is presented for best visualization. (C) Nanoparticle tracking analysis (NTA) shows the concentration (particles per ml) and the size (particle size in nm) of L. amazonensis mVEs. Representative image of 2 different mEVs visualized by SEM are shown (inset). (D) The time-lapse release of mEV-TAMRA from L. amazonensis amastigotes in infected BMMs recorded for 60 minutes and examined by confocal microscopy. Representative DIC/TAMRA fluorescence (red) image at 20 minutes of infection. (E) Right images show 4 merged pictures from the time-lapse video recorded for 60 minutes (see Supplemental Video 1). The white arrowhead shows an mVE released by amastigotes. Scale bars: 5 μm (D and E). (F) CD200 levels in BMMs incubated for 1 hour with parasites (L.a), parasite mVEs, or purified mVE-DNA. CpG was used as a positive control to induce CD200 expression. IP-input samples were verified by using actin levels as a loading control, which was used in the densitometric analysis (CD200/actin input ratio). We then evaluated this vesicle budding mechanism in TLR9-induced CD200 expression. We purified the DNA content from mVEs (DNA-mVEs) from cultured amastigotes and added it to BMMs from WT mice. We used intact mVEs and CpG as controls. DNA-mVEs and intact mVEs induced CD200 expression to levels seen with the TLR9 agonist CpG by Western blot and confirmed with densitometric analysis (Figure 4F). These data show that DNA-containing mVEs secreted by amastigotes of L. amazonensis activate TLR9, which in turn induces CD200 expression and inhibits iNOS and NO production in macrophages. Together, these results provide mechanistic evidence for intracellular activation of TLR9 by L. amazonensis amastigote–secreted mVEs. TLR9 activation modulates L. amazonensis virulence in vivo. To evaluate the induced CD200 expression by TLR9 activation in vivo, we followed the progression of cutaneous lesions in the footpads of WT and TLR9–/– mice infected with L. amazonensis. We have previously demonstrated that CD200–/– mice are resistant to L. amazonensis infection and develop small cutaneous lesions containing fewer parasites than control mice (11). As early as the third week of infection, infected TLR9–/– mice developed much smaller lesions, containing a reduced number of parasites recovered at the end of the experiment (Figure 5, A–C, and Supplemental Figure 3A). As expected, WT mice showed rapidly growing and nonhealing lesions typical of L. amazonensis infection (Figure 5, A and B) that had an increased parasite load in the infected tissue (Figure 5C) relative to mild infection observed in TLR9–/– mice. Because of the remarkable difference in the progression of lesions observed between WT and TLR9–/– mice, we sought to compare the inflammatory response in the footpad lesions by determining the cytokine profile in each animal group. A tendency towards an inflammatory profile was observed in samples from TLR9–/– mice, with at least 3-fold more IL-12p70 and significantly low levels of the antiinflammatory IL-4 and IL-10 cytokines in comparison with WT mice (Figure 5D). Other cytokines such as IL-1β, TNF-α, IL-12p40, IL-6, and IFN-γ were either not significantly altered or undetectable (Supplemental Figure 3B). Figure 5 Low virulence of Leishmania amazonensis in TLR9–/– mice is associated with reduced CD11b+F4/80+CD200+ cells and proinflammatory cytokines in the lesion. (A) Lesion size during the course of WT and TLR9–/– mouse infection with L. amazonensis. Results correspond to the mean ± SD (n = 5). **P < 0.01 (Student’s t test). (B) Representative image of the lesions generated at the left footpad in WT and TLR9-/- mice in the L. amazonensis infection experiment shown in A. (C) Parasite load in the footpads of WT and TLR9–/– mice infected with L. amazonensis at the third week of infection. Results correspond to mean ± SD (n = 4). ***P < 0.001 (Student’s t test). (D) Cytokine profile of draining cells from footpad homogenates quantified by ELISA. Results correspond to the mean ± SD (n = 4). IL-12p70, *P = 0.0106; IL-4, ***P < 0.001; IL-10, *P < 0.0228 (Student’s t test). (E) By flow cytometry, CD45+ and CD45– cells from lesions were analyzed for CD200 expression in nonimmune (F) and immune cells (G). *P < 0.01 (Student’s t test). (H) Total macrophages at the lesion site in WT and TLR9–/– mice infected with L. amazonensis and analyzed by flow cytometry. Results correspond to the mean ± SD (n = 4). *P = 0.0106 (Student’s t test). (I) Representative histograms used to calculate the percentage of CD200+ macrophages and the absolute number of CD11b+F4/80+CD200+ cells at the lesion site of WT and TLR9–/– mice infected with L. amazonensis. Results correspond to the mean ± SD (n = 4). *P = 0.0114 (Student’s t test). One might suggest that such results have occurred due to the early phase of L. amazonensis infection. We did detect an antiinflammatory-like immune response (IL-12lo, IL-4hi, IL-10hi), which correlates with the TLR9-mediated CD200 phenotype. This cytokine profile was previously reported in L. amazonensis infection (39). At the fifth week of Leishmania infection, lesion progression intriguingly resumed in TLR9–/– mice, which maintained a low number of parasites compared with the parasite load from WT mouse lesions (Supplemental Figure 3C). In this context, we speculate that an exacerbated compensatory inflammatory reaction is the main cause for tissue damage and edema rather than parasite replication itself. To further investigate the role of TLR9 in the induction of CD200 expression in vivo, we removed the tissue lesions from mouse footpads and analyzed CD200 expression by flow cytometry. Total expression of CD200 was first analyzed in CD45+ and CD45– cell populations obtained from WT and TLR9–/– mice (Figure 5E and Supplemental Figure 4, A–D). Double-positive (CD45+CD200+) cells were significantly higher in WT than in TLR9–/– cells recovered from the lesions (Figure 5F). The same results were obtained for CD45– and CD200+ cells (Supplemental Figure 4E). Despite these differences in the absolute number of CD200-expressing cells between WT and TLR9–/–, the mean fluorescence intensity (MFI) was similar, indicating that CD200 was equally detected in the 2 experimental groups (Figure 5G). More importantly, a marked difference was observed in the absolute number of macrophages (CD45+CD11b+F4/80+ cells). WT mice contained 3-fold higher levels of macrophages than TLR9–/– mice (Figure 5H) and those cells expressed significantly more CD200 than the normalized number of macrophages from TLR9–/– mice (Figure 5I). These results would explain the low parasite burden in the lesions from TLR9–/– mice at the third week of infection. A similar analysis was performed with samples of lymph nodes obtained from WT and TLR9–/– infected mice. The lymph nodes obtained from TLR9–/– infected mice were significantly smaller than WT mice (Figure 6A), and the expression levels of CD200 were lower than WT (Figure 6B). Notably, the levels of IL-1β, IL-12, and iNOS transcripts were significantly higher in TLR9–/– mice, showing no difference in IL-4 and IL-10 transcripts when compared to the WT mice (Figure 6C). Figure 6 TLR9-mediated CD200 expression is critical for the antiinflammatory environment in draining lymph nodes during Leishmania amazonensis infection. (A) Representative image and quantification of the diameter size of lymph nodes from WT and TLR9–/– mice infected by L. amazonensis. Results correspond to the mean ± SD (n = 4). **P < 0.0012 (Student’s t test). (B) CD200 expression levels of the lymph nodes shown in A, with the densitometric analysis of the CD200/actin ratio. The data correspond to the mean ± SD (n = 4). **P < 0.0108 (Student’s t test). (C) Cytokine profile of the draining cells from the infected lymph nodes quantified by qPCR. Results correspond to the mean ± SD (n = 4). IL-1β, **P < 0.0017; IL-12, *P < 0.0146; iNOS, **P < 0.0061; IL-4, n.s. P = 0.6431; IL-10, n.s. P = 0.1589 (Student’s t test). Collectively, the in vivo analyses indicate that TLR9 facilitates the progression of cutaneous lesions and parasite burden by inducing the expression of CD200, a ligand that inhibits the microbicidal activity of macrophages and other immune cells. Finally, we demonstrated that the impairment of CD200 expression in TLR9–/– mice reduces macrophage recruitment but increases the proinflammatory response of cytokines and iNOS in the lesions and lymph nodes. To the best of our knowledge, this is the first time that TLR9 has been directly associated with the induction of CD200 expression in L. amazonensis infection, and therefore this study represents what we believe is an entirely new mechanism of subversion of the innate immune response by Leishmania parasites. Discussion Leishmania employs different functional mechanisms to evade macrophage defenses. Here, we identified TLR9 as a key component of the molecular machinery that induces CD200 through the MyD88/TRIF signaling pathway in macrophages infected by L. amazonensis. We further demonstrate that activation of TLR9 by parasite DNA enclosed in mVEs triggers a signaling pathway that culminates in CD200 expression and inhibition of iNOS and NO production. Finally, we show that the development of advanced lesions and the recruitment of inflammatory macrophages is impaired in TLR9-deficient mice during the early stages of the infection. In this study, we show that TLR9 activation recruits 2 intracellular adaptor molecules, MyD88 and TRIF, which subsequently triggers intracellular signaling pathways that culminate with CD200 expression. The importance of MyD88 in TLR9 activation is well known (40), but only TRIF signaling is proposed to respond to high doses of CpG oligodeoxynucleotide (27). This could partially explain the differences in the CD200 inhibitory effect induced by the parasite and not by the TLR9 agonist. Although TLR9/TRIF signaling may act independently of MyD88 (27), our results suggest molecular crosstalk between MyD88 and TRIF to induce CD200 expression, regardless of the presence or activation of other TLRs. Activation of both adaptors has also been demonstrated in signaling cascades triggered by TLR4 in models of chronic diseases (41). Curiously, treatment with CD200-Fc suppresses the expression of TLR4 in macrophages (42), and noninfected TLR4–/– mouse–derived macrophages have a high expression of CD200 (Figure 2B); it is tempting to speculate that during L. amazonensis infection, TLR9 counterbalances TLR4 activation. Further studies are required to clarify this hypothesis. In Leishmania spp., shedding of EVs can inhibit the host cell response (33, 36). Our results suggest that TLR9 activation by live intracellular amastigotes of L. amazonensis is dependent on the release of mVEs containing specific DNA sequences inside the macrophage parasitophorous vacuole. TLR9 located in the endoplasmic reticulum (43, 44) traffics through the Golgi complex (45) for relocation and activation in acidified intracellular compartments (46, 47). L. amazonensis amastigotes reside within acidic parasitophorous vacuoles with lysosomal properties (48) formed with membrane contributions derived from the endoplasmic reticulum (49). We suspect that these properties can promote the rapid recruitment of TLR9. Vesicle shedding from the parasite surface is stimulated under specific conditions such as elevated temperature or contact with host molecules (50). Based on this evidence, we propose that mVEs are likely released from the surface of intracellular amastigotes inside the parasitophorous vacuole and immediately activate TLR9/MyD88/TRIF signaling pathways. Moreover, intact mVEs may also break during contact with lysosomal enzymes, which would release vesicular content into the Leishmania parasitophorous vacuole, leading to a further level of analytical complexity. In vivo, we showed that the reduction of CD200 at the site of lesions affects its progression with consequent reduction of inflammation in the proximal lymph nodes of TLR9–/– infected mice. One might suggest that such results are temporal and restricted to the early phase of L. amazonensis infection in which we detected an antiinflammatory-like immune response (IL-12lo, IL-10hi, IL-4hi), which correlates with the TLR9-mediated CD200 phenotype. At the fifth week of infection, however, the sizes of lesions in TLR9–/– mice are comparable to those in WT mice. Because the lesions from TLR9–/– mice showed a low number of parasites compared with the parasite load from WT mice (Supplemental Figure 3C), we speculate that an exacerbated antiinflammatory reaction is the main cause of tissue damage and edema rather than parasite replication itself. Notably, it was reported that deficiency of several TLRs, including TLR9, increased edema and fibrosis in a surgical model if lymphedema (51), supporting our results. Thus, in the absence of CD200 expression in our Leishmania infection model, the local immune response is unbalanced, favoring the recruitment of more proinflammatory cells that on one hand inhibits parasite growth, and on the other hand modulates healing of the damaged tissue, a process that is associated with chronic infection (52). Contrary to our observations, TLR9 has been associated with control of parasite growth in infections with Leishmania braziliensis (53) and Leishmania major (54). These differential capacities to activate TLR9 may partially explain the marked virulence disparity of several Leishmania species in different hosts. Indeed, in humans, L. braziliensis and L. major can lead to mucocutaneous and mild cutaneous forms of leishmaniasis, respectively. However, the presence of recombinant CD200-Fc in lesions caused by L. major, which cannot induce CD200 expression in macrophages, transformed these parasites into virulent pathogens that generate nonhealing, advanced lesions in vivo (11). Perhaps the ability to induce CD200 through TLR9/MyD88/TRIF signaling is the critical factor that could explain the opposite function of TLR9 in the susceptibility of L. major infection in TLR9-deficient mice (55) or the proper activation of innate immunity of NK cells against Leishmania infantum chagasi infection (56), in which models only TLR9/MyD88 signaling has been explored. In conclusion, we show that TLR9 regulates macrophage activation by linking TLRs and intracellular parasites to induce CD200 expression by L. amazonensis. Our findings demonstrate that CD200-mediated signaling is markedly reduced in TLR9–/–. Of note, it is important to be cautious regarding the TLR-mediated signaling pathway and iNOS/NO mechanism among species, particularly mouse and human. For instance, it was suggested that LPS and IFN-γ do not efficiently induce iNOS and NO in human macrophages (57), and the expression of TLR9 seems to be restricted to some human myeloid cells (58), as opposed to all myeloid cells in mice. In a mechanistic context, the work presented here provides an experimental blueprint for how host genetic composition influences Leishmania virulence. Methods Leishmania culture, purification, and mouse models. L. amazonensis (IFLA/BR/67/PH8) were propagated as promastigotes at 26°C in M199 media containing 5% penicillin/streptomycin, 0.1% hemin (25 mg/ml in 0.1N NaOH), 10 mM adenine, and 10% fetal bovine serum (FBS), at pH 7.4. To generate axenic amastigotes, stationary-phase promastigote cultures (which are enriched in metacyclic promastigotes) were incubated at 2 × 10⁶/ml in M199 media containing 0.25% glucose, 0.5% trypticase, 40 mM sodium succinate (at pH 4.5), 20% FBS, and 5% penicillin/streptomycin at 32°C for a minimum of 6 days, and then cultured axenically at 32°C. Parasites were washed 3 times in phosphate-buffered saline (PBS) before use in experiments. To obtain lesion amastigotes, female C57BL/6 mice were infected in the left hind footpad with 1 × 10⁶ L. amazonensis stationary-phase promastigotes. After 4–5 weeks, the animals were killed, and the parasites recovered from footpad lesions as described previously (5). The lesion homogenate rich in amastigotes was submitted to sequential centrifugation steps at 2,000 g to separate parasites from tissue debris. Six- to eight-week-old C57BL/6 WT female mice and MyD88–/–, TRIF–/–, TLR2–/–, TLR3–/–, TLR4–/–, and TLR9–/– (all presenting C57BL/6 background) were bred and maintained in the animal facility of the Department of Parasitology at the Institute of Biomedical Sciences, University of São Paulo. TLR2–/–, TLR3–/–, TLR4–/–, and TLR9–/– mice were provided by Dario Zamboni (Department of Biochemistry and Immunology, School of Medicine of Ribeirão Preto, University of São Paulo, Brazil). Mouse infection and quantification of parasite load. WT and TLR9–/– mice were injected in the left hind footpad with 1 × 10⁶ L. amazonensis stationary-phase promastigotes and lesion progression was followed by blinded weekly measurements with a caliper. The total number of parasites in the injected footpad was estimated by a limiting dilution assay as previously described (11) with some modifications. Footpad tissue homogenates were dissociated by incubation with collagenase (2 mg/ml, Sigma-Aldrich) in Tyrode buffer (140 mM NaCl, 5 mM KCl, 2.5 mM CaCl2, 10 mM HEPES, 2 mM MgCl2, pH 7.2) for 2 hours at 37°C under mild agitation. After collagenase dissociation, the homogenate was filtered in a Falcon 70-mm pore-size cell strainer (Corning), centrifuged at 20 g for 5 minutes, and washed 2 times with PBS (230 g, 10 minutes). The supernatant was used for cytokine quantification and the cellular pellet was suspended in 1 ml of PBS for further analyses by flow cytometry and parasite load quantification by limiting dilution. For parasite limiting dilution assays, the cell suspension was diluted 100-fold in complete M199 media, and then a 10-fold serial dilution in 96-well plates was performed. The number of viable parasites was calculated after 10 days from the highest dilution in which promastigote growth was observed. Results are presented as the log 10 of the dilution (11). BMMs, treatments, and in vitro infection. BMMs were prepared as described previously (11). Briefly, BMMs from mice were obtained after 7 days of differentiation of bone marrow in RPMI 1640 media (Gibco, Invitrogen) supplemented with 20% (v/v) FBS and 20% (v/v) L-929 cell supernatant. For macrophage infection, 2 × 10⁶ (protein extracts) or 2 × 10⁵ (IF) BMMs were plated in 6-well or 24-well dishes, respectively, 24 hours prior to experiments. For IF, BMMs were plated on glass coverslips in dishes. Lesion amastigotes were added at a multiplicity of infection (MOI) of 2 in RPMI supplemented with 10% (v/v) FBS and 2% (v/v) L-929 cell supernatant for 1 hour at 34°C. BMMs were then washed 3 times with PBS and incubated for the indicated times. In some experiments, BMMs were incubated with different molecules, such as PGN, poly I:C, LPS, CpG oligodeoxynucleotides (Invivogen), at 1 μg/ml for 1 hour. In other experiments, BMMs were stimulated with different concentrations of total DNA of L. amazonensis amastigotes for 1 hour. The parasite DNA (RNA and protein free) was extracted with the GenElute Kit (Sigma-Aldrich) as instructed by the manufacturer. After incubation with different stimuli, cell samples were obtained for protein extraction by using Pierce IP lysis buffer (Thermo Fisher Scientific) with protease inhibitor cocktail (Thermo Fisher Scientific). For quantification of in vitro infection, coverslips containing the infected cells were fixed in PBS containing 4% PFA, washed with PBS and prepared for IF. For each experiment, at least 300 cells per coverslip were counted for each assay. In vitro phagocytosis/viability assays and IF. To verify the importance of amastigote internalization and viability on CD200 induction, we performed the following pretreatment before infection assays. BMMs were pretreated with Cyto-D (Sigma-Aldrich) at 2 μM for 30 minutes at 37°C. To analyze amastigote viability on CD200 induction, parasites were kept in medium (Alive group) and treated with PBS containing 4% PFA for 10 minutes (PFA group) or inactivated by heat at 65°C for 45 minutes (Heat group). After the different treatments, the samples were washed in PBS, followed by parasite infection (MOI = 2) for 1 hour. After infection, the samples were washed and processed for IF or IP/Western blot. For IF, the samples were fixed with PBS containing 4% PFA and processed without permeabilization to recognize attached (detected by polyclonal anti-Leishmania antibodies) and internalized (not detected by polyclonal anti-Leishmania antibodies) parasites. Briefly, PFA-fixed cells in coverslips were washed with PBS, quenched with 50 mM NH4Cl for 15 minutes prior to staining with rabbit polyclonal antibodies prepared against amastigotes of L. (L.) amazonensis, followed by anti–rabbit IgG Alexa Fluor 488 (Molecular Probes). Samples were incubated with 10 μg/ml propidium iodide (Sigma-Aldrich) to detect the nuclei of all parasites and host cells. The images were acquired in a fluorescence microscope (Leica DMI6000B/AF6000) coupled to a digital camera system (DFC 365 FX, Leica) and processed by the Leica Application Suite X (LAS X) and ImageJ software (59). Quantification of the infection was made by counting a minimum of 300 cells per coverslip, with technical and biological triplicates. Results were expressed as number of parasites per 100 infected macrophages or percentage of infected macrophages. Time-lapse imaging. L. amazonensis axenic amastigotes were washed 3 times in PBS (200 g, 10 minutes) and incubated with TAMRA-SE (5 μM) and Hoechst (2.5 μM) for 1 hour at 34°C. TAMRA-loaded parasites were washed several times to discard any extracellular fluorescent marker and incubated on ice with BMM previously plated in MatTek 35-mm petri dishes containing 1.5 coverglass (MatTek Corporation). After 1 hour of cold incubation, the petri dishes were placed for time-lapse imaging on a fluorescence microscope (Leica DMI6000B/AF6000) coupled to a digital camera system (DFC 365 FX) and processed by Leica Application Suite X (LAS X) and ImageJ software. Western blot and IP. A total of 20 μg of protein/well was resolved under reducing conditions in a 12% SDS polyacrylamide gel, blotted onto nitrocellulose membranes using a Trans-blot Transfer system (Bio-Rad) for 1–2 hours at 250 mA, and probed with rabbit anti–mouse iNOS mAb (Abcam) and rabbit anti–mouse actin mAb (Imuny-VBP Biotecnologia Ltda.) followed by peroxidase-conjugated secondary antibodies (Imuny-VBP Biotecnologia Ltda.). CD200 protein detection was performed using the Pierce Crosslink Immunoprecipitation Kit as instructed by the manufacturer (Thermo Fisher Scientific). Briefly, a total of 100 μg of protein/sample was added to columns containing goat anti–mouse CD200 antibodies (R&D Systems) crosslinked to protein A/G beads. After several washes, elution buffer (35 μl) was added. The eluate samples were resolved under reducing conditions in a 12% SDS polyacrylamide gel, blotted onto nitrocellulose membranes, and probed with goat anti-CD200 antibodies followed by peroxidase-conjugated secondary antibody. Immunoblots were developed by using the Supersignal West Pico Chemiluminescent Substrate (Thermo Fisher Scientific) and detected with a ChemiDoc Imaging System (Bio-Rad) and ImageLab (Bio-Rad) software. A complete list of the antibodies used in this study can be found in Supplemental Table 1. qPCR. Lymph nodes were ground in a Medimachine (Becton Dickson) and mechanically dissociated using a pellet pestle in complete PBS. Tissue homogenates were filtered in a 70-μm pore-size cell strainer (Falcon Products, Inc.) and divided into 2 samples of protein extracts for Western blot/IP analysis and RNA isolation for qPCR. The RNA extraction and purification were performed using the Quick-RNA MiniPrep kit (Zymo Research) according to manufacturer specifications. Quantification was carried out in a NanoDrop instrument (Thermo Fisher Scientific) and the complementary deoxyribonucleic acid (cDNA) synthesis was performed using the SuperScript III Reverse Transcriptase kit (Invitrogen). qPCR was performed in a StepOnePlus Real-Time PCR System (Applied Biosystems) using Maxima SYBR Green/ROX qPCR Master Mix (Thermo Fisher Scientific) according to the manufacturer’s instructions. Oligonucleotide primers are presented in Supplemental Figure 4F. The reaction was incubated for 10 minutes at 95°C and then for 40 cycles of 15 seconds at 95°C, 30 seconds at 55°C, and 30 seconds at 72°C. Fluorescence was detected at each annealing step. Technical triplicates were performed for each reaction and negative controls were included. The data are presented as relative quantification normalized by the level of Hprt1 expression, calculated using 2–ΔΔCt (60). NO measurement. BMMs were incubated with LPS at 500 ng/ml (Invivogen) for 6 hours at 37°C and 5% CO2. After incubation, cells were washed 3 times with PBS and subjected to L. amazonensis infection or stimulated as indicated. BMMs in these conditions were incubated and maintained for 42 hours. Cells were processed for protein extraction, and the supernatant was centrifuged and filtered for nitrite quantification. Nitrite concentrations in BMMs culture supernatants were used as a measure of NO production and quantified by using a Measure-iT High-Sensitivity Nitrite Assay Kit (Thermo Fisher Scientific) as instructed by the manufacturer. The fluorescence signal was measured at 450 nm after excitation at 365 nm. The NO concentration in each sample was calculated from a standard calibration curve as instructed by the manufacturer. Isolation and characterization of EVs. L. amazonensis axenic amastigotes were washed 3 times in PBS (200 g, 10 minutes), and a total of 1 × 10⁹ parasites were incubated for 2 hours at 34°C in amastigote medium, which was previously filtered and ultracentrifuged at 100,000 g to eliminate vesicles from FBS, for EV release. Amastigotes were then removed by centrifugation (200 g, 10 minutes), fixed, and analyzed by SEM or TEM, as described previously (61, 62). EV-containing supernatants were filtered through a 0.45-μm sterile cell strainer and used for NTA characterization or incubation assays for CD200 induction in BMMs. Size, distribution, and concentration of isolated vesicles were analyzed as described previously (63). Briefly, EVs in the supernatants were measured in a Nanosight NS300 instrument (Malvern Instruments Ltd) equipped with a 405-nm laser and coupled to a CCD camera (the laser emitting a 60-mW beam at 405-nm wavelength). Data were analyzed using the NTA software (version 2.3 build 0017). The detection threshold was set to 10. Blur, Min track Length, and Min Expected Particle Size were set to auto. To perform the measurements, samples were diluted 100-fold with PBS. Readings were taken in triplicate for 30 seconds at 20 frames per second, with the camera level set to 14 and manual monitoring of temperature (19°C). The EV purity was analyzed mainly by both the size of the released EVs (NTA) and by SEM of the vesicles released by the parasite. Purified EVs or total shed material was used in BMM stimulation assays for CD200 induction. The filtered supernatants were centrifuged 100,000 g, 1 hour (rotor 70.1T, XL-100K Ultracentrifuge, Beckman Coulter) to concentrate the EVs, which were then resuspended in RPMI 1640 supplemented with 10% (v/v) filtered and ultracentrifuged FBS. In another set of experiments, DNA from mVEs (RNA and protein free) was extracted using the GenElute Kit (Sigma-Aldrich) as instructed by the manufacturer. After incubation with mVEs or VEs-DNA (1 μg/ml), BMMs were processed for CD200 detection by IF/Western blot as described previously (11). Cytokine analysis. IL-1β, IL-4, IL-6, IL-10, IL-12p40, IL-12p70, IFN-γ, and TNF-α levels were determined with OptEIA ELISA sets (BD Biosciences). All analyses were performed according to the manufacturer’s recommendations. Values were expressed as pg/g of lesion tissue deduced from standard curves of each recombinant cytokine. Flow cytometry. Cells isolated from footpad lesions after collagenase digestion were counted, suspended in PBS containing 2% FBS and anti–mouse CD16/CD32 to block Fc receptors. Cells were then stained with fluorescence-conjugated antibodies for the surface markers CD45, CD11b, CD11c, MHC class II, F4/80, and CD200 (BD Biosciences) for 30 minutes at 4°C in the dark. After washes, cells were resuspended and transferred to polypropylene tubes (12 × 75 mm). Data were acquired in a FACSCanto II flow cytometer (BD Biosciences) and analyzed using FlowJo software, version 10.0.7 (Tree Star Inc.). Statistics. Data were analyzed with commercial software (GraphPad Software Prism 6.0). Two-way ANOVA with Sidak’s post hoc test was used when analyzing multiple groups. In some results, 1-way ANOVA with Tukey’s post hoc test or 2-tailed Student’s t test was used. P values of 0.05 or less were considered statistically significant. All experiments were repeated at least 3 times and representative data are presented, unless otherwise specified. Study approval. All experiments were carried out in accordance with internationally recognized guidelines and in full agreement with local regulations (Brazilian Federal Law 11,794, Decree 6,899 and Normative Resolutions published by the National Council for the Control of Animal Experimentation [CONCEA]), and approved by the Institutional Animal Care and Use Committee (IACUC) of the University of São Paulo under protocol number 95/2013. Author contributions IPS, DIS, and MC conceived and designed the project. IPS, KGM, MC, JBA, ASN, and ACT performed experiments. IPS, KGM, JBA, ASN, ACT, DIS, RP, WA, and MC analyzed data. IPS, DIS, RP, WA, and MC wrote and/or edited the manuscript. All authors read and agreed with the manuscript content. Supplemental material Acknowledgments We thank Dario Zamboni (FMRP-USP) for the gift of TLR–/– mice, Mario Cruz (Imaging Core CEFAP-ICB-USP) for assistance with confocal microscopy, and Norma W. Andrews for critical discussions and review of the manuscript draft. We thank Brandi Mattson (Life Science Editors) for professional editorial services. We also thank Thalita Camelo da Silva Ferreira for the edition and design of the graphical abstract. This work was supported by FAPESP grant 2012/24105-3, CNPq Universal grant 443816/2014-0 (to MC), partially financed by CAPES- Finance Code 001, and by award from the Gillson-Longenbaugh Foundation (to RP and WA). Footnotes Conflict of interest: The authors have declared that no conflict of interest exists. Copyright: © 2019 American Society for Clinical Investigation Reference information: JCI Insight. 2019;4(10):e126207. https://doi.org/10.1172/jci.insight.126207. References Akira S. TLR signaling. Curr Top Microbiol Immunol. 2006;311:1–16. View this article via: PubMed Google Scholar Janeway CA, Medzhitov R. Innate immune recognition. Annu Rev Immunol. 2002;20:197–216. View this article via: PubMed CrossRef Google Scholar Liu D, Uzonna JE. The early interaction of Leishmania with macrophages and dendritic cells and its influence on the host immune response. Front Cell Infect Microbiol. 2012;2:83. View this article via: PubMed Google Scholar Moradin N, Descoteaux A. Leishmania promastigotes: building a safe niche within macrophages. Front Cell Infect Microbiol. 2012;2:121. View this article via: PubMed Google Scholar Sacks DL, Melby PC. Animal models for the analysis of immune responses to leishmaniasis. Curr Protoc Immunol. 2001;Chapter 19:Unit 19.2. View this article via: PubMed Google Scholar Loeuillet C, Bañuls AL, Hide M. Study of Leishmania pathogenesis in mice: experimental considerations. Parasit Vectors. 2016;9:144. View this article via: PubMed Google Scholar Alvar J, et al. Leishmaniasis worldwide and global estimates of its incidence. PLoS ONE. 2012;7(5):e35671. View this article via: PubMed CrossRef Google Scholar Hartley MA, Drexler S, Ronet C, Beverley SM, Fasel N. The immunological, environmental, and phylogenetic perpetrators of metastatic leishmaniasis. Trends Parasitol. 2014;30(8):412–422. View this article via: PubMed CrossRef Google Scholar Teixeira DE, Benchimol M, Rodrigues JC, Crepaldi PH, Pimenta PF, de Souza W. The cell biology of Leishmania: how to teach using animations. PLoS Pathog. 2013;9(10):e1003594. View this article via: PubMed CrossRef Google Scholar Silveira FT, Lainson R, De Castro Gomes CM, Laurenti MD, Corbett CE. Immunopathogenic competences of Leishmania (V.) braziliensis and L. (L.) amazonensis in American cutaneous leishmaniasis. Parasite Immunol. 2009;31(8):423–431. View this article via: PubMed CrossRef Google Scholar Cortez M, Huynh C, Fernandes MC, Kennedy KA, Aderem A, Andrews NW. Leishmania promotes its own virulence by inducing expression of the host immune inhibitory ligand CD200. Cell Host Microbe. 2011;9(6):463–471. View this article via: PubMed CrossRef Google Scholar Barclay AN, Wright GJ, Brooke G, Brown MH. CD200 and membrane protein interactions in the control of myeloid cells. Trends Immunol. 2002;23(6):285–290. View this article via: PubMed CrossRef Google Scholar Gorczynski RM. CD200 and its receptors as targets for immunoregulation. Curr Opin Investig Drugs. 2005;6(5):483–488. View this article via: PubMed Google Scholar Yang Y, et al. Loss of neuronal CD200 contributed to microglial activation after acute cerebral ischemia in mice. Neurosci Lett. 2018;678:48–54. View this article via: PubMed CrossRef Google Scholar Foster-Cuevas M, Wright GJ, Puklavec MJ, Brown MH, Barclay AN. Human herpesvirus 8 K14 protein mimics CD200 in down-regulating macrophage activation through CD200 receptor. J Virol. 2004;78(14):7667–7676. View this article via: PubMed CrossRef Google Scholar Hoek RM, et al. Down-regulation of the macrophage lineage through interaction with OX2 (CD200). Science. 2000;290(5497):1768–1771. View this article via: PubMed CrossRef Google Scholar Minas K, Liversidge J. Is the CD200/CD200 receptor interaction more than just a myeloid cell inhibitory signal? Crit Rev Immunol. 2006;26(3):213–230. View this article via: PubMed CrossRef Google Scholar Aref S, Azmy E, El-Gilany AH. Upregulation of CD200 is associated with regulatory T cell expansion and disease progression in multiple myeloma. Hematol Oncol. 2017;35(1):51–57. View this article via: PubMed CrossRef Google Scholar Elshal MF, Aldahlawi AM, Saadah OI, McCoy JP. Reduced dendritic cells expressing CD200R1 in children with inflammatory bowel disease: correlation with Th17 and regulatory T cells. Int J Mol Sci. 2015;16(12):28998–29010. View this article via: PubMed CrossRef Google Scholar Liew FY, Millott S, Parkinson C, Palmer RM, Moncada S. Macrophage killing of Leishmania parasite in vivo is mediated by nitric oxide from L-arginine. J Immunol. 1990;144(12):4794–4797. Wei XQ, et al. Altered immune responses in mice lacking inducible nitric oxide synthase. Nature. 1995;375(6530):408–411. View this article via: PubMed CrossRef Google Scholar Casella JF, Flanagan MD, Lin S. Cytochalasin D inhibits actin polymerization and induces depolymerization of actin filaments formed during platelet shape change. Nature. 1981;293(5830):302–305. View this article via: PubMed CrossRef Google Scholar Gurung P, Li B, Subbarao Malireddi RK, Lamkanfi M, Geiger TL, Kanneganti TD. Chronic TLR stimulation controls NLRP3 inflammasome activation through IL-10 mediated regulation of NLRP3 expression and caspase-8 activation. Sci Rep. 2015;5:14488. View this article via: PubMed Google Scholar Hemmi H, et al. A Toll-like receptor recognizes bacterial DNA. Nature. 2000;408(6813):740–745. View this article via: PubMed CrossRef Google Scholar Sharma S, Fitzgerald KA, Cancro MP, Marshak-Rothstein A. Nucleic acid-sensing receptors: rheostats of autoimmunity and autoinflammation. J Immunol. 2015;195(8):3507–3512. View this article via: PubMed CrossRef Google Scholar Troutman TD, Bazan JF, Pasare C. Toll-like receptors, signaling adapters and regulation of the pro-inflammatory response by PI3K. Cell Cycle. 2012;11(19):3559–3567. View this article via: PubMed CrossRef Google Scholar Volpi C, et al. High doses of CpG oligodeoxynucleotides stimulate a tolerogenic TLR9-TRIF pathway. Nat Commun. 2013;4:1852. View this article via: PubMed Google Scholar Ahmad-Nejad P, Häcker H, Rutz M, Bauer S, Vabulas RM, Wagner H. Bacterial CpG-DNA and lipopolysaccharides activate Toll-like receptors at distinct cellular compartments. Eur J Immunol. 2002;32(7):1958–1968. View this article via: PubMed CrossRef Google Scholar Rutz M, et al. Toll-like receptor 9 binds single-stranded CpG-DNA in a sequence- and pH-dependent manner. Eur J Immunol. 2004;34(9):2541–2550. View this article via: PubMed CrossRef Google Scholar Jiang L, et al. CD200Fc reduces TLR4-mediated inflammatory responses in LPS-induced rat primary microglial cells via inhibition of the NF-κB pathway. Inflamm Res. 2016;65(7):521–532. View this article via: PubMed CrossRef Google Scholar Atayde VD, et al. Leishmania exosomes and other virulence factors: Impact on innate immune response and macrophage functions. Cell Immunol. 2016;309:7–18. View this article via: PubMed CrossRef Google Scholar Hassani K, Shio MT, Martel C, Faubert D, Olivier M. Absence of metalloprotease GP63 alters the protein content of Leishmania exosomes. PLoS ONE. 2014;9(4):e95007. View this article via: PubMed CrossRef Google Scholar Silverman JM, et al. Leishmania exosomes modulate innate and adaptive immune responses through effects on monocytes and dendritic cells. J Immunol. 2010;185(9):5011–5022. View this article via: PubMed CrossRef Google Scholar Kowal J, Tkach M, Théry C. Biogenesis and secretion of exosomes. Curr Opin Cell Biol. 2014;29:116–125. View this article via: PubMed CrossRef Google Scholar Raposo G, Stoorvogel W. Extracellular vesicles: exosomes, microvesicles, and friends. J Cell Biol. 2013;200(4):373–383. View this article via: PubMed CrossRef Google Scholar Hassani K, Olivier M. Immunomodulatory impact of leishmania-induced macrophage exosomes: a comparative proteomic and functional analysis. PLoS Negl Trop Dis. 2013;7(5):e2185. View this article via: PubMed CrossRef Google Scholar Silverman JM, Reiner NE. Leishmania exosomes deliver preemptive strikes to create an environment permissive for early infection. Front Cell Infect Microbiol. 2011;1:26. View this article via: PubMed Google Scholar Atayde VD, Aslan H, Townsend S, Hassani K, Kamhawi S, Olivier M. Exosome secretion by the parasitic protozoan Leishmania within the sand fly midgut. Cell Rep. 2015;13(5):957–967. View this article via: PubMed CrossRef Google Scholar Ji J, Sun J, Soong L. Impaired expression of inflammatory cytokines and chemokines at early stages of infection with Leishmania amazonensis. Infect Immun. 2003;71(8):4278–4288. View this article via: PubMed CrossRef Google Scholar Rogers GL, et al. Unique roles of TLR9- and MyD88-dependent and -independent pathways in adaptive immune responses to AAV-mediated gene transfer. J Innate Immun. 2015;7(3):302–314. View this article via: PubMed CrossRef Google Scholar Kim S, et al. Signaling of high mobility group box 1 (HMGB1) through toll-like receptor 4 in macrophages requires CD14. Mol Med. 2013;19:88–98. View this article vi
|
|
Scooped by
Gilbert C FAURE
June 10, 2019 1:33 PM
|
Vascularized composite allotransplantation (VCA) has emerged as the most recent field of transplantation to offer an alternative treatment for those p…
|
|
Scooped by
Gilbert C FAURE
June 8, 2019 1:30 AM
|
Vaccine. 2019 Jan 3;37(1):113-122. doi: 10.1016/j.vaccine.2018.11.024. Epub 2018 Nov 17. Research Support, Non-U.S. Gov't
|
|
Suggested by
Société Francaise d'Immunologie
June 7, 2019 2:02 PM
|
First described over two decades ago, the Interleukin-17 (IL-17) cytokine family are strong inducers of inflammation and play a pivotal role in host defense against microbial infection. Yet in stark contrast to this essential protective function, they are implicated in the pathogenesis of various chronic inflammatory and autoimmune diseases and have also demonstrated a contributory role in cancer. Now recognized as important therapeutic targets, IL-17 cytokines are widely-studied across a diversity of research areas. High-quality IL-17 reagents are fundamental to support this work. Discovery of IL-17 cytokines The gene encoding IL-17A was first discovered in 1993. Then termed CTLA-8, and subsequently renamed as IL-17 and then IL-17A, the encoded protein represents the first of six IL-17 family members to be described. The IL-17 cytokine family is now known to consist of IL-17A through to IL-17F. Following its discovery, IL-17A was linked to inflammation by the demonstration that it could stimulate epithelial, endothelial, and fibroblastic cells to secrete potent inflammatory cytokines such as IL-6, IL-8, and GM-CSF. It was also shown to drive the maturation of CD34+ hematopoietic progenitors into neutrophils, key mediators of inflammation which perform a crucial role in the innate immune response. Role in the host immune response IL-17 cytokines are produced by T-helper 17 (Th17) cells. These originate from naïve CD4+ T-cells following host infection with a pathogen such as a bacterium or fungus. It is important to note that IL-17 production is not exclusive to Th17 cells, since CD8+ T-cells and γδ T cells (innate immune cells that play important roles at the mucosal barrier) also produce IL-17 cytokines. Despite their low abundance, γδ T cells are often the main source of IL-17A in various inflammatory disease models. IL-17 cytokines exert their role in host defense primarily through the induction of anti-microbial molecules and mediation of neutrophil recruitment at the site of infection. This is achieved through binding to IL-17 receptors (IL-17R). Found on a wide variety of cell types, the IL-17 receptor family consists of five variants (IL-17RA through IL-17RE). These perform distinct signaling functions. Role in disease IL-17 cytokines are known to contribute to the pathogenesis of many inflammatory and autoimmune disease conditions. These include psoriasis, rheumatoid arthritis, multiple sclerosis and Crohn’s disease. The IL-17 cytokine family also has a prominent role in promoting carcinogenesis, tumor metastasis and resistance to chemotherapy, making IL-17 cytokines attractive targets for oncology research. The first therapeutic antibody against IL-17A – Secukinumab for the treatment of psoriasis – was approved in 2015. However, despite sharing similar immune characteristics, inflammatory bowel disease has not been successfully treated with this drug. This highlights the complexity of IL-17 cytokine signaling and indicates the need for ongoing IL-17 research. With many other therapeutic agents targeting IL-17 cytokines currently under development, trusted reagents to support this work are essential. Supporting IL-17 research Offering a wide range of high-quality reagents, Cell Sciences is your partner of choice for IL-17 research. Included within our IL-17 product portfolio are: ELISA kits ELISpot kits Antibodies (including matched antibody pairs) Recombinant cytokines Standard curve generated using human IL-17A ELISA kit (CDK043). One of our most popular IL-17 products, CDK043 recognizes both native and recombinant IL-17A with sensitivity <10 pg/mL. Calibrated against the International Reference Standard NIBSC 01/420 IL-17A to assure product quality, CDK043 demonstrates no cross-reactivity with other cytokines and delivers robust and reproducible data in under 4 hours. Other popular IL-17 products include: ELISA & ELISpot Kits Human IL-17F ELISA kit (CDK044) Human IL-17A/IL-17F ELISA kit (CDK045) Mouse IL-17A ELISA kit (CDK070) Human IL-17 ELISA kit (CKH157) Mouse IL-17A Total Antigen ELISA kit (CS451) Human IL-17A ELISpot kit (CDK117) Human IL-17F ELISpot kit (CDK119) Antibodies Neutralizing anti-Human IL-17A, clone B-B51 (CDM114) Neutralizing anti-Human IL-17F clone B-F60 (CDM288) Rabbit anti-Human IL-17 pAb (PA0692) Rabbit anti-Human IL-17E pAb (PA0694) Matched Antibody Pair for Human IL-17A ELISA (CDK089) Recombinant Proteins Recombinant Human IL-17A (CRI231) Recombinant Human IL-17AF Heterodimer (CS307) Recombinant Human IL-25/IL-17E (CRI196) Recombinant Human IL-17F (CRI197) Recombinant Human IL-17B (CRI198B) To learn more about our human IL-17A ELISA kit, or any of our IL-17 products, contact us today.
|
|
Suggested by
Société Francaise d'Immunologie
June 7, 2019 2:00 AM
|
Abstract The transcription factor Helios is expressed in a large percentage of Foxp3+ regulatory T (Treg) cells and is required for the maintenance of their suppressive phenotype, as mice with a selective deficiency of Helios in Treg cells spontaneously develop autoimmunity. However, mice with a deficiency of Helios in all T cells do not exhibit autoimmunity, despite the defect in the suppressor function of their Treg cell population, suggesting that Helios also functions in non-Treg cells. Although Helios is expressed in a small subset of CD4+Foxp3− and CD8+ T cells and its expression is upregulated upon T cell activation, its function in non-Treg cells remains unknown. To examine the function of Helios in CD4+Foxp3− T cells, we transferred Helios-sufficient or -deficient naive CD4+Foxp3− TCR transgenic T cells to normal recipients and examined their capacity to respond to their cognate Ag. Surprisingly, Helios-deficient CD4+ T cells expanded and differentiated into Th1 or Th2 cytokine-producing effectors in a manner similar to wild-type TCR transgenic CD4+ T cells. However, the primed Helios-deficient cells failed to expand upon secondary challenge with Ag. The tolerant state of the Helios-deficient memory T cells was not cell-intrinsic but was due to a small population of Helios-deficient naive T cells that had differentiated into Ag-specific peripheral Treg cells that suppressed the recall response in an Ag-specific manner. These findings demonstrate that Helios plays a role in the determination of CD4+ T cell fate.
|
|
Suggested by
Société Francaise d'Immunologie
May 24, 2019 3:48 AM
|
KEY POINTS Dectin-1 clustering via CD82 enables robust downstream Dectin-1 signaling. Lack of CD82 reduces macrophage fungal killing and survival of Candida infection. CD82 SNPs modulate cytokine production or risk of Candida infections. Visual Abstract Abstract Tetraspanins are a family of proteins possessing four transmembrane domains that help in lateral organization of plasma membrane proteins. These proteins interact with each other as well as other receptors and signaling proteins, resulting in functional complexes called “tetraspanin microdomains.” Tetraspanins, including CD82, play an essential role in the pathogenesis of fungal infections. Dectin-1, a receptor for the fungal cell wall carbohydrate β-1,3-glucan, is vital to host defense against fungal infections. The current study identifies a novel association between tetraspanin CD82 and Dectin-1 on the plasma membrane of Candida albicans–containing phagosomes independent of phagocytic ability. Deletion of CD82 in mice resulted in diminished fungicidal activity, increased C. albicans viability within macrophages, and decreased cytokine production (TNF-α, IL-1β) at both mRNA and protein level in macrophages. Additionally, CD82 organized Dectin-1 clustering in the phagocytic cup. Deletion of CD82 modulates Dectin-1 signaling, resulting in a reduction of Src and Syk phosphorylation and reactive oxygen species production. CD82 knockout mice were more susceptible to C. albicans as compared with wild-type mice. Furthermore, patient C. albicans–induced cytokine production was influenced by two human CD82 single nucleotide polymorphisms, whereas an additional CD82 single nucleotide polymorphism increased the risk for candidemia independent of cytokine production. Together, these data demonstrate that CD82 organizes the proper assembly of Dectin-1 signaling machinery in response to C. albicans. This article is featured in In This Issue, p.3123 Footnotes ↵1 J.M.T. and J.L.R. equal contribution to manuscript. This work was supported by National Institutes of Health Grants 5R01 AI092084 and 1R01 AI097519 (to J.M.V.), 1R01 AI132638 (to M.K.M.), and T32 A1007061-35 (to J.L.R.), a KL2/Catalyst Medical Research Investigator Training award (an appointed KL2 award) from Harvard Catalyst | The Harvard Clinical Translational Science Center (National Center for Research Resources and the National Center for Advancing Translational Sciences, National Institutes of Health, Award KL2 TR001100 [to J.L.R.]), and National Institutes of Health Training Grant T32 HL116275 (to M.B.F.). M.G.N. was supported by a Spinoza Prize from the Netherlands Organization for Scientific Research. The content is solely the responsibility of the authors and does not necessarily represent the official views of Harvard Catalyst, Harvard University and its affiliated academic healthcare centers, or the National Institutes of Health. The online version of this article contains supplemental material. Abbreviations used in this article: BMDM bone marrow–derived macrophage co-IP coimmunoprecipitation/coimmunoprecipitated FLP fungal-like particle HKCA heat-killed C. albicans MGH Massachusetts General Hospital MOI multiplicity of infection PLA proximity ligation assay PRR pattern recognition receptor ROS reactive oxygen species SNP single nucleotide polymorphism STORM stochastic optical reconstruction microscopy Syk spleen tyrosine kinase TEM tetraspanin-enriched microdomain WT wild-type YPD yeast extract peptone dextrose. Received October 15, 2018. Accepted March 26, 2019. Copyright © 2019 by The American Association of Immunologists, Inc.
|
|
Scooped by
Gilbert C FAURE
May 23, 2019 6:50 AM
|
Tfh cells are the CD4+ T cells specialized for helping B cells. Bcl6 was identified
as the Tfh lineage-defining transcription factor 10 years ago. Crotty reviews the
extensive progress made in understanding Tfh cells since then, including surprising
roles of Tfh cells in a range of diseases.
|


 Scoop.it!