Your new post is loading...

|
Scooped by
Gilbert C FAURE
January 9, 2021 1:03 PM
|
COVID-19 has been occasionally linked to histologically confirmed cutaneous vasculitis
and a Kawasaki-like vasculitis, with these entities generally having minimal or no
lung involvement and a good prognosis.
|
|
Scooped by
Gilbert C FAURE
January 9, 2021 6:30 AM
|
▪ Abstract Work done in the late 1950s and in the 1960s revealed the role of the thymus in virus-induced leukemia in mice. Thymectomizing mice at birth to test whether the virus first multiplied in...
|
|
Scooped by
Gilbert C FAURE
January 9, 2021 6:27 AM
|
Significance Light zone (LZ) B cells are selected in germinal centers (GCs) in a cMyc-dependent manner, before dark zone (DZ) migration. Antigen affinity of B cells is enhanced during GC responses, and some differentiate into plasmablasts or memory B cells (MBCs). Currently, GC selection is presumed as a competitive affinity-dependent process. This cannot explain retention of GC B cells with varied affinities. We identified cMyc+ LZ B cell subpopulations enriched with either higher-affinity plasmablast precursors or lower-affinity MBC precursors and future DZ entrants, which diverged soon after permissive selection. Future DZ entrants’ affinity was enhanced through preferential proliferation of higher-affinity cells, and lower-affinity cells were retained in GCs. These findings elucidate mechanistically how GC selection ensures clonal diversity for broad protection. Abstract Affinity maturation depends on how efficiently germinal centers (GCs) positively select B cells in the light zone (LZ). Positively selected GC B cells recirculate between LZs and dark zones (DZs) and ultimately differentiate into plasmablasts (PBs) and memory B cells (MBCs). Current understanding of the GC reaction presumes that cMyc-dependent positive selection of LZ B cells is a competitive affinity-dependent process; however, this cannot explain the production of GC-derived lower-affinity MBCs or retention of GC B cells with varied affinities. Here, by combining single-cell/bulk RNA sequencing and flow cytometry, we identified and characterized temporally and functionally distinct positively selected cMyc+ GC B cell subpopulations. cMyc+ LZ B cell subpopulations enriched with either higher- or lower-affinity cells diverged soon after permissive positive selection. The former subpopulation contained PB precursors, whereas the latter comprised less proliferative MBC precursors and future DZ entrants. The overall affinity of future DZ entrants was enhanced in the LZ through preferential proliferation of higher-affinity cells. Concurrently, lower-affinity cells were retained in GCs and protected from apoptosis. These findings redefine positive selection as a dynamic process generating three distinct B cell fates and elucidate how positive selection ensures clonal diversity for broad protection. B cells substantially increase their affinity for the antigen during the course of T cell-dependent immune responses. This fine-tuning of antibody specificity is known as affinity maturation (1, 2) and occurs in germinal centers (GCs) through a bidirectional migration cycle between two phenotypically and anatomically distinct regions of GCs, light zone (LZ) and dark zone (DZ) (3). GC B cells exit cell cycle upon their transit from the DZ to the LZ where antigen-driven selection occurs in response to signals from B cell receptor (BCR) engagement and T follicular helper cells (TFHs). Positively selected GC B cells in the LZ acquire cMyc (avian myelocytomatosis virus oncogene cellular homolog) expression, a critical regulator for cell proliferation and GC maintenance, as “licensed” cells (4, 5), which are protected from apoptosis (6). The transient cMyc expression leads the positively selected LZ B cells to reenter the DZ where cells proliferate and hypermutate their BCRs to improve affinity for the antigen. In the currently favored model of affinity maturation, positive selection occurs in an affinity-dependent manner in the LZ (7, 8). GC B cells retrieve antigen displayed on follicular dendritic cells (FDCs), internalize the BCR that binds antigen, and present differing levels of antigen in the form of peptide major histocompatibility II in proportion to its affinity, which allows clones with relatively higher BCR affinity to receive more help from TFHs whose number is limited (8⇓–10). Indeed, positively selected cMyc+ GC B cells in the LZ express BCRs with higher affinity for the antigen compared with cMyc-negative LZ cells (4). cMyc+ GC B cells in the LZ restart the cell cycle and are primed to enter the DZ to complete cell division (4, 5, 11). Hence, the competitive advantage of the selected higher-affinity BCR clones is thought to occur only in the DZ where they undergo more rounds of cell division in enhanced tempo during prolonged dwell time (12, 13). However, this model cannot explain recent findings showing that GCs can retain cells expressing low- and moderate-affinity BCRs while antibody affinity is improved (14, 15). Additionally, within this model the roles of dividing LZ B cells that were observed in histology and two-photon microscopy experiments (7, 16⇓⇓–19) remain unknown. cMyc expression in GC B cells effectively defines positively selected B cells (4, 5). However, this population is suggested to be developmentally heterogeneous (20, 21), with at least one of the subfractions requiring strong signals derived from TFHs for its generation (21). Consistent with this, increased TFHs help drives plasmablast (PB)/plasma cell (PC) differentiation from GC B cells (10) that carry higher-affinity BCRs (22) through recently identified PC precursors (Bcl6loCD69hi LZ GC B cells) expressing cMyc transcripts at a relatively higher level than the other LZ B cells (23). Taken together, these observations suggest that the cMyc+ compartment contains PB/PC precursors as well as DZ entrants and therefore, is heterogeneous regarding B cell differentiation stage and BCR affinity. In contrast to PBs/PCs, memory B cells (MBCs) appear to be formed in response to a minimal amount of help from TFHs (24) and predominantly contain lower-affinity clones (24, 25). Together with the observation that MBC precursors are relatively quiescent (24⇓–26), MBCs are generally thought to arise from “nonpositively selected” LZ B cells. However, some MBC precursors have been found to carry higher-affinity BCRs (25), suggesting that a fraction of MBCs may also arise from positively selected LZ B cells. However, it remains unclear how MBCs are formed and thus, whether MBC precursors can emerge from positively selected cells. In this study, we identified positively selected cMyc+ LZ B cells that comprise subpopulations representing three distinct B cells fates (pre-PB/PCs, pre-MBCs, and DZ entrants), and these subpopulations emerged in a sequential order following cMyc-inducing signals. In-depth analyses of these subpopulations demonstrated that GC positive selection is permissive to retaining a large proportion of low-affinity clones that are protected from apoptosis despite their low-affinity BCR. Sequential molecular and mitotic events in the cMyc+ LZ B cell compartment determined B cell fates and improved affinity of future DZ entrants. Hence, the manner of such dynamic positive selection can be beneficial to maintain clonal breadth and also advantageous for selecting antigen-specific cells to differentiate into MBCs. Results Identification and Flow Cytometric Delineation of Positively Selected cMyc+ GC B Cell Subpopulations. To investigate the heterogeneity of cMyc+ GC B cell compartment, we utilized cMycgfp/gfp reporter mice that express a GFP-cMyc fusion protein from the endogenous cMyc locus and allow monitoring of cMyc expression by GFP fluorescence (27). Splenic cMyc+ GC B cells from cMycgfp/gfp mice were sorted by flow cytometry 10 d after immunization with (4-hydroxy-3-nitrophenyl)acetyl (NP) hapten conjugated to chicken gamma globulin (NP-CGG) and were subjected to single-cell RNA sequencing (scRNAseq) (Fig. 1A). Transcriptomic profiling and unsupervised clustering of 205 cells revealed 678 differentially expressed genes (DEGs) by multigroup comparison (P ≤ 0.05) and five clusters (cMyc+#1, #2, #3, #4, and #5) within cMyc+ GC B cells (SI Appendix, Fig. S1 A and B). The t-Distributed Stochastic Neighbor Embedding (t-SNE) plot indicated that cells in the cMyc+#5 cluster represented an intermediate state between the cMyc+#4 and cMyc+#2 clusters (SI Appendix, Fig. S1A). We excluded the cMyc+#5 cluster from the scRNAseq dataset and focused on cMyc+ clusters #1 to #4 for further analysis (Fig. 1B and SI Appendix, Fig. S1C) because clear-cut markers could not be identified for the cMyc+#5 cluster (SI Appendix, Fig. S1B). Transcriptomic analysis of cells in these clusters revealed 547 DEGs by multigroup comparison (P ≤ 0.05), and 9 or 10 representative DEGs per cluster were depicted after further filtering out the DEGs by two-group comparison (P ≤ 0.05) with more than twofold change (Fig. 1B). The representative DEGs of the clusters included activation marker genes (Cd86, Cd83, and CD69), early-response genes (Nfkbia), genes involved in cell cycle regulation (Ccnd2 and CDC37), immunoregulatory molecules (Fcer2a; encoding CD23 and Cr2; encoding CD21/CD35), and chemokine receptors (Cxcr5 and Cxcr4) (Fig. 1B). It has been shown that Cd86, Cd83, Fcer2a, and Cxcr5 are highly expressed in LZ B cells (10) and that CD69, Nfkbia, and Ccnd2 are up-regulated in cMyc+ GC B cells (4, 5). To investigate distinctive biological features of the clusters, we performed Gene Set Enrichment Analysis (GSEA). This analysis revealed that the cMyc+#1 cluster appeared to be associated with PBs/PCs due to the high level of expression of the genes involved with interleukin (IL)-6 production and activation of nuclear factor kappa B (NF-κB) signaling, which are known to have critical roles for differentiation of PBs/PCs (28, 29) (SI Appendix, Fig. S1B). The cMyc+#1 cluster also expressed Cd69 at the highest level among all the clusters (Fig. 1B), which was concordant with previously reported PB/PC precursors (23). In the cMyc+#2 cluster, genes associated with stress response caused by DNA damage and oxidation were significantly enriched (SI Appendix, Fig. S1D). Responses to DNA damage and oxidative stress are known to occur mainly in the DZ (30, 31), suggesting that the cMyc+#2 cluster represented cMyc+ DZ B cells. The cMyc+#3 cluster was characterized by high expression of the LZ markers Fcer2a (CD23) and Cd86 (Fig. 1B). The expression of CD23 on B cells is known to be increased by CD40 ligation (32) and IL-4 stimulation (33), suggesting that cells in the cMyc+#3 cluster represent a cMyc+ LZ B cell population that has received T cell help more recently. In support of this, the cMyc+#3 cluster was also found to be enriched with genes associated with both “B cell receptor signaling pathway” and “immunological synapse” and thus, may represent an LZ subpopulation in the very early activation following BCR engagement and GC B/TFH interaction (SI Appendix, Fig. S1D). The cMyc+#4 cluster was characterized by relatively high expression of Cdc37, an Hsp90 cochaperone, and was enriched in genes associated with protein synthesis (Fig. 1B and SI Appendix, Fig. S1D). Therefore, this cluster may represent a population of cMyc+ LZ B cells that had been activated less recently than the cMyc+#3 cluster and were preparing for intensive cycling in the DZ, which is in agreement with decreased expression of genes associated with “immunological synapse” in the cluster (SI Appendix, Fig. S1D). Fig. 1. Identification and flow cytometric delineation of positively selected cMyc+ GC B cell subpopulations. (A) scRNAseq workflow and gating strategy for isolating splenic cMyc+ GC B cells of cMycgfp/gfp mice. (B) Heat map illustrating highly representative DEGs in each cluster. These DEGs passed thresholds: first, the cutoff for P ≤ 0.05 by multigroup comparison and second, for P ≤ 0.05 by two-group comparison (the cluster vs. ≠ the cluster) and log2 fold change >1. Fcer2a was the eighth enriched gene in the cMyc+#1 cluster, but it is not listed in the cluster because it is shown as the second enriched gene in the cMyc+#3 cluster instead. Genes encoding key markers that are used for delineating flow cytometric cMyc+ GC B cell subpopulations (as described in D) are highlighted in red. (C) Heat map illustrating the five key marker genes used in D. The markers were selected from 76 DEGs (P ≤ 0.005, by multigroup comparison). (D) Representative flow cytometry plots illustrating gating strategy to delineate cMyc+ GC B cell subpopulations. Splenic GC B cells of C57BL/6 mice are shown in gray dots as cMyc-GFPneg control cells. Average ± SEM value (15 mice) is shown in each indicated gate. Splenic GC B cell response to SRBC on day 7 in cMycgfp/gfp mice. Having identified DEGs using cMyc+ GC B cell scRNAseq data, we sought out surface markers to subdivide the heterogeneous cMyc+ compartment by flow cytometry. Other than the well-established DZ/LZ distinguishing markers, CXCR4 and CD86, three other surface markers CD69 [a marker for PB/PC precursors (23)], CD23, and CD21/35 were selected from the 76 DEGs determined by multigroup comparison (P ≤ 0.005) (Fig. 1C). High expression of Cd69 was representative of the cMyc+#1 cluster, and Fcer2a and Cr2 expression effectively distinguished between the cMyc+#3, cMyc+#4, and cMyc+#2 clusters by high, intermediate, and low expression, respectively (Fig. 1C). Using the combination of these five surface markers, cMyc-GFP+ GC B cells isolated from cMycgfp/gfp mice 7 d after sheep red blood cells (SRBCs) immunization were initially subdivided into four subpopulations. Hence, a candidate cMyc+ PB precursor subpopulation was identified as CD69hicMyc+ GC B cells (“cMyc+prePB”; based on the cMyc+#1 cluster); the cMyc+ DZ subpopulation (based on the cMyc+#2 cluster) was defined by the DZ gating (CXCR4hiCD86lo) among cMyc+ GC B cells after gating out cells in the cMyc+prePB subpopulation; the cMyc+early subpopulation (based on the cMyc+#3 cluster) was identified as CD23hiCD21/35hi LZ B cells among cMyc+ GC B cells after gating out cells in the cMyc+prePB and cMyc+ DZ subpopulations; and the cMyc+late subpopulation (based on the cMyc+#4 cluster) was identified as CD23+/loCD21/35+/lo LZ B cells in the remaining cMyc+ LZ B cells (Fig. 1D). We noted that the cMyc+late subpopulation consisted of a mixed population containing a major CD23+CD21/35+ subpopulation and a small tail-like CD23loCD21/35lo subpopulation. To improve the quality of upcoming analysis, we further subdivided the population into CD23+CD21/35+ and CD23loCD21/35lo subpopulations, which were termed as cMyc+lateCD23int and cMyc+lateCD23lo, respectively. In agreement with CD23 being highly expressed in LZ B cells (10), CD23 expression was down-regulated in the cMyc+ DZ subpopulation (Fig. 1D). Enumeration of the five cMyc+ GC B cell subpopulations showed that the cMyc+early and cMyc+prePB subpopulations were relatively rare within the cMyc+ compartment (451 ± 79.0 and 389 ± 60.7, respectively; 3 to 5% of the cMyc+ compartment). The largest population of the cMyc+ compartment was the cMyc+lateCD23int subpopulation, followed by the cMyc+ DZ subpopulation (5,009 ± 871.9 and 3,691 ± 599.4; 37 to 53% and 28 to 39% of the cMyc+ compartment, respectively) (SI Appendix, Fig. S1E). cMyc+ LZ B Cell Subpopulations Emerge in a Sequential Order following Positive Selection Signals. Having delineated cMyc+ GC B cell subpopulations by flow cytometry, we explored what these subpopulations represent. We hypothesized that these cMyc+ LZ B cell subpopulations represent different stages of the transition of GC B cells from the beginning of positive selection to DZ entry. To investigate the hypothesis, we examined the expression levels of DZ/LZ distinguishing markers CD86 and CXCR4 of cells in cMyc+ GC B cell subpopulations. We found that CD86 expression showed a downward trend in the following order: cMyc+early, cMyc+lateCD23int, and cMyc+lateCD23lo (Fig. 2A). On the other hand, the CXCR4 expression was increasing in the same order (Fig. 2A). Accordingly, cells in the cMyc+lateCD23lo subpopulation were found in the immediate vicinity of the border between the DZ and LZ (Fig. 2A); it appeared that these cells were about to enter the DZ. Although the DZ/LZ markers were not used for its delineation, the cMyc+prePB subpopulation was predominantly LZ B cells (82.9 ± 1.6%) (Fig. 2B), and most cells were clustered around the border between the DZ and LZ (Fig. 2A). Fig. 2. cMyc+ LZ B cell subpopulations emerge in a sequential order following positive selection signals. (A) Representative flow cytometry plots of CD86 vs. CXCR4 expression in the cMyc+ GC B cell subpopulations. Total GC B cells are shown in gray dots (Upper). Cd86 and Cxcr4 MFI values of the cMyc+ GC B cell subpopulations (relative to cMyc+ DZ values). (B) Percentages of cells in the cMyc+prePB subpopulation in DZ or LZ gates as described in A. Splenic GC B cell response to SRBC on day 7 in cMycgfp/gfp mice (A and B). Pooled data from more than three experiments with 11 (A) or 16 mice (B). Error bars indicate SEM. Statistics were calculated with one-way ANOVA. *P < 0.05; **P < 0.01; ***P < 0.001. (C) The 3D PCA plots of RNAseq data from the four cMyc+ LZ B cell subpopulations: cMyc+early, cMyc+lateCD23int, cMyc+lateCD23lo, and cMyc+prePB. The sample clusters were visualized by connecting each sample with its nearest neighbors for distance 3, 4, and 6. (D) Bar graphs representing GSEA of a cMyc+ LZ B cell subpopulation compared with the other (see description) for gene sets: “cMyc+AP4+ LZ up-regulated compared with AP4+ DZ” and “AP4+ DZ up-regulated compared with cMyc+AP4+ LZ.” The size of the dots indicates false discovery rate (FDR) q values. NES, normalized enrichment score. (E) In silico kinetics of the GC response (model 0) are plotted over the in vivo results for the number of GC B cells, cMyc+ GC B cells, and cells in each cMyc+ GC B cell subpopulation. cMyc positivity was attributed to the cells that were positively selected and received T cell signal (“tc signal”) from TFH above the selection threshold (= cMyc+early subpopulation). Cells in the cMyc+early subpopulation progressed to the cMyc+prePB or cMyc+late subpopulations, according to an in silico probabilistic fate decision between differentiation into GC output or CBs, respectively. Cells in the cMyc+late subpopulation progressed to the cMyc+ DZ subpopulation at the time of in silico CB differentiation. Cells in the cMyc+ DZ subpopulation lost cMyc expression after a fixed time. At the bottom plot, the four cMyc+ GC B cell subpopulations are plotted together, and Inset shows a magnification of cMyc+prePB and cMyc+early subpopulations. (Right) Working model of the cMyc+ GC B cell subpopulation dynamics in silico; RSS and AICc values are shown (see SI Appendix, Fig. S2 B–E for the other tested models). Free parameters used to fit the model are shown in blue letters. All data points were normalized with respect to the maximum value obtained in the simulation of the GC B cell kinetics in GC B cell numbers shown in the plot GC B cells. Mean (full lines) and SD (shaded area) of 100 simulations are shown. Black dots and colored dots represent in vivo data. Next, we performed RNA sequencing (RNAseq) on the flow cytometry-delineated cMyc+ LZ B cell subpopulations and assessed the hypothesis by transcriptome analysis. To visualize how closely the subpopulations were correlated to each other, three-dimensional (3D) principle component analysis (PCA) plots were generated based on the distances in the space of all active variables (P ≤ 0.0005, multigroup comparison). In these PCA plots, each sample was connected with its nearest neighbors within the indicated distance. The analysis showed that each sample was tightly clustered within its own subpopulation (distance 3) (Fig. 2C). At a greater distance, the cMyc+early subpopulation was related to both the cMyc+prePB and cMyc+lateCD23int subpopulations, and the cMyc+lateCD23int subpopulation was connected with the cMyc+early and cMyc+lateCD23lo subpopulations (distances 4 and 6) (Fig. 2C). We also carried out GSEA using gene signatures specific for subsets of GC B cells, cMyc+AP4+ LZ B cells, and AP4+ DZ B cells (34), which represent positively selected LZ B cells and DZ B cells emerging immediately after the transit of positively selected LZ B cells into the DZ, respectively. GSEA results between the subpopulations found to be closely related to each other in the PCA results (Fig. 2C) revealed that the cMyc+early subpopulation was significantly enriched for the cMyc+AP4+LZ GC B cell gene signature compared with cMyc+lateCD23int and cMyc+lateCD23lo subpopulations (Fig. 2D). The enrichment for this gene signature decreased in the cMyc+lateCD23int subpopulation and more so in the cMyc+lateCD23lo subpopulation (NES for cMyc+early vs. cMyc+lateCD23int and cMyc+lateCD23int vs. cMyc+lateCD23lo; 2.48 and 2.12, respectively) (Fig. 2D and SI Appendix, Fig. S2A). The opposite was true for the gene signature of AP4+ DZ GC B cells, which was significantly more enriched in the cMyc+lateCD23lo subpopulation compared with the cMyc+lateCD23int and cMyc+early subpopulations (Fig. 2D and SI Appendix, Fig. S2A). Notably, the enrichment for this gene signature decreased in the cMyc+lateCD23int subpopulation and more so in the cMyc+early subpopulation (NES for cMyc+lateCD23int vs. cMyc+lateCD23lo and cMyc+early vs. cMyc+lateCD23int; −1.17 and −2.37, respectively) (Fig. 2D and SI Appendix, Fig. S2A). These data indicated that the cMyc+ LZ B cell subpopulations emerge in the following order from the beginning of positive selection to DZ entry (cMyc+early → cMyc+lateCD23int → cMyc+lateCD23lo), which in turn, indicates that the cMyc+early subpopulation has been more recently positively selected than the cMyc+late subpopulations. To further test the hypothesis, we investigated if the size of each cMyc+ GC B cell subpopulation in silico would be commensurate to the in vivo results. To this end, we exploited an extended version of agent-based model for GC reactions (35) that includes features of multiple contacts between B and T cells to collect signals (36) (Fig. 2E and SI Appendix, Fig. S2 B–E). In this in silico model, the ratio of the percentage of recycling cells as DZ B cells (= centroblast [CB]) to the percentage of differentiating cells from the selected GC B cells as output cells was fixed to be 90%:10%. Under this setting, five different possible models (zero to four) for the functional interdependence of cMyc+ GC B cell subpopulations were tested. Temporal cellular dynamics of GC B cells, cMyc+ GC B cells, and cells in cMyc+ GC B cell subpopulations were obtained by in silico immunization (Fig. 2E and SI Appendix, Fig. S2 B–E), and the simulation results of each model reproduced the size of cMyc+ GC B cell subpopulations. Subsequently, quantitative model selection ranked the five models. The best-performing model (model 0) (Fig. 2E) was selected based on the lowest Akaike information criterion (AICc) value and residual sum of squares (RSS). Model 0 was considerably in accordance with the in vivo time-course results (i.e., cMyc+ LZ B cells progress from the cMyc+early subpopulation to the cMyc+late subpopulation that, in turn, becomes the cMyc+ DZ subpopulation). The in silico model also suggested that the cMyc+prePB subpopulation is derived from the cMyc+early subpopulation. Altogether, the data clearly indicated that cMyc+ GC B cell subpopulations represent those which emerge in a sequential order following the reception of cMyc-inducing signals. A Fraction of cMyc+ GC B Cells in Each Subpopulation Completes Mitosis in the LZ. Current knowledge does not provide information on whether and how long cMyc positivity induced by the engagement of BCR and CD40 is sustained in GC B cells. To mimic such positively selected B cells in vivo, we pulsed GC B cells for 1 h with anti-immunoglobulin M (IgM)/IgG F(ab’)2 (fragment antigen-binding) as a mimicry of BCR engagement, together with anti-CD40 antibody and IL-4 as a mimicry of TFH help, and investigated the level of cMyc in the cultured cells in the presence or absence of the stimulants for an additional 8 h. During the 8-h culture with the stimuli, cMyc-GFP mean fluorescence intensity (MFI) further increased compared with the MFI of the pulsed cells before the culture (Fig. 3A). Notably, in the absence of further stimuli, the cMyc-GFP MFI of the pulsed cells was maintained at a high level in these cells compared with the cells cultured in media for 9 h without any pulse (Fig. 3A). These data indicated that continuous stimulus is not required for the maintenance of cMyc expression in GC B cells for at least 8 h after cMyc induction. We concluded that cMyc+ LZ B cells can potentially complete at least one round of cell cycle in the LZ because the cell cycle of GC B cells takes 6 to 8 h (18, 37). Fig. 3. A fraction of cMyc+ GC B cells in each subpopulation completes mitosis in the LZ. (A) Representative flow cytometric histograms of cMyc-GFP vs. relative cell number (RCN; Left). cMyc-GFP MFI values of GC B cells in the indicated time points (Right). Each circle indicates one sample. (B) Experimental design for C. (C) Representative flow cytometric plots of a DNA dye, FxCycle vs. Ssc in the cMyc+ GC B cell subpopulations after 1-h BrdU incorporation. Diploid (2n) and tetraploid (4n) gates were determined by DNA contents that were visualized with FxCycle staining. Percentage of cells in the diploid gate of the post–S-gated cells is shown. This ratio indicates duration of S phase under this experimental setting. Splenic GC B cell response to SRBC on day 6 (A) or day 7 (C) in cMycgfp/gfp mice. Data are from a representative experiment containing five samples per condition of two experiments (A) or three experiments with eight mice (C). Error bars indicate SEM. Statistics were calculated with unpaired Student’s t test between samples taken at different time points (A) or with one-way ANOVA (C). n.s., not significant. *P < 0.05; ***P < 0.001; ****P < 0.0001. To assess the course of cell cycle progression within cMyc+ GC B cell subpopulations, we used the 5-ethynyl-2′-deoxyuridine (EdU)/5-bromo-2′-deoxyuridine (BrdU) dual-labeling technique. GC B cells were pulsed with EdU for 1 h and then labeled with BrdU for an additional 1 h, which enabled us to separate cells based on the cell cycle status (i.e., early synthesis [S] phase [EdUnegBrdU+], mid/late S phase [EdU+BrdU+], and post-S phase [EdU+BrdUneg]) (Fig. 3B and SI Appendix, Fig. S3A). When we closely analyzed the cell cycle status of each cMyc+ GC B cell subpopulation, we found varied dynamics between them: the percentage of cells in the nonreplicating gap 1 (G1) phase was greater in the cMyc+lateCD23int subpopulation, whereas the percentage of cells in the post-S (gap 2 [G2]/mitosis [M]) was increased in the cMyc+early subpopulation (SI Appendix, Fig. S3B). On the other hand, the percentage of cells in the early S phase was increased within the cMyc+ DZ subpopulation (SI Appendix, Fig. S3B), suggesting that the speed of S-phase entry in this subpopulation was faster than cMyc+ LZ B cell subpopulations. A previous study has shown that the ratio of EdU+BrdU+/EdU+BrdUneg × 1 h (interval time) can indicate duration of the S phase when the injection interval between EdU and BrdU is 1 h in dual-labeling experiments (38). Using this analysis, we found that the cMyc+prePB subpopulation exhibited the longest duration of the S phase, which was attributed to an increased percentage of cells in the mid-/late S phase (SI Appendix, Fig. S3 B and C). We also noted that the duration of the S phase for the cMyc+lateCD23lo subpopulation was nearly twofold longer than those of the cMyc+early and cMyc+lateCD23int subpopulations. However, the percentage of early S phase in the cMyc+lateCD23lo subpopulation was higher than those in the cMyc+early and cMyc+lateCD23int subpopulations (SI Appendix, Fig. S3 B and C). Considering the previous prediction that positively selected GC B cells return to the DZ before reaching the G2/M phase (35), this result may be partially attributed to the LZ to DZ transmigration of a fraction of cells within the cMyc+lateCD23lo subpopulation during the S phase to become cMyc+ DZ cells. Consequently, the duration of the S phase for the cMyc+ DZ subpopulation determined in this way may be overestimated. These data were also supported by GSEA for cell cycle genes between cMyc+ LZ B cell subpopulations (SI Appendix, Fig. S3D). Coupling a DNA-labeling dye to measure DNA contents with the EdU/BrdU dual-labeling technique allowed us to determine the cell cycle dynamics in detail. Analysis of EdU+BrdUneg cells in the post-S phase (G2/M) of each cMyc+ GC B cell subpopulation revealed that all cMyc+ LZ B cell subpopulations contained post–S-phase cells and that a fraction of these cells had completed cytokinesis as indicated by the DNA content measurement (2n and 4n represented cells that were at G1 after cell division and were at G2/M, respectively) (Fig. 3C). This finding was further substantiated by the time-course examination of DNA contents of EdUnegBrdU+ cells (cells that had entered S phase) within each cMyc+ LZ B cell subpopulation. The analysis showed that DNA contents of EdUnegBrdU+ cells doubled up to the G2/M level (4n) from the early S phase (2n) (described as “S1” at 1 h after BrdU injection) 5 h after BrdU injection (i.e., within 4 h) (SI Appendix, Fig. S3 E and F). Histone H3 is specifically phosphorylated on Ser10 at prophase and is swiftly dephosphorylated by the end of mitosis. Therefore, phospho-histone H3 (pH3) at Ser10 is a specific marker for cells undergoing mitosis. In agreement with previous reports observing pH3+ mitotic GC B cells in the LZ (17, 19), we found pH3+GL7+ GC B cells in the CD35hi LZ region (SI Appendix, Fig. S3G). Approximately 50% of pH3+ LZ B cells coexpressed cMyc at low levels (SI Appendix, Fig. S3G) in accordance with prior knowledge that levels of cMyc are drastically reduced during the brief period of mitosis (39). Notably, the percentage of cells that had completed cytokinesis (2n) of the post–S-phase gate had a nearly twofold increase in the cMyc+ DZ subpopulation compared with all the cMyc+ LZ B cell subpopulations (Fig. 3C). These data indicated that the G2/M phase progresses faster in the cMyc+ DZ subpopulation than the cMyc+ LZ B cell subpopulations and thus, that the tempo of cell cycle is likely to be different between the LZ and the DZ. Altogether, these data demonstrated that a fraction of cMyc+ LZ B cells completes cell cycle in each subpopulation in the LZ before migration to the DZ. Transit to a Subsequent cMyc+ LZ B Cell Subpopulation Can Be Accompanied by Cell Division. Given that a fraction of cMyc+ GC B cells in each LZ subpopulation completes mitosis, we aimed to examine whether the phenotypic change of cMyc+ LZ B cells is accompanied by cell division. For this purpose, B cells derived from Mycgfp/gfp reporter mice crossed with SWHEL mice that express the hen egg lysozyme (HEL)-specific immunoglobulin heavy chain knock-in and light chain transgene (HyHEL10 BCR) (40) were transferred into CD45.1+ congenic recipient mice. We studied the response of SWHEL B cells to HEL after both donor and recipient mice were immunized with HEL-SRBC. One day after immunization, donor-derived CellTrace Violet (CTV)-labeled B cells were transferred into the immunized recipient mice (Fig. 4A). Seventy hours after the cell transfer, we analyzed the donor-derived HEL-specific B cells that had undergone cell division based on CTV dilution: CTVdiv4, CTVdiv5, CTVdiv6, and CTVdiv7+ (Fig. 4B). cMyc+ GC B cells located in these four CTV-based compartments were further resolved into the five cMyc+ GC B cell subpopulations (Fig. 4 B and C). Comparison of the percentage of each cMyc+ GC B cell subpopulation between the CTV compartments in sequence of division enabled us to calculate the proportion of cells transiting between subpopulation boundaries over time. The CTVdiv4 compartment consisted of a high proportion of cells in the cMyc+early subpopulation among total cMyc+ GC B cells; however, the percentage of cells in the subpopulation decreased nearly by half per round of cMyc+ B cell division: 34.5 ± 2.69% (CTVdiv4), 17.9 ± 1.71% (CTVdiv5), and 9.30 ± 1.45% (CTVdiv6). The percentage of cells comprising the cMyc+lateCD23int subpopulation increased significantly between CTVdiv4 and CTVdiv5, and it decreased mildly after CTVdiv5: 29.2 ± 3.03% (CTVdiv4), 39.0 ± 2.26% (CTVdiv5), and 37.2 ± 0.994% (CTVdiv6). In contrast, the percentage of the cMyc+lateCD23lo and cMyc+ DZ cells increased in every cell division: cMyc+lateCD23lo: 6.29 ± 1.02% (CTVdiv4), 11.0 ± 1.33% (CTVdiv5), and 19.4 ± 2.09% (CTVdiv6); cMyc+ DZ: 7.51 ± 1.33% (CTVdiv4), 11.9 ± 1.28% (CTVdiv5), and 14.8 ± 1.31% (CTVdiv6). Cells in the cMyc+prePB subpopulation maintained similar percentage throughout cell division (Fig. 4C). Collectively, these data suggested that cell division is correlated with the transit of a fraction of cells to a subsequent cMyc+ LZ B cell subpopulation. Fig. 4. Transit to a subsequent cMyc+ LZ B cell subpopulation can be accompanied by cell division. (A) Experimental design for B and C with a representative flow cytometric plot of B cells used for adoptive transfer. Intraperitoneal (i.p.) and intravenous (i.v.) injections in mice. (B) Representative flow cytometric plots. SWHEL cMycgfp/gfp donor-derived HEL-specific B220+ B cells were divided into four gates by cell division number based on dilution of CTV: CTVdiv7+, seven division and more; CTVdiv6, six division; CTVdiv5, five division; CTVdiv4, four division. cMyc-GFP+ GC B cells of each CTV gate were further resolved into the five subpopulations by the gating described in Fig. 1D. SWHEL control mouse-derived GC B cells are shown in gray dots to identify the cMyc-GFPneg population. (C) Percentages of cells of the five cMyc+ GC B cell subpopulations in each CTV gate. Pooled data from more than three experiments with 13 mice (C). Error bars indicate SEM. Statistics were calculated with one-way ANOVA. N.S., not significant. *P < 0.05; **P < 0.01; ***P < 0.001; ****P < 0.0001. Permissive Selection Occurs at the Start of Positive Selection Followed by Affinity-Dependent Proliferation in the LZ. In the currently favored model, positive selection occurs in an affinity-dependent manner in the LZ (7, 8). To investigate if BCR affinity differs between cMyc+ GC B cell subpopulations, we endeavored to measure it. B cells derived from Mycgfp/gfp SWHEL mice were transferred into CD45.1+ congenic recipient mice, followed by immunization with an HEL mutant protein, HEL3× conjugated to SRBC (Fig. 5A). HyHEL10 BCR binds to HEL with high affinity (2 × 10¹⁰ M−1), whereas it binds to HEL3× with an affinity 13,000-fold lower (41), which allows us to assess affinity maturation in mice after HEL3×-SRBC immunization. As previously shown, donor cells hardly respond to SRBC (42). Eight days after immunization, high-affinity SWHEL B cell clones bound to HEL3× more intensely (top diagonal gate), whereas low-affinity clones bound to it less intensely (bottom gate) (Fig. 5B). Flow cytometric analysis showed that high-affinity clones were almost exclusively enriched within class-switched IgG1+ cells but not in IgM+ cells (Fig. 5B). Thereafter, we restricted the analysis to IgG1+ cells, which also ensures that IgM+ naïve B cells were excluded from the analysis. We looked at the ability of cMyc+ GC B cell subpopulations to bind HEL3× and found that the cMyc+early subpopulation predominantly contained lower-affinity clones, whereas the cMyc+prePB subpopulation comprised higher-affinity cells (Fig. 5C). To ensure that the cMyc+early subpopulation did not contain a significant fraction of recent GC entrants, we sorted this subpopulation derived from cMycgfp/gfp reporter mice 10 d after immunization with NP-CGG by flow cytometry and investigated the number of mutations in the NP-binding IgG1 VH186.2 gene sequence. Only 8.6% of the total sequenced IgG1+ clones in the cMyc+early subpopulation were detected as unmutated (162 clones sequenced; results from pooled three independent sorting; unmutated clone number/total sequenced: sort#1, 6/45; sort#2, 3/56; sort#3, 5/61). This indicated that the cMyc+early subpopulation is mainly derived from GC residents that have undergone somatic hypermutation rather than from cells that have recently entered the GC, in keeping with the previous observation that only B cell clones with a competitive advantage in affinity can join preexisting GCs (43). The ratio of IgG1+ high/low HEL3× binding cells was increased by approximately fourfold when the values were compared between the cMyc+early and the cMyc+lateCD23lo subpopulations (Fig. 5C). Although it is generally assumed that only high-affinity clones are actively positively selected from the beginning of the process, our data revealed that positive selection starts permissively to retain lower-affinity cells. Cells in cMyc+ GC B cell subpopulations were not apoptotic despite the fact that most of the cells in the cMyc+early and cMyc+lateCD23int subpopulations carried low-affinity BCR (Fig. 5C and SI Appendix, Fig. S4A). In agreement with previous reports showing that high-affinity GC B cells proliferate more than low-affinity ones (12, 25), a greater percentage of high-affinity cells incorporated EdU than low-affinity ones within each cMyc+ GC B cell subpopulation (Fig. 5D). This could not be determined for the cMyc+early subpopulation due to limitation in high-affinity cell numbers at the experimental time point (Fig. 5D). As a result of preferential proliferation of higher-affinity clones, BCR affinity was enhanced in the LZ, while cMyc+ LZ B cells were phenotypically changing to cMyc+ DZ B cells (i.e., from cMyc+lateCD23int to cMyc+lateCD23lo and from cMyc+lateCD23lo to cMyc+ DZ) (Fig. 5 B and C). Because the relationship between the cMyc+prePB and the rest of the cMyc+ LZ B cell subpopulations was not well defined (described below), we excluded the cMyc+prePB subpopulation from the model. In summary, these data suggest a revised model for the positive selection process: GCs are permissive to selecting lower-affinity cells at the start of positive selection, followed by affinity-dependent proliferation in the LZ. Clonal diversity is ensured by protecting lower-affinity cells from undergoing apoptosis, while the affinity of future DZ entrants is increased in the LZ before DZ entry. Fig. 5. Permissive selection occurs at the start of positive selection, followed by affinity-dependent proliferation in the LZ. (A) Experimental design for B. (B) Representative flow cytometric plots. SWHEL cMycgfp/gfp donor-derived cMyc+ GC B cells 8 d after HEL3×-SRBC immunization were divided into high-affinity (top diagonal gate) and low-affinity (bottom gate) gates based on binding ability of BCR (IgM or IgG1) to HEL3× (Upper). Representative flow cytometric plots of HEL3× binding vs. IgG1 expression in the cMyc+ GC B cell subpopulations (Lower). (C) IgG1+ high-/low-HEL3× binding ratio in the cMyc+ GC B cell subpopulations. (D) Percentages of EdUpos cells in the cMyc+ GC B cell subpopulations that were further divided based on the BCR affinity as shown in B 6 h after i.v. injection with EdU. Splenic GC B cell response to HEL3×-SRBC immunization on day 7. Due to the limitation of the number of high-affinity cells in the cMyc+early subpopulation, percentages of EdUpos cells were unable to be determined (U.D.). (E) cMyc-GFP MFI values of the cMyc+ GC B cell subpopulations. SWHEL cMycgfp/gfp donor-derived HEL-specific cells 8 d after HEL3×-SRBC immunization were divided into IgG1pos high affinity and low affinity. Statistics calculated with unpaired Student’s t test between low- and high-affinity cells of each cMyc+ GC B cell subpopulation. (F) CD40 MFI values (relative to cMyc+ DZ values). Fo-B cells were defined as B220+CD38hiCD95negCD23hiCD21/35lo cells. Splenic GC B cell response to SRBC on day 7 in cMycgfp/gfp mice. Pooled data from more than three experiments with 38 mice (C), 12 mice (D), 18 mice (E), or 19 mice (F). Error bars indicate SEM. Statistics were calculated with one-way ANOVA. N.S., not significant. *P < 0.05; **P < 0.01; ***P < 0.001; ****P < 0.0001. Levels of cMyc Expression Reinforce the Potential for cMyc+ GC B Cell Subpopulations to Emerge Sequentially. A previous report has demonstrated that the level of cMyc protein is highest in B cells that have just received cMyc-inducing signals (44). Hence, the level of cMyc expression is a good indicator for how long the cells have received cMyc-inducing signals. We found that the cMyc-GFP MFI was highest in the cMyc+early subpopulation and decreased in the following order: cMyc+early, cMyc+lateCD23int, cMyc+lateCD23lo, and cMyc+ DZ subpopulations for both low- and high-affinity cells (SI Appendix, Fig. S4B). This result reinforced our hypothesis that the cMyc+early subpopulation emerges earliest, and the cMyc+lateCD23int and cMyc+lateCD23lo subpopulations follow it in this order. Previous work showed that the level of cMyc protein in GC B cells is also dependent on the amount of T cell help (45), which in turn, is dependent on BCR affinity. As expected, high-affinity cells expressed more cMyc protein than low-affinity cells when the comparison was made within the same cMyc+ GC B cell subpopulation (Fig. 5E). Despite that, the low-affinity cells of the cMyc+early subpopulation exhibited a similar level of cMyc-GFP expression compared with the high-affinity cells of the cMyc+lateCD23int subpopulation and even higher than that of the high-affinity cells in the cMyc+lateCD23lo and cMyc+ DZ subpopulations (Fig. 5E). A similar observation was made in mice immunized with SRBC, in which the cMyc+early subpopulation exhibited higher cMyc-GFP MFI compared with cMyc+late and cMyc+ DZ subpopulations regardless of its larger proportion of low-affinity clones (SI Appendix, Fig. S4C). In order to understand how cells in the cMyc+early subpopulation can be positively selected despite the enrichment of low-affinity clones, we investigated the expression of CD40 that is a key molecule for cMyc induction (46). In cMyc+ GC B cell subpopulations derived from cMycgfp/gfp mice on day 7 of the response to SRBC, cells in the cMyc+early subpopulation expressed higher surface levels of CD40 than cMycneg LZ B cells and any other cMyc+ GC B cell subpopulation (Fig. 5F and SI Appendix, Fig. S4D). These data suggested that CD40 is up-regulated in low-affinity LZ B cells before and/or during receiving signals from TFH to allow them to receive increased T cell help and pass a threshold (i.e., cMyc induction) for positive selection. Cells in the cMyc+prePB subpopulation expressed cMyc as high as cells in the cMyc+early subpopulation (Fig. 5E and SI Appendix, Fig. S4 B and C), and also, the cMyc+prePB subpopulation was more closely related to the cMyc+early subpopulation than any of the other cMyc+ LZ B cell subpopulations according to the 3D PCA plots (Fig. 2C). These data together with in silico models (Fig. 2E and SI Appendix, Fig. S2 B–E) suggested the possibility that the cMyc+prePB subpopulation may be selectively derived from high-affinity cells within the cMyc+early subpopulation. However, cells in the cMyc+prePB subpopulation were comparatively more enriched in the cMyc+AP4+ LZ positively selected GC B cell gene signature than the cMyc+early subpopulation (Fig. 2D). Thus, we currently cannot exclude the possibility that cMyc+prePB subpopulation may be generated independently of the cMyc+early subpopulation. Altogether, these results strongly reinforced our hypothesis that cMyc+ GC B cell subpopulations represent those which emerge in a sequential order following cMyc-inducing signals. The process of positive selection starts in the cMyc+early subpopulation, which is predominantly composed of low-affinity clones and proceeds through preferential proliferation of high-affinity clones in the subsequent cMyc+late subpopulations to outcompete the low-affinity ones in the LZ. Specific cMyc+ GC B Cell Subpopulations Contain MBC and PB/PC Precursors. We next examined transcriptomic profiles to investigate whether cMyc+ LZ B cell subpopulations are associated with B cell differentiation. First, within the DEGs identified by multigroup comparison (P ≤ 0.04) between the four cMyc+ LZ B cell subpopulations from bulk RNAseq data, we analyzed those genes that are known to be associated with PB/PC or MBC differentiation (23, 47⇓–49). Cells in the cMyc+prePB subpopulation had increased expression of PC-associated genes, including Batf, Socs2, Nfkbia, Myc, Id2, Cd40, and Ccnd2, but reduced expression of Id3, Sell, Cr2, Cd83, and Ccr6, which is in agreement with the low expression of these genes in PCs (23, 47, 49) (Fig. 6A). The increased expression of Nfkbia in the cMyc+prePB subpopulation was an indication of enhanced NF-κB signaling, an essential pathway for the differentiation of PB/PC from GC B cells (28). Then, we performed GSEA on the cMyc+prePB subpopulation, which displayed significant enrichment of a PC gene signature and the expression of IRF4 target genes in PCs (Fig. 6B). These results suggested that the cMyc+prePB subpopulation contains PB precursors. Although the gene expression of Prdm1 or Irf4 was not significantly up-regulated in this subpopulation, we found that cMyc+prePB subpopulation had an increased percentage of Blimp1-GFP+ cells (50) and relatively higher levels of IRF4 compared with the other cMyc+ GC B cell subpopulations (SI Appendix, Fig. S5 A and B). Surprisingly, genes associated with MBCs such as Il9r, Ccr6, Sell, Pecam1, S1pr1, Gpr183, Klf2, and Hhex (47, 48, 51) were up-regulated in the cMyc+early subpopulation (Fig. 6A), which was accompanied by a significant enrichment of an MBC gene signature in this subpopulation (Fig. 6B). Fig. 6. Specific cMyc+ GC B cell subpopulations contain MBC and PB/PC precursors. (A) Heat map for selected genes known to be associated with PB/PC or MBC differentiation. Only genes that have passed the threshold of P ≤ 0.04 by multigroup comparison are shown. (B) GSEA of differential gene expression in the cMyc+prePB subpopulation vs. the cMyc+early subpopulation for gene sets: “up-regulated in MBC compared with PC,” “up-regulated in PC compared with MBC,” “IRF4 target in PC compared with mature B cell,” and “NFκB activation.” Nominal enrichment score (NES), enrichment score (ES) and false discovery rate (FDR) q values. (C) Percentages of cells within the indicated populations after gating on CCR6pos GC B cells as shown in SI Appendix, Fig. S5C (Left). Percentage of cells within the cMyc+ GC B cell subpopulations after gating on CCR6pos cMyc+ GC B cells (Right). (D) Percentage of CCR6pos cells in the cMyc+ GC B cell subpopulations after gating as shown in SI Appendix, Fig. S5C. (E) Representative flow cytometric plots of HEL3× binding vs. IgG1 expression in CCR6pos and CCR6neg cells of the cMyc+early and cMyc+lateCD23int combined populations (Left). IgG1pos high-/low-HEL3× binding ratio in the indicated cell populations as gated in Left (Right). (F) Representative flow cytometric plots of CD38 vs. EdU incorporation in CCR6pos and CCR6neg cells of the cMyc+early and cMyc+lateCD23int combined populations that were further divided based on the BCR affinity as shown in E and IgG1pos MBCs 6 h after intravenous injection with EdU. Percentages of EdUpos cells in the indicated cell populations (Lower Right). SWHEL cMycgfp/gfp donor B cells on day 8 (C–E) or day 7 (F) after HEL3×-SRBC immunization. Pooled data from two experiments with 10 mice (C–E) or 11 mice (F). Error bars indicate SEM. Statistics were calculated with one-way ANOVA (C and D) or unpaired Student’s t test (E and F). N.S., not significant. **P < 0.01; ***P < 0.001; ****P < 0.0001. MBC precursors are reported to be quiescent and express lower-affinity BCR (24⇓–26), whereas cMyc+ GC B cells have been known to be proliferative and carry higher-affinity BCR (4, 5). Hence, it has been counterintuitive to link MBC precursors to positively selected cMyc+ GC B cells. However, the analysis of the bulk RNAseq data showed a significant enrichment of genes associated with MBCs in the cMyc+early subpopulation. We thereby investigated whether MBC precursors defined by CCR6 expression (25) were present within cMyc+ GC B cell subpopulations. To this end, we adoptively transferred B cells from SWHEL Mycgfp/gfp mice and first examined if donor-derived CCR6pos GC B cells expressed cMyc 8 d after HEL3x-SRBC immunization. We found CCR6pos cells within cMyc+ LZ B cells (2.0 ± 0.17% of total CCR6pos GC B cells) (Fig. 6C) despite the enrichment of CCR6pos GC B cells within cMycneg LZ B cells (Fig. 6C and SI Appendix, Fig. S5C). We next examined which cMyc+ GC B cell subpopulation represented CCR6pos GC B cells and found that the cMyc+lateCD23int subpopulation comprised over 60 of the cMyc+ CCR6pos GC B cells (62 ± 1.6%) (Fig. 6C). In contrast, the cMyc+ DZ subpopulation was not enriched with CCR6pos GC B cells (Fig. 6C and SI Appendix, Fig. S5C). These results are concordant with the previous observation that CCR6pos GC B cells are predominantly located in the LZ (25). When the proportion of CCR6pos B cells within each cMyc+ GC B cell subpopulation was determined, the cMyc+early subpopulation contained the highest percentage of CCR6pos GC B cells (19 ± 4.3% in SWHELMycgfp/gfp mice and 18 ± 2.6% in Mycgfp/gfp mice) (Fig. 6D and SI Appendix, Fig. S5D, respectively). Hence, cMyc+CCR6pos MBC precursors were present, and these cells were mostly contained in the cMyc+early and cMyc+lateCD23int subpopulations. Accordingly, we performed further analysis of MBC precursors using these combined subpopulations. The cMyc+CCR6pos MBC precursors were predominantly composed of low-affinity clones (Fig. 6E) in agreement with the previous finding that MBCs are mostly derived from low-affinity cells (24, 25). Indeed, higher-affinity clones became dominant in GCs over time (SI Appendix, Fig. S5E), and the percentage of MBC precursors found within cMyc+ GC B cell subpopulations 15 d after HEL3x-SRBC immunization was highly reduced (SI Appendix, Fig. S5F) compared with those after 8 d after immunization (Fig. 6D). This finding is consistent with the knowledge that MBCs mostly arise at earlier stages of the GC reaction (52). Next, we investigated if the cMyc+CCR6pos MBC precursors were less proliferative as previously reported for MBC precursors (25, 26). To examine the proliferation status of CCR6neg GC B cells and CCR6pos GC B cells within the low- and high-affinity cMyc+early and cMyc+lateCD23int combined subpopulations, we performed EdU incorporation assays. Within the cMyc+ GC B cell combined subpopulations, a significantly lower percentage of low-affinity cMyc+CCR6pos MBC precursors incorporated EdU compared with low-affinity cMyc+CCR6neg GC B cells (Fig. 6F). These data demonstrated that low-affinity cMyc+CCR6pos MBC precursors are less proliferative than the rest of the cMyc+ GC B cells (Figs. 5D and 6F). In summary, we identified CCR6pos MBC precursors within cMyc+ GC B cells. This identification provides a biological rationale for permissive positive selection, by which antigen-specific MBCs bearing low-affinity BCR can be efficiently produced. Discussion This study redefines GC B cell–positive selection as a dynamic process that ensures maintenance of a broad range of affinities in GCs. We found that affinity-dependent cell division occurred in the LZ and therefore, that such process is not restricted to the DZ. Newly positively selected LZ B cells form the cMyc+early subpopulation, which consists predominantly of low-affinity cells that are protected from apoptosis. These cMyc+ LZ B cells give rise to subsequent cMyc+late subpopulations in which high-affinity cells divide more than low-affinity cells. Such an affinity-based proliferation in the LZ allowed the enrichment of high-affinity clones before DZ migration. This mode of positive selection can be advantageous for retaining varied affinity clones in GCs, which ultimately may contribute to the production of GC-derived MBCs (SI Appendix, Fig. S6). Cells in each cMyc+ LZ B cell subpopulation are proliferative, although their cell cycle dynamics varied in each subpopulation. This proliferative status of cMyc+ LZ B cell subpopulations is consistent with previous observations of a fraction of dividing LZ B cells made by histology, two-photon microscopy, and flow cytometry (7, 16⇓⇓–19) and also with dividing LZ B cells (S/G2/M) being located at the border of LZ/DZ (53). Although these results may also reflect the arrival of dividing DZ B cells to the LZ, our flowcytometric data demonstrated that a fraction of positively selected LZ B cells initiated and completed cell division locally. Immunofluorescence results showed that mitotic pH3+cMyc+ GC B cells exist in the LZ (SI Appendix, Fig. S3G), and accordingly, a fraction of cMyc+ GC B cells divides in the LZ. However, we are currently unable to identify spatial distribution of cells in each cMyc+ subpopulation due to technical limitations. Recently, a proliferative CXCR4+CD83+ GC B cell subset, “grey zone (GZ) B cells,” has been discovered with a new gating strategy, and this subset is transcriptionally distinct from the rest of GC B cells, namely CXCR4negCD83+ LZ B cells and CXCR4+CD83neg DZ B cells (54). Approximately one-third and two-thirds of GZ B cell subset are LZ B cells (CXCR4neg/+CD83+) and DZ B cells (CXCR4+CD83neg/+), respectively, when cells are delineated using the conventional gating strategy (54). A large fraction of cells in the cMyc+ subpopulations were shown to be located in the CXCR4+CD86+ region (Fig. 2A). Because it is most likely that this region is equivalent to the CXCR4+CD83+ GZ region, the GZ B cell subset perhaps includes most cells from the cMyc+ subpopulations. Approximately 3 to 7% of GC B cells are cMyc+ LZ B cells, which is proportionally much smaller than constantly dividing DZ B cells. Therefore, cell division of a small number of cMyc+ LZ B cells may be underestimated particularly when GC B cells are treated with potent exogenous cell cycle inducers (45). Considering the cell number and transition of high-/low-affinity ratio between the three cMyc+ LZ B cell subpopulations (cMyc+early, cMyc+lateCD23int, and cMyc+lateCD23lo), some clones bearing high-affinity BCR perhaps divide more than once in the LZ. This is consistent with our finding showing that a fraction of cells completes cell division within a specific cMyc+ LZ B cell subpopulation. We revealed that GC B cells can retain cMyc expression in the absence of continued stimulation for at least 8 h after reception of cMyc-inducing signals (Fig. 3A). Given that GC B cells divide every 6 to 8 h (18, 37), multiple rounds of division of LZ B cells are theoretically possible. Our data suggested that the phenotypic change of cMyc+ LZ B cells can be accompanied by cell division. However, given that the number of cell division of cMyc+ LZ B cells with low-affinity BCR is fewer than those with high-affinity BCR, we assume that the phenotype associated with the cMyc+ LZ B cell subpopulations is perhaps altered in the absence of cell division as well. Due to limitations of the current technology, we are so far unable to determine whether a cell divides in every cMyc+ LZ B cell subpopulation and accordingly, how many times cMyc+ LZ B cells divide before migrating to the DZ. Further investigation is required for the elucidation of these points. Abrogation of FoxO1 and CXCR4, key molecules to maintain the DZ program and to define DZ positioning of GC B cells, results in generating DZ-null GCs according to surface marker profile (19⇓–21, 55). Notably, the effect caused by the loss of either molecule on cell cycle status is minimal, indicating that neither DZ access nor the FoxO1-governing DZ program are required for cell proliferation (19, 20, 55). These data suggest that the DZ is not the only site for cell proliferation in agreement with our data and with earlier observations of proliferative cells in the LZ (7, 16⇓–18, 37). Since Foxo1-null LZ-like B cells are defective in antigen presentation due to a significantly lowered expression of BCR compared with control LZ B cells (21), positive selection in these mice is impaired. As a result, a reduced percentage of high-affinity clones or antigen-specific cells is observed in Foxo1-deficient mice compared with control mice (20, 55). Nonetheless, Sander et al. (20) found a similar percentage of high-affinity clones between IgM+ NP-specific Foxo1-null GC B cells and control IgM+ NP-specific GC B cells. It is thus tempting to speculate that this finding may be attributable to proliferation of positively selected LZ B cells independently of the DZ proliferation program. It remains unclear how the cMyc+prePB subpopulation is generated. The cMyc+prePB subpopulation expressed lower levels of CD40 than the cMyc+early subpopulation (Fig. 5F and SI Appendix, Fig. S4D). This result can be interpreted as that CD40 internalization had started more recently in the cMyc+early subpopulation than the cMyc+prePB subpopulation (i.e., the former subpopulation is an ascendant subpopulation of the latter). GSEA results supported this interpretation because the signature of genes up-regulated by CD40 signaling was found to be enriched in the cMyc+prePB subpopulation compared with the cMyc+early subpopulation. Moreover, the in silico model also indicated that the cMyc+prePB subpopulation is derived from the cMyc+early subpopulation (Fig. 2E). In such a case, cells in the cMyc+prePB subpopulation are likely to be derived from high-affinity cells within the cMyc+early subpopulation. MBCs are enriched with low-affinity clones and appear to require only minimal levels of signals derived from TFH (24, 25). Therefore, it is broadly assumed that MBCs arise from nonpositively selected LZ B cells as the TFH help provided is below a threshold for positive selection (24). To understand the origin of MBCs, intensive analysis using scRNAseq identified a pre-MBC subset in virus-infected mouse spleens (51) and human tonsils (56). The pre-MBC subsets are characterized by the expression of CCR6 in the both cases, and the mouse pre-MBC subset has relatively higher Mki67 expression than MBC subsets (51). This finding suggests that some CCR6+ pre-MBCs are able to divide before differentiation into MBCs. Here, our data indicate that MBCs can emerge from CCR6+cMyc+ GC B cells that are still dividing. Our flow cytometric analysis and GSEA results revealed that cells within the combined subpopulations of cMyc+early and cMyc+lateCD23int, which are mostly composed of low-affinity clones, are a source of CCR6+ MBC precursors (Fig. 6 A–D and SI Appendix, Fig. S5 C and D). Low-affinity CCR6+cMyc+ MBC precursors were less proliferative compared with low-affinity CCR6negcMyc+ LZ B cells within the combined subpopulations (Fig. 6F). Proliferation of high-affinity CCR6+cMyc+ MBC precursors was comparable with that of high-affinity CCR6negcMyc+ LZ B cells within the same combined subpopulations (Fig. 6F); however, this does not exclude a possibility that a small fraction of high-affinity MBCs can emerge from CCR6+cMyc+ LZ B cells carrying high-affinity BCR. For the MBC fate decision in cMyc+ GC B cells, coexpression of cMyc-interacting proteins perhaps plays a key role. We recently discovered that cMyc binds to the transcription factor MIZ1 to restrict positively selected GC B cells from forming MBCs and favor expansion of GC B cells (57). Hhex, an important transcription factor for MBC differentiation (51), can interact with cMyc to decrease its activity, including cell proliferation and metabolism in tumors (58). Further investigation on inte
|
|
Scooped by
Gilbert C FAURE
January 5, 2021 2:43 PM
|
The rapid spread of coronavirus disease 2019 (COVID-19), caused by severe acute respiratory
syndrome–coronavirus 2 (SARS-CoV-2), has resulted in an unprecedented public health
crisis worldwide. Recent studies indicate that a hyperinflammatory syndrome induced by SARS-CoV-2 contributes to disease...
|
|
Scooped by
Gilbert C FAURE
January 2, 2021 2:14 PM
|
|
|
Scooped by
Gilbert C FAURE
December 27, 2020 2:54 PM
|
Abstract Distinct innate‐like and adaptive‐like immunobiological paradigms are emerging for human γδ T cells, supported by a combination of immunophenotypic, T cell receptor (TCR) repertoire, funct...
|
|
Scooped by
Gilbert C FAURE
December 24, 2020 3:01 PM
|
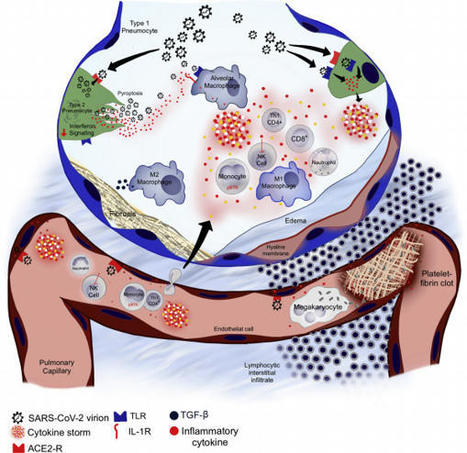
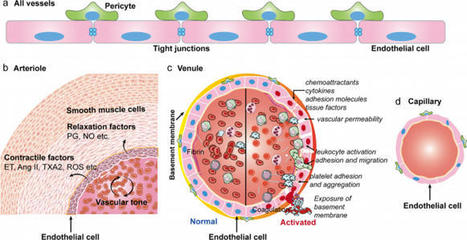
On 12 March 2020, the outbreak of coronavirus disease 2019 (COVID-19) was declared a pandemic by the World Health Organization. As of 4 August 2020, more than 18 million confirmed infections had been reported globally. Most patients have mild symptoms, but some patients develop respiratory failure which is the leading cause of death among COVID-19 patients. Endothelial cells with high levels of angiotensin-converting enzyme 2 expression are major participants and regulators of inflammatory reactions and coagulation. Accumulating evidence suggests that endothelial activation and dysfunction participate in COVID-19 pathogenesis by altering the integrity of vessel barrier, promoting pro-coagulative state, inducing endothelial inflammation, and even mediating leukocyte infiltration. This review describes the proposed cellular and molecular mechanisms of endothelial activation and dysfunction during COVID-19 emphasizing the principal mediators and therapeutic implications.
|
|
Scooped by
Gilbert C FAURE
December 24, 2020 3:35 AM
|
Successful pregnancies rely on adaptations within the mother1, including marked changes within the immune system2. It has long been known that the thymus, the central lymphoid organ, changes markedly during pregnancy3. However, the molecular basis and importance of this process remain largely obscure. Here we show that the osteoclast differentiation receptor RANK4,5 couples female sex hormones to the rewiring of the thymus during pregnancy. Genetic deletion of Rank (also known as Tnfrsf11a) in thymic epithelial cells results in impaired thymic involution and blunted expansion of natural regulatory T (Treg) cells in pregnant female mice. Sex hormones, in particular progesterone, drive the development of thymic Treg cells through RANK in a manner that depends on AIRE+ medullary thymic epithelial cells. The depletion of Rank in the mouse thymic epithelium results in reduced accumulation of natural Treg cells in the placenta, and an increase in the number of miscarriages. Thymic deletion of Rank also results in impaired accumulation of Treg cells in visceral adipose tissue, and is associated with enlarged adipocyte size, tissue inflammation, enhanced maternal glucose intolerance, fetal macrosomia, and a long-lasting transgenerational alteration in glucose homeostasis, which are all key hallmarks of gestational diabetes. Transplantation of Treg cells rescued fetal loss, maternal glucose intolerance and fetal macrosomia. In human pregnancies, we found that gestational diabetes also correlates with a reduced number of Treg cells in the placenta. Our findings show that RANK promotes the hormone-mediated development of thymic Treg cells during pregnancy, and expand the functional role of maternal Treg cells to the development of gestational diabetes and the transgenerational metabolic rewiring of glucose homeostasis. RANK promotes the hormone-mediated development of thymic regulatory T cells during pregnancy; loss of RANK is associated with impaired maturation of maternal regulatory T cells, leading to fetal loss and the development of gestational diabetes.
|
|
Scooped by
Gilbert C FAURE
December 20, 2020 2:15 PM
|
bioRxiv - the preprint server for biology, operated by Cold Spring Harbor Laboratory, a research and educational institution
|
|
Scooped by
Gilbert C FAURE
December 20, 2020 1:51 PM
|
In vitro studies have led to the widely held assumption that replicatively senescent
memory T cells express the carbohydrate epitope CD57. Using a variety of experimental
approaches and mathematical modeling of composite datasets, Ahmed et al.
|
|
Scooped by
Gilbert C FAURE
December 17, 2020 12:58 PM
|
|
|
Scooped by
Gilbert C FAURE
December 14, 2020 5:04 AM
|
Click on the article title to read more.
|
|
Scooped by
Gilbert C FAURE
December 14, 2020 5:02 AM
|
Geriatrics, an international, peer-reviewed Open Access journal.
|
|
|
Scooped by
Gilbert C FAURE
January 9, 2021 6:30 AM
|
Click on the article title to read more.
|
|
Scooped by
Gilbert C FAURE
January 9, 2021 6:29 AM
|
Summary Innate lymphoid cells (ILCs) is the collective term for a group of related innate lymphocytes, including natural killer (NK) cells and the more recently discovered non‐NK ILCs, which all la...
|
|
Scooped by
Gilbert C FAURE
January 9, 2021 4:05 AM
|
|
|
Scooped by
Gilbert C FAURE
January 5, 2021 4:51 AM
|
|
|
Scooped by
Gilbert C FAURE
December 30, 2020 5:37 AM
|
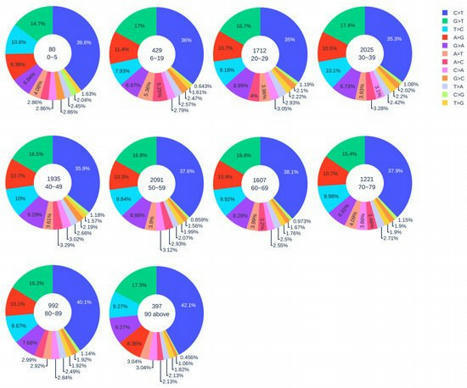
The transmission and evolution of severe acute respiratory syndrome coronavirus 2 (SARS-CoV-2) are of paramount importance in controlling and combating the coronavirus disease 2019 (COVID-19) pandemic.
|
|
Scooped by
Gilbert C FAURE
December 26, 2020 11:56 AM
|
Abstract Macrophages are the first immune cells in the developing embryo and have a central role in organ development, homeostasis, immunity and repair. Over the last century, our understanding o
|
|
Scooped by
Gilbert C FAURE
December 24, 2020 6:35 AM
|
As a major arm of the cellular immune response, CD4+ T cells are important in the control and clearance of infections. Primarily described as helpers, CD4+ T cells play an integral role in the development and activation of B cells and CD8+ T cells. CD4+ T cells are incredibly heterogeneous, and can be divided into six main lineages based on distinct profiles, namely T helper 1, 2, 17 and 22 (Th1, Th2, Th17, Th22), regulatory T cells (Treg) and T follicular helper cells (Tfh). Recent advances in structural biology have allowed for a detailed characterisation of the molecular mechanisms that drive CD4+ T cell recognition. In this review, we discuss the defining features of the main human CD4+ T cell lineages and their role in immunity, as well as their structural characteristics underlying their detection of pathogens.
|
|
Scooped by
Gilbert C FAURE
December 21, 2020 3:55 AM
|
The British Society for Immunology has partnered with the Centre for Inflammation Research at the University of Edinburgh to present a three-part animated series for public audiences on the human immune system and how immune memories form in response to infections like coronavirus.
|
|
Scooped by
Gilbert C FAURE
December 20, 2020 1:55 PM
|
Every organism must recognize damage-associated and pathogen-associated molecular patterns (DAMPs and PAMPs) to react rapidly. The immune system requires potent negative regulators to control unnecessary or overshooting responses and balance the homeostasis in all tissues.
|
|
Scooped by
Gilbert C FAURE
December 18, 2020 10:24 AM
|
any common immunological mechnaism?
|
|
Scooped by
Gilbert C FAURE
December 15, 2020 6:28 AM
|
Animal and plant immune systems use intracellular nucleotide-binding oligomerization domain (NOD)-like receptors (NLRs) to detect pathogens, resulting in the activation of immune responses that are often associated with localized host cell death. Whereas vertebrate NLRs detect evolutionarily conserved molecular patterns and have undergone comparatively little copy number expansion, plant NLRs detect virulence factors that have often diversified in plant pathogen populations, and thus plant NLRs have been subject to parallel diversification. Plant NLRs sense the presence of virulence factors with enzymatic virulence activity often indirectly through their modification of host target proteins. By contrast, phytopathogenic virulence factors without enzymatic activity are usually recognized by NLRs directly by their structure. Structural and biochemical analyses have shown that both indirect and direct recognition of plant pathogens trigger the oligomerization of plant NLRs into active complexes. Assembly into three-layered ring-like structures has emerged as a common principle of NLR activation in plants and animals, but with distinct amino-terminal domains initiating different signalling pathways. Collectively, these analyses point to host cell membranes as a convergence point for activated plant NLRs and the disruption of cellular ion homeostasis as a possible major factor in NLR-triggered cell death signalling. The structures of activated nucleotide-binding oligomerization domain (NOD)-like receptors (NLRs) in plants and animals reveal a common principle of NLR activation, but allow different modes of non-self recognition and the initiation of different immune signalling and cell death pathways.
|
|
Scooped by
Gilbert C FAURE
December 14, 2020 5:04 AM
|
Summary The circadian clock provides organisms with the ability to track time of day, allowing them to predict and respond to cyclical changes in the external environment. In mammals this clock con...
|


 Scoop.it!