


Are your email campaigns suffering from lackluster results? Try these 29 super tips to boost open rates, increase click-through and drive higher response rates faster than you can say "spam trigger."

 Your new post is loading...
 Scoop.it! Are your email campaigns suffering from lackluster results? Try these 29 super tips to boost open rates, increase click-through and drive higher response rates faster than you can say "spam trigger."
Jeff Domansky's insight:
Useful tips to help you get better email results. 
Scoop.it!
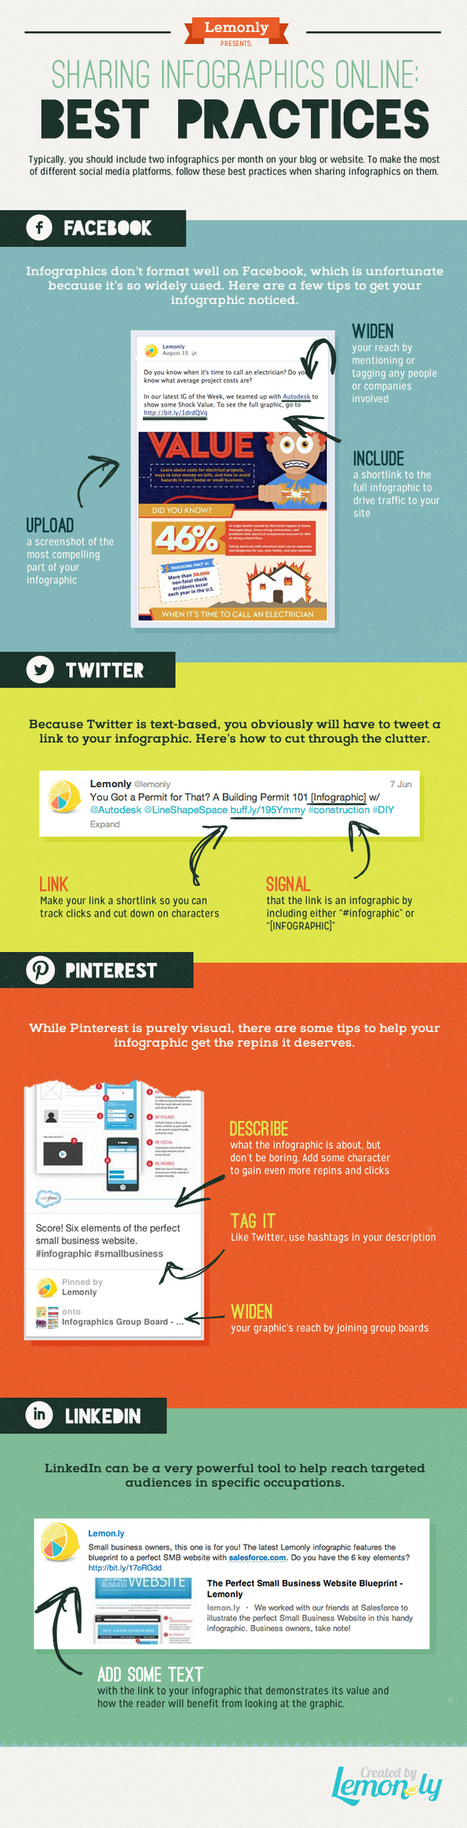
Sharing your infographic that’s hosted on your website/blog and engaging the social sharing potential is key to maximizing the work you put in to creating your infographics. Each social network has different image display requirements. For example, tall infographics do not present well on Facebook. Facebook outlines horizontal images and a ratio of 1200 w x 627 h, meaning you may need to create some sharing images to drive social viewers to the main infographic. The team at Lemonly put together a great infographic covering keys for social sharing on: Have a look and bookmark for future reference... Via Lauren Moss, Jeff Domansky
Jeff Domansky's insight:
Helpful infographics reference and great tips for social media utilization.

Idea Grove's curator insight,
June 25, 2014 6:09 PM
Nice infographic from Lemonly on social media best practices for infographics! 
Jeff Domansky's curator insight,
September 1, 2014 11:33 PM
Helpful infographics reference and great tips for social media utilization. 
ManufacturingStories's curator insight,
October 9, 2014 9:30 AM
For more resources on Social Media & Content Curation visit http://bit.ly/1640Tbl
Scoop.it!
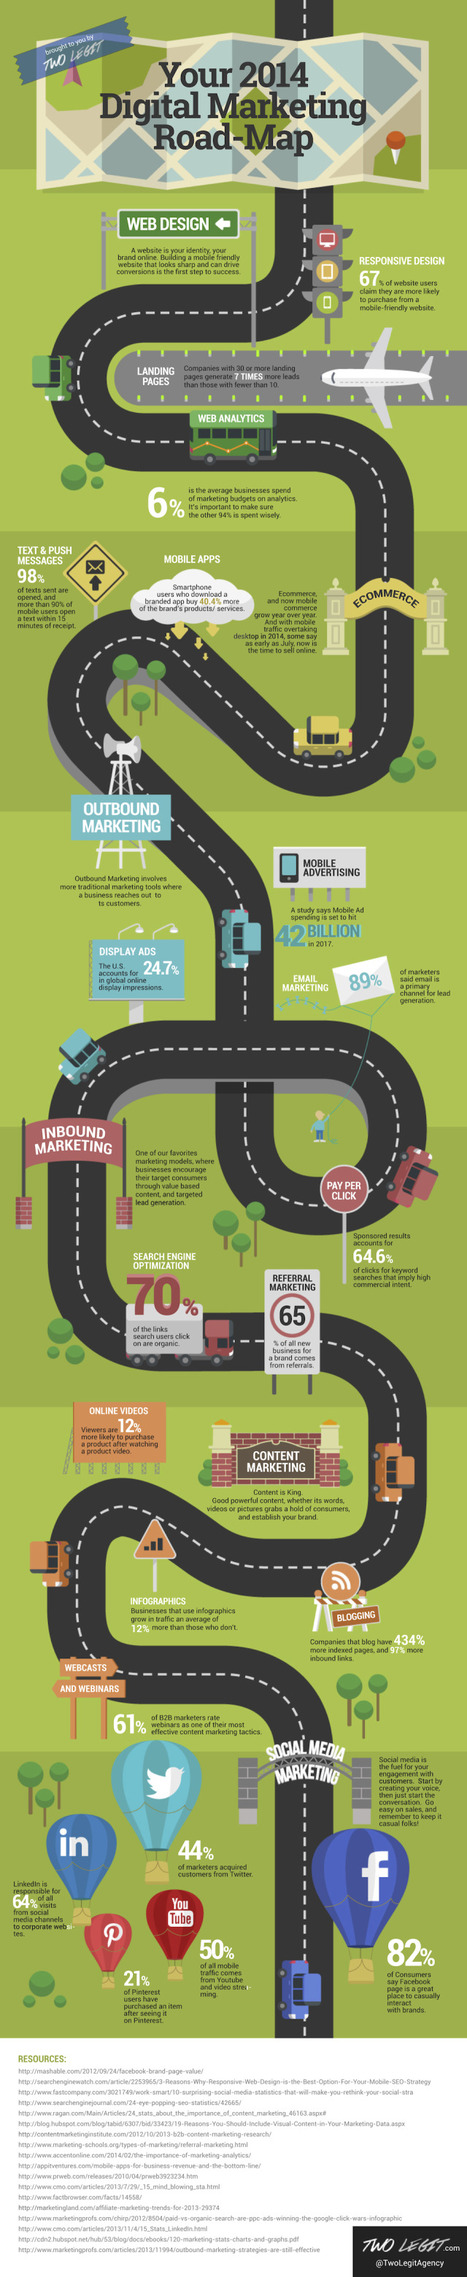
Sometimes it’s easier to just follow the dotted line as you’re looking to ensure your digital marketing is balanced and complete. This infographic compliments of Two Legit aims to do just that, walking you through your web presence, mobile, ecommerce, outbound, inbound, content and social media marketing initiatives. One element lost in this infographic is the ability for all of the strategies to work with one another. For instance, utilizing your content marketing to power newsletters that are optimized for mobile devices. That’s not defined in this infographic but it’s an absolute necessity if you’d like to fully leverage email and ensure your emails are read properly. I’ve written before that the modern digital media consultant is more of a conductor, balancing the volumes of each strategy to make some sweet, sweet music! More often than not, we find that the key to marketing well isn’t doing everything… it’s balancing a combination of strategies, amplifying the impact by having them work together, and understanding how much of each strategy to initiate in order to maximize results. That said – this is still a great checklist to go down and ensure you’re not missing anything! This infographic also provides some statistics behind the digital marketing trends....
Jeff Domansky's insight:
Great infographic good luck at digital trends.

Paulo Stamm's curator insight,
August 17, 2014 5:44 PM
Excelente gráfico sobre marketing tecnológico. 
Steve Whitmore's curator insight,
August 18, 2014 8:29 AM
Something to think about??? I need to examine more closely.
Scoop.it!
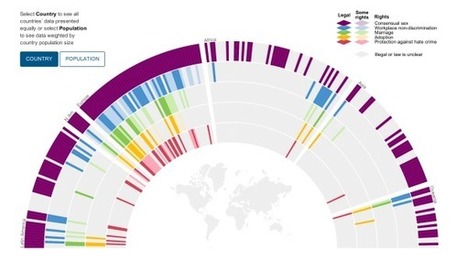
Finding the newest way to get you brand in front of an audience these days can be challenging. There’s tons of brands utilizing different marketing efforts to get their product in front of potential customers. There’s blog posts, infographics, videos, and more.However, there’s a new player in town, and it’s an online interactive. Brands are jumping on the interactive bandwagon, and honestly, some of the stuff that’s being put out there is amazing! What are Interactives? Essentially at the end of the day, an interactive is pretty much an infographic that you can interact with. Interactives are the most effective method of displaying limitless chunks of data or information in a clean, correlated, and engaging format....
Jeff Domansky's insight:
Interactives are a great complement to infographics.
Jeff Domansky's curator insight,
August 11, 2014 2:28 AM
All about interactives and how to put them to work.
Scoop.it!

Google+ seems to be an enigma in the social world, the quiet kid in the corner of the room that most are afraid to interact with. This is particularly so in marketing. But it doesn’t have to be that way. In fact, Google+ can be friendly and a resource with amazing results when a respective marketer learns how to utilize it in the right manner. Google+ is all about visibility, exponentially so when it comes to B2B campaigning. Learning about Circles, Communities, Influencers and Authorship is the first key to G+ B2B domination. You’ll also need to be prepared to: • Keep Up With Your Plus Stream • Share Content Daily • Reach Out to Influencers • Use Google Hangouts • Use Communities • Monitor Follower Growth Need more details? No sweat! This infographic below will have you on track to G+ B2B marketing success....
Jeff Domansky's insight:
Practical tips for Google

wanderingsalsero's curator insight,
August 15, 2014 11:03 PM
I remember reading somewhere that Google has somehow changed their perspective about Google+ and that henceforth it wasn't destined to be such a powerful social media tool. Didn't they even assign a new guy to lead that department..... and the original guy who had all the great dreams for it went somewhere else?
On the other hand, I suppose it'll always enjoy some degree of favoritism from Google simply because it's one of their own.
Scoop.it!
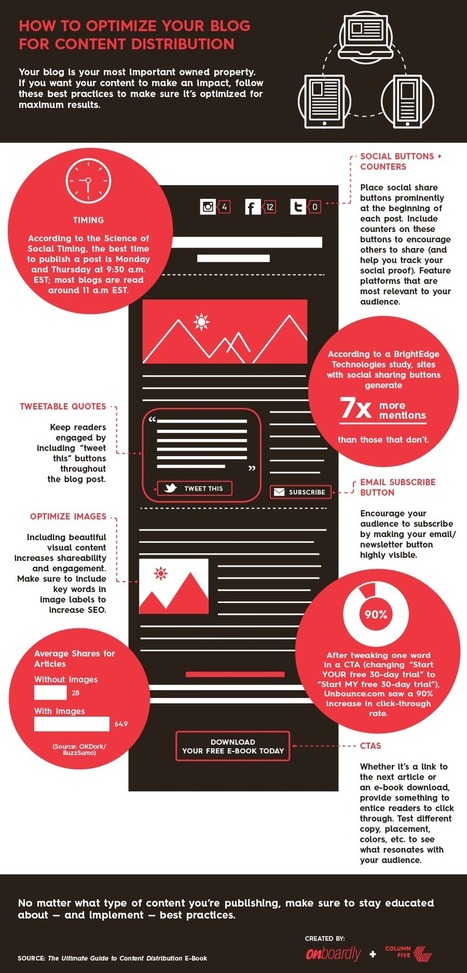
Your blog is your most important owned property on the internet. If you want your content to make an impact, follow these best practices to make sure it's optimized for maximum results.According to a BrightEdge Technologies study, blogs with social media sharing buttons generate 7X more mentions than those don't. So make sure you place social sharing button prominently at the beginning of each blog post. Include counters on these buttons to encourage other to share (and help track your social proof). Feature platforms that are most relevant to your audience. Similarly. including images increases shareability and engagement up to 64 percent (according to OKDork/BuzzSumo). So add beautiful visual content in your posts. Take a look at this infographic from onboardly that proposes 5 tips on how to optimize your blog or website for content distribution....
Jeff Domansky's insight:
Blogging basics for better results in your blog posting
Jeff Domansky's curator insight,
July 28, 2014 9:58 AM
Blogging basics to help you get better results and increase sharing of your blog posts.
Scoop.it!
Do you know how to create the perfect Pinterest brand page? Before someone follows you on Pinterest the first thing they will do is to briefly observe your Pinterest brand page. They will glance at your bio, your profile image, your boards and various other components. If your Pinterest brand page is well set up, you will gather board followers or even better, complete page followers and all the time you spent pinning, optimizing your website for Pinterest and running time consuming campaigns will be worthwhile. So today you will learn how to create the perfect Pinterest brand page, the requisite for Pinterest success. I will first run you through the registration steps and you can then view the infographic which contains the ingredients for a perfect Pinterest brand page. If you have already got a brand page and don’t require registering you can scroll down and skip right ahead to the infographic….
Jeff Domansky's insight:
Your brand on Pinterest? You betcha.
Jeff Domansky's curator insight,
July 26, 2014 10:10 AM
Here's a basic, practical guide for setting up your business page on Pinterest.
Scoop.it!

The markup of some items might surprise you. Coupon site Sumocoupon analyzed some consumer data and put together an infographic revealing the markup of 37 products. The site calculated the data based on information collected from production pricing reports on news sites like CNN and the New York Times. While this isn't the most scientific of methodologies, they're open about their sources and you can check out the data from each report. More than products, they found that services have the highest markup. This is pretty obvious, but the numbers are a little surprising. For example, interior painting had a markup of 6,329%. Companies charge thousands, but the supplies cost a little over a hundred bucks, according to their data....
Jeff Domansky's insight:
Very interesting look at pricing and profits.
Jeff Domansky's curator insight,
July 24, 2014 12:59 AM
We all know there's markup on most things we buy. But the markup of some everyday items might surprise you.
Scoop.it!
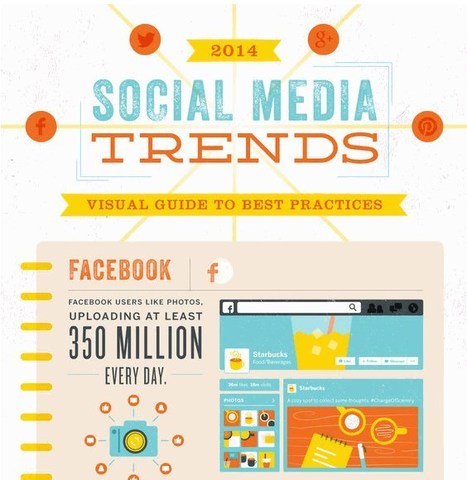
The world of social media is ever-changing. It’s important to keep current on best practices to ensure that you’re doing all you can to keep your marketing campaigns and initiatives fresh. The team at Vocus has researched the latest and greatest trends in marketing on Facebook, Twitter, Google+, Flickr, Pinterest, Instagram, Vine, LinkedIn, and YouTube. Here’s what they found:...
Jeff Domansky's insight:
Very useful social media best practices reference.

Joshua McCarty's curator insight,
July 14, 2014 1:48 PM
Fantastic #inforgraphic about how social media is being used. To those that continue to ignore social media...good luck with that!
Scoop.it!
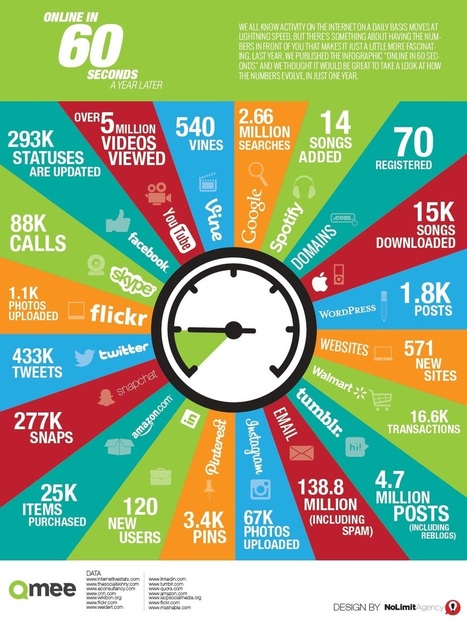
According an infographic from Qmee in 60 seconds, 293K statuses are updated on Facebook, WordPress bloggers share 1.8K new blog posts, web users download 15K songs, and Instagramers upload 67K photos. "We all know activity on the Internet on a daily basis moves at lightening speed, but there's something about having the numbers in front of you that makes it just a little bit more fascinating." This infographic looks at what happens in just one minute on social web...

Jodi Dichter Kaplan's curator insight,
July 14, 2014 10:19 AM
What happened in your business the last 60 seconds? Let Peak Reputation, Inc. enhance your online reputation and help you to convert better. #peakreputation #effectivemarketing 
Frank J. Papotto, Ph.D.'s curator insight,
July 15, 2014 1:29 PM
Gives you a real sense of the kinds of change we must must deal with every day
Scoop.it!

Whether you are new to content marketing sphere or an old expert, it's always good to keep up on what the top industry pros are saying. Here's an infographic created by referralcandy filled with 24 juicy tips and trends, every marketer needs to know. A key trend and tip: Interesting content is one of the top 3 reasons people follow a brand on social media site, while 7 in 10 consumers prefer getting to know a company via articles than ads....
Jeff Domansky's insight:
Invaluable inbound marketing tips.
Jeff Domansky's curator insight,
July 4, 2014 3:57 AM
This handy infographic from ReferralCandy gives 24 useful tips for eCommerce content marketing from top inbound marketing experts. 
idweaver's curator insight,
July 4, 2014 11:17 AM
Cette infographie est une vraie bible pour tout Content manager!
Scoop.it!

Have you ever heard an acronym but you didn't know what it meant? It can really throw you off your game in a conversation. I usually try to write it down discreetly or, if I have a laptop, look it up online without anyone seeing. But some acronyms have multiple meanings, even industry-specific ones, and sometimes Wikipedia doesn't do them justice. That's why we curated 60 of the most common marketing acronyms into an epic glossary you can skim, study, or bookmark and save for later....
Jeff Domansky's insight:
Got your CoCA together? Maybe you need more AIDA or a CTA? Find out more.
Scoop.it!

... According to a study by YuMe and Nielsen, between 2010 and 2012, millennial males have cut their TV viewership by 10% — more than any other demographic. YuMe found that if advertisers moved 10 to 30% of their TV budgets to Internet and cross-platform campaigns, they increased their reach up to 11%. Check out the "shift happens" infographic to find out more about reaching millennial males in the digital age and to get the full story on digital advertising. Click to get the complete study.
Jeff Domansky's curator insight,
June 18, 2014 10:07 AM
Advertisers are spending way too much trying to reach millennial males. A shift in marketing thinking is critical. |
Scoop.it!
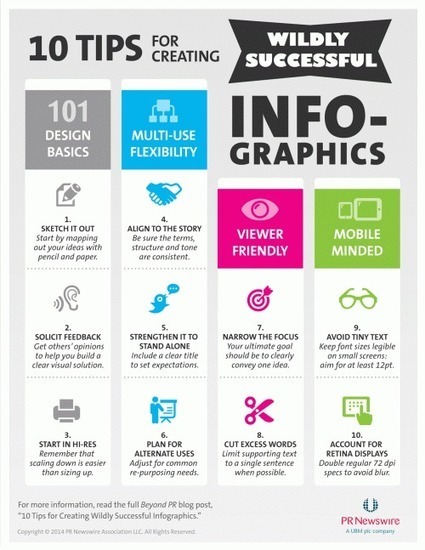
Infographics are playing a larger role in visual storytelling efforts. When they are thoughtfully designed, they provide attention-grabbing visuals that also help the reader better comprehend and remember the message. This added value to the reader often encourages further engagement and sharing. Based on my experience creating infographics that are used in PR Newswire’s press releases, blog posts and presentations, here are some best practices for designing infographics that drive results....
Jeff Domansky's insight:
Great Infographics and content marketing tips for marketers, PR pros and small business.
Jeff Domansky's curator insight,
September 7, 2014 10:39 AM
This is a very useful collection of best practices and tips for infographics. 
OXY GREY's curator insight,
September 8, 2014 3:17 AM
10 conseils pour réussir ses infographies. Toujours rester user-friendly.
Scoop.it!

What people are sharing and how they’re sharing it is changing fast. A new infographic from Go-Gulf, a web design team based in Dubai, has gathered the latest data, which is now available in this newly released (July 2014) social media infographic. Here are the highlights… Via Lauren Moss, Jeff Domansky
Jeff Domansky's insight:
An excellent compilation and social media reference tool.

Rachel Turner Dool's curator insight,
October 26, 2014 6:47 AM
Wow! what a list of stats. Some really interesting ones here... 
CONETZAR's curator insight,
October 30, 2014 6:21 AM
¿Alguna vez te has preguntad qué comparte la gente en las redes sociales? Y, ¿por qué lo comparte? Esta interesante y completa infografía muestra los elementos más compartidos en las redes sociales durante el año 2013. Estos van desde vídeos hasta opiniones o noticias. También se analiza lo compartido en las diferentes redes sociales y por qué se eligen esos medios para compartirlo. Por último, es posible conocer los datos demográficos de los usuarios de redes sociales.
Para terminar... un dato curioso: Según este estudio, el país en el que más contenido se comparte a través de las redes sociales es Turquía, con un 93 %.
Scoop.it!
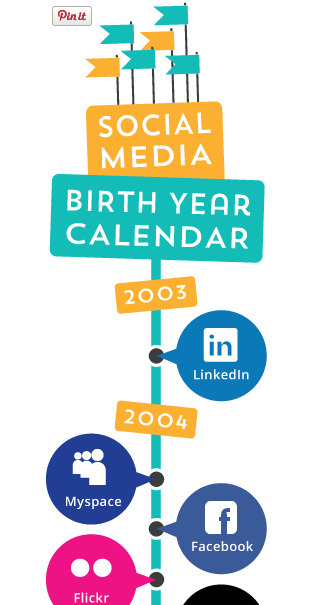
...To think of what “might be” a few years from now is barely fathomable but really exciting! I remember listening to the keynote speaker at the 1990 Seybold Conference talk about how books in the future would be enjoyed on electronic readers, and thinking, “not in my lifetime would electronic readers replace printed books.” We all know how that turned out. Let’s go back and hit the high points from the past ten years. Below is a visual infographic timeline followed by a more detailed look at each year! Pay close attention to the ones that were launched in 2012; some of them have a lot of potential to be game changers!
Jeff Domansky's insight:
Great way to look at the history of social media.

Amanda Swanson's curator insight,
August 22, 2014 8:22 AM
# 19 - A quick look at social media development over the last ten years.

Angie Thao's curator insight,
May 13, 2016 10:58 AM
Timeline Infograph: Like: It's to the point, uses good visual. Dislike: Maybe some information??
Scoop.it!

You already know social media works.The question is, how to make it work best for your business. The key is finding best practices that complement your marketing strategy. A recent social media trends guide by Vocus reveals top ways to use visual marketing across your social media channels. Ready to use the power of graphics to grab the attention of your audience? Below you will find top ways to incorporate visual media into nine of today’s hottest social networks, including real business examples and a handy Infographic!...

LocalMark's curator insight,
August 14, 2014 9:05 AM
FINALLY! Thank you for making this. So helpful.
Scoop.it!
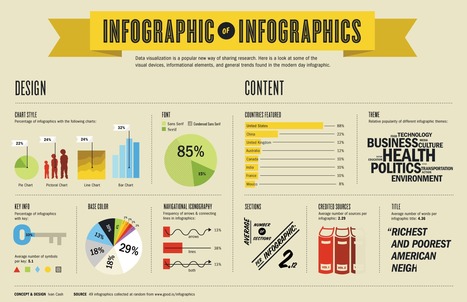
9 informative infographics to help guide your visual content marketing, explaining why we love images and videos in the content we read, share, and enjoy.
Jeff Domansky's insight:
Great visual tips and reference.
Jeff Domansky's curator insight,
July 29, 2014 12:39 PM
Great resource and tips from Kevan Lee at Buffer
Scoop.it!

Can you share a picture that you found on social media or a website (or in Google image search)? The infographic answers that: "While the laws about distributing images through social media channels likes Facebook, Pinterest, Google+, and blog are still fuzzy, it is generally considered acceptable to redistribute an image that was originally intended to be publicly viewed by the creator. This is why you will typically find original images re-posted on blogs, news sites, and social networking sites even if the person re-distributing the images didn't obtain permission to do so....
Jeff Domansky's insight:
Are you using photos properly in your blogging? Find out with this handy reference guide.
Jeff Domansky's curator insight,
July 28, 2014 12:53 AM
Are you using images according to legal and ethical standards? find out what this handy infographic guide.
Scoop.it!

Pinterest has 70 million active users worldwide. The social network also generates more traffic than YouTube, Google+ and LinkedIn combined. And when it comes to money per click, Pinterest generates 27 percent more money than Facebook and 400 percent more than Twitter. Because of these numbers, you have no choice but to leverage Pinterest. And to show you how can you use Pinterest to promote your business, the folks at Emerchantbroker have created a nifty infographic called "How To Become a Pinterest Warrior" that breaks down everything you need to know about the visual based social network - Pinterest.v Here are some key takeaways:...
Jeff Domansky's insight:
Want to set up your business on Pinterest? Here's how.

Charlie Dare's curator insight,
July 26, 2014 9:36 PM
How to use Pinterest to promote your artisic product for greater exposure ~ 
WebTech Group's curator insight,
July 26, 2014 9:53 PM
Great info. Pinterest is great for businesses.
Scoop.it!
Here's a quick list of do's and don'ts that will help you understand at a glance how to approach social selling and generate real results.
Jeff Domansky's insight:
Good reminders for social marketers.
Jeff Domansky's curator insight,
July 23, 2014 10:17 AM
Useful reminders of what works in social selling and what doesn't.

Denise Griffitts's curator insight,
July 23, 2014 3:25 PM
There is a very fine line between selling and nagging. Engagement is the key.
Scoop.it!

From
3cseo

CcDo you find yourself overwhelmed by the complexity of content marketing? You have to curate AND create content, find contributors, strategize a posting calendar, actually ACCOMPLISH that strategy, and then share all of the content to boot. It's enough to make anyone's head spin. But a marketer can always benefit from some really great tools, and the GSMI Network has certainly done the job reporting on the best content marketing tools in this infographic....
Jeff Domansky's insight:
Here's a helpful social marketing tools checklist.
Scoop.it!
We love visual content. In an ever-changing world of digital marketing, visual content can help provide a look into quick tips and tricks around engaging topics in one colorful and compact package. With this in mind, what’s better than an infographic? There are many varieties of infographics available that surround the topics of Digital Marketing and Social Media. To help sort through the volume, we’ve picked out five infographics your brand can use for developing and improving your content strategy....
Jeff Domansky's insight:
This is a must-read collection of social marketing research and data for marketing, PR and content pros.
Jeff Domansky's curator insight,
July 12, 2014 2:36 AM
What a great collection of social marketing data for marketing, content and PR pros. Recommended reading. 9/10 
Margaret McKinley's curator insight,
July 16, 2014 9:25 AM
This has a great simple summary of current social reach and preferences
Scoop.it!
How Much Data Is Generated On Twitter, Instagram, Vine, Tinder & WhatsApp Every Minute? | AllTwitter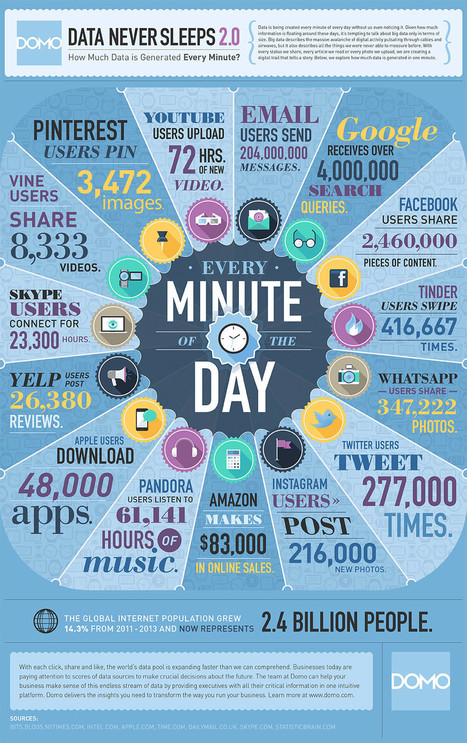
Here’s the thing: the internet never sleeps. Which means data never sleeps, and the internet sure likes to use up a lot of it. How much? In any given minute, 277,000 tweets are published on Twitter, 216,000 photos are sent to Instagram and 8,333 videos are shared on Vine. And we’re just getting started. Over that same 60 second period, 347,222 photos are sent on WhatsApp, 416,667 swipes are made on Tinder and 3,472 images are pinned on Pinterest. And if you think that’s impressive, Google receives 4 millions search queries, Facebook users share 2.46 million pieces of content and 204 million email messages are sent each and every minute of the day. This visual from DOMO looks at how much data is generated every minute across the net....
Jeff Domansky's insight:
Big data, big social media.

Ignacio Garrido's curator insight,
July 1, 2014 1:14 AM
Exercise 33. Remember you have to send the answer by Moodle. Good Luck¡¡
1. Write an opinion about avantatges and disavantatges of the nes technologies and in relation with the text. 2. What is the most used network in graphic? Why do you think? 3. How many graph's apps do you know? How many do you use daily?
Scoop.it!

...Now that content marketing has been around long enough for trends to cement, we’re getting close to a thought leadership bubble. Too much of it has become farce. The widespread publishing of ghostwritten posts from marketing leaders will continue to cheapen the impact that comes from the leaders who regularly put in the time and effort to pen their own insightful work. To me, that point seems inarguable. “Marketers are beginning to get less value out of these posts,” Westervelt added. “Not just because of whatever Google decides to do with guest blogging, but because being one of only a handful of CEOs to contribute a story to Forbes once in a while is a whole lot more valuable than being just one among hundreds and having your post buried within minutes of being published.” Google, in the spirit of keeping the Internet free of clutter, has echoed this idea by penalizing some guest blogging network in search rankings to prevent readers from accessing spammy content that all sounds the same....
Jeff Domansky's insight:
Jordan Teicher tackles thorny problem of fake thought leadership and content marketing. Valuable debate and recommended reading.
|







Useful tips to help you get better email results.