 Your new post is loading...
Instagram has become a mecca for the younger generation to share moments of their life. Hiking the local trails, showing off an amazing meal or just taking selfies with friends. Instagram has established itself as the main contender for sharing images of one’s life, but more companies are getting into the mix.
Company instagram profiles are becoming more prevalent especially in the food and entertainment industries. Showing off great moments from live shows and delicious food is perfect for instagram.
Today’s infographic will go over the important options when deciding to advertise with Instagram. #payattention
Do you want to make your infographics iconic? Okay, so we don’t mean “iconic” in the usual sense. We mean using icons in your infographic design. Icons are those little illustrative graphic images/clip art that represent an object, action or idea. They are often stylized and simplified designs. N
Using icons can make your infographic design more cohesive and more professional. With Venngage you can choose from over 10,000 icons in our icon library and stylize them to your preference by editing their colors, sizes and positions. Here are some tips for how to use icons in your infographics....
Infographics have become the design darling of visual marketing.
It’s no wonder organizations and individuals are taking advantage of them as a communication tool. We’ve scoured the web to compile a collection of 45 inspiring infographics that show what’s possible in this design category. Browse through them to get some ideas for your next project....
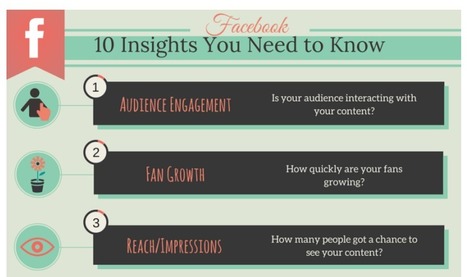
What social media analytics do you use to verify that your Facebook Page is working well?
What do you monitor and improve on, on a weekly or monthly basis?
We have all heard about organic reach declining on Facebook and
… of course, that is true.
It’s harder to get reach. But you can increase your reach and engagement if you monitor your analytics....
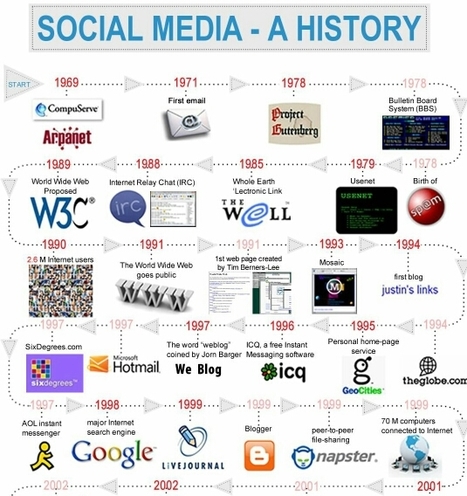
What’s your first memory of social media?Twitter, perhaps? Or maybe Facebook?
If you’re of a certain age, you’ll likely remember when MySpace was very much numero uno amongst all social platforms. Roll the years back a little further, and you could have been one of the (relatively) few who were amongst the pioneers of modern social networking on Friendster.
But here’s the thing: the history of social media actually goes back a lot further, and its roots can be found in blogging, Google, AOL, ICQ, the beginnings of the world wide web and, perhaps surprisingly, CompuServe. This infographic from Creative Ramblings takes a closer look at the history of social media, 1969-2012....
The mere thought of creating your own infographic can be scary and often is thought of as a complex task that can entail tens of hours.
Visme is about simplifying the infographic creation process, so we thought: why not use our own tool to show you how to create your own infographic?
We collaborated with Randy Krum of Cool Infographics, an expert in data visualization and author of the book “cool Infographics” to create a simple interactive infographic that breaks down the process of designing an infographic into 5 easy to understand steps.
Check it out and rollover each section for more information....
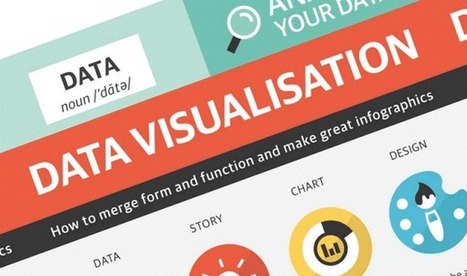
The following infographic, created by Zhenia Vasiliev, breaks down the basics of data visualization. It shows how beginners can merge form and function, and design meaningful infographics.
Key highlights: - Analyse your data: Analysis is the key. Before we can visualize the data we need to understand it. - Come up with a story: Story is finding a single strand of meaning in an endless sea of information. It has a beginning, middle and end. - Make it visible: Visualization is a creative act of making. Making the data visually elegant evident and engaging. - Entertain to educate: Good data design need to illuminate and inform the viewer, elucidate and illustrate the facts and stats....
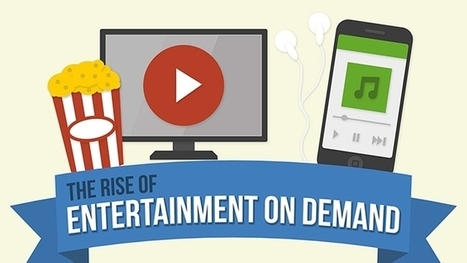
If we've learned anything from the Digital Content NewFronts, it's that production of premium video content is exploding. More than 30 digital media companies are producing hundreds of hours of new online programming, and it all comes in an increasingly on-demand marketplace.
According to data compiled by Ninja Metrics, streaming services cost 39 percent less than a bundle of expanded basic cable channels. Meanwhile, music downloads are down and streaming is up.
Here's a look at the rise of entertainment on demand....
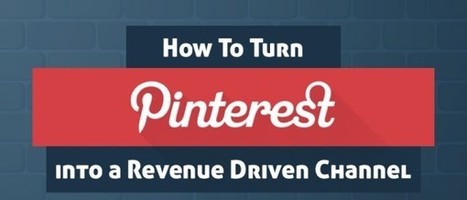
For many people, social media is one a great place to meet new consumers and gain followers. One of the most popular and overlooked social media sites is Pinterest. Pinterest is an online bulletin board that lets users save photos and pictures.
Users have multiple boards and can favorite and follow photos, boards, and users. Users see newly updated pins on their stream as people, and boards they follow are updated. This is a unique opportunity to showcase your products and help you generate income on Pinterest....
Creativity and great ideas can be dosed in a masterly way of aninfographic. Those 14 infographics is proof of that. They are tremendously useful information, it does so with full creativity and originality. Although most of them are about web design, some of those is also for SEO professionals or graphic designers themselves. I recommend you take a look at them because from the visual and composition view are very well developed....
I’ve never met anyone who dreamed of integrating EHR software or auditing SOX compliance as a child. And I certainly don’t recall my mother sewing together a B2B content marketer costume for my first Halloween.*
But we’re actually in excellent company. The trouble is, however, your business can no longer rely on boring, boilerplate text to fill its funnel. That’s why I’d encourage you to spice up your content cookbook with a bit of infographic marketing. ,*It was a Peter Pan costume, and it was flawless.
Why do infographics outperform vanilla text?...
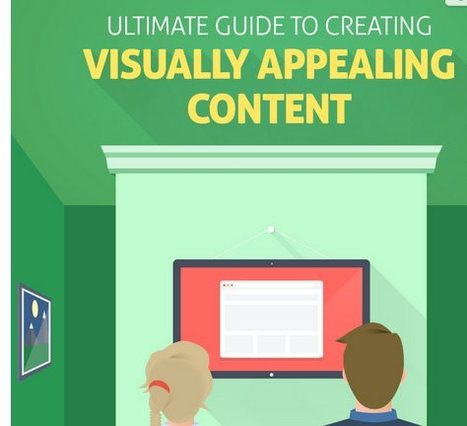
Have you noticed that I publish a lot of visually appealing content on Quick Sprout? From videos to infographics, I’m constantly leveraging visual media.
Can you guess why?
It’s because these visual content pieces are generating more backlinks than any other form of content I publish, which—in the long run—helps increase my search engine rankings and overall readership numbers.
So, how do you create these visual masterpieces? Well, this infographic should help you....

|
Scooped by
Jeff Domansky
February 23, 2015 11:01 PM
|
With so many press releases crossing the wires every day, it’s a wonder anyone ever sees the fruits of your hard work.
But there are several ways—10 listed here—to get more eyes on your press release.
From keeping your headlines short to focusing on your keywords and including a call to action, use this infographic from Ervin & Smith to help you get the most out of your press releases:...
|
|
|
Scooped by
Jeff Domansky
November 6, 2015 1:03 AM
|
There are so many tools being released every day allowing us to easily create better and better images— including infographics—to share and use in our marketing efforts.Even folks (like me!) who never thought it possible to create one ourselves!I had a lot of fun researching and testing out a handful of different infographic makers, and I’d love to share the seven tools I liked best to easily create beautiful infographics....
A 2013 study by Louis Alfieri published on Educational Psychologist suggested that case comparison activities commonly led to greater learning outcomes over other forms of case study including sequential, single case, and non-analogous, as well as traditional instruction.
Today, we are going to learn how to take advantage of this concept and apply it to design an excellent educational infographic.Keep reading!...
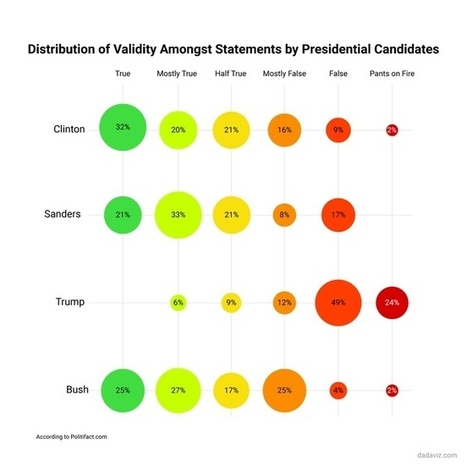
This Data Visualisation by @iantsommers. should be required reading for all US voters. As should is data source Politifact.
While great infographics come in a variety of forms, the common thread is that they're visually pleasing and designed in a way that makes complex topics easy to understand whether you're a novice in the subject or an expert.
Here are 10 brands from all different industries -- from home furniture to health care -- that totally nailed their infographics this year so far. Check 'em out and get inspired!...
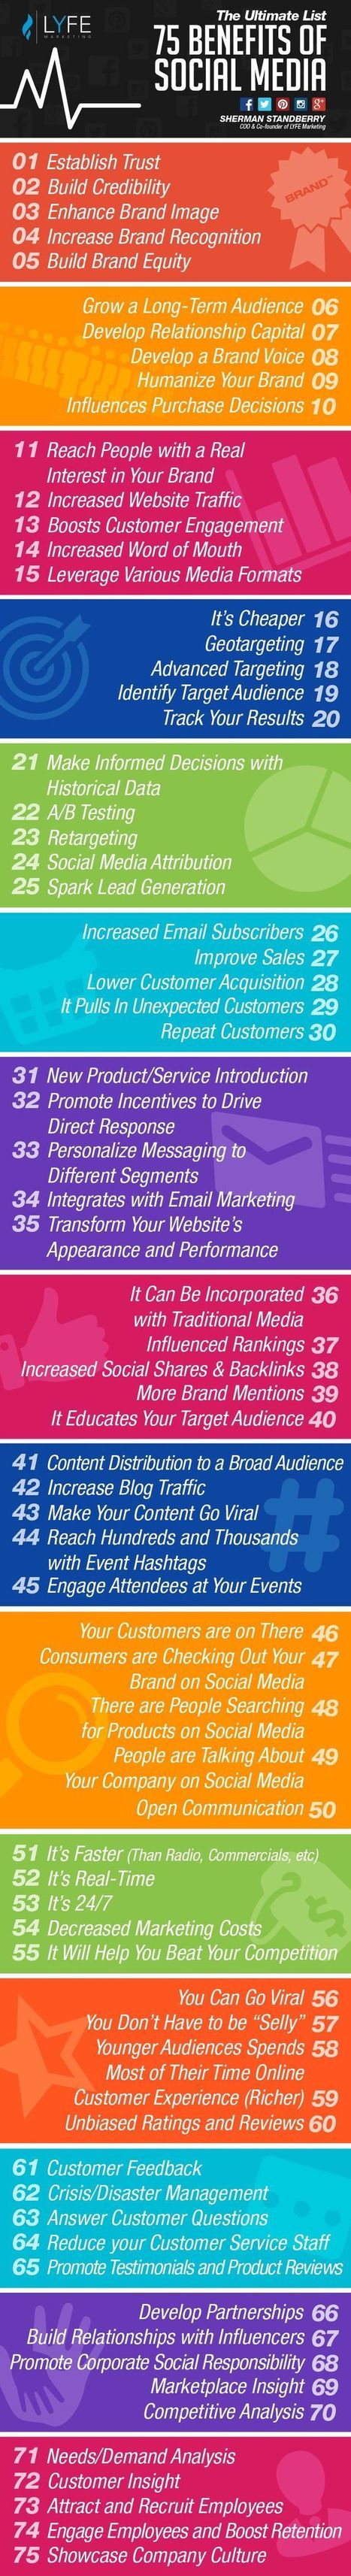
How many benefits of social marketing can you think of?
Social media can be used in so many ways – to develop your brand, increase SEO rankings, distribute content, acquire leads, and more. While many blogs talk about these benefits, there are very few that attempt to outline the “big picture” of social media or a comprehensive list of its benefits.
I decided to take a stab at it and ended up with 75 benefits of social media marketing. Below is an infographic with a compiled list of benefits. Check it out and see which benefits your brand is potentially missing on social media....
This infographic about infographics utilizes a cool blueprint flowchart concept.. something you’d think of as stereotypical for a blueprint. It’s cool, but it might be a tad ironic – it’s harder to read than you’d like it to be. Let’s jump into the things that you should focus on to make sure your infographic looks simple, readable and beautiful.
inIn every minute of every day, loads of data are being generated. Just how much, you ask?
A lot happens in a minute:
YouTube users upload 48 hours of new video
Instagram users share 3,600 new photos
Brands and organizations on Facebook receive 34,722 "likes"
Over 100,000 tweets are sent...
With no further ado, check out this jam-packed infographic from TheShelf.com. It’s full of brilliant stats that will help you seize the importance of influencer marketing. Once you’ve read everything, start to identify influencers in your industry and get started!...
Sharing your infographic online is no different. There are hundreds of thousand of infographics out there. In fact, if you search the term “infographics” in Google over 43 million search results populate.
Everything from the latest blog post about infographics (like this one) to different tools and programs you can use to create an infographic appear in search results.So, how do you get your infographic to not only show up, but be shared across networks? Follow the below five steps, do even more research than necessary, and begin your road to virality....
Great storytelling is a great differentiator.
Imagine you're walking down the snack aisle at a grocery store. How do you make sense of the hundreds of choices on either side of you? What's going to be on your mind when you decide what to buy? Perhaps you choose one product over another because that company donates a percentage of their proceeds to a great cause. Or maybe you choose it because it has more protein -- and you were just reading this article about how protein helps boost concentration, and you've been having trouble concentrating at work recently.
People like making decisions quickly, and it'll be easier for them to choose your stuff if your message resonates with them. After all, content helps people travel through the inbound marketing methodology so that, someday, they might buy something from your company and spread your company's story with others.
But, as you may have noticed, a lot of people are trying to tell stories these days. How are you going to set yours part from the pack? And where on earth do you begin creating compelling stories for your brand?...
In this post we won’t give you any graphic design elements for creating infographics, but instead we will showcase 20 best social media infographics with useful info you will definitely want to check out! These great social media infographics will teach you lots of useful things, from how to spot trolls and how to deal with them, to secret formulas for viral shares on social media!...
Well, I’m here to tell you that it’s definitely possible to create some awesome infographics in any category that you choose, EVEN if you’re not a designer. In this blog post, I’m going to introduce you to three awesome tools to create the best infographics, tell you how to use them AND how you can share your infographics in different channels all over the web. So, let’s get started!..
|


![The Complete guide to Advertising on Instagram [Infographic] | Daily Infographic | World's Best Infographics | Scoop.it](https://img.scoop.it/NrASD6DdBQPNL1fW3zbtvTl72eJkfbmt4t8yenImKBVvK0kTmF0xjctABnaLJIm9)


![A Visual Guide to Telling Compelling Stories for Your Brand [Infographic] | World's Best Infographics | Scoop.it](https://img.scoop.it/bdgdY0H6lziC8cidQvoRtTl72eJkfbmt4t8yenImKBVvK0kTmF0xjctABnaLJIm9)


Esta infografía aporta usos muy prácticos en cuanto a marketing en Instagram se trata. Conviene tenerlo a mano.
Very useful social marketing tips.
Very useful social marketing tips.