 Your new post is loading...
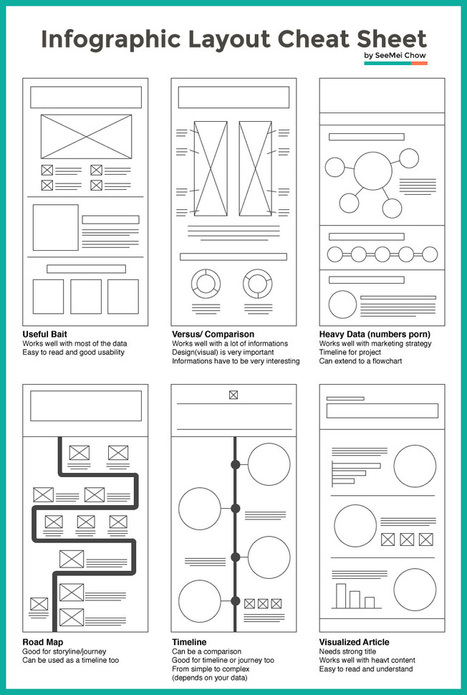
Infographic layouts refer to the arrangement of your visual elements and your content. When you begin working on a piece of infographic, you should have a story to tell hence, you will need to select a layout that best suits your story. Using the right layout will ensure good readability and convey your message well.
We have put together a cheat sheet for your quick reference to the right arrangement to use, here are six common ones you can quickly work with....
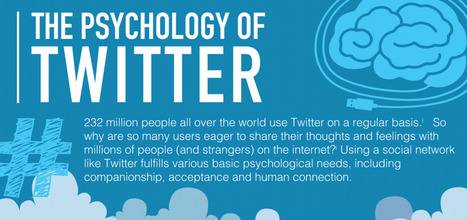
In an age where millions of people document their lives online, it begs the question: what are the psychological reasons behind Twitter? Read more about the psychology of social media here.

|
Scooped by
Jeff Domansky
February 8, 2015 11:34 PM
|
This infographic below from SurePayroll, illustrates peak times and guidelines for Facebook, Twitter, LinkedIn, Pinterest, Tumblr, and Google +. They are all different, but what most share in common is to avoid posting early morning on the weekends, or after 3 pm on Fridays. Start posting at the right time, to get the best results.
Maintaining a steady stream of content that's unique and interesting to your target audience is a challenge. But with a big dose of creativity (and a little help from content idea generators), you can create content that's not only valuable to your market, but also stands out from the sea of information.
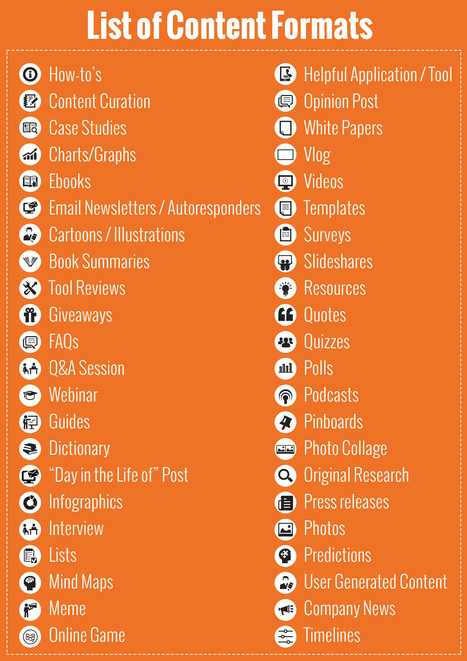
44 Fantastic Types of Content
There are tons of options out there for content you can create. Forty four content types are outlined below, so look through the list and see which ones would make a perfect fit in your marketing plan....
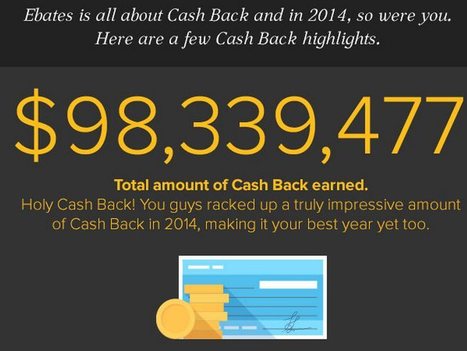
Cashback industry leader eBates had a phenomenal year, returning $98,339,477 to consumers. Consumers are now embracing cashback programs and merchants are seeing the benefits of this powerful marketing strategy in driving sales. The future strength of the cashback industry is further reflected in the purchase of eBates for more than $1 billion by Japanese conglomerate Rakuten.
We live in an age of Big: Big Computers, Big Data, and Big Lies.
Faced with an unprecedented torrent of information, data scientists have turned to the visual arts to make sense of big data. The result of this unlikely marriage—often called "data visualizations" or "infographics"—has repeatedly provided us with new and insightful perspectives on the world around us.
However, time and time again we have seen that data visualizations can easily be manipulated to lie. By misrepresenting, altering, or faking the data they visualize, data scientists can twist public opinion to their benefit and even profit at our expense.
We have a natural tendency to trust images more than text. As a result, we’re easily fooled by data visualizations. But fortunately, there are three easy steps we can follow to save ourselves from getting duped in the data deluge....
Have you ever wondered when you should be sharing your content on the social web?
Your visitors and followers prefer using social media sites during specific hours. So if you start sharing your content when your users are on these social sites, you’ll not only gain more shares, but you’ll also notice an increase in traffic.
So, when should you be sharing your content? Well, just follow the times in the infographic below....
Although I love the traditions I’ve always followed to celebrate this holiday, I can’t help but want to explore others. For one, I’ve always wanted to be in New York to see the ball drop at Times Square, instead of watching it on my TV. According to the infographic, there are other interesting traditions that people all around the world follow to celebrate.
While some sound crazy – like diving into a frozen lake in Siberia – others aren’t too far of a stretch from my traditions – like eating grapes in Spain. Whether you celebrate with fireworks, champagne, or different lucky meals, it’s always fun to ring in the new year with good people.And if you need some inspiration or helpful tips on making New Year’s resolutions, check out this infographic....
The key finding: Holiday shoppers are increasingly seeking out gift ideas on social – and they’re relying less and less on traditional channels. Nearly two-thirds of holiday shoppers say they use social to find gift inspiration (up 25% year-over-year), while those who say they lean on traditional media (like TV commercials and magazine ads) fell 22% from 2013.
Shoppers say Facebook is the most influential platform when it comes to holiday purchases: 59% of consumers cited Facebook as having the most influence on their purchases in 2014 – up 51% year-over-year.
Peer recommendations on social media continue to influence gift purchases more so than other types of recommendations and endorsements. Nearly 70% of respondents said social content and commentary about brands and/or products from their peers influence their purchases most – a figure that’s more than 6X higher than those who said celebrity endorsements on TV carry the most weight (11%)...
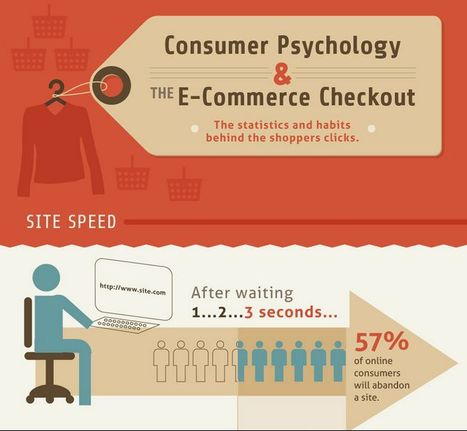
We all love a bit of online shopping but what goes through our head before we click to buy items over the web?
We have done some research in the form of an infographic, which reveals some fascinating insights into the psychology of the online consumer.
A massive 85% of people said they read online reviews before making a purchase and 1/3 of shoppers admitted buying an item after being influenced by a video. The research also looks into why we abandon sales at the checkout, which is predominantly down to hidden charges and having to register before buying.
Check out our infographic below for the full insight into the mind of the online shopper....
VAnd although digital is taking an increasing share of marketing budgets, the move to online is paradoxically making some old-school tactics even more valuable.
What do buyers say is the most important signal of vendor credibility? What type of content is most effective? What do marketers rate as the single most valuable SEO tactic? What are the top barriers to adopting social business practices?
Find the answers to these questions and many others in more than 100 social and online marketing stats from 20+ different sources....
Infographics are a great way to present a wealth of information on social media, without overwhelming your audiences. This visual trend of data visualization is just getting warmed up, as more and more companies are sharing vital pieces of information in layers and sub layers of an Infographic.
As 2014 is coming to an end, and before we ring in the New Year. I’ve decided to share with you a list of 10 best infographics of 2014, which share such valuable insights on various facets of social media marketing which are vital to know before you say goodbye to this year!...
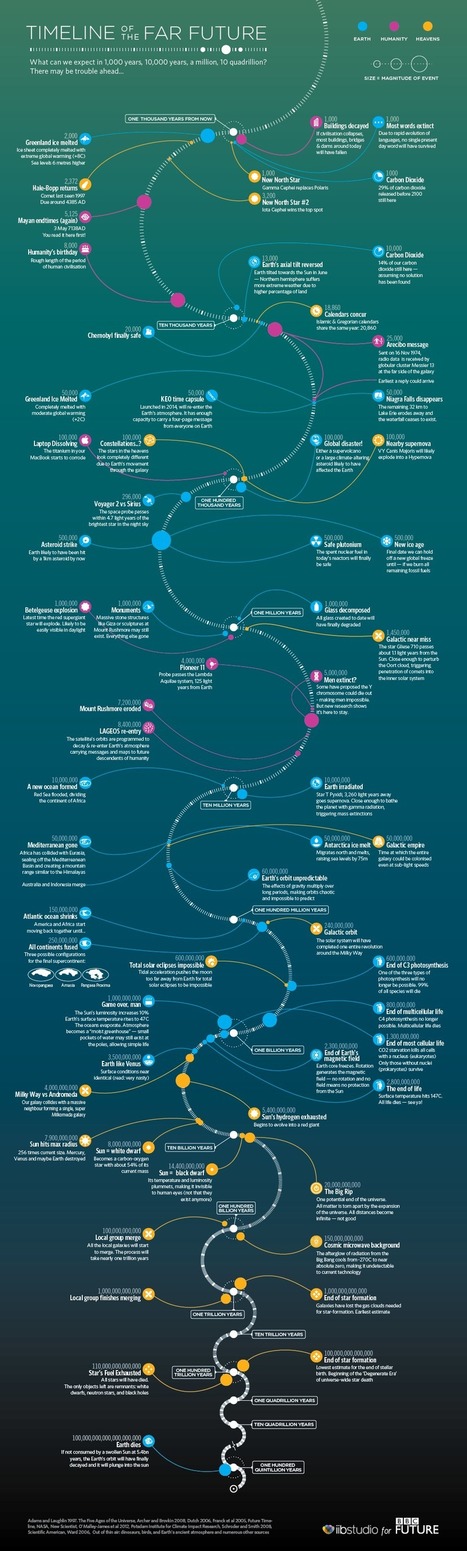
What do we expect will happen in one thousand years time? Or one million years? Or even one billion? As our amazing timeline shows, there may be trouble ahead.
Via Ana Cristina Pratas, Jeff Domansky
|
|
|
Scooped by
Jeff Domansky
February 18, 2015 4:29 PM
|
In 2014, NewsCred's highest-performing piece of content was about the millennial demographic and how brands were eager to reach them, but they weren't impressed. We were curious what the key to their hearts, minds, and wallets was - and judging by the success of this one blog post (42K views and counting), so are you.
So we commissioned a study to survey 501 millennials and the results reveal that nearly two-thirds (62%) feel a direct correlation between content marketing and brand loyalty. The problem? They are turned off by the content they’re receiving. The survey also revealed 10 proven tactics that brands can leverage in their content marketing to successfully reach this elusive demographic....
There are lots of things you need to do to have a successful blog. Not only do your posts need to be well-written, helpful, and relevant to your target audience, but you've also got to make sure you're promoting them correctly so they get in front of people who could become your fans -- and maybe even your customers.
Luckily, you have many creative options when it comes to promoting your blog content. In the infographic below from ReferralCandy, we hear from over 40 marketing experts about their favorite blog promotion tactics -- everything from relationship building to email segmentation to social media. Check it out....
Have you ever wondered when you should be sharing your content on the social web?
Your visitors and followers prefer using social media sites during specific hours. So if you start sharing your content when your users are on these social sites, you’ll not only gain more shares, but you’ll also notice an increase in traffic.
So, when should you be sharing your content? Well, just follow the times in the infographic below.
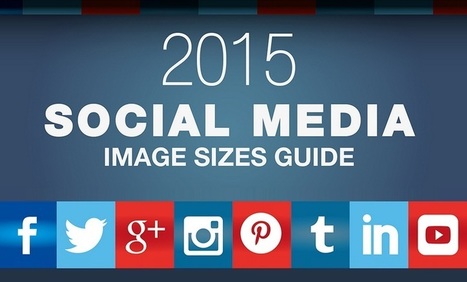
There’s no question of a doubt that social media has become more visual over the past few years with over 63 percent of social media updates now incorporating images. This means that if you don’t have great images for your social updates you will not stand out from the hundreds of status updates streaming past your audience every day.
But simply having great images is not enough.Unfortunately your photos and images display differently across the different social media channels so you need to make sure that your photos are optimized for each one. This can often lead to a lot of searching online to find out the correct dimensions for Facebook, Twitter, Instagram etc.
Wouldn’t it be useful if all this information was in one place? Thankfully the team at Setupablogtoday have done that in this easy to follow cheat sheet.
Whether you are an experienced Social Media Marketer or a novice this handy reference guide lists the dimensions for the images which the major social networks want you to use, as well as a few handy tips for selecting the perfect image for your profiles....
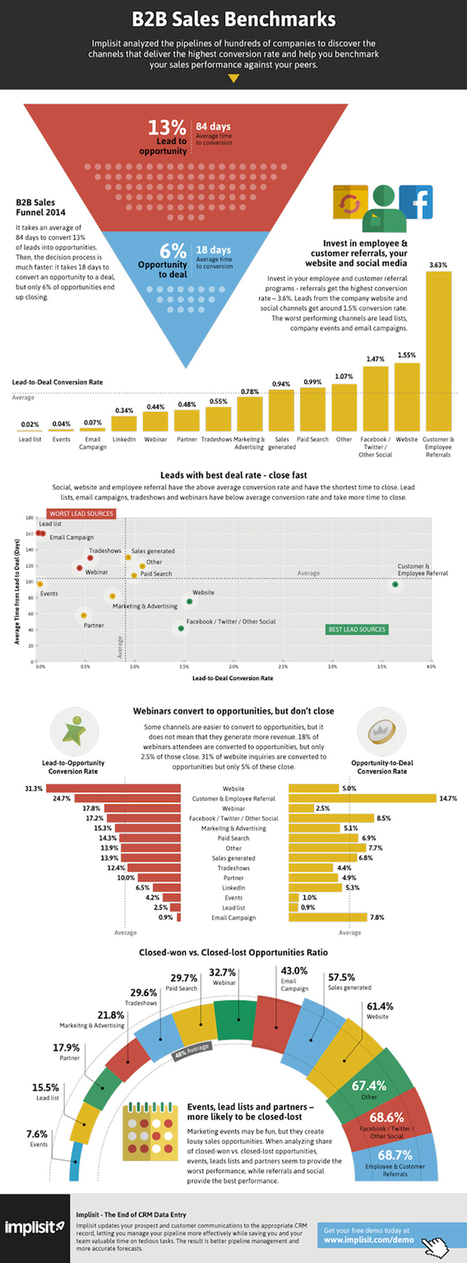
If you're a sales or marketing leader, you've probably already wrapped up strategy planning for 2015. (Or you might still be in the thick of it if time hasn't been on your side. No judgment -- I've been there.) But a new infographic from Implisit which reveals the most and least effective channels for customer conversion might prompt you to crack the newly approved plans open once more and make a few revisions.
For instance, if you intend on finding customers through events and purchased lead lists in the new year, you might want to think again, as these channels had the lowest lead to conversion rate of 14 options. On the opposite end of the spectrum were Facebook and Twitter, company website, and referrals, the last of which blew all other channels out of the water with 3.63% of leads converting to customers. These same avenues were also far more likely to result in closed-won vs. closed-lost deals....
Are you curious about what's going to happen in the next billion or so years? Well, lucky for you, we have an infographic to let you know every important event from now until then—and the next billion years after that, too.
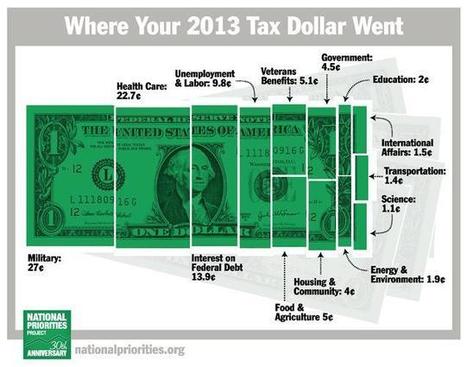
We can also show you how to eat healthy and explain your taxes to you. These are just a few of the most informative and fun infographics, visualizations, and other graphic stories that we've seen over the last year.
So pour over these charts and learn a little something (and, while you're at it, you can take a look at the ones we featured last year):
|
|
Scooped by
Jeff Domansky
January 2, 2015 12:51 AM
|
Sometimes you’re surfing around the web and you notice some really cool infographic on something like fashion, music, or food, and you can’t help but wish that you could create something like that; even if it’d take you a week.
Well, I’m here to tell you that it’s definitely possible to create some awesome infographics in any category that you choose, EVEN if you’re not a designer. In this blog post, I’m going to introduce you to three awesome tools to create the best infographics, tell you how to use them AND how you can share your infographics in different channels all over the web. So, let’s get started!
VMonths back we came up with the superb collection of nice, visually appealing infographics (Creative Infographics for Designers and Developers) witnessing which designers and developers would easily relate as each one of them was visual graphics talking about designers and developers.Here is our latest compilation 40 creative infographics for designers and developers. Hit a jump to take the glimpse of each....
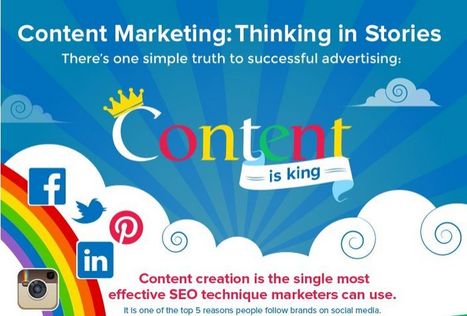
Basically, content marketing is the art of communicating with your customers and prospects without selling. It is non-interruption marketing. Instead of pitching your products or services, you are delivering information that makes your buyer more intelligent. The essence of this content strategy is the belief that if we, as businesses, deliver consistent, ongoing valuable information to buyers, they ultimately reward us with their business and loyalty. Nowadays people also look for the facts and useful information about the products and services that they find interesting instead of ads.
So engage your audience with unique & useful story/ information of your services or product. Provide your information precisely not with bag of unnecessary stuffing of keywords. Make your content king in the marketing world and become a great Marketer....
Every year people proclaim the death of something or other in marketing -- and the death of the infographic doesn't escape conversation. It's probably because while more people have caught on to the power of infographics for communications or marketing initiatives, not all of them are doing it well -- so it's hard to separate the wheat from the chaff.
These 15, however, managed to stand out. My criteria here were not scientific. I looked for infographics that I simply could not stop reading til the very end -- or in the case of the interactive ones in the latter half of this post, the ones I couldn't stop exploring. Enjoy perusing the best of what 2014's infographics had to offer, ranked in no particular order (except for #1 -- I love #1)....
We all know a picture speaks thousand words and for that reason infographics are being more popular due to its amazing information displayed in the form of images. It has the capability to capture everyone’s eye and tell them a story with engaging content and images. It’s an all in one package with text, images and creative design that come all along. It holds a great marketing potential that has the ability to attract customers. Many people click on infographics as it is more appealing and hence your web traffic is increased which is beneficial aspect for SEO.
Here we have the collection of 10 interesting infographics about social media. Let’s have a look at them below.
If you’re anything like me, you learned how to use programs like Photoshop and Gimp out of necessity to do minor changes to photos. You might have even dabbled in some easier graphic design projects for your own website, but it takes you hours to get the image or the design looking just right and you’re left exhausted. You might even spend time looking up tutorials on how to achieve a certain effect and still have trouble re-creating it.
In short, while you do know your way around the programs like Photoshop to a certain extent, it takes you forever and there’s absolutely no way you’d call yourself a graphic designer. But then, you’re surfing around the web and you noticed some really cool infographics on things like fashion, music and food and you can’t help but wish that you could create something like that; even if it’d take you a week....
|





















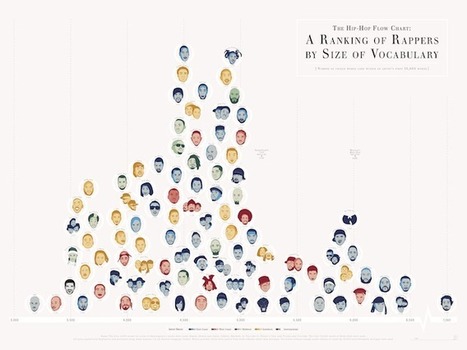

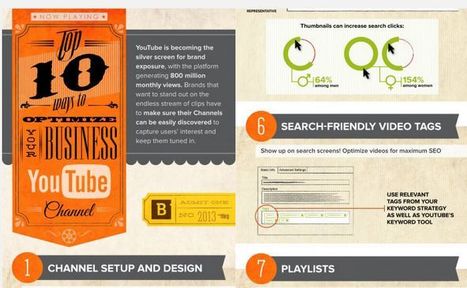







Great document for building a good info graphic with a layout that is going to get the results you want.
This article helps you determine the best layout for the type of infographic you may be creating.
This is a great tool to share with my seminar teachers whose final project for the year is an infographic.