 Your new post is loading...
When it comes to proving the ROI of social media it isn’t as hard as you might think. The key is to ensure you are tracking and collecting data effectively.
First we need to set our objectives.
What are you trying to achieve from your social media activity? Here are some typical examples: - Lead generation - Sales - Retention -Reach - Email signups - Cost reductions
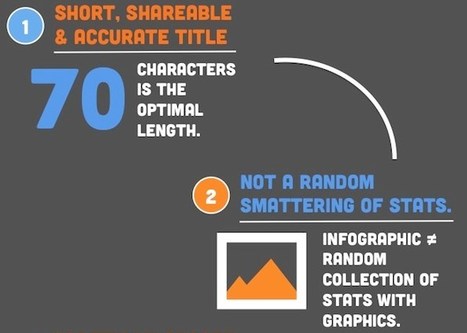
Make sure your infographics don't fall flat. Learn what essential elements you need to increasing sharing.
Luckily, there are few things we can do to infographics to hedge our bets a bit. So, we put together the following infographic on making highly shareable infographics -- helping you rake in more views and conversion opportunities. Follow these tips, and your infographic will be much more likely to get shared.
The Internet is a big, big, big place.
In the 200 seconds I watched the “Internet in real-time” infographic, Google ran almost a million searches and sucked up over $300,000 in revenue. Facebook users uploaded over a terabyte of data, liked something over 10.5 million times, and posted 11 million items.
People watched 78,385 hours of Netflix content, and Android users downloaded over 250,000 apps. Amazon shoppers spent over a half a million dollars, and 690 million emails were sent.
Here’s the live infographic, go get mesmerized for a minute or two....
...diving into Tumblr can be a bit intimidating. To help you leverage this social networking site, Quicksprout created an infographic that explains how to use Tumblr for marketing, and proposes some tips and tricks on how to get the most from it.
And perhaps more important, the visual illustrates some best practices for leveraging Tumblr. Take a look at a few of them....
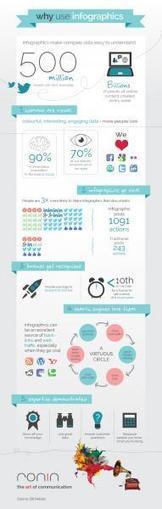
The age of big data is here. Over the course of a week, billions of pieces of content are created and spread all over the web. Indeed, on average, 500 million tweets are sent everyday.
Yet, we have increasingly less time to absorb this data. Enter the infographic. Simple, attractive, fun; infographics make often incredibly detailed research and statistics easy to digest. Packed with charts, graphs, maps, icons, they are visual shorthand, if you will.
The popularity of the infographic has certainly rocketed in recent times. Here’s why and, moreover, why you should be using them....
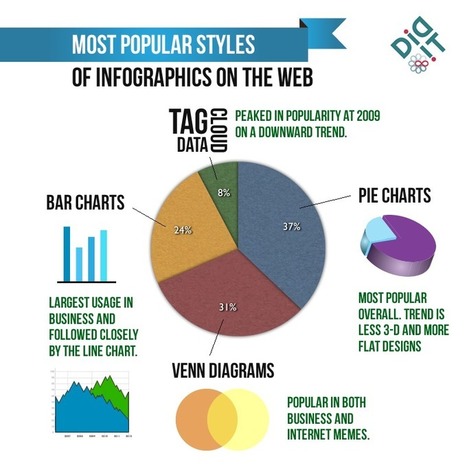
What are the current trends with infographics in 2014?
Infographics have always been around, but the emergence of “Big Data” has caused the display of trends and statistical correlations using “little men” and 3-D pie charts to become more popular than ever. Why? As a society we’ve become inundated with piles of alphanumeric data each day.
Infographics takes this content and boils it down to essential, understandable visual elements. Additionally, as a content building/content marketing tactic, infographics can provide a break from “dry text,” causing users to spend more time on the page. But as the novelty of infographics has faded, more and more bad infographics saturate the web landscape.
In order for infographics to be effective, they need to use multiple data points to tell a cohesive story or prove a theory. After some research, I found some interesting trends affecting the infographics space....
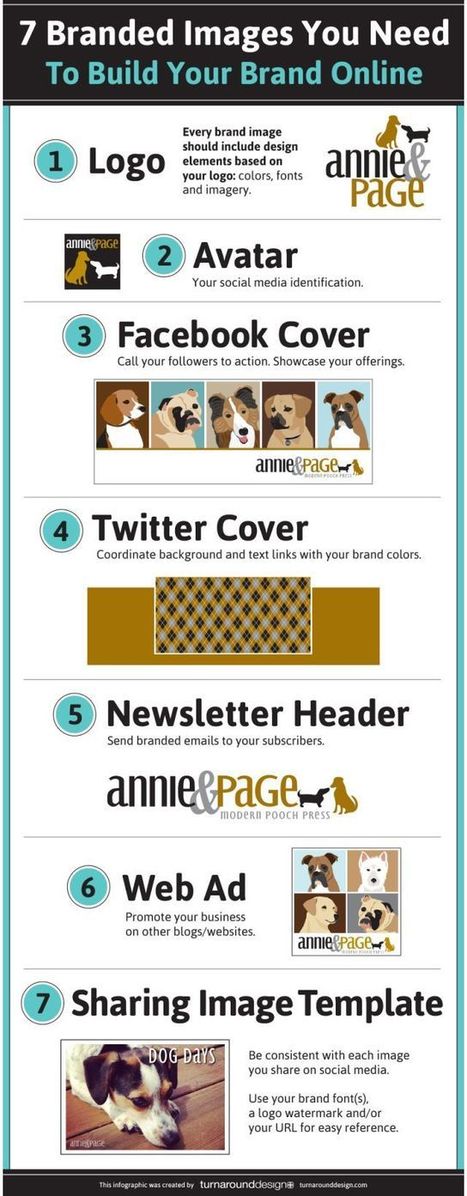
Building your brand online takes work. Every image that you associate your business with needs to represent your brand in some way. You certainly don’t want to cut corners in this area. This infographic by Turn Around Design covers 7 images you need to build your brand online:
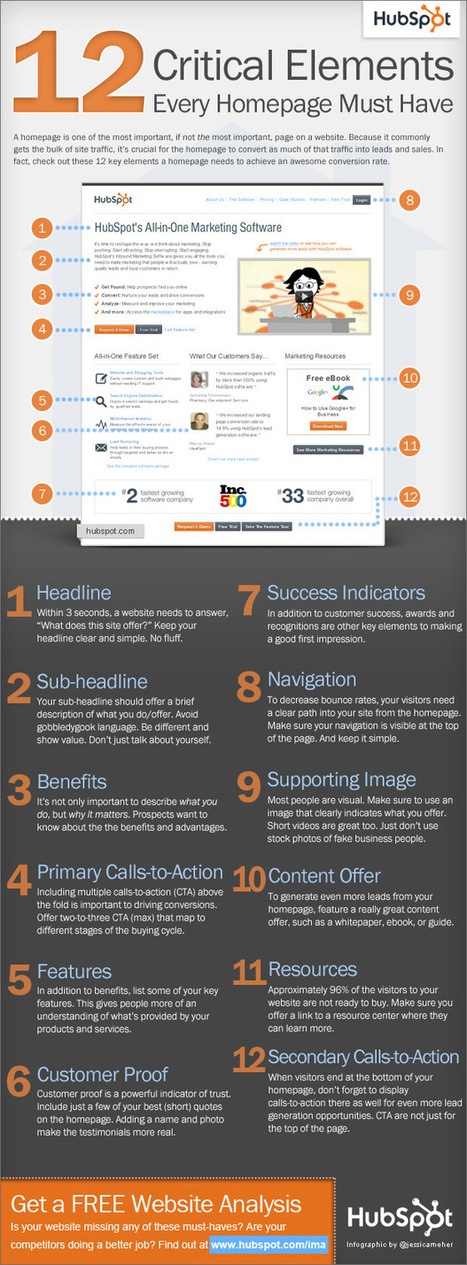
A homepage is one of the most important, if not the most important page on a website. Because it commonly gets the bulk of site traffic, it’s crucial for the homepage to convert as much of that traffic into leads and sales. In fact, check out these 12 key elements a homepage needs to achieve an awesome conversion rate....
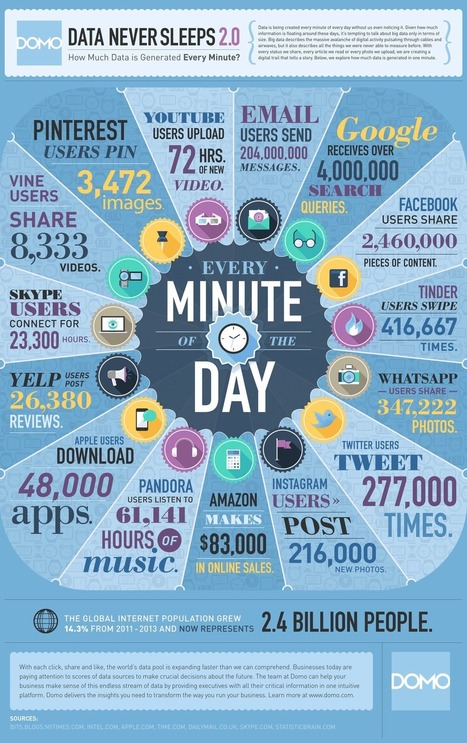
...In one minute, email users send 204 million messages, Amazon makes about $83,000 in online sales and Apple users download 48,000 apps. On the social front, Facebook users share 2.46 million pieces of content, 277,000 tweets are tweeted and Tinder users swipe left or right 416,667 times.
We've never seen a small town quite like that.
The folks at Domo have created an infographic detailing a chunk of the incredible amount of data the Internet generates each minute....
Every so often when I’m tweeting or emailing, I’ll think: Should I really be writing so much?
I tend to get carried away. And for the times that I do, it sure would be nice to know if all this extra typing is hurting or helping my cause. I want to stand out on social media, but I want to do it in the right way.
Curious, I dug around and found some answers for the ideal lengths of tweets and titles and everything in between. Many of these could have been answered with “it depends,” but where’s the fun in that? Solid research exists to show the value of writing, tweeting, and posting at certain lengths. We can learn a lot from scientific social media guidelines like these. Here’s the best of what I found....
From scotch to bourbon, this chart categorizes all the types of whiskey.
Interesting ways to match content with the sales process is just as critical as ensuring content quality. For effective B2B content, master these 3 concepts that mirror the way an enterprise sale works...
Recently @ArgosHelpers raised a smile and attracted more than 1,500 new followers with an“epic reply” to a customer’s Tweet. The moment illustrates how willing people are to engage and follow a mixture of accounts on Twitter. It also adds weight to @Nielsen research that reports 59% of UK users follow brands....
|
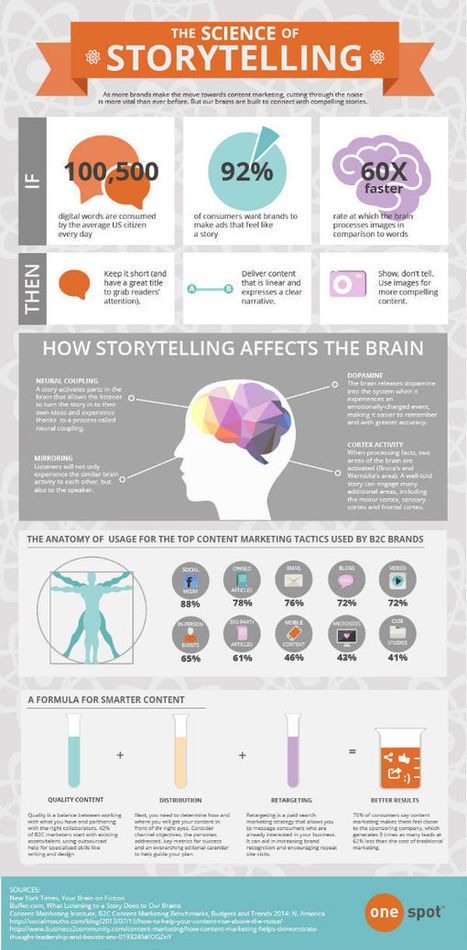
The chemical and psychological makeup of our minds affects how we consume content: Our brains are wired to connect with compelling stories.
Brand storytelling tactics focus on different functions of the brain related to understanding and perception. The brain processes images 60 times faster than text, and 92 percent of consumers want brands to create stories around ads. Because of this, marketers should be delivering linear content with clear narratives and using images to tell their stories.
OneSpot has put together the following infographic to demonstrate how storytelling affects the brain and how brands can cut through the noise to offer stories that resonate with readers....
As a B2B leader, do you know how to determine the ROI on your social media efforts? In 2011, MDG Advertising released an interesting infographic titled “The ROI of Social Media: Is Social Media Marketing Effective?” Three years later, this infographic is still relevant in our social media marketing campaigns. In particular, the infographic helps us understand the following: our business objectives; the metrics CMOs apply to measure social media undertakings; and the advancement of social network recruiting.Here are some social media marketing highlights to consider, which are also featured in MDG Advertising’s infographic: 4 Factors For Measuring Social Media....
Never underestimate of the power of a woman, especially when combined with social media. From the number of active users on a social network to the frequency of their interaction with other users and brands, women are a powerful force in the social media realm. Curious how much power women hold on social media?
Take a look at the infographic below from Finances Online for some possibly surprising statistics. While it is well-known that women dominate Pinterest, they also outnumber men on four of the other top six social networks: Facebook, Instagram, Twitter, and Tumblr. However, men continue to account for the majority of LinkedIn’s users. In addition, 30% of women use social media multiple times a day, while only 26% men report using social media sites several times a day...
Here is a classic question asked by marketers who want to optimize their social media updates: When is the best time to post, pin and tweet your content?
Make sure your infographics don't fall flat. Learn what essential elements you need to increasing sharing.
Luckily, there are few things we can do to infographics to hedge our bets a bit. So, we put together the following infographic on making highly shareable infographics -- helping you rake in more views and conversion opportunities. Follow these tips, and your infographic will be much more likely to get shared....
Here are 14 Tools Every Entrepreneur Needs for Managing Social Media:
- VISUALLY'S GOOGLE ANALYTICS REPORT What is it: an app that creates a custom infographic of your website’s activity and performance....
A complete list of the data and science behind the best Pinterest marketing tips and techniques - ideal images, best posting times, top categories, and more...
In our experience, there is a growing interest in Pinterest marketing, Pinterest research, Pinterest stats and tips. So, here it all is. I found some really interesting data and science on creating the perfect pin, gaining the most repins and followers, understanding the Pinterest mindset, and much more.
Ready to go? Let’s start right off with a whopper of a stat.
More adults use Pinterest than they do Twitter
Do you have a Twitter marketing strategy? I imagine you do. Could you be reaching more people on Pinterest? As of this year, yes....
The microblogging giant has come a long way since co-founder Jack Dorsey's first tweet. Here are some Twitter facts and figures worth checking out.
Twitter went public in November 2013. The much ballyhooed IPO was a big hit as TWTR opened at $26.00 and closed at $44.90 in its first day of trading. Today Twitter trades at $44.60 despite a net loss of $34 million in its most recent quarterly report.
While Twitter has become an incredible brand, it must find a way to show profitability in the future. We don’t want the little blue bird to fly away....
2013 was a year of exploration for brands on social media. From testing Vines to launching Instagram ads, many companies were dabbling in social media efforts across the Web just to see how customers would react. Now, in 2014, brands are geting serious. They’re using the wealth of data as well as the human connection that social media can provide to develop deeper relationships with customers.
Here are seven ways brands are using social media to increase customer loyalty this year....

|
Scooped by
Jeff Domansky
April 2, 2014 5:54 PM
|
The marketing industry is having a similar moment with infographics. Over the last few years, infographics have become one of the most popular ways to build inbound links.
Publications are so saturated with infographics that there is an entire industry devoted just to highlighting and critiquing infographics published elsewhere. It’s safe to say the novelty of infographics has worn off, but the oft-mentioned quality control and saturation issues aren’t the only reasons for it.
Infographics aren’t dead, but it is time for marketers to draw a line in the sand and reclaim the medium. It starts by understanding the problem with infographics and then addressing the issues one by one....
What makes an infographic successful? As designers, we want it to achieve a balance of two main things: Did the reader get the message we wanted them to get?
...To the surprise of the researchers, bar graphs and charts did poorly. It turns out (news flash) they all kinda look the same. The most memorable images contained “human recognizable objects.” Think mundane stuff like photos or illustrations of bottles, animals and shoes, not to mention people.
Other important points: - Color made a huge difference: the more, the better.
- Images with more clutter were highly memorable. How much more memorable? A lot.
- Images with lots of circles and rounded corner graphics also ranked high.
|
















Sean Clark shows how it's easy to determine ROI on social media.
Mid to Small Companies Still Struggle With Social Media
First-hand experience as a digital analyst working with companies of all sizes reveal there is still a great deal of poor execution among mid to small companies when it comes to practicing social media. Strategies, tactics and community management all too often are misaligned to the realities of how best to leverage social media.
Several things to keep in mind to realize ROI.
Don’t Act Impulsively
There is a big difference between understanding the marketplace & knowing when to leap into the latest platform.
QUESTIONS TO CONSIDER:
• Is this new network a fad or does it have potential longevity?
• Does the purpose of the network align with our brand and social identity?
• Is our current or potential audience on this network?
• What content and tools do we need to successfully manage on a daily basis?
• Will we see a return on investment / energy if we join this network?
And remember Social media and the strategy applied is no longer just a micro-segment of marketing. Think beyond the basics and take into account your company’s general business objectives, fiscal plans and sales goals, then align your strategy to that agenda. If no metrics currently exist—be proactive!
Establish benchmarks, create metrics, track progress and merchandize appropriately.
QUESTIONS TO CONSIDER:
• Do my social goals support greater business goals?
• Are the social strategies and tactics outlined attainable?
• What is our brand voice and how do we adapt that for social?
• What resources, human and technological, do we need to flourish?
• What processes are in place to test, learn and adjust as necessary?
Be smart. Track, analyze and report on results to prove ongoing value and return for the company and ROI will start to become evident if social media is practiced well.