 Your new post is loading...
With Panda, Penguin and all the other Google updates, SEO has changed over the years. What used to work doesn’t anymore.
So, how do you know what you should be avoiding and what you should be doing now? Well, I’ve created an infographic that breaks down the old and the new in SEO and explains how you need to adjust your SEO strategy today.
ALanding Pages for Content Marketing
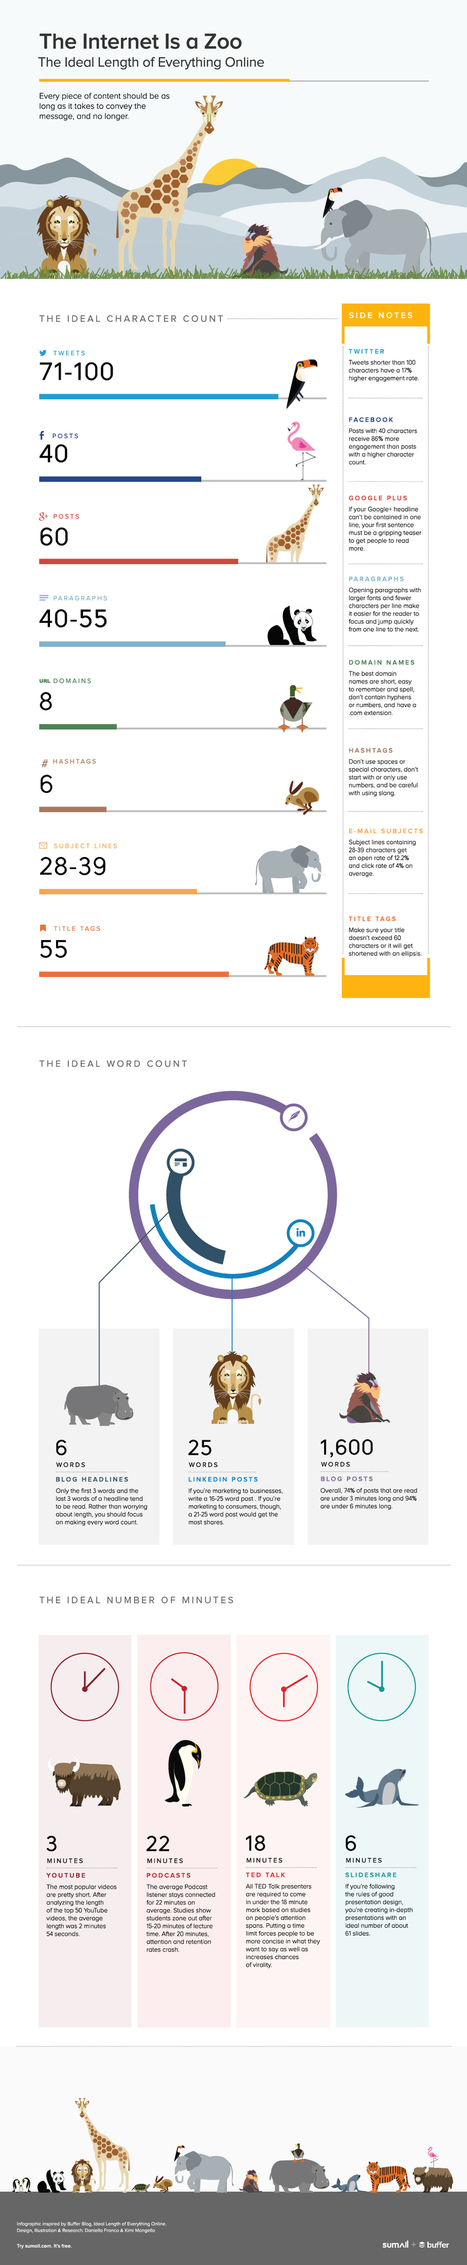
How long should my tweet be? Or my blogpost? Or my headline?
I ask this question a lot. It seems that others do, too. Our first take on coming up with the ideal length of all online content proved quite useful for a lot of people.
I’d love to see if I can help make it even more useful.
Along with all the best tips on optimal lengths for tweets, blogposts, headlines, and more, I’ve added a few additional lengths to the list—the ones that came up most often in the comments of the last post, like SlideShare length, Pinterest length, and more.
And to make it just as easy as possible to consume all this information quickly and easily, we partnered with our friends at SumAll to place the data and insights into a fun infographic. Check it all out below.
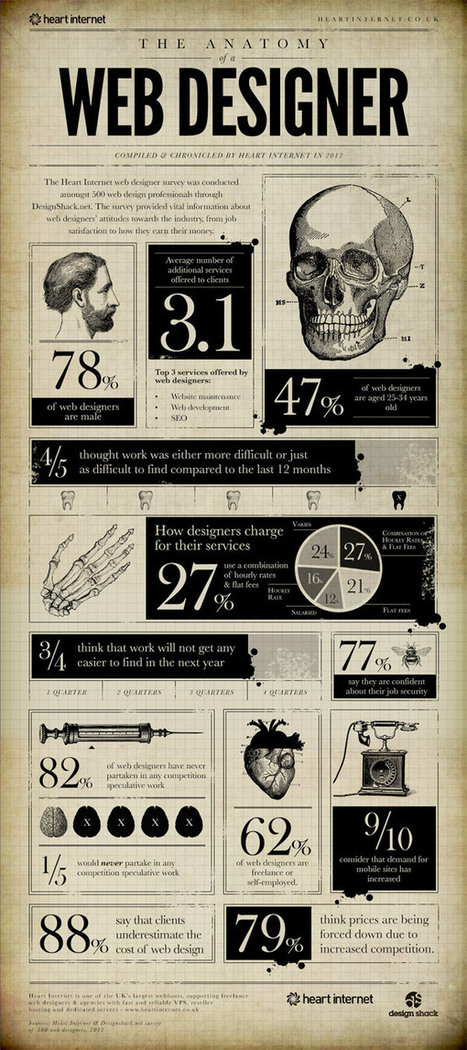
The bold visual design of Infographics makes it easy to digest facts and figures about a given subject. There’s some great infographics based on interesting topics related to web design, from articles explaining the benefits of responsive design to interesting statistics about the industry. Today I showcase 15 interesting Infographics that every web designer will enjoy. Give your scrolling finger some exercise as you browse through this lengthy post!...
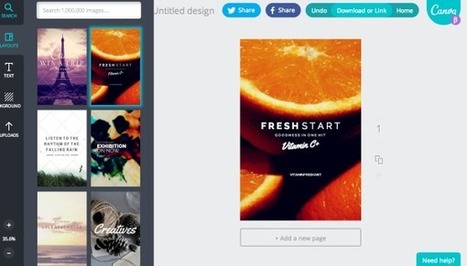
Creating infographics using online tools has never been easier. In the last few years a number of online tools have emerged that allow anyone to create great visual content. Whether you are working on a project for work, personal use, or social media, each new project starts with a template. With the dimensions laid out for you, you can focus your attention on quickly creating effective designs. Search, drag, and publish - it can be that simple.
These new tools are vector graphics applications that run in your browser as a replacement for using an expensive professional desktop application like Adobe Illustrator to put your infographic design together. Each one offers different tools, image libraries, charts, fonts and templates as a starting point. None of these have the full capabilities of a professional desktop application, but you probably don’t need that much power to create a simple infographic.
In this article, we take a quick look at 5 of the best online tools for creating infographics: Visme, Canva, Easel.ly, Piktochart, and Infogr.am. All of these tools are evolving quickly, and this is just a snapshot of their current capabilities.
Pinterest was once an internet secret; with its beta version only available by invite, millions were clamoring for an exclusive invite. Now, however, the site has become a social media heavyweight....
It's the great American pastime.
No, I'm not talking about baseball. Or stuffing your face with apple pie. Or arguing about politics with your family over Thanksgiving dinner. No, I'm talking about the great American pastime of buying stuff.
Unlike those other pastimes, however, which have remained relatively unchanged over the years, the way we buy has evolved considerably. For example ...
In 1914, you might've been tempted to buy a (non-branded) pastry after noticing a delicious smell emanating from the local bakery.
In 2014, you might be tempted to buy a Pop-Tart after seeing a commercial for Pop-Tarts on TV, or after reading an article about Pop-Tarts on The Wall Street Journal website, or after hearing about (or attending) a Pop-Tarts-brandedsummer concert series....
Are you ready to use infographics in your social media marketing?Do you know how to get started?Creating infographics is getting easier. When you illustrate a concept with images, you’re likely to find a bump in social media visibility.In this article you’ll discover how to create and promote infographics to put your content front and center...
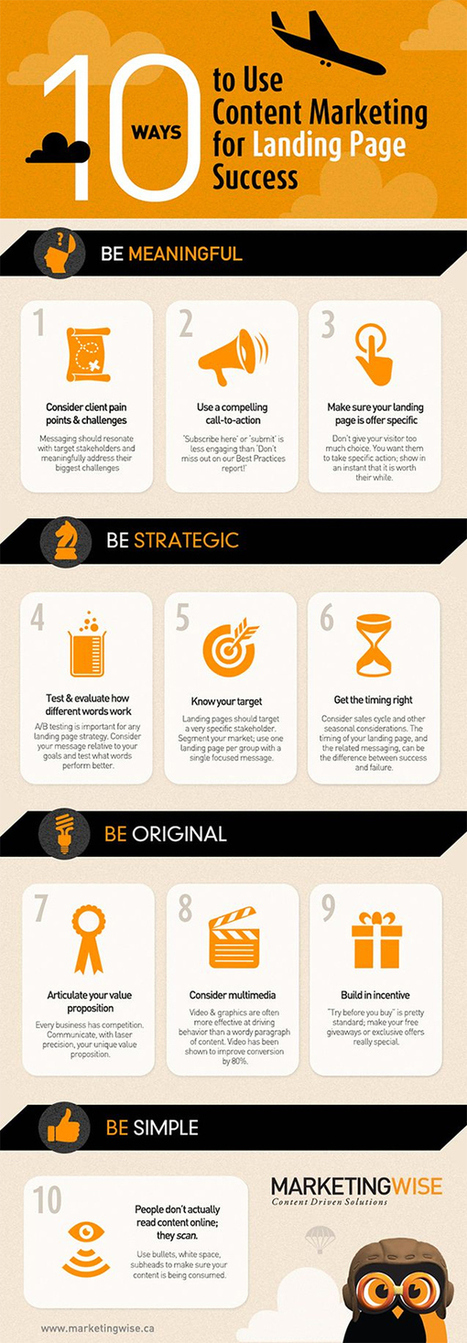
The success of your landing pages will largely be determined by the information your present to your visitors. A load of hard to read paragraphs of text about nothing in particular probably isn’t going to have the desired effect.
To make your content work harder for you and to start converting more visitors into customers follow the 10 tips in this infographic from Marketing Wise....

|
Scooped by
Jeff Domansky
September 28, 2014 4:32 PM
|
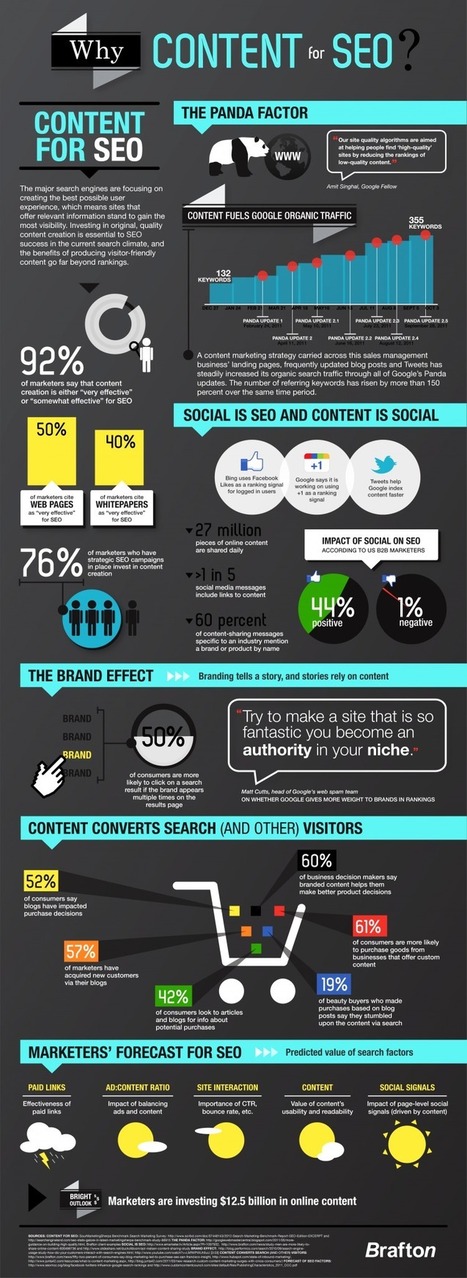
Google changes its search engine formulas over 500 times a year in the pursuit of delivering results that are relevant to “you” the user of search. Google says that it search engine is about finding and ranking high in search results, websites and blogs that provide a high quality experience for your readers.
“Search is a complicated and evolving art and science, so rather than focusing on specific algorithmic tweaks, we encourage you to focus on delivering the best possible experience for users.” – Google
Creating the best possible experience for users comes down to the key element of quality content creation. That one activity alone will make a major difference in pushing your website and blog higher in search results.
For a great visual on how content and SEO work together here is an Infographic to keep your neurons ticking over....
Are you ready to use infographics in your social media marketing?
Do you know how to get started?
Creating infographics is getting easier. When you illustrate a concept with images, you’re likely to find a bump in social media visibility.
In this article you’ll discover how to create and promote infographics to put your content front and center....
Almost every company puts much money and effort behind social media strategy, with goals ranging from enhanced brand awareness to direct leads or sales. But while 97 percent of those surveyed said they use some form of social media marketing, only 37 percent reported being able to measure ROI—and this problem extends to even the largest marketers, 78 percent of whom said they struggle with this measurement....
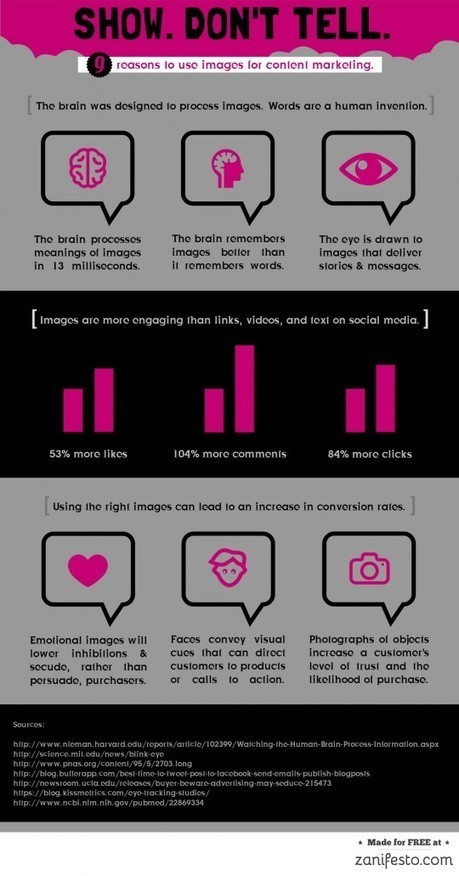
Visual social media posts get more engagement than text, but this rule goes for all content marketing pieces.
|
CMI's Nonprofit Content Marketing 2015 research is out. Nonprofit marketers are doing more with content marketing – and feeling more confident about their effectiveness. They’re trying more tactics, using more social media platforms, growing in their internal knowledge and skills, and focusing on becoming better storytellers. Here’s a quick list of our favorite insights from this year’s report, including what a best-in-class nonprofit marketer looks like.
Engaging your customer has never been harder, or more crucial. I know you know that already, but just in case you are harboring any residual skepticism about the importance of customer engagement, I offer you these facts from the “State of The American Consumer” for 2014, part of an ongoing study of American consumers from 2008 to the present, conducted by Gallup...
“Content is the new SEO” has been one of the resounding slogans guiding marketers in 2014. As you know, it’s not just enough to churn out content — writing about whatever is on your mind… often. You need to have an overall strategy in mind, too....Still not convinced? Here are 8 reasons to hire an SEO content strategist....
Infographics are everywherebut what made them so successful?This infographic exposes the science behind the boom....
A few weeks ago here on Copyblogger, Demian Farnworth presented the infographic as the Salvador Dalí of content marketing — the most interesting person at the cocktail party.
More than just a superficial presence, an infographic is a significant asset pillar with diverse possibilities that help you grow your media empire.Today, let’s equate the Internet to the world of pop music. In this case, infographics are The Beatles....
There are certain things that make content stand out. The topic, the design, the interactivity….
But while some people are under the impression that digital marketing success is completely random, Team Kapost comes from a different school of thought.
We believe there’s a rhyme and reason to producing successful content.As such, welcome to the 5-part “Content Anatomy” series, which breaks down stand-out examples of the most popular content types. The infographics that follow look closely at the intimate components of 5 different content types, examining how these elements come together to form a complete and functional asset.
...our first infographic dissects a whitepaper from Google, called “Principles of Mobile Site Design: Delight Users and Drive Conversion.”
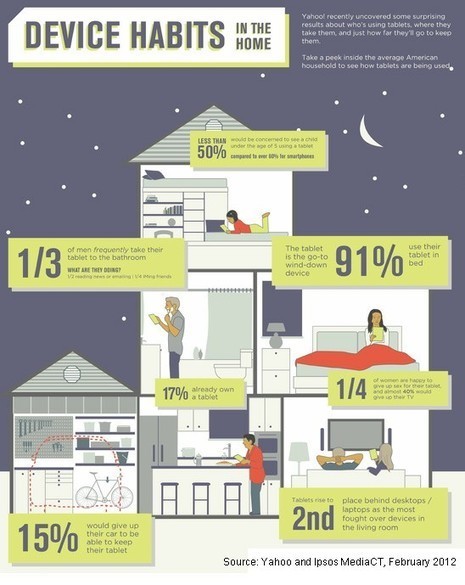
Americans are in love with their tablets: 91% of people who own a tablet say they take their device to bed with them, and 15% say they would give up their car in order to keep their tablet, according to survey from Yahoo and Ipsos MediaCT.
Moreover, 25% of female tablet owners say they'd happily give up sex to keep their devices. And what do men have to say about that? One-third of them are in the bathroom—with their tablets, sending email (50%) and instant messages to friends (25%)....
|
|
Scooped by
Jeff Domansky
September 28, 2014 4:51 PM
|
We all know that images are compelling. The growth of visual content has been on a rapid upward trajectory over the last 12 months.
Social media platforms such as Pinterest and Instagram have taken the social media world by storm.
Instagram announced in July that it had acquired 80 million users. To put some further perspective on its adoption and growth, the visual social media network is now being used by 40% of the worlds top 100 brands.
Compete.com recently released a report showing that Instagram was the fastest growing web property on the planet amongst the top 50 websites. The report stated that it had grown from 16 million to 22 million unique visitors in just one month, which is a growth rate of 38% in just 30 days!...
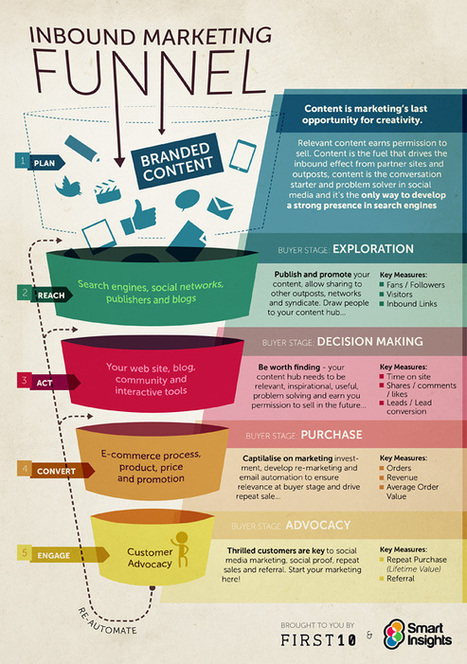
What is content marketing? Creating and distributing relevant and quality content to potential customers to influence purchasing decisions and improve brand loyalty.
Types Used by Businesses: - Blogs: 69%
- Video: 70%
- Social Media: 84%
- Email: 78%
- Audio: 26%
- Images: 33%...
Different social media sites offer different virtues for your business. Here's how to optimize each one based on when you post.
We get it, managing your business's social media accounts can be daunting: from tweaking tweet lengths to mastering Facebook tone, to using the right hashtags at the right times.
But what savvy social media users know is that there's a science to getting it right--if you follow certain parameters, you’re almost guaranteed to get the results you were working toward. All it takes is some knowledge and forethought, and anyone can be well on their way to posting engaging content.
Thanks to this infographic from online payroll company SurePayroll’s blog, we know the best and worst times to post. Here are a few takeaways for each major social media site....
We always talk about how social media can affect your brand, your reputation your social life. What we don’t discuss is the effect it has on our body and brain. What sorts ofchemical reactions happen each time we check our Twitter? How does our brain work now that internet is everywhere?
We all have seen the symptoms in ourselves. In fact, we can’t spend more than 10 minutes without checking our email or messages. But, apparently, there is a study which confirms that there are huge psychopathological impacts that social media have brought to our lives. The results are impressive and you can find them below, in the infographic conceived and created by the team at TollFreeForwarding...
|
|
Scooped by
Jeff Domansky
September 15, 2014 11:43 PM
|
This lack of artistic ability poses a threat to my marketing career, especially now that visual content marketing is the ticket to success. Even though I have other creative traits, I'm worried I'll get left in the visual storytelling dust.
I know I'm not alone.
Luckily, we non-artists have a few tools to mask our lack of design talent.
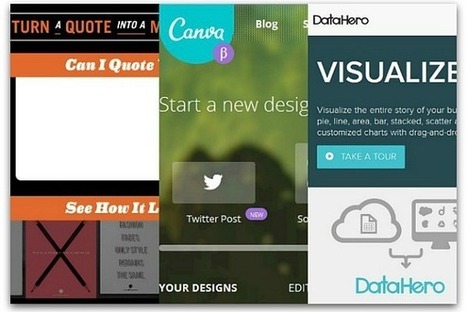
These tools are free, but often have advanced paid features for when you're ready to step up your game. They don't replace a designer's expertise, but you can use them for smaller projects, like blogs, social media graphics, or Slideshare templates....
|





























Neil Patel compares SEO today was what it used to be and comes up with some valuable tips to get better results from your content.
Interesting.
aggiungi la tua intuizione ...