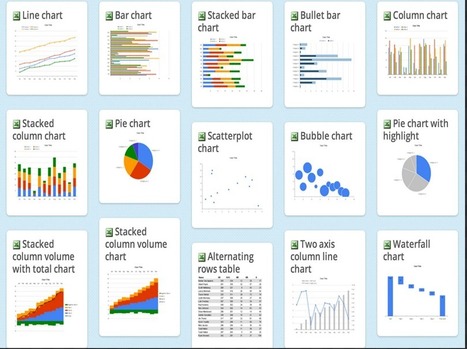

Sometimes complicated information is hard to understand and requires a visual illustration. Graphs and charts are ideal for visually communicating complex data. As teachers, we often have recourse to these visual aids to improve our students comprehension. There are actually a wide variety of web tools that you can use to easily create graphs and charts, below are some of my favourite.


 Your new post is loading...