Your new post is loading...

|
Scooped by
Gilbert C FAURE
November 17, 2019 1:29 PM
|
A new booklet produced by Cisbio provides an up-to-date summary of the molecular pathways associated with the development of neurodegenerative diseases.
|
|
Scooped by
Gilbert C FAURE
November 16, 2019 11:43 AM
|
Anti-N-methyl-D-aspartate receptor (anti-NMDAR) encephalitis is a treatable autoimmune disorder characterized by prominent neuropsychiatric symptoms that predom...
|
|
Scooped by
Gilbert C FAURE
November 16, 2019 11:38 AM
|
The European Medicines Agency has recommended a new treatment for multiple sclerosis (MS). The new medication is called Mayzent, and it provides a much-needed therapeutic option for those with MS.
|
|
Scooped by
Gilbert C FAURE
November 13, 2019 2:43 PM
|
Graphical Abstract Abstract The NLRP3 inflammasome is critical for EAE pathogenesis; however, the role of gasdermin D (GSDMD), a newly identified pyroptosis executioner downstream of NLRP3 inflammasome, in EAE has not been well defined. Here, we observed that the levels of GSDMD protein were greatly enhanced in the CNS of EAE mice, especially near the areas surrounding blood vessels. GSDMD was required for the pathogenesis of EAE, and GSDMD deficiency in peripheral myeloid cells impaired the infiltration of immune cells into the CNS, leading to the suppression of neuroinflammation and demyelination. Furthermore, the loss of GSDMD reduced the activation and differentiation of T cell in the secondary lymphoid organs and prevented T cell infiltration into CNS of EAE. The administration of inflammasome-related cytokines partially rescued the impairment of pathogenesis of EAE in GSDMD KO mice. Collectively, these findings provide the first demonstration of GSDMD in peripheral myeloid cells driving neuroinflammation during EAE pathogenesis. Introduction Multiple sclerosis (MS) is an incurable and progressive inflammatory disease of the central nervous system (CNS) with neuropathological features, including inflammatory demyelination, chronic axonal damage, and neurodegeneration (Frohman et al., 2006). However, the etiology of MS is not well understood, with the underlying basis to pathogenesis being ill-defined. Experimental autoimmune encephalomyelitis (EAE) is the most commonly used animal model for studying MS since it shares neuropathological features with MS and can help to define the contribution of immune events to the development of MS (Ransohoff, 2012). EAE is mediated by myelin-specific T cells, which are activated in the peripheral lymphoid organs and then migrate into CNS by crossing the blood–brain barrier to mediate inflammatory responses, resulting in demyelination and neurodegeneration (Stromnes et al., 2008). Moreover, much evidence suggests that innate immune cells play critical roles during the process of EAE. Myeloid cells, such as dendritic cells (DCs) and macrophages, serve as APCs that mediate the cellular immune response by processing and presenting myelin antigens for recognition by T cells (Heppner et al., 2005; Chastain et al., 2011). Additionally, myeloid cells produce cytokines and chemokines that respectively facilitate the activation and differentiation of naive CD4+ T cells toward T helper type 1 (Th1) and Th17 cell lineages, and the translocation of effector T cells into CNS, all of which contributes to the progression of EAE. Furthermore, the peripheral myeloid cells themselves can be recruited into CNS and together with CNS-resident innate immune cells, such as microglia and astrocyte, facilitate neuroinflammation to cause neuron damage in EAE (Greter et al., 2005; Goverman, 2009; Chastain et al., 2011; Duffy et al., 2014). Inflammasomes are cytosolic multiprotein complexes that are vital players of innate immunity and especially in the initiation of inflammatory responses in myeloid cells (Martinon et al., 2002). Upon recognition of stimuli, inflammasome-associated sensor proteins, together with apoptosis-associated speck-like protein containing CARD (ASC) and pro-inflammatory cysteinyl aspartate–specific proteinase (caspases; caspase-1 and -11), assemble into an oligomeric complex leading to caspase autoactivation, which controls the cleavage of pro–IL-1β and pro–IL-18 precursors into their mature forms and also induces a type of proinflammatory programmed cell death termed pyroptosis (Rathinam et al., 2012; Latz et al., 2013; Jorgensen and Miao, 2015). Notably, several independent studies showed that the expression of caspase-1, IL-1β, and IL-18 is elevated in the peripheral blood mononuclear cells and serum of MS patients (Huang et al., 2004). Furthermore, increasing recent evidence indicate that the NOD-like receptor protein 3 (NLRP3) inflammasome in APCs plays a critical role in the pathogenesis of EAE model by mediating chemotactic immune cell recruitment to the CNS (Gris et al., 2010; Inoue et al., 2012). Additionally, a recent study reported that Th17 cell–intrinsic ASC can promote the process of EAE by inducing IL-1β production via ASC–NLRP3–caspase-8 inflammasome axis (Martin et al., 2016). These studies highlight an important role for inflammasome in MS and EAE pathogenicity. Gasdermin D (GSDMD) is a recently identified pore-forming protein, which mediates pyroptosis (Kayagaki et al., 2015; Shi et al., 2015). Proinflammatory caspases (caspase-1 and -4/5 in humans and caspase-1 and -11 in mice) can cleave GSDMD at its central linker domain, thereby releasing the autoinhibition by C-terminal GSDMD domain on the N-terminal GSDMD domain, causing N-terminal GSDMD domain fragments to translocate to the plasma membrane, where they oligomerize to form membrane pores, leading to lytic cell death or the secretion of processed IL-1β and IL-18 in living cells through pores (Ding et al., 2016; Liu et al., 2016; Evavold et al., 2018). Recent studies demonstrate that GSDMD plays a critical role in septic shock in response to bacterial infection, and in inflammasome-driven autoinflammatory diseases such as familial Mediterranean fever and neonatal-onset multisystem inflammatory disease (Kanneganti et al., 2018; Xiao et al., 2018). Interestingly, a recent study reported that GSDMD accumulation was observed in microglia and oligodendrocytes of CNS in both MS and EAE (McKenzie et al., 2018). However, to date there have been no reports on a pathophysiological role for GSDMD in neuroinflammation or EAE pathogenesis. We now provide the first insight into the physiological function of GSDMD in EAE pathogenesis and describe the regulatory mechanism of GSDMD-mediated pyroptosis in the development of neuroinflammation during EAE. We discover that myeloid cell–intrinsic GSDMD is crucial for EAE pathogenesis by mediating the activation and differentiation of T cells in the secondary lymphoid organs, which facilitates T cell–mediated neuroinflammation and demyelination in the CNS. Results GSDMD-mediated pyroptosis is activated in the CNS of EAE To investigate whether GSDMD contributes to the pathogenesis in MS disease, we first tested the level of its expression in CNS, spleen, and LNs of an EAE mice model, which was induced by administration of myelin oligodendrocyte glycoprotein (MOG35–55) peptide and pertussis toxin. Immunoblotting analysis demonstrated greatly increased expression and cleavage of GSDMD and caspase-1/11 in the CNS and peripheral lymphoid organs of EAE-induced mice at the peak stage relative to untreated mice (Fig. 1 A and Fig. S1 A), suggesting that the pyroptosis mediated by GSDMD is indeed involved in the disease. Immunohistochemical analysis further confirmed the high-level expression of GSDMD in EAE CNS, and it was especially concentrated in lesion areas of spinal cord that were also characterized by strong cell infiltration. Interestingly, the positive staining of GSDMD was barely detectable in the CNS of control mice (Fig. 1 B). In addition, most of the cells highly expressing GSDMD and caspase-11 were detected in close proximity to the expanded capillaries at the edge of lesions in the spinal cord, as evidenced by closely adjacent expression of the endothelial marker CD31 (Fig. 1 C and Fig. S1 B), suggesting that these GSDMD-positive cells may represent cells recruited from the periphery. Moreover, FACS revealed a marked increase of caspase-1/11+ propidium iodide (PI)+ cells gated on the CD11b+ Ly6C+ (infiltrated peripheral monocytes/macrophages) in the CNS of mice during EAE compared with control mice (Fig. 1 D). Collectively, these data suggest that GSDMD-mediated pyroptosis is associated with EAE development, and its activation in CNS may be derived from infiltrating peripheral cells. Figure 1. GSDMD is strongly expressed and processed in CNS during EAE. (A) Immunoblot analysis of full-length (FL) and cleaved GSDMD, caspase-11 and caspase-1 in the spinal cords and spleen (SP) from three pairs of control (CTRL) or EAE-induced WT mice at day 18 after immunization. (B) Immunohistochemistry images showing GSDMD expression in the spinal cord of control or EAE-induced WT mice at day 18 after immunization. Scale bar, 100 µm. (C) Immunofluorescent labeling of CD31 (green), GSDMD (red), and DAPI (blue) demonstrates the angiogenesis and the distribution of GSDMD (indicated by arrows) in the lesion area of spinal cord of EAE-induced WT mice at day 18 after immunization. Scale bar, 100 µm. (D) Flow-cytometric analysis of caspase-1/11+PI+ cells from CD11b+ Ly6C+ cells infiltrated to the spinal cord and brain of CTRL and MOG35-55-immunized WT mice at day 18 after immunization (n = 3 mice per group). Data are presented as a representative plot (left) and quantified percentages (right). Data are representative of three independent experiments. ***, P < 0.001. Error bars show means ± SEM. Unpaired t test for D. GSDMD is essential for EAE induction To directly evaluate the requirement of GSDMD for EAE progression, we compared EAE in GSDMD KO mice and WT mice. We found that GSDMD−/− mice were more resistant to EAE and developed less severe disease and clinical scores compared with WT mice (Fig. 2 A). Histopathological analysis (H&E staining and Luxol fast blue [LFB] staining) showed fewer infiltrating inflammatory cells and less demyelination in the spinal cord of GSDMD−/− mice relative to their WT counterparts (Fig. 2 B). Myelin basic protein (MBP) is a protein that contributes to the process of myelination of nerves and maintenance of neural structure and is also as a marker of the myelin sheath of oligodendrocytes, with its loss being a major pathological feature of MS (Bradl and Lassmann, 2010). Immunofluorescence analysis showed regions of considerable diminution MBP expression at the peak of EAE disease in WT mice, but these were not apparent in GSDMD−/− mice (Fig. 2 C). Moreover, GSDMD−/− mice had significantly reduced numbers of activated macrophages, microglia, and astrocytes in EAE spinal cord compared with WT mice as determined by expression of the microglial and astrocyte cell markers, ionized calcium-binding adapter molecule 1 (IBA1), and glial fibrillary acidic protein (GFAP), respectively (Fig. S1, C and D). This indicates that GSDMD deficiency is associated with less severe neuroinflammation in EAE. Furthermore, fewer CD4+ T cells were detected at the edge of spinal cords of GSDMD−/− mice relative to WT counterparts, further suggesting the impairment of recruitment of immune cells in GSDMD−/− mice during EAE (Fig. 2 D). Consistent with immunostaining analysis, FACS revealed a marked reduction of T cells (CD45+, CD4+, and CD8+), myeloid cells, and activated microglia cells (CD45+, CD11b+) in the CNS of GSDMD−/− mice during EAE compared with WT mice (Fig. 2, E and F). With respect to the population of CNS infiltrating CD4+ T cells, the percentages and absolute numbers of both Th1 and Th17 cells were greatly reduced in GSDMD−/− mice (Fig. 2, G and H). Altogether, these data suggest that GSDMD is essential for EAE pathogenesis. Figure 2. GSDMD-deficient mice are resistant to EAE pathogenesis and neuroinflammation. (A) Mean clinical scores of age-matched female WT and GSDMD−/− mice subjected to MOG35-55-induced EAE (n = 10 mice per group); immunoblot analysis of GSDMD expression in spleen from indicated mice. (B) H&E staining and LFB staining of spinal cord sections from EAE-induced WT and GSDMD−/− mice showing inflammatory cell infiltration and demyelination, respectively (arrowheads). Scale bar, 500 µm. (C) Immunofluorescent labeling of MBP (red) and DAPI (blue) visualizing the impairment of myelination (arrowheads) of EAE-induced WT and GSDMD−/− mice, respectively. Scale bar, 100 µm. (D) Immunohistochemistry analysis for infiltrating CD4+ T cells in the spinal cord of EAE-induced WT and GSDMD−/− mice (representative images on left and quantified cell numbers on right, n = 3 mice per group), respectively. Scale bar, 100 µm. (E and F) Flow-cytometric analysis of immune cells (including CD45+CD4+ T cells, CD45+CD8+ T cells, and CD45+CD11b+ monocytes) infiltrated to the spinal cord and brain of MOG35-55-immunized WT and GSDMD−/− mice at day 18 after immunization (n = 7 for WTs, n = 8 for GSDMD−/− mice). Data are presented as a representative plot (E) and summary graph of the absolute cell numbers (F). (G and H) Flow-cytometric analysis of Th1 (IFN-γ+) and Th17 (IL-17A+) cells from CD4+ T cells infiltrated to the spinal cord and brain of MOG35-55-immunized WT and GSDMD−/− mice at day 18 after immunization (n = 7 mice per group). Data are presented as a representative plot (G), quantified percentage, and absolute cell numbers (H). Data are pooled from three independent experiments. *, P < 0.05; **, P < 0.01; ***, P < 0.001. Error bars show means ± SEM. Unpaired t test for A, D, and H, and multiple unpaired t test for F. GSDMD deficiency in peripheral myeloid cells suppresses neuroinflammation and pathogenesis of EAE To determine whether GSDMD deficiency in peripheral cells or CNS-resident cells contributes to the suppression of EAE, we measured the expression of GSDMD in various tissues, but it was strikingly low in CNS of homeostatic state (Fig. 3 A). Moreover, compared with peripheral cells (including bone marrow–derived macrophages [BMDMs], bone marrow–derived DCs, and T cells), microglia displayed very low expression of GSDMD with barely detectable expression other CNS cells including astrocytes, oligodendrocyte progenitor cells, and neurons (Fig. 3 B). Next, we generated bone marrow chimeric mice by adoptively transferring WT bone marrow cells into lethally irradiated WT or GSDMD−/− recipient mice. Comparable EAE clinical scores were observed between these two recipients (Fig. 3 C), which also had comparable levels of infiltrated immune cells in the CNS (Fig. 3 C). However, a reverse bone marrow transfer experiment in which lethally irradiated WT recipient mice were reconstituted with bone marrow cells isolated from WT or GSDMD−/− mice showed that WT mice reconstituted with the GSDMD deficiency bone marrow were more refractory to EAE induction than WT donors (Fig. 3 D). Additionally, the recruitment of peripheral immune cells into the CNS was reduced in GSDMD−/− donors compared with WT donors (Fig. 3, D and E). H&E and LFB (Fig. 3 F) staining also confirmed that fewer infiltrating inflammatory cells and decreased demyelination were apparent in the spinal cord of GSDMD−/− donor mice. Notably, the CNS of WT recipients reconstituted with the GSDMD−/− bone marrow had significantly decreased expression of several inflammatory chemokines and cytokines known to mediate immune cells recruitment and neuroinflammation after the induction of EAE (Fig. 3 G). Thus, these results suggest that GSDMD functions in peripheral cells to promote EAE pathogenesis in the CNS. Figure 3. GSDMD deletion in peripheral cells attenuates the development of EAE. (A) Immunoblot analysis of the protein expression of GSDMD in different tissues (heart, liver, kidney, lung, mesenteric LNs [mLN], spleen, small intestine, colon, cortex, midbrain and cerebellum) from WT mice. (B) Immunoblot analysis of the protein expression of GSDMD in peripheral cells (BMDMs, bone marrow–derived DCs [BMDCs], and T cells) and CNS resident cells (microglia, astrocyte, oligodendrocyte progenitor cell [OPC], and neuron) from WT mice. (C) Mean clinical scores after EAE induction and summary graph of CNS-infiltrating immune cells at day 18 after immunization in WT and GSDMD−/− mice (n = 6 mice per group) adoptively transferred with WT bone marrow cells. (D) Mean clinical scores after EAE induction and summary graph of CNS-infiltrating immune cells at day 18 after immunization in WT mice (n = 5 or 6 mice per group) adoptively transferred with WT or GSDMD−/− bone marrow cells. (E) Representative plot from flow-cytometric analysis of immune cells infiltrated to the CNS (spinal cord and brain) of the mice in D. (F) H&E staining and LFB staining of spinal cord sections harvested from WT mice adoptively transferred with WT or GSDMD−/− bone marrow cells showing inflammatory cell infiltration and demyelination, respectively (arrows). Scale bar, 200 µm. (G) Quantitative PCR analysis of the relative mRNA expression of proinflammatory cytokines and chemokines in the spinal cord of WT mice (n = 4 mice per group) adoptively transferred with WT or GSDMD−/− bone marrow cells at the EAE peak. Data were normalized to a reference gene, Hprt. (H) Mean clinical scores after EAE induction and summary graph of CNS-infiltrating immune cells at day 18 after immunization in GSDMDfl/flCD4-Cre and littermate control GSDMDfl/fl mice (n = 4 or 5 mice per group). (I) Mean clinical scores after EAE induction and summary graph of CNS-infiltrating immune cells at day 18 after immunization in GSDMDfl/flCx3cr1-CreERT2 and Cx3cr1-CreERT2 mice (n = 4 or 5 mice per group). (J) Immunoblot analysis of GSDMD expression in T cells from indicated mice, and in microglia and BMDMs from indicated mice at 6 wk after administration of tamoxifen. Data are pooled from three independent experiments. *, P < 0.05; **, P < 0.01; ***, P < 0.001. Error bars show means ± SEM. Unpaired t test for C, D, H, and I, and multiple unpaired t test for C, D, and G–I. We next examined if this role for GSDMD in peripheral cells was intrinsic to peripheral T cells by crossing the GSDMDfl/fl mice with CD4-Cre mice to generate T cell conditional GSDMD KO mice. GSDMDfl/flCD4-Cre and littermate control GSDMDfl/fl mice developed similar clinical symptoms and immune cells infiltration after immunization (Fig. S2 and Fig. 3, H and J), suggesting that GSDMD in T cells has no role in driving EAE-associated pathogenesis. However, peripheral myeloid cells (DCs and macrophages) and CNS-resident microglia also contribute to neuroinflammation and pathogenesis in EAE (Duffy et al., 2014). To further explore the potential contribution of GSDMD in microglia to EAE pathogenesis, we crossed GSDMDfl/fl mice with Cx3cr1-CreERT2 mice to generate microglia conditional GSDMD KO mice. Tamoxifen was administered to these mice to specifically delete GSDMD in microglia. This experimental design is based on a previous report showing that short-lived blood monocytes are renewed within 6 wk after tamoxifen administration, whereas GSDMD is specifically deleted in long-lived microglia of GSDMDfl/flCx3cr1-CreERT2 mice (Yona et al., 2013). GSDMD deficiency in microglia had no effect on the EAE phenotype (Fig. 3, I and J), and this is consistent with the bone marrow transfer experiments that concluded a lack of role for GSDMD in CNS resident cells. Together, these data demonstrate that deletion of GSDMD in peripheral myeloid cells might be responsible for the suppression of the pathogenesis and neuroinflammation of EAE. GSDMD deficiency impairs the priming and differentiation of T cell by myeloid cells and increases T cell accumulation in peripheral lymphoid organs during EAE Antigen-activated T cells are key effector cells in the pathogenesis of EAE, which undergo activation in secondary lymphoid organs and then migrate into CNS due to the actions of cytokines and chemokines produced by APCs (Goverman, 2009). Given the phenotype observed above, we hypothesized that GSDMD in peripheral myeloid cells may be important for T cell response in peripheral lymphoid organs during EAE. Thus, decreased infiltration of CD4+ T cells in the CNS of GSDMD−/− mice may be caused by decreased cellularity in the periphery. Unexpectedly, GSDMD-deficient mice show enlargement of spleen and draining LNs (DLNs) at the peak stage of EAE (Fig. 4, A and B), indicating the potential accumulation of T cells in peripheral lymphoid organs after immunization. Most notably, while the absolute numbers of CD4+ T cells (Fig. 4 C) were increased in the secondary lymphoid organs of GSDMD−/− mice after EAE, the percentages of Th1 and Th17 cells were reduced, but their numbers were comparable in WT and GSDMD−/− mice (Fig. 4, D and E). We next analyzed the naive CD62+CD44−CD4+ T cells (Th0) that have not been activated by APCs during EAE. Interestingly, the numbers of naive T cell in spleen and LNs were much higher in GSDMD−/− mice after EAE than WT mice (Fig. 4, D and F), which might be responsible for the observed increase of CD4+ T cells in the secondary lymphoid organs of GSDMD−/− mice. Given that we observed significantly reduced percentages of Th1 and Th17 cells in the secondary lymphoid organs of GSDMD−/− mice during EAE, we suggest that GSDMD plays an important role in regulating T cell priming and differentiation in the peripheral lymphoid organs during EAE. This was directly addressed by performing in vitro T cell proliferation and differentiation assays that revealed GSDMD−/− DCs to be greatly impaired in driving EAE MOG-induced T cell activation and differentiation relative to WT DCs (Fig. 4, G–I). Since the number of Th1 and Th17 cells in the secondary lymphoid organs was unaltered in GSDMD−/− mice after EAE and the infiltration of Th1 and Th17 cells in the CNS was decreased (Fig. 2, G and H), we speculate that GSDMD deficiency also affects T cell migration into CNS. Additionally, we evaluated the profiles of T cells in thymus, spleen, and LN of GSDMD−/− mice in homeostatic state. There were no significant differences observed between WT and GSDMD−/− mice in the development of T cells and the profiles of naive T cell, effective T cell, and T regulatory (T reg) cell (Fig. S3). Therefore, these data suggest that GSDMD deficiency suppresses the priming and differentiation of T cells after the induction of EAE, meanwhile increasing T cell accumulation in peripheral lymphoid organs during disease. Figure 4. The differentiation and egress of T cells in peripheral lymphoid organs during EAE are impaired in GSDMD−/− mice. (A and B) Spleens and DLNs harvested from three pairs of WTs and GSDMD−/− mice at day 18 after EAE induction (A) and quantified spleen (SP) weights (n = 5 mice per group; B). (C) Quantified absolute cell numbers of CD4+ T cells in spleen and DLNs from WTs and GSDMD−/− mice at day 18 after EAE induction (n = 6 mice per group). (D–F) Flow-cytometric analysis of Th1 (IFN-γ+) and Th17 (IL-17A+) cells from CD4+ T cells in the spleen and DLNs of WT and GSDMD−/− mice (n = 6 mice per group) at day 18 after EAE induction, and effective T cell (CD44+CD62L−) and naive T cell (CD44−CD62L+) cells from CD4+ T cells in the spleen and DLNs of WT and GSDMD−/− mice (n = 4 mice per group) at day 18 after EAE induction. Data are presented as a representative plot (D), and quantified percentages and absolute cell numbers (E and F). (G–I) Flow-cytometric analysis of CFSE-labeled cells, Th1 (IFN-γ+) cells, and Th17 (IL-17A+) cells from CD4+ T cells at day 5 after in vitro cocultured with DCs (n = 3 per group). Data are presented as a representative plot (G and H) and quantified percentages (I). Data are pooled from three independent experiments (A–E) or from two independent experiments (F–I). *, P < 0.05; **, P < 0.01; ***, P < 0.001. Error bars show means ± SEM. Unpaired t test for B, C, and I, and multiple unpaired t test for E, F, and I. CTRL, control; max, maximum. To further address whether GSDMD functions on the myeloid cells to regulate T cell responses, we next investigated the composition of myeloid cells in the spleen during EAE. FACS revealed a marked reduction in the percentages and absolute numbers of macrophages (CD11b+F4/80+), neutrophils (CD11b+Gr-1+), and DCs (CD11c+, including classical DCs [cDCs; CD11c+B220−], and plasmacytoid DCs [pDCs; CD11c+B220+]) in the spleen of GSDMD−/− mice during EAE relative to WT mice (Fig. 5 A). Importantly, the percentages and absolute numbers of MHCII-expressing cells (CD11b+MHCII+ and CD11c+MHCII+) in spleen were greatly reduced in EAE GSDMD−/− mice (Fig. 5 A). In addition, GSDMD deficiency did not affect the number of B and natural killer (NK) cells in the spleen during EAE (Fig. 5 B). Moreover, we didn’t find any differences in the frequency and numbers of lymphocytic and myeloid cells in bone marrow, blood, and spleens of GSDMD−/− mice relative to WT controls under homeostatic conditions (Fig. S4). Thus, all these results further strengthen the conclusion of a key role for GSDMD in T cell priming by myeloid cells in the secondary lymphoid organs after EAE. Figure 5. Myeloid cells in peripheral lymphoid organs during EAE are impaired in GSDMD−/− mice. (A) Flow-cytometric analysis of macrophages (Ma; CD11b+F4/80+), neutrophils (Neu; CD11b+Gr-1+), DCs (CD11c+, including cDCs [CD11c+B220−] and pDCs [CD11c+B220+]), and MHCII-expressing cells (CD11b+MHCII+ and CD11c+MHCII+) in the spleen (SP) of WT and GSDMD−/− mice (n = 4 mice per group) at day 18 after EAE induction. Data are presented as a representative plot, quantified percentages, and absolute cell numbers. (B) Flow-cytometric analysis of NK cells (NK1.1+) and B cells (CD19+) in the spleen of WT and GSDMD−/− mice (n = 4 mice per group) at day 18 after EAE induction. Data are presented as a representative plot, quantified percentages, and absolute cell numbers. Data are pooled from two independent experiments. *, P < 0.05; **, P < 0.01; ***, P < 0.001. Error bars show means ± SEM. Multiple unpaired t test for A and B. SSC-A, side scatter–area. GSDMD deficiency impairs the expression of genes required for T cell response in CD11b+ cells and CD4+ T cells of peripheral lymphoid organs during EAE It is clear from the above results that peripheral myeloid cell–intrinsic GSDMD functions in peripheral lymphoid organs to regulate T cell response during EAE. To further dissect the mechanistic role of GSDMD in myeloid cells that regulates T cell responses, we performed RNA sequencing analysis using CD11b+ cells sorted from spleens of WT and GSDMD−/− mice at the onset stage of EAE. Kyoto Encyclopedia of Genes and Genomes (KEGG) analysis showed the top pathways down-regulated in GSDMD−/− CD11b+ cells mainly included Th cell differentiation, antigen processing and presentation, cell adhesion molecules, and cytokine signaling (Fig. 6 A). Consistently, the heatmap and real-time PCR analysis displayed significantly decreased expression in several genes associated with T cell response and migration, such as Il1b, Ifng, Tnf, Osm, H2-Q10, H2-Ob, Itga6, and Ccl5 in GSDMD−/− cells (Fig. 6, C and D). To further study the impact of GSDMD deficiency on T cell responses and determine whether T cells in GSDMD−/− mice display an alteration in gene expression during EAE, we also performed RNA sequencing (RNA-seq) and examined the related genes expression in CD4+ T cells sorted from spleen. The top down-regulated pathways in GSDMD−/− T cells after EAE induction were involved with Th cell differentiation, T cell receptor signaling pathway, and cytokine–chemokine signaling according to KEGG analysis (Fig. 6 B). Several genes associated with T cell activation and migration, such as Il2, Ifng, Tnf, Cd3e, Ccl5, Ccl22, Ccr4, Cxcr3, and Cxcr6, were down-regulated in GSDMD−/− T cells at the onset of EAE as indicated in the heatmap and real-time PCR analysis (Fig. 6, C and D). Moreover, FACS revealed GSDMD deficiency greatly impaired the expression of Cxcr6, Ccl5, TNF-α, and CD3e expression on Th1 and Th17 cells during EAE (Fig. 6, E and F). Thus, these data further demonstrate that the expression of genes involved in T cell activation, differentiation, and migration in CD11b+ and CD4+ cells of peripheral lymphoid organs during EAE is significantly impaired by the deficiency of GSDMD. Figure 6. GSDMD deficiency attenuates the expression of genes required for T cell response in CD11b+ cell and CD4+ T cell of peripheral lymphoid organs during EAE. (A and B) KEGG analysis shows the most significantly enriched signaling pathways in CD11b+ macrophages (A) and CD4+ T cells (B) sorted from spleens of WT and GSDMD−/− mice at day 12 after EAE induction. (C) The heatmaps of genes with adjusted P value <0.05, false discovery rate <0.05, and log2 fold-change >1.2 from RNA-seq analysis of CD11b+ myeloid cells and CD4+ T cells isolated from spleens of three pairs of WTs and GSDMD−/− mice at day 12 after EAE induction. (D) Quantitative PCR analysis of the indicated genes in CD11b+ myeloid cells and CD4+ T cells sorted from spleens in C (n = 3 mice per group). Data were normalized to a reference gene, Hprt. (E and F) Flow-cytometric analysis of CD3e+, Cxcr6+, TNFα+, and Ccl5+ cells from Th1 and Th17 cells in the spleen of WT and GSDMD−/− mice (n = 4 mice per group) at day 18 after EAE induction. Data are presented as a representative plot (E) and quantified percentages (F). Data are pooled from three independent experiments (E and F). *, P < 0.05; **, P < 0.01; ***, P < 0.001. Error bars show means ± SEM. Two-way ANOVA with Sidak’s multiple comparisons test for D. Multiple unpaired t test for F. GSDMD in myeloid cells is required for the activation of CD4+ T cells during EAE To further test the impact of GSDMD deficiency on T cell function during EAE, CD4+ T or Th17 cells isolated from spleens of WT and GSDMD−/− mice at the time of EAE onset (day 12) were i.v. transferred to Rag1−/− or C57BL/6 WT recipients (Fig. 7 A). CD4+ T cells from immunized GSDMD−/− mice failed to induce passive EAE in Rag1−/− or WT recipients, but CD4+ T cells obtained from WT immunized mice promoted mild EAE (Fig. 7 B). This indicated that GSDMD deficiency results in functional impairment of T cells during EAE induction. Next, to further investigate whether GSDMD deficiency affects T cell migration, we directly transferred CD4+ T cells into the brain of WT mice by intracerebroventricular (i.c.v.) injection in order to bypass the migration of T cells from peripheral to CNS. Again, CD4+ T cells obtained from immunized GSDMD−/− mice developed lower levels of EAE pathogenesis compared with immunized WT mice (Fig. 7 C), suggesting that the critical function of GSDMD may reside in regulating the activation and/or differentiation of T cells during EAE. Figure 7. GSDMD in peripheral myeloid cells is essential for the activation of CD4+ T Cells during EAE. (A) Schematic representation of the experiments in B, C, and Fig. 8 G. CD4+ T cells were obtained from spleens of WT or GSDMD−/− mice at day 12 after EAE induction, then transferred into Rag1−/− mice by i.v. injection or into WT mice by i.c.v. injection. DLN cells were obtained from WT or GSDMD−/− mice at day 12 after EAE induction, then cultured in vitro with MOG35-55 and IL-23 under Th17 cell–polarizing conditions before transfer into sublethal irradiated WTs or GSDMDfl/fl and GSDMDfl/flLysM-Cre mice, respectively. (B and C) Mean clinical scores after CD4 T cell and Th17 cell transfer by i.v. (B) and CD4 T cell transfer by i.c.v. (C; n = 5 mice per group). (D) Mean clinical scores after EAE induction in GSDMDfl/flLysM-Cre and littermate control GSDMDfl/fl mice (n = 5 mice per group); immunoblot analysis of GSDMD expression in BMDMs from indicated mice. (E) Summary graph of CNS-infiltrating immune cells at day 18 after immunization in GSDMDfl/flLysM-Cre and littermate GSDMDfl/fl mice (n = 5 mice per group). (F) Flow-cytometric analysis of KI67+ cells among CD4+ T cells in the CNS and spleens (SP) of GSDMDfl/flLysM-Cre and littermate GSDMDfl/fl mice at day 18 after immunization (n = 5 mice per group). (G) Immunofluorescent labeling of CD3 (red) and KI67 (green) demonstrate the proliferation of T cells in the spinal cord of indicated mice at day 18 after immunization. Data are presented as a representative image (left) and quantified percentage (right). Scale bar, 50 µm. (H) Quantified absolute cell numbers of CD4+ T cell in spleen and DLNs from GSDMDfl/flLysM-Cre and littermate control GSDMDfl/fl mice at day 18 after EAE induction (n = 4 mice per group). Data are pooled from three independent experiments (A–G) or from two independent experiments (H). *, P < 0.05; **, P < 0.01; ***, P < 0.001. Error bars show means ± SEM. Unpaired t test for B–D and F–H, and multiple unpaired t test for E. Given that we have earlier shown that GSDMD in peripheral myeloid cells is responsible for the neuroinflammation and pathogenesis of EAE, we next examined if peripheral myeloid cell–intrinsic GSDMD plays a function in T cell activation during EAE. To this end, we generated myeloid cell conditional GSDMD-KO mice by crossing the GSDMDfl/fl mice with LysM-Cre mice. Since these conditional KO mice lack GSDMD expression in myeloid cells and we have already excluded the effect of GSDMD in microglia using Cx3cr1-CreERT2 mice (Fig. 3, I and J), the LysM-Cre mice allowed for direct investigation of the role of GSDMD in peripheral myeloid cells in T cell activation after EAE induction. Notably, the EAE clinical scores and infiltration of immune cells into CNS were considerably diminished in GSDMDfl/flLysM-Cre mice relative to GSDMDfl/fl mice (Fig. 7, D and E). Moreover, T cell proliferation was significantly impaired in the CNS and spleens of GSDMDfl/flLysM-Cre mice, as shown by reduced staining of the proliferation marker CD4+Ki67+ at the EAE peak stage (Fig. 7, F and G). Additionally, we observed a significant increase in the number of CD4 T cells in the spleen and DLNs of GSDMDf/f LysM-Cre mice during EAE relative to littermate controls (Fig. 7 H), but a marked reduction in the percentages of Th1 and Th17 cells (Fig. 8, A and B). Moreover, the number of naive CD62+CD44−CD4+(Th0) T cells in spleen and LNs was much higher in GSDMDf/f LysM-Cre mice after EAE than tissues from controls (Fig. 8, A and C). In addition, the percentages and numbers of macrophages, neutrophils, DCs, and MHCII-expressing cells were greatly reduced in the spleen of GSDMDf/f LysM-Cre mice during EAE (Fig. 8, D and E). We didn’t find any differences in the frequency and numbers of lymphocytic and myeloid cells in bone marrow, blood, and spleens of GSDMDf/f LysM-Cre mice relative to littermate controls (Fig. S5). Furthermore, GSDMD deficiency in myeloid cells did not affect the number of B and NK cells in the spleen during EAE (Fig. 8 F). Thus, all of these data strongly suggest that GSDMD in peripheral myeloid cells is essential for T cell activation and ensuing pathogenesis in EAE. To further exclude an effect of GSDMD deficiency in microglia, we next performed adoptive transfer studies in GSDMDf/f LysM-Cre mice and their littermate controls by adoptive transfer of Th17 cells from immunized WT mice. We found that MOG-reactive Th17 cells induced comparable EAE clinical scores between GSDMDf/f LysM-Cre mice and controls (Fig. 8 G), which further suggests that GSDMD in peripheral myeloid cells but not in CNS resident microglia is essential for pathogenesis in EAE. Figure 8. GSDMD in peripheral myeloid cells is essential for T cell priming by myeloid cells during EAE. (A–C) Flow-cytometric analysis of Th1 (IFN-γ+) and Th17 (IL-17A+) cells, effective T cells (CD44+CD62L−), and naive T cells (CD44−CD62L+) from CD4+ T cells in the spleen (SP) and DLNs of GSDMDfl/flLysM-Cre and littermate control GSDMDfl/fl mice (n = 4 mice per group) at day 18 after EAE induction. Data are presented as a representative plot (A), and quantified percentages and absolute cell numbers (B and C). (D and E) Flow-cytometric analysis of macrophages (Ma; CD11b+F4/80+), neutrophils (Neu; CD11b+Gr-1+), DCs (CD11c+, including cDCs [CD11c+B220−] and pDCs [CD11c+B220+]), and MHCII-expressing cells (CD11b+MHCII+ and CD11c+MHCII+) in the spleen of GSDMDfl/flLysM-Cre and littermate control GSDMDfl/fl mice (n = 4 mice per group) at day 18 after EAE induction. Data are presented as a representative plot (D), and quantified percentages and absolute cell numbers (D and E). (F) Flow-cytometric analysis of NK cells (NK1.1+) and B cells (CD19+) in the spleen of GSDMDfl/fl and GSDMDfl/flLysM-Cre mice (n = 4 mice per group) at day 18 after EAE induction. Data are presented as a representative plot, quantified percentages and absolute cell numbers. (G) Mean clinical scores after Th17-cell transferring by i.v. to indicated mice (n = 5 mice per group). Data are pooled from two independent experiments. *, P < 0.05; **, P < 0.01; ***, P < 0.001. Error bars show means ± SEM. Unpaired t test for G and multiple unpaired t test for B, C, E, and F. SSC-A, side scatter–area. Pharmacological inhibition of GSDMD attenuates EAE, and inflammasome-related cytokines promote EAE pathogenesis in GSDMD-deficient mice Given that GSDMD-deficient mice show impaired pathogenesis, we were keen to assess if pharmacological inhibition of GSDMD could phenocopy the genetic models. We thus directly assessed the effects of pyroptosis inhibition on EAE progression in vivo by i.p. administration with disulfiram, a recently described potent inhibitor of GSDMD (Hu et al., 2018). We found that disulfiram treatment protected against EAE development and greatly attenuated the clinical and histopathological scores (Fig. 9, A–C). Thus, this result further indicates an important role of GSDMD in the pathogenesis of EAE and suggests a potential therapeutic use of targeting GSDMD-mediated pyroptosis in MS treatment. Different reports have shown that IL-1β and IL-18, the downstream cytokines of inflammasome activation, have high-level expression in MS patients and promote T cell differentiation, survival, and migration during EAE (Lalor et al., 2011; Inoue et al., 2012; Martin et al., 2016). Moreover, GSDMD can facilitate the secretion of IL-1β and IL-18 through cell lysis by pyroptosis or forming pores in living cells (Shi et al., 2015; Evavold et al., 2018). To understand whether the impairment of EAE pathogenesis in GSDMD-deficient mice is completely dependent on the loss of inflammasome-related cytokines, we assessed the effects of IL-1β and IL-18 on EAE progression in vivo by i.v. administration of their recombinant proteins in WT and GSDMD−/− mice immunized with MOG. Although administration of recombinant IL-1β (rIL-1β) and rIL-18 in GSDMD−/− mice developed more severe EAE as demonstrated by higher clinical and histopathological scores compared with their PBS-control mice, the disease severity of GSDMD−/− mice still was milder than WTs even after administration with rIL-1β and rIL-18 (Fig. 9, D–F). It is hardly surprising that this exogenous supplementation exacerbates pathology in WTs since the exogenous levels of these cytokines likely greatly exceed the endogenous levels under conditions of EAE, and maximal pathogenesis is limited by the endogenous levels of IL-1β and IL-18. Importantly, the exacerbation of EAE severity by these cytokines in GSDMD KO mice did not completely reach the severity observed in WT PBS control mice. Thus, these results indicate that administration of IL-1β and IL-18 can only partially rescue the impairment of EAE pathogenesis in GSDMD−/− mice, which suggests that the pathogenic role of GSDMD may also be dependent on the release of other factors in response to the pyroptotic actions of GSDMD. Figure 9. Pharmacological inhibition of GSDMD attenuates EAE, and inflammasome-related cytokines promote EAE pathogenesis in GSDMD-deficient mice. (A) Mean clinical scores of WT mice injected (i.p.) with disulfiram or PBS daily after EAE induction, respectively (n = 5 mice per group). (B and C) Representative images (B) and histological scores (C) of H&E staining and LFB staining of spinal cord sections from mice in A. Inflammatory cell infiltration and demyelination indicated by arrow. Scale bar, 200 µm. (D) Mean clinical scores of WTs and GSDMD−/− mice which were i.v. injected with rIL-1β and rIL-18 combination or PBS at day 4, 8, 12, and 16 after EAE induction, respectively (n = 5 mice per group). (E and F) Representative images (E) and histological scores (F) of H&E staining and LFB staining of spinal cord sections from mice in D. Inflammatory cell infiltration and demyelination indicated by arrow. Scale bars, 200 µm. Histological scores in C and F: 0, no inflammatory cell infiltration and no demyelination; 1, slight inflammatory cell infiltration or demyelination observed; 2, moderate inflammatory cell infiltration or demyelination in several spots; 3, substantial inflammatory cell infiltration and large area of demyelination. Data are pooled from three independent experiments (D–F) or from two independent experiments (A–C). *, P < 0.05; **, P < 0.01. Error bars show means ± SEM. Unpaired t test for A, C, D, and F. Discussion GSDMD protein, a newly identified pyroptosis executioner downstream of inflammasome activation, has been reported to accumulate in the CNS of MS (McKenzie et al., 2018), but it is not clear what the physiological role and mechanism of GSDMD is in the EAE pathogenesis. In this study, we found that the ablation of GSDMD in peripheral myeloid cells reduced the infiltration of immune cells into the CNS and conferred robust protection from EAE development in mice immunized with MOG35-55. In addition, GSDMD deficiency impaired the activation and differentiation of T cell in the secondary lymphoid organs, thus preventing T cell–mediated neuroinflammation in EAE. While the recent study suggested GSDMD-mediated pyroptosis appeared in the CNS of patients with MS and in EAE mice (McKenzie et al., 2018), the issues of the relative contribution of peripheral versus CNS GSDMD to disease pathology were unknown. The conclusion that GSDMD-mediated pyroptosis involves microglia during EAE progression cannot be addressed only by GSDMD immunoreactivity in Iba-1 immuno-positive cells in that study because of Iba-1 expression in both peripheral and CNS macrophages (Müller et al., 2015). In fact, both peripheral and CNS macrophages contribute to EAE progression (Bauer et al., 1995; Xiao et al., 2013; Duffy et al., 2014). Here we found that GSDMD in peripheral cells is indispensable for EAE induction by using the bone marrow chimeric EAE models in which the bone marrow from GSDMD−/− mice exhibits impaired capability to induce neuroinflammation and pathogenesis of EAE. Moreover, GSDMD-specific deletion in microglia by using the GSDMDfl/fl Cx3cr1-CreERT2 mice does not suppress CNS autoimmune inflammation after EAE induction, suggesting that GSDMD in microglia does not play a major role in regulating EAE pathogenesis. Notably, we observed an abundance of GSDMD immunoreactivity near the areas surrounding blood vessels of spinal cords within EAE, indicating that peripheral cells might be recruited and undergo pyroptosis in the diseased brain. Additionally, the studies in GSDMDf/f LysM-Cre mice also showed that GSDMD deficiency in myeloid cells attenuated the progression of EAE. Therefore, our studies provide the first demonstration of a peripheral myeloid–intrinsic role for GSDMD in driving neuroinflammation in EAE. Our RNA-seq analysis revealed that the major immune pathways down-regulated in CD11b+ cells from immunized GSDMD−/− mice were associated with T cell response, including Th1 and Th17 cell differentiation, antigen processing and presentation, cell adhesion molecules, and cytokine signaling, which indicated that GSDMD-sufficient APCs are essential for priming T cell immune response. The heatmap results summarized that GSDMD deficiency severely impaired the expression of several genes for T cell activation and differentiation, such as Tnf, Ifng, Il1b, H2-Q10, and H2-Ob. TNF-α, IFN-γ, and IL-1β are key pro-inflammatory cytokines for the expansion and differentiation of reactive T cells in the secondary lymphoid organs, and an abundance of previously published reports demonstrated their critical roles in EAE development (Hirota et al., 2011; Raphael et al., 2015). H2-Q10 and H2-Ob are certain MHC haplotypes, and the importance of specific MHC molecules in determining EAE susceptibility has been well established (Weissert et al., 1998; Irla et al., 2010). In addition, the significantly reduced expression of genes for chemotaxis and adhesion, including Ccl5, Ccr4, Ccr6, and Itga6, was observed in splenic CD11b+ cells from immunized GSDMD−/− mice. There have been a number of reports that chemotaxis molecules that enhance immune cell migration are strongly connected with EAE progression (Inoue et al., 2012; Poppensieker et al., 2012; Cheng and Chen, 2014). For CD4+ T cell from EAE mice, KEGG pathway analysis showed that the biological terms down-regulated in GSDMD−/− cells majorly include Th1 and Th17 cell differentiation, T cell signaling pathway, cell adhesion molecules, and cytokine–chemokine signaling. Significant reductions in mRNA levels of Il2, Ifng, Tnf, Cd3e, Ccl5, Ccl22, Ccr4, Cxcr3, and Cxcr6 were identified in splenic CD4+ T cells from GSDMD−/− mice. IL-2 and CD3e are necessary for the expansion and survive of reactive T cells (Tamura and Nariuchi, 1992; Liao et al., 2013). TNF-α and IFN-γ can drive and amplify T cell response and inflammation during EAE pathogenesis (Raphael et al., 2015). Ccl5, Ccl22, Ccr4, Cxcr3, and Cxcr6 are migration-related molecules, which are required for T cells to enhance their migration ability to the CNS during the development of EAE (dos Santos et al., 2005; Inoue et al., 2012). Therefore, GSDMD-mediated pyroptosis up-regulates the expression of genes required for T cell response in the secondary lymphoid organs, which are involved in development of EAE and probably in MS as well. Although RNA-seq results indicated that GSDMD deficiency might affect T cell migration into CNS, direct injection of CD4+ T cell from immunized GSDMD−/− mice injection into the CNS induced much milder EAE compared with that induced by WT CD4+ T cells, suggesting that T cell activation is likely to be the substantive pathway affected by GSDMD deficiency during EAE. Consistent with this, our studies in GSDMDf/f LysM-Cre mice further showed that the protective effect of GSDMD deficiency in myeloid cells was associated with the attenuation of T cell activation and proliferation during EAE. We demonstrate that the administration of IL-1β and IL-18 only partially rescued the impairment of EAE pathogenesis in GSDMD−/− mice. Notably, a recent study showed that GSDMD deficiency promotes cyclic GMP-AMP synthase–dependent IFN production by reducing intracellular potassium (K+) efflux through GSDMD-formed pores (Banerjee et al., 2018). IFN-β administration is a first-line disease-modifying therapy for MS and thought to control CNS inflammation and neurodegeneration (Banerjee et al., 2018). Thus, whether the effects of GSDMD on IFN production are involved in GSDMD-mediated EAE progression needs to be further investigated in the future. In summary, our study is the first to report the physiological role of GSDMD as a key mediator in autoimmune inflammation and pathogenesis during EAE. We propose a model in which peripheral myeloid cell–intrinsic GSDMD mediates pyroptosis to instigate inflammation and promote the activation and differentiation of T cells in the secondary lymphoid organs, thus driving T cell–mediated neuroinflammation and demyelination in the CNS of EAE (Fig. 10). The development of therapeutic strategies to specifically target GSDMD-mediated pyroptosis might be useful for the inhibition of CNS inflammation and MS treatment. Figure 10. Model for GSDMD function in EAE pathogenesis. During EAE development, peripheral myeloid cell–intrinsic GSDMD mediates pyroptosis to instigate inflammation and promote the activation and differentiation of T cells in the secondary lymphoid organs, thus driving T cell–mediated neuroinflammation and demyelination in the CNS of EAE. Materials and methods Mice Female mice with the C57BL/6 background were used in this study. The Gsdmd−/− mice were kindly provided by Dr. Feng Shao (National Institute of Biological Sciences, Beijing, China). The Gsdmdflox/flox mice was generated using conditional gene targeting methods by Cyagen Biosciences. To generate this mouse, the strategy of gene targeting and construction of the conditional targeting vector were established to delete the exon 3 genomic region of Gsdmd gene by flanking loxP sites and a Neo cassette. C57BL/6 mouse embryonic stem (ES) cells were electroporated with linearized Gsdmd targeting vector, and screening of the G418 resistant colonies was performed according to routine protocol. The homologous recombined ES cell clones were identified by PCR and confirmed by Southern blot analysis. The Neo selection cassette on the targeting construct was capable of removing itself after ES cell targeting without the need to breed to Flp deleter mice by the TetraOne ES Cell technique. Tail DNAs were genotyped using the primer sets specific to the floxed regions of Gsdmdflox/+ mice. Primers for 5′ floxed allele were as follows: primers P1 (5′-GGACCCTGAGAGAAAGACATACCCAT-3′) and P2 (5′-GTTGGGATGTTGGGATGGAACTCC-3′); WT mice results in generation of a 148-bp fragment with a 261-bp fragment corresponding to the floxed allele–positive mice. Primers for 3′ floxed allele were as follows: primers P3 (5′-CTCTACTCCTCTGGTCCTATTTCC-3′) and P4 (5′- CACAGCACTACGTTCCATCGGT-3′). The 364-bp fragment for the WT allele and the 420-bp fragment for the floxed allele were reconfirmed for heterozygous Gsdmd flox/+ mice. Gsdmd floxed mice were crossed with lysozyme M-Cre mice (LysM-Cre; The Jackson Laboratory) to generate myeloid cell–conditional Gsdmd KO mice (Gsdmdflox/flox LysM-Cre) or with CD4-Cre mice (The Jackson Laboratory) to produce T cell–conditional Gsdmd KO mice (Gsdmdflox/flox CD4-Cre). For the microglia-conditional Gsdmd KO mice, we crossed Gsdmd floxed mice with Cx3cr1-CreERT2-EYFP mice (The Jackson Laboratory) to generate Gsdmdflox/flox Cx3cr1-CreERT2-EYFP mice, and then the mice were i.p injected with 3 mg tamoxifen (T5648; Sigma-Aldrich) dissolved in 200 µl corn oil (C8267; Sigma-Aldrich) for 5 d consecutively to induce the expression of Cre recombinase. After 6 wk, the tamoxifen-induced mice were microglia–conditional Gsdmd KO mice and used for the EAE study. All mice were kept in a barrier facility, and all animal experiments were conducted in accordance with the procedure approved by the Ethical Review Committee for Laboratory Animal Welfare of Nanjing Medical University. Antibodies and reagents Antibodies to GSDMD (ab219800, ab209845) and CD31 (ab24590) were from Abcam. Anti–caspase-11 (17D9, C1354), anti–α-tubulin (T9026), anti–β-actin (A1978), and anti-GFAP (G3893) were from Sigma-Aldrich. Anti–caspase-11 (NB120-10454) was from Novus. Anti–caspase-1 (AG-20B-0042-C100) was from Adipogen. Anti-Iba1 (019–19741) was from Wako. Anti-CD45-FITC (30-F11,11-0451-82), anti-CD8a-PE (53–6.7,12-0081-83), anti-CD11b-APC (M1/70,17-0112-82), anti-CD11b-FITC (M1/70,11-0112-82), anti-F4/80-APC (BM8,17-4801-82), anti-Gr-1-PerCP-Cyanine5.5 (RB6-8C5,45-5931-80), anti-CD11c-PE (N418,12-0114-81), anti-B220-PerCP-Cyanine5.5 (RA3-6B2,5-0452-80), anti-NK1.1-PE-Cyanine7 (PKB6,25-5941-82), anti-IL17-PE (eBio18B7,12-7177-81), anti-IFN-γ-PerCP-Cyanine5.5 (XMG1.2,85-45-7311-82), anti-Hu/MoCD44-FITC (IM7,11-0441-82), anti-Foxp3-APC (FJK-16s,17-5773-80A), anti-CD62L-APC (MEL-14,17-0621-82), anti-CD25-PE (PC61.5,12-0251-81B), anti-CD19-APC (eBio1D3,17-0193-82), and anti-CD3e-FITC (145-2C11,11-0031-81) were from eBioscience. Anti-CD4-APC-Cy7(GK1.5,100414), anti-Ki-67-PE (11F6,151209), anti-Cxcr6-Briliant Violet 421 (SA051D1,151109), anti-TNF-α-PE (MP6-XT22,506306), and anti-CCL5-PE (2E9/CCL5,149104) were from BioLegend. FAM-FLICA Caspase-1 Assay Kit (98) was from ImmunoChemistry. Anti-IL4 (11B11, 16–7041-85), anti–IFN-γ (RA-6A2,16-7312-85), anti-IL12/IL23p40 (C17.8,16-7123-81), mouse IL-6 recombinant protein (14–8061-62), mouse IL-12 p70 recombinant protein (14–8121-62), and mouse TGF β 1 recombinant protein (14–8342-62) were from Invitrogen. Pertussis toxin (180) was from List Biological Laboratories. Mycobaterium tuberculosis H37Ra (231141) was from BD. Incomplete Freund’s adjuvant (F5506) was from Sigma-Aldrich. MOG35-55 peptide (residues 35–55, Met-Glu-Val-Gly-Trp-Tyr-Arg-Ser-Pro-Phe-Ser-Arg-Val-Val-His-Leu-Tyr-Arg-Asn-Gly-Lys) was synthesized by Sangon Biotech. Induction and assessment of EAE To induce EAE, MOG35-55 peptide (200 μg per mouse) was emulsified with CFA (50 μl per mouse, including 4 mg/ml M. tuberculosis H37Ra) and 50 μl incomplete Freund’s adjuvant. Pertussis toxin (250 ng per mouse) was applied intravenously on days 0 and 2 after immunization. Mice were assessed daily for clinical signs of EAE in a blinded fashion. EAE score was evaluated as follows: 0.5, partial tail paralysis; 1, tail paralysis; 1.5, reversible corrective reflex impairment; 2, corrective reflex impairment; 2.5, one hindlimb paralysis; 3, both hindlimbs paralysis; 3.5, both hindlimbs paralysis and one forelimb paralysis; 4, hindlimb and forelimb paralysis; and 5, death. Bone marrow chimeras The recipient mice were subjected to lethal-dose irradiation (10 Gy), and 1 d later, bone marrow cells (10 × 106) derived from the tibiae and femurs of donor mice were i.v. injected into lethally irradiated mice. Lethal dose irradiation can eliminate bone marrow and peripheral immune cells without affecting the radiation-resistant CNS resident cells in the recipient mice, so the peripheral immune system of chimeric mice will be reconstructed by bone marrow cells from donor mice. After 8 wk, the chimeric mice were then subjected to EAE induction. Adoptive transfer of CD4+ T cells and Th17 cells CD4+ T cells were isolated from spleens of WT and GSDMD−/− mice at 12 d after EAE induction by using CD4 negative selection MicroBeads (Stem Cell). Isolated T cells were adoptively transferred by i.v. injection (3 × 10⁶) to RAG-1 mice or i.c.v. injection (2 × 10⁶) to WT mice. Mice were also i.v. injected with pertussis toxin on days 0 and 2 after transfer. Polarized Th17 cells were also used to induce passive EAE. We first collected DLN cells from WT and GSDMD−/− donor mice at 12 d after MOG35-55 immunization, and cultured cells for 5 d with MOG35-55 (25 µg/ml) and IL-23 (20 ng/ml) under Th17 cell polarizing conditions. The MOG35-55-specific polarized Th17 cells were then adoptively transferred by i.v. injection (3 × 10⁷) to sublethal irradiated (5 Gy) WT recipient mice or GSDMDfl/fl and GSDMDfl/flLysM-Cre mice. In vitro T cell proliferation and Th1/Th17 cell polarization CD4+ T cells were isolated from DLNs of WT mice at 12 d after EAE induction by CD4 negative selection MicroBeads (Stem Cell). The isolated T cells (1 × 10⁶) were cocultured with WT or GSDMD−/− DCs (2 × 10⁵) that were pretreated with LPS (1 µg/ml) for 4 h and washed twice before co-culture. For proliferation experiments, T cells were labeled with 5 µM CFSE and cocultured with DCs in the presence of MOG35-55 (3 µg/ml). For polarization experiments, T cells were cocultured with DCs in the presence of MOG35-55 (3 µg/ml) under Th1 cell polarizing conditions (anti–IL-4, 10 µg/ml; IL-12, 10 ng/ml) or Th17 cell polarizing conditions (anti–IL-4, 10 µg/ml; anti–IL-12, 10 µg/ml; anti–IFN-γ, 10 µg/ml; IL-6, 50 ng/ml; and TGF-β, 5 ng/ml). CFSE dilution and Th1/Th17-cell percentages were determined by FACS at 5 d after co-culture. Histological and immunohistochemistry All spinal cord tissue sections used here were 5 µm thick. For paraffin-embedded tissue, spinal cords collected from PBS-perfused mice were fixed in 4% paraformaldehyde overnight. Sections were stained with H&E or with LFB for evaluation of inflammation and demyelination, respectively. For immunohistochemical staining, sections were blocked and incubated with primary antibodies and horseradish peroxidase-conjugated secondary antibodies after heat-induced antigen retrieval. Diaminobenzidine was used for detection. Images were captured with a Nikon 50i microscope. Immunofluorescence staining Tissue sections were incubated at 4°C overnight with primary antibodies to IBA1, GFAP, MBP, and CD4. Slides were then incubated with indicated secondary antibodies. The nuclei were counterstained with DAPI (Sigma-Aldrich). Slides were dried and mounted using ProLong Antifade mounting medium (Beyotime Biotechnology). Slides were visualized using a Nikon 50i fluorescent microscope. Flow cytometry For preparation of immune cells in the CNS, brains, and spinal cords from MOG35–55-immunized mice were excised and digested at 37°C with collagenase type IV (0.5 mg/ml; Sigma-Aldrich) and DNase I (10 U/ml; Roche) in RPMI 1640 under agitation (200 rpm) conditions for 60 min. The digested tissues were filtered through a 100-µm filter, and the plunger end of the syringe was used to push the cells over the filter. Homogeneous cell suspensions were centrifuged over the Percoll density gradient (GE Healthcare) and separated by collecting the interface fractions between 37% and 70% Percoll. Mononuclear cells were isolated from the interface. The cells were suspended in PBS containing 2% (wt/vol) FBS. After intensive washing, cells were stained with fluorochrome-conjugated surface marker antibodies for FACS analysis. The following antibodies were used: CD45, CD4, CD8, and CD11b. For intracellular cytokine staining, cells were stimulated with phorbol 12-myristate 13-acetate (Multi Sciences), ionomycin (Multi Sciences), and brefeldin A (Invitrogen) for the 4 h of culture. Cells were fixed and permeabilized with the Intracelluar Fixation & Permeabilization Buffer Set (eBioscience) and then subjected to cytokine staining flow cytometry analyses. All flow cytometry was performed on an Attune NxT flow cytometer (Thermo Fisher Scientific), and data were analyzed by FlowJo 7.6.1 software. Quantitative RT-PCR Total RNA was extracted by using TRIzol reagent (Life) and subjected to cDNA synthesis. Quantitative RT-PCR was performed using SYBR Green Supermix (Vazyme). The expression of a single gene was calculated by a standard curve method and standardized to the expression of Hprt. The following primers were used: Ccl22 S As, 5′-TCGGTTCTTGACGGTTAT-3′ and 5′-TGCTGCCAGGACTACATC-3′; Ccl5 S As, 5′-GACACCACTCCCTGCTGCTT-3′ and 5′-ACACTTGGCGGTTCCTTCG-3′; Ccr4 S As, 5′-TCCAAACAGACCCAACAA-3′ and 5′-ACCACCCAGGATGAAACT-3′; Ccr6 S As, 5′-TCACGACTCGGATTGCTC-3′ and 5′-CTGCTGGGTATGGGACTG-3′; Cxcr3 S As, 5′-GTTGGCTGATAGGTAGATGAA-3′ and 5′-CTGCTGTCCAGTGGGTTT-3′; Cxcr6 S As, 5′-CACCCAAATGAGCAAGCAAA-3′ and 5′-ATGGATGATGGGCATCAAGAGTCAG-3′; Ifnγ S As, 5′-CATGAGTATTGCCAAGTTTGAGG-3′ and 5′-CGACTCCTTTTCCGCTTCC-3′; Itga6 S As, 5′-GTTCTGTTCGCCCTCTGC-3′ 5′-TGCCTGCTCTACCTGTCC-3′; Il1b S As, 5′-ATGCCACCTTTTGACAGTGATG-3′ and 5′-GTTGATGTGCTGCTGCGAGA-3′; cxcl1 S As, 5′-AGCTGCGCTGTCAGTGCCT-3′ and 5′-TGTGGCTATGACTTCGGTTTGG-3′; Tnfa S As, 5′-TACTGAACTTCGGGGTGATCG-3′ and 5′-TCCTCCACT
|
|
Scooped by
Gilbert C FAURE
November 12, 2019 11:55 AM
|
|
|
Scooped by
Gilbert C FAURE
November 9, 2019 1:40 PM
|
A new study shows, for the first time, that cerebrospinal fluid washes into and out of the brain in waves during sleep, helping clear out waste.
|
|
Scooped by
Gilbert C FAURE
October 22, 2019 2:16 PM
|
|
|
Scooped by
Gilbert C FAURE
October 18, 2019 5:42 AM
|
Autism spectrum disorders affect one in 59 American children by age eight. With no known quantitative biological features, autism diagnoses are currently based on expert assessments of behavioral symptoms, including impaired social skills and communication, repetitive behaviors and restricted...
|
|
Scooped by
Gilbert C FAURE
October 12, 2019 12:54 PM
|
The understanding of migraine pathophysiology is advancing rapidly. Improved characterisation
and diagnosis of its clinical features have led to the view of migraine as a complex,
variable disorder of nervous system function rather than simply a vascular headache.
|
|
Scooped by
Gilbert C FAURE
October 10, 2019 2:04 PM
|
Messy tangles of a protein called tau can be found in the brains of people with Alzheimer's disease and some other neurodegenerative diseases. In Alzheimer's, the tangles coalesce just before tissue damage becomes visible in brain scans and people start to become forgetful and confused.
|
|
Scooped by
Gilbert C FAURE
October 7, 2019 2:39 AM
|
Approximately 15–40% of all cancers develop metastases in the central nervous system (CNS), yet few therapeutic options exist to treat them. Cancer therapies based on monoclonal antibodies are widely successful, yet have limited efficacy against CNS metastases, owing to the low levels of the drug reaching the tumour site. Here, we show that the encapsulation of rituximab within a crosslinked zwitterionic polymer layer leads to the sustained release of rituximab as the crosslinkers are gradually hydrolysed, enhancing the CNS levels of the antibody by approximately tenfold with respect to the administration of naked rituximab. When the nanocapsules were functionalized with CXCL13—the ligand for the chemokine receptor CXCR5, which is frequently found on B-cell lymphoma—a single dose led to improved control of CXCR5-expressing metastases in a murine xenograft model of non-Hodgkin lymphoma, and eliminated lymphoma in a xenografted humanized bone marrow–liver–thymus mouse model. Encapsulation and molecular targeting of therapeutic antibodies could become an option for the treatment of cancers with CNS metastases. The polymer encapsulation of the monoclonal antibody rituximab and the ligand-mediated targeting of metastases in the central nervous system significantly improve antitumour efficacy in mouse models of metastatic non-Hodgkin lymphoma.
|
|
Scooped by
Gilbert C FAURE
September 29, 2019 2:51 PM
|
|
|
Scooped by
Gilbert C FAURE
September 27, 2019 2:40 PM
|
Our brains contain millions of synapses—the connections that transmit messages from neuron to neuron. Within these synapses are hundreds of different proteins, and dysfunction of these proteins can lead to conditions such ...
|
|
|
Scooped by
Gilbert C FAURE
November 16, 2019 11:53 AM
|
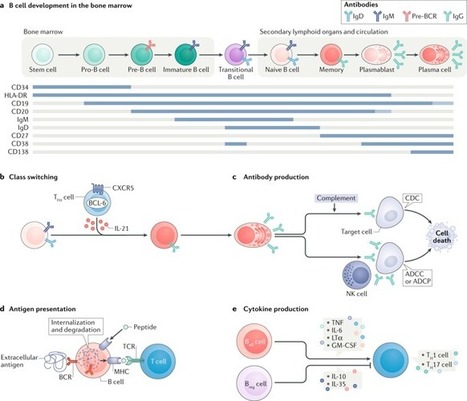
In individuals with inflammation of the central nervous system, B cells enter and accumulate in the cerebrospinal fluid, brain parenchyma and perivascular spaces. Here, Joseph Sabatino and colleagues review the contributions of B cells — both in the periphery and sequestered within the central...
|
|
Scooped by
Gilbert C FAURE
November 16, 2019 11:39 AM
|
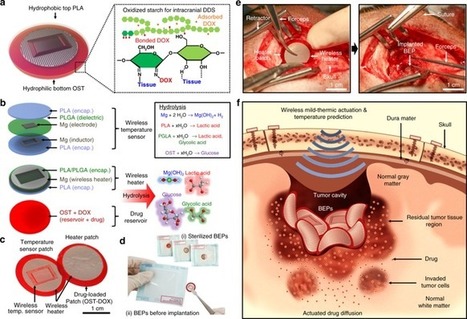
There is a need to further improve the efficacy of biodegradable wafers used in surgically treated brain tumors. Here, the authors report a flexible, biodegradable wireless device capable of adhesion to surgical site for optimal drug delivery upon mild-thermic actuation and report therapeutic...
|
|
Scooped by
Gilbert C FAURE
November 16, 2019 10:18 AM
|
Over 77,000 Canadians are living with multiple sclerosis, a disease whose causes still remain unknown. Presently, they have no hope for a cure. In a study published in Science Translational Medicine, researchers at the University of Montreal Hospital Research Centre (CRCHUM) identify a molecule named ALCAM which, once blocked, delays the progression of the disease. Their results, obtained from in vitro human and in vivo mouse studies, could lead to the development of a new generation of therapies to treat this autoimmune disease.
|
|
Scooped by
Gilbert C FAURE
November 13, 2019 5:04 AM
|
A study shows 40% of SPMS patients in Italy and Germany are not aware of their diagnosis, indicating the need for better patient-physician communication.
|
|
Scooped by
Gilbert C FAURE
November 10, 2019 10:14 AM
|
Experts discuss diagnosing MS in the modern era, and the early identification of the condition.
|
|
Scooped by
Gilbert C FAURE
November 3, 2019 4:11 AM
|
PubMed comprises more than 30 million citations for biomedical literature from MEDLINE, life science journals, and online books. Citations may include links to full-text content from PubMed Central and publisher web sites.
|
|
Scooped by
Gilbert C FAURE
October 21, 2019 6:35 AM
|
For a blood-borne cancer therapeutic agent to be effective, it must cross the blood vessel wall to reach cancer cells in adequate quantities, and it must overcome the resistance conferred by the local microenvironment around cancer cells. The brain microenvironment can thwart the effectiveness of drugs against primary brain tumours as well as brain metastases. In this Review, we highlight the cellular and molecular components of the blood–brain barrier (BBB), a specialized neurovascular unit evolved to maintain brain homeostasis. Tumours are known to compromise the integrity of the BBB, resulting in a vasculature known as the blood–tumour barrier (BTB), which is highly heterogeneous and characterized by numerous distinct features, including non-uniform permeability and active efflux of molecules. We discuss the challenges posed by the BBB and BTB for drug delivery, how multiple cell types dictate BBB function and the role of the BTB in disease progression and treatment. Finally, we highlight emerging molecular, cellular and physical strategies to improve drug delivery across the BBB and BTB and discuss their impact on improving conventional as well as emerging treatments, such as immune checkpoint inhibitors and engineered T cells. A deeper understanding of the BBB and BTB through the application of single-cell sequencing and imaging techniques, and the development of biomarkers of BBB integrity along with systems biology approaches, should enable new personalized treatment strategies for primary brain malignancies and brain metastases. This Review discusses the structure and function of the blood–brain barrier (BBB) and how brain tumours and brain metastases compromise BBB integrity. It also discusses the challenges the BBB poses for cancer therapy and how these might be overcome.
|
|
Scooped by
Gilbert C FAURE
October 18, 2019 4:50 AM
|
This discovery could become new therapeutic targets to use in neurodegenerative diseases such as Parkinson´s and Alzheimer´sCredit: Art work done by Juan Gómez-Andrade) / Universidad de Sevilla Research led by Drs.
|
|
Scooped by
Gilbert C FAURE
October 12, 2019 5:37 AM
|
PubMed comprises more than 30 million citations for biomedical literature from MEDLINE, life science journals, and online books. Citations may include links to full-text content from PubMed Central and publisher web sites.
|
|
Scooped by
Gilbert C FAURE
October 7, 2019 1:02 PM
|
Neurosyphilis Neurosyphilis, the result of invasion of the nervous system by Treponema pallidum, can occur at any time after primary infection and is altered by HIV coinfection. Serologi
|
|
Scooped by
Gilbert C FAURE
October 1, 2019 1:27 PM
|
Research ArticleImmunologyNeuroscience Free access | 10.1172/JCI128475 Early adaptive immune activation detected in monozygotic twins with prodromal multiple sclerosis Eduardo Beltrán,1 Lisa Ann Gerdes,1 Julia Hansen,1 Andrea Flierl-Hecht,1 Stefan Krebs,2 Helmut Blum,2 Birgit Ertl-Wagner,3,4 Frederik Barkhof,5,6 Tania Kümpfel,1 Reinhard Hohlfeld,1,7 and Klaus Dornmair1,7 First published September 30, 2019 - More info Abstract Multiple sclerosis (MS) is a disabling disease of the CNS. Inflammatory features of MS include lymphocyte accumulations in the CNS and cerebrospinal fluid (CSF). The preclinical events leading to established MS are still enigmatic. Here we compared gene expression patterns of CSF cells from MS-discordant monozygotic twin pairs. Six “healthy” co-twins, who carry a maximal familial risk for developing MS, showed subclinical neuroinflammation (SCNI) with small MRI lesions. Four of these subjects had oligoclonal bands (OCBs). By single-cell RNA sequencing of 2752 CSF cells, we identified clonally expanded CD8+ T cells, plasmablasts, and, to a lesser extent, CD4+ T cells not only from MS patients but also from subjects with SCNI. In contrast to nonexpanded T cells, clonally expanded T cells showed characteristics of activated tissue-resident memory T (TRM) cells. The TRM-like phenotype was detectable already in cells from SCNI subjects but more pronounced in cells from patients with definite MS. Expanded plasmablast clones were detected only in MS and SCNI subjects with OCBs. Our data provide evidence for very early concomitant activation of 3 components of the adaptive immune system in MS, with a notable contribution of clonally expanded TRM-like CD8+ cells. Graphical Abstract Introduction Multiple sclerosis (MS) is the most frequent inflammatory disease of the central nervous system (CNS). A variety of lymphocyte subtypes invade the brain parenchyma, where they sustain chronic inflammation and contribute to characteristic lesion formation. The current concepts of MS pathogenesis and treatment have been mainly shaped by autoimmune animal models, with a strong emphasis on autoreactive CD4+ T effector lymphocytes (1–4). In contrast to animal models, it has been difficult to investigate the early phase of the disease process in humans, because the diagnosis of MS requires the occurrence of a first clinical episode, which is known to be preceded by an undetermined period of subclinical neuroinflammation. It has therefore been very difficult to distinguish between early, potentially primary, and later, potentially secondary, immunological mechanisms. Here we took a 2-pronged approach to investigate the earliest identifiable stages of MS, which we refer to as subclinical neuroinflammation (SCNI), in familially predisposed subjects. First, we identified a small cohort of monozygotic twins in whom one sibling has clinically definite MS and the other is clinically “healthy” but has MRI and/or immunological evidence for SCNI. Second, we applied single-cell whole transcriptome sequencing (scRNA-Seq) to analyze cerebrospinal fluid (CSF) samples from MS-discordant twin pairs and controls. In contrast to traditional flow cytometry, which is restricted to very limited panels of antibodies against preselected markers, this technology gives an unbiased overview of expression patterns of thousands of genes expressed in each single cell at the time of lumbar puncture. This technology offers novel insights into the complexities of the human immune system and of disease-relevant cell populations (5, 6). We found that clonal expansions of CD8+ T cells, B cells, and CD4+ T cells are conspicuous even in the prodromal stage of MS in familially predisposed subjects. Strikingly, the majority of clonal expansions occur in the CD8+ T cell compartment. In direct comparison with nonexpanded CD8+ T cells, the clonally expanded CD8+ T cells show distinct signs of acute activation, express an array of cytotoxic effector molecules, and phenotypically resemble tissue-resident memory T (TRM) cells (7, 8). This pattern was most pronounced in subjects with definite MS, less pronounced but detectable in subjects with SCNI, and absent in healthy controls and nonexpanded cells from all subjects. In the CD4+ compartment, a few clonal expansions are present, which also display an activated phenotype. Furthermore, the presence of clonally expanded B cells in the plasmablast cluster is strictly correlated with the presence of oligoclonal immunoglobulin bands (OCBs). Viewed together, our findings demonstrate that even the earliest experimentally approachable stage of MS is characterized by a synergistic activation of the main components of the adaptive immune system, with a striking contribution of recently activated, clonally expanded CD8+ T cells with a TRM phenotype. Results Landscape of lymphocytes analyzed by scRNA-Seq. To obtain an overview of the different lymphocyte populations, we isolated single lymphocytes by flow cytometry, determined their transcriptomes by scRNA-Seq, and applied dimensional reduction analysis (t-distributed stochastic neighbor embedding [t-SNE]) to the gene expression data (see Figure 1A for workflow). Altogether, we analyzed 3084 single lymphocyte cells from 16 subjects (Figure 1B and Table 1). We spiked 2752 CSF cells with 332 cells from peripheral blood, since blood cells are well characterized; these cells served as “guideposts” to initially match the unbiased clustering to known immune cell types. In all subsequent analyses, blood cells were excluded from the data set. Throughout, we used conditions that allowed us to identify distinct T and B cell clones according to their matching T and B cell antigen receptor (TCR, BCR) chains (Figure 1A). After combining the gene markers for each individual cluster identified through unbiased clustering with the flow cytometry data, we grouped the cells into several clusters designated T cell cluster I, T cell cluster II, plasmablasts, B cells, plasmacytoid dendritic cells (pDCs), all other subfamilies of dendritic cells (DCs), monocytes, and natural killer (NK) cells (Figure 1B and Supplemental Table 1). Further, CD4+ and CD8+ T cells were identified by the presence of at least one TCR chain as identified by scRNA-Seq. It should be noted that the absolute numbers of CD4+ cells do not reflect the relative proportion of sorted (analyzed) cells present in the original CSF samples (see legend to Figure 1A). Figure 1 Cellular composition of lymphocytes upon analysis by scRNA-Seq. (A) Flowchart of the analysis of human CSF by scRNA-Seq. Because CD4+ cells make up the majority of CSF cells, they were collected by magnetic beads and single CD4+ cells were isolated by flow cytometry. The remaining non-CD4+ cells were separately isolated by single-cell index sorting using different markers. Thus, the ratio of CD4+ and non-CD4+ cell numbers does not reflect the ratio of absolute cell numbers in the CSF samples. Nevertheless, ratios and cell numbers within the non-CD4+ populations are comparable. Whole transcriptomes of each single cell were determined by next-generation sequencing (NGS) with a read length of 2 × 150 bp that allows identification of the hypervariable regions of TCRs and BCRs together with their corresponding V families. Thus, not only transcriptome profiles of each single cell are determined, but also matching α:β TCR and H:L BCR chains. This allows tracking of distinct clones. (B) t-SNE projection of transcriptome data from 2752 single CSF cells and 332 PBMCs from 16 patients, profiled in 9 main clusters. For better visualization, background areas were shaded manually to indicate major cell populations, although some cells will appear in “foreign” areas. Each dot corresponds to one single cell, colored according to the respective cell cluster. DCs, pDCs, and monocytes were not specifically labeled during flow cytometry analyses; therefore up to 6 transcripts were used as discriminators and are listed next to each cluster. (C) Heatmap showing normalized mean expression levels of discriminative gene sets for T cell cluster I CD4+ (lane 1) and CD8+ cells (lane 2), and cluster II CD4+ (lane 3) and CD8+ cells (lane 4). (D) t-SNE projection of all index-sorted CD8+ T cells. (E) t-SNE projection of all index-sorted CD4+ T cells. Table 1 Clinical characteristics of all subjects We then compared the expression profiles of genes that discriminate T cell clusters I and II (Figure 1C). The heatmap and corresponding t-SNE projections (Figure 1, D and E) show that T cell cluster I mainly (but not exclusively) contains CD4+ T cells, whereas T cell cluster II mainly contains CD8+ T cells. In each cluster, the dominant population expresses a characteristic panel of lead transcripts (e.g., IL-7 receptor in CD4+ T cells or cytotoxic molecules [granzymes] in CD8+ T cells). Further, each cluster contains a subpopulation of the nondominant phenotype (CD8+ cells in cluster I, CD4+ cells in cluster II). High levels of the chemokine receptor CCR7 and the cell adhesion molecule SELL confirm that cells profiled in T cell cluster I (mostly CD4+) have a central memory (TCM) phenotype (9). In contrast, the mRNA profiles of discriminative genes of T cell cluster II (mostly CD8+) suggest an effector/cytotoxic phenotype. In Figure 1, D and E, TCR+ cells are displayed in accordance with their flow cytometry information as CD8+ or CD4+ T cells. Composition of CSF cell populations from SCNI, MS, and control subjects. Based on the overall cellular landscape determined by scRNA-Seq (Figure 1B), we compared the cellular distribution of CSF samples from 4 different groups of subjects: SCNI (n = 6), clinically definite MS (MS; n = 4), noninflammatory controls (NIC; n = 4), and autoimmune encephalitis (Enc; n = 2) (Figure 2, A–D, and Table 1). Our study cohort included 8 pairs of MS-discordant monozygotic twins. We were able to obtain CSF samples from all 8 clinically “healthy” co-twins, and from 4 of the MS-affected co-twins (Table 1). Among the 8 clinically healthy co-twins (who have a maximally high familial risk of developing MS), 6 subjects showed MRI evidence for SCNI. In addition, 4 of the 6 had OCBs (Table 1). None of the healthy co-twins had ever been treated with an immunosuppressive or immunomodulatory drug. Figure 2 Cellular composition of CSF samples in different disease stages of MS and controls. t-SNE projections of CSF samples from subjects with NIC (A), SCNI (B), MS (C), and Enc (D). Clusters were defined as in Figure 1B but blood cells were removed. CD4+ and CD8+ T cells are colored according to the index-sorting information obtained by flow cytometry. As seen in Figure 2, A–D, all groups show considerable similarities in the overall cellular distribution. In all groups, T cells contribute the majority of cells, and the distribution between T cell clusters I and II is preserved. B cells were also detectable in all groups, and plasmablasts were only missing in the NIC group. Notably, plasmablasts were already present in SCNI. When analyzing individual SCNI patients (Table 1), we found that plasmablasts were detected only in subjects who had OCBs. Further, we found increased numbers of DCs and pDCs not only in MS but also in SCNI. These results show that t-SNE projections do not distinguish different stages of disease, except for the presence of plasmablasts, which are strictly correlated with OCBs and are already a distinct feature of subjects with SCNI. Clonal expansions of T cells and plasmablasts. In addition to clustering CSF cells according to their genome-wide expression profiles, our approach provides information about the antigen-specific, paired α:β TCR and H:L BCR chains expressed by individual lymphocytes. This enabled us to detect clonal B and T cell expansions in clusters containing B or T cells in the t-SNE projections (Figure 3, A and B). Strong clonal expansions were detectable in the plasmablast cluster of MS, where 90% of all clones were expanded, but also in SCNI, where 20% were expanded. Expanded CD4+ and CD8+ clones were found predominantly in T cell cluster II. The numbers of identified nonexpanded and expanded T cell clones are listed in Table 2. Strong clonal expansions were also found in the CD8+ T cell population of all inflammatory cases (SCNI, MS, Enc), whereas lower percentages of expansions were observed in the CD4+ population. For example, 29% of all CD8+ but only 9% of all CD4+ T cells from MS patients belonged to expanded clones, and a similar preponderance of expanded CD8+ cells was seen in SCNI and Enc (Table 2). Note that the ratios of expanded versus nonexpanded cells are given in percent independently for CD4+ and CD8+ cells. They are therefore not related to the absolute cell numbers or to CD4/CD8 ratios. Regarding the distribution of expanded T cells between clusters I and II, most CD8+ clones from SCNI subjects tended to group in the upper right region of cluster II, whereas clones from MS patients were found predominantly in the lower right and central right region (Figure 4, A and B). A similarly uneven distribution is seen for CD4+ clones. Comparison of TCR sequences of CSF-resident CD8+ T cells with sequences of corresponding memory and naive CD8+ T cells from peripheral blood revealed clonal overlaps of expanded clones preferentially in SCNI and healthy subjects, whereas fewer overlaps were observed in MS patients (Supplemental Figure 1; supplemental material available online with this article; https://doi.org/10.1172/JCI128475DS1). Whether these differences represent statistical fluctuations or systematic differences of phenotypic properties remains to be determined in future investigations with larger numbers of patients and cells. Taken together, clonal expansions occur in all cellular compartments of adaptive immunity, namely B cells, CD8+ T cells, and, to a lesser extent, CD4+ T cells. In particular, such clonal expansions are a consistent and conspicuous feature observed in subjects with SCNI. Figure 3 Analysis of clonally expanded lymphocyte cells. t-SNE projection of all CSF cells where either CD4+ (A) or CD8+ (B) cells were removed. Cells of the adaptive immune system with at least 1 detectable TCR or BCR chain are shown in light reddish color. Cells of the innate immune system are shown in gray. Expanded clones, i.e., T and B cells that express identical α:β TCR or H:L BCR chains, are highlighted in dark red for CD8+ T cells, blue for CD4+ T cells, and green for B cells. Dot sizes correlate with clonal frequencies: normal-sized dots indicate that the clone was found 2 times; larger dots indicate that it was found 3 or more times. Figure 4 Analysis of clonally expanded T cells in SCNI and MS. t-SNE projection of all CD8+ and CD4+ T cells from subjects with SCNI (A) and MS (B). Expanded T cell clones that express identical α:β TCR are highlighted in dark red for CD8+ T cells and blue for CD4+ T cells. Dot sizes correlate with clonal frequencies: normal-sized dots indicate that the clone was found 2 times; larger dots indicate that it was found 3 or more times. Table 2 Numbers of identified nonexpanded and expanded T cell clones Differentially regulated transcripts in expanded versus nonexpanded T cell clones. Clonal expansion is usually interpreted as evidence for pathogenic relevance of the expanded lymphocyte clones. Therefore, we compared normalized expression levels of differentially expressed genes related to T cell egress, tissue retention, inhibition, transcription factors, cytokines, and migration and activation of expanded and nonexpanded CD8+ T cell clones (Figure 5). The top panel of this heatmap shows expression of homing receptors and molecules involved in T cell egress, including CCR7, SELL (CD62L), TCF7 (TCF-1), and S1PR1. These markers are gradually downregulated from NIC, via nonexpanded cells from SCNI and MS subjects, to expanded clones from SCNI and MS subjects. In the latter case, all markers are downregulated, indicating a fully established TRM phenotype (10–12). Figure 5 Heatmap of gene expression levels of selected function-associated genes in CD8+ T cells. CD8+ T cells were selected based on flow cytometry staining for CD8 and presence of at least one TCR chain as determined by next-generation sequencing. Gene expression of 25 marker genes for homing, migration, and activation is shown for nonexpanded CD8+ T cells and expanded CD8+ T cell clones from SCNI, MS, and Enc subjects. No distinction is made for NIC, as the number of expanded clones is too low. Color scheme is based on Z score distribution from –2.5 (blue) to 2.5 (red). In addition, CD69 (second panel), which has been postulated as a marker of TRM as well as being an early activation marker (13, 14), is upregulated in the MS expanded CD8+ T cell clones but not in SCNI. Consistently, other tissue retention molecules, i.e., ITGAE (CD103), ITGA1 (CD49a), and CRTAM, which play an important role in TRM development (14), are upregulated in MS as compared with SCNI, but no significant differences are seen between expanded and nonexpanded clones. Typical TRM gene signatures also include upregulation of inhibitors of T cell activation, including PDCD1 (PD-1), CD101, CTLA4 (third panel), and increased expression of CXCR6 (bottom panel), a recently identified key marker of TRM cells (14). Strikingly, our data again show upregulation of these molecules in the expanded CD8+ T cell population in MS but not in SCNI subjects. Further, this expression profile is consistent with upregulation of the key regulator of the universal TRM transcriptional program ZNF683 (Hobit), which causes downregulation of KLF2 (fourth panel) (15, 16), and finally downregulation of the egress-related transcripts. Such a pattern is not seen explicitly in SCNI. The cytokine expression panel (fifth panel) resembles TRM characteristics in expanded CD8+ clones from MS patients and additional signs of T cell activation as indicated by GZMH, high levels of CXCR6 and CCR5, and proinflammatory cytokines including IFNG and IL-2 (10, 14, 17). Other activation and migration markers, such as SLAMF7, FCRL6, ADGRE5 (CD97) (bottom panel), and HLA class II, were also upregulated in CD8+ T cells from MS patients. In SCNI, no increases or only minor increases of these markers were seen. Similar, though not as concise, patterns are detected by comparison of expanded and nonexpanded CD4+ T cell clones (Supplemental Figure 2). As seen for CD8+ T cells, the bias toward TRM increases from NIC via SCNI to expanded clones in MS. Together, these findings indicate that expanded and nonexpanded T cell clones display different expression profiles. Markers for T cell egress, tissue retention, and inhibition together with the cytokine pattern suggest a TRM phenotype in expanded T cell clones from MS patients, particularly in the CD8 compartment. In MS, the expanded CD8+ T cells express markers of cellular activation and cytotoxic activity. Conspicuous clonal expansions are also present in SCNI, but — compared with MS — they show a less distinct phenotype and activation profile. Recruitment of expanded TRM CD8+ cells into the CSF of MS patients. Because heatmaps only show average values of all cells, we next analyzed the strong downregulation of S1PR1 and upregulation of CXCR6 in single expanded TRM CD8+ cells from different subject groups by violin plots (Figure 6, A and B). S1PR1 is significantly downregulated only in expanded CD8+ cells from MS patients, and CXCR6 is upregulated only in expanded cells from MS and Enc patients. CXCR6 is the sole receptor for CXCL16, which can mediate lymphocyte recruitment, in particular of CD8+ T cells, and is induced by the proinflammatory cytokine IFNG (18). Here we found significant upregulation of CXCL16 in DCs and monocytes (Figure 6C) from all subject groups (Figure 6D). Notably, IFNG is also strongly upregulated in expanded CD8+ T cells of MS (Figure 5), whereas it is not upregulated in all other subject groups, including SCNI. Taken together, these findings indicate that the CXCR6-CXCL16 axis may be involved in the recruitment and maintenance of clonally expanded CD8+ T cells in the CSF of MS patients. Figure 6 Violin plots show gene expression of CD8+ T cells on the single-cell level. Each dot represents a single cell. Statistically significant gene expression is observed only if a violin-shaped fitting area can be calculated. (A) The homing marker S1PR1 is expressed on all T cells but is downregulated when a cell adopts a TRM phenotype. This is only the case for expanded CD8+ T cells from MS patients. (B) The TRM marker CXCR6 is upregulated only in expanded CD8+ T cells from MS and Enc patients. (C) The marker CXCL16 is the sole ligand of CXCR6. It is upregulated only in DCs and monocytes. (D) CXCL16 is expressed in DCs (left panel) and monocytes (right panel) from all patient groups. Comparison of clonal expansions within monozygotic, MS-discordant twin pairs. We were able to obtain CSF from 4 MS-discordant twin pairs (Table 1). This allowed us to compare different disease conditions on a genetically identical background. Thus, in contrast to Figure 5, where data from all subjects were analyzed together, we now compared distinct twin pairs. In 2 twin pairs, the clinically unaffected twin had SCNI (Figure 7 and Supplemental Figure 3), whereas in the 2 other pairs, the clinically unaffected twin had no evidence of subclinical inflammation (NIC; Supplemental Figures 4 and 5). Thus, we compared the gene expression pattern of CD8+ T cells individually for each pair: AR-MS versus AR-H, who later developed radiologically isolated syndrome, i.e., MRI-based evidence for dissemination in space (Figure 7); AU-MS versus AU-H (Supplemental Figure 3); AV-MS versus AV-H (healthy) (Supplemental Figure 4); and BJ-MS versus BJ-H (Supplemental Figure 5). The individual gene expression patterns fit to the average patterns shown in Figure 5 with signatures of TRM cells, expression of a panel of cytotoxic molecules, higher proinflammatory marker cytokines, and markers of activation including MHC class II. These patterns are particularly pronounced in expanded CD8+ T cells from MS patients as compared with nonexpanded cells, and with SCNI or healthy twins. This is remarkable since all MS patients received different medication (Table 1). The only exception is pair BJ-MS, BJ-H (Supplemental Figure 5), in whom the pattern of the teriflunomide-treated MS patient BJ-MS differs from those of all other probands. Together, these findings in genetically identical, yet disease-discordant twins support the notion that clonal activation and expansion, particularly of CD8+ T cells, is a distinct, very early event in the chain of pathogenic events leading from prodromal SCNI to clinically manifest MS. Figure 7 Heatmap of gene expression levels of nonexpanded and expanded CD8+ T cells from 1 monozygotic twin pair. Expression levels of the same genes as in Figure 5 are shown for the twin pair AR-H and AR-MS. Discussion Here we investigated early cellular CSF profiles in the prodromal stage of MS in subjects with a maximally high familial risk of developing clinically manifest MS. We identified 8 subjects who were clinically unaffected but had an identical twin sibling who had clinically definite MS. Only 2 of them did not show any evidence of latent neuroinflammation, whereas 6 showed MRI signs of SCNI and 4 additionally showed OCBs. This allowed us to investigate SCNI using freshly isolated CSF cells for index sorting and subsequent scRNA-Seq, including identification of clonally distributed B and T cell antigen receptor chains at the single-cell level. Compared with traditional approaches that often focus on particular, predefined subsets and lineages of lymphocytes, scRNA-Seq provides an unbiased overview and therefore offers novel insights into the complexity of human (auto)immune reactions. SCNI as defined here is not identical with conventional radiologically isolated syndrome (RIS). The concept of RIS is based on radiological criteria that have changed over time. According to the most recent criteria, the diagnosis of RIS requires at least 1 MRI lesion in at least 2 predefined areas (19, 20). As RIS is usually discovered by chance, strict radiological criteria are required in order to distinguish neuroinflammatory MRI changes from those commonly observed in other conditions like migraine or ischemia. Rather than relying on chance detection, in our study we searched for SCNI in a cohort of subjects who had a maximal familial risk of developing MS. In this way we identified 6 clinically “healthy” co-twins who showed small MRI lesions (Table 1). It is noteworthy that these subjects represent a spectrum of SCNI changes (Table 1): two (AR-H and BF-H; Table 1) fulfilled the current RIS criteria of dissemination in space, whereas the other 4 SCNI subjects, 2 of whom had positive OCBs, did not fulfill the current RIS criteria and thus may be considered “pre-RIS.” Indeed, one of the SCNI subjects (AR-H) meanwhile showed MRI evidence for dissemination in time (Table 1). Like conventional RIS, SCNI may be regarded as an early stage in the pathogenesis of MS, although it is impossible to know exactly when lesion initiation started. One of the most conspicuous features we observed in our t-SNE projections of CSF cells from subjects with SCNI was the early and consistent presence of clonally expanded, activated CD8+ T cells. CD8+ cells have long been implicated in the pathogenesis of human MS because they predominate in MS brain lesions and show signs of clonal expansion, persistence, and pervasiveness, all of which support their pathogenic relevance (3, 21–28). However, CD8+ T cells have not been extensively studied in animal models, and therefore, they do not play a prominent role in the CD4+ T cell–centered scenario derived from classical experimental autoimmune encephalomyelitis models (29). Indeed, it has been argued that the CD8+ predominance in MS lesions might reflect the recruitment of bystander cells, and therefore a secondary event in the pathogenesis. Our findings strongly support the notion that clonal activation and expansion of CD8+ T cells represent crucial, early steps in the disease process. We identified striking differences between expanded and nonexpanded CD8+ T cell clones. Regarding nonexpanded T cell clones, we did not observe much variation between NIC, SCNI, MS, and Enc subjects in the t-SNE projections. Slight differences were seen when we analyzed specific homing, migration, and activation markers. In striking contrast, we observed major alterations in t-SNE projections and markers when we analyzed clonally expanded T cells, which were detected in all subjects with neuroinflammation, although to a different extent. Thus, the percentages of expanded clones as compared with nonexpanded clones were about 2-fold higher in MS and Enc than in SCNI, and higher in SCNI than in NIC. In all conditions, CD8+ T cell expansions were more frequent than CD4+ expansions. In both populations, however, there were subtle differences between SCNI and MS in the t-SNE projections of the expanded clones, indicating altered cellular phenotypes. Because dimensional reductions were calculated on thousands of highly diverse genes, the resulting clusters may not reflect the classical lineages that are defined by a few selected markers. Gene expression analysis of markers related to migration, homing, and activation of CD8+ T cells revealed that expression of egress markers (S1PR1, CCR7, SELL, TCF7) was normal in NIC but strongly downregulated in expanded CD8+ TRM cell clones from MS patients. In nonexpanded MS cells, they were weakly downregulated, suggesting that this population is sensing the inflammatory milieu and is possibly “on the road” to adopting a TRM phenotype. The expression levels of egress markers in SCNI reveal that nonexpanded CD8+ T cells are indistinguishable from NIC cells. Strikingly, expanded CD8+ T cells from SCNI, though fewer in number than expanded CD8+ T cells from MS, downregulated CCR7 and SELL and upregulated proinflammatory cytokines, indicating that they are in transition to an effector phenotype. This is also reflected by different positions in the t-SNE projections (Figure 4, A and B). Comparison of egress markers and t-SNE projections therefore illustrates the gradual transition from a TCM to an effector phenotype, moving from NIC and nonexpanded SCNI to expanded T cell SCNI and nonexpanded MS, to a fully established TRM phenotype of CD8+ T cells in definite MS. This interpretation is supported by the gradual upregulation of inhibition and retention markers (such as PDCD1 or CD69), cytokines, and activation markers (such as IFNG or CXCR6), moving from NIC and nonexpanded SCNI, to expanded SCNI and nonexpanded MS, and finally to definite MS. This pattern is compatible with a phenotype change of CD8+ T cells from TCM to TRM during the course of the disease. Four of the six SCNI subjects had positive CSF OCBs. This is in agreement with numerous previous reports that OCBs represent an early immunological marker of neuroinflammation and indeed serve as a prognostic marker in subjects with RIS (30). The presence of OCBs was strictly correlated with the presence and expansion of plasmablasts in our t-SNE projection. This is consistent with previous observations that plasmablasts are characteristic components of the B cell compartment in MS CSF (31, 32), and supports our previous observation that intrathecal B cells are a cellular source of OCBs (33), which at least in some cases were shown to be involved in removal of debris from cells that died by prior events (34). Together, our data suggest that deleterious inflammatory events may already be ongoing at a cryptic stage of the disease, possibly even earlier than the SCNI stage investigated here. Extensive analyses of intrathecal B cell clonal pedigrees suggested an ongoing intrathecal antigen-driven B cell maturation process in MS, including immunoglobulin class switching and somatic hypermutation (35–37). These processes likely depend on help by CD4+ T cells. However, our scRNA-Seq analyses of CSF CD4+ T cells did not reveal any distinct signatures of known CD4+ T cell lineages such as T follicular helper cells, regulatory T cells, Th1, Th2, or Th17 effector cells, which are usually defined by flow cytometry. This by no means implies that CD4+ T cells are not crucially involved. However, with the introduction of scRNA-Seq, the borders between traditional cell lineages are beginning to blur, and an unexpected complexity and dynamic nature of the cellular immune system are beginning to emerge (38, 39). A still unanswered key question in MS pathogenesis is how putatively autoreactive lymphocytes are recruited to the CNS and which target cells they communicate with. It has long been known that T cells survey the brain parenchyma also in noninflammatory conditions (40), and recently it has been shown that many of them are TRM cells (41). Here we found that expanded CD8+ T cells from MS and Enc patients strongly upregulated CXCR6. CXCR6 has been implicated in various human diseases (17, 42–44), and notably, it has a significant role in recruiting activated CD8+, but not CD4+, T cells, under pathological conditions (42, 43). Its only ligand is CXCL16. Strikingly, we detected highly elevated levels of CXCL16 transcription in monocytes and DCs in the CSF. For CD4+ T cells, we also observed upregulation of CXCR6 predominantly in expanded clones of SCNI and MS subjects. This might also be triggered by mononuclear phagocytes and/or DCs serving as antigen-presenting cells. Consistent with earlier reports (45, 46), we observed DCs and pDCs already in the CSF of NIC with a marked predominance of myeloid DCs over pDCs, but cell numbers were significantly increased in the CSF of patients with neuroinflammatory diseases, such as MS. This is not yet an ultimate proof of a functional interaction of CD8+ T cells with mononuclear phagocytes and/or DCs, but it may trigger further investigations. An obvious limitation of our study is the small sample size. For example, we did not include subjects with clinically isolated syndrome because they are usually sampled in close relation to clinical activity. In our study, all subjects were sampled outside clinical activity, as this could turn out to be a significant confounding factor that hampers comparability of data and needs to be addressed in future studies with larger cohorts. The same applies to the potential confounding effects of various MS treatments. In contrast to the subjects with SCNI, who had never been exposed to any immunomodulatory therapy, the group of MS patients was heterogeneous with regard to treatment. Surprisingly, however, there were no significant differences in the overall CSF cell populations, clonal expansions, and gene expression levels of the MS patients irrespective of their diverse treatments. The only significant deviation from the reasonably conserved overall expression pattern was seen in MS patient BJ-MS, who was under teriflunomide treatment, which inhibits lymphocyte proliferation and therefore changes gene expression patterns and phenotypes. Obviously, these treatment-related initial findings need validation in larger cohorts. Our results provide a first glimpse into the complexity of CSF cells at a very early stage of neuroinflammation as it occurs in clinically healthy subjects who are at a maximally high familial risk because they have a monozygotic co-twin affected by MS. In these subjects, we observed evidence for early involvement of the major components of the adaptive immune system, B cells, CD4+ T cells, and CD8+ T cells. Both in SCNI and in MS, conspicuous changes were observed in clonally expanded CD8+ T cells, though these changes were more pronounced in MS than in SCNI. The observed alterations in gene expression levels suggest that activation and clonal expansion of CD8+ T cells are not just a late epiphenomenon but rather reflect early mechanisms of MS pathogenesis. Expanded CD8+ T cell clones show a TRM phenotype and may be assumed to relate directly to disease progression as seen in tumors and infections (7, 8, 10). It is tempting to speculate that expanded CD8+ clones might also play a major role in CNS lesions, where they are the dominant lymphocyte population, persist, and are shared between CNS and CSF (22–27). Although our cohort is small and should be enlarged for drawing final conclusions, our results underline the need to study antigens and communication partners of intrathecally expanded CD8+ T cell clones in much greater detail. These results have implications not only for the pathogenesis but also for the therapy of MS. Methods Study subjects and procedures. Twins were recruited in Germany. Inclusion criteria for study participation were met for monozygotic twins with an MS diagnosis according to the revised McDonald criteria (20). Monozygotic twin pairs with clinical discordance for MS visited the outpatient department at the Institute of Clinical Neuroimmunology, Munich, for a detailed interview, neurological examination, MRI investigations, and optional CSF sampling. Twins either volunteered for CSF sampling or were specifically offered CSF sampling if suspicious lesions were detected on MRI. For inclusion in the present analysis, CSF samples had to be available of either both co-twins or the clinically healthy co-twin only, resulting in 4 monozygotic twin pairs and 4 additional clinically healthy co-twins with signs of SCNI in MRI and/or CSF. Zygosity was confirmed by genotyping of 17 highly polymorphic microsatellite markers and by next-generation sequencing of 33 SNPs. CSF samples from control subjects with encephalitis (Enc) and noninflammatory controls (NIC) were provided during routine diagnostic testing or serial CSF collection to treat idiopathic intracranial hypertension. All twins underwent MR imaging on a 3 Tesla MR scanner (Magnetom Skyra, Siemens Healthineers) using a 20-channel phased-array head and neck coil. The sequence protocol included a 3D-FLAIR (TI 1800 ms, TR 5000 ms, TE 388 ms, flip angle 90°; 1.0 mm3 isotropic voxels) and a 3D T1-weighted sequence using a 3D magnetization-prepared rapid-acquisition gradient-echo (MP-RAGE) sequence (TR 1600 ms, TE 2.15 ms, flip angle 9°; 1.0 mm3 isotropic voxels). Flow cytometry single-cell index sorting. Fresh CSF and blood samples were processed within 1 hour after collection. CSF samples (3–6 mL) were centrifuged at 300 g for 10 minutes and CD4+ cells isolated using the EasySep human CD4 Positive Selection Kit II (STEMCELL Technologies) according to the manufacturer’s instructions. In parallel, non-CD4+ cells were stained for the following lymphocyte cell surface markers: CD3 (eBioscience, clone OKT3; diluted 1:50), CD8 (BioLegend, clone SK1; diluted at 1:50), CD56 (BioLegend, clone HCD56; diluted 1:40), CD19 (BioLegend, clone HIB19; diluted at 1:40), CD27 (BioLegend, clone O323; diluted 1:40), CD38 (eBioscience, clone HB7; diluted 1:40), and Fc receptor blocking (Miltenyi Biotec) in a total volume of 100 μL PBS with 2% FBS. After incubation for 30 minutes at 4°C, both CD4+ and non-CD4+ cells were washed twice, resuspended in 300 μL of the above buffer, and single-cell-sorted using a FACSAria Fusion (BD Biosciences) sorter. Single cells were sorted only according to their forward and side scatter properties, and no further gates were used to keep the ratios between all non-CD4+ cells unchanged. Cells were sorted into lysis buffer in 96-well plates using index sorting. Index sorting enabled us to sort all single cells while retaining the complete phenotype of every single cell sorted into the plate. For profiling of blood lymphocytes, PBMCs were isolated using Ficoll-Paque density gradient centrifugation. Single-cell suspensions were stained using the same markers as described above for CD8+ cells plus anti-CD4 (BioLegend, clone SK3; diluted 1:25). Then, single CD4+ T cells (CD3+CD4+), CD8+ T cells (CD3+CD8+), B cells (CD3–CD19+), and CD3–CD19– cells were sorted into 96-well plates. scRNA-Seq. The Smart-Seq2 protocol was performed on sorted single cells as described previously (47), with minor modifications. Briefly, PCR preamplification products were purified using Ampure XP beads in a 0.6:1 ratio. For the tagmentation reaction (48), 0.8 ng DNA was used as input. Then, PCR purification was carried out using Ampure XP beads in a 0.75:1 ratio. Multiplex sequencing of 96 single-cell libraries was performed on a Hiseq 1500 lane in 150-bp paired-end mode, giving an average sequence depth of 2 million reads per cell. A total of 3362 CSF cells and 384 PMBCs were sequenced, and 2752 and 332 passed quality control. scRNA-Seq raw data were deposited in the NCBI’s Sequence Read Archive database (SRA), and processed gene expression data can be accessed from the Gene Expression Omnibus (GEO) database under accession numbers SRP180896 and GSE127969. scRNA-Seq data analyses. Short sequencing reads were aligned to the UCSC hg38 transcriptome using HISAT2. These alignments were used as input in featureCounts to count mapped reads in all samples. As quality control steps, we removed transcripts detected in fewer than 3 cells and kept only cells with 200 to 6000 detected transcripts. Further, we disregarded cells in which the proportion of mitochondrial transcripts was higher than 5%. Following visual inspection, we further discarded cells located in a cluster characterized by mitochondrial and ribosomal gene expression. Transcripts per million (TPM) data were log-transformed [log(TPM+1)] for all downstream analyses. Detection of highly variable genes, unbiased graph-based clustering of single-cell data, and identification of markers for each cluster were performed with Seurat (49). See Supplemental Methods (online) for more details, including the Seurat R script used to analyze the single-cell data. In addition, scRNA-Seq data were aligned to the TCR and Ig genes. The sorted reads were subjected to MiGEC-CdrBlast (https://migec.readthedocs.io) for extraction of TCR and Ig chains, leading to the identification of CDR3 sequences of TCR and BCR chains. To compare single–T cell repertoires from CSF with T cells from peripheral blood, we analyzed the TCR repertoire of T cells present in 14 mL blood collected into EDTA containing tubes as described previously (50). Statistics. The χ2 test was used to assess the differences in size of both nonexpanded and expanded T cells in each of the study groups. A P value less than 0.05 was considered statistically significant. Study approval. The study was approved by the local ethics committee of the Ludwig Maximilian University of Munich, and all participants gave written informed consent, according to the principles of the Declaration of Helsinki. Author contributions EB, LAG, and JH share first authorship. EB and LAG both contributed to study design and, as EB also performed bioinformatics analysis, analyzed data and contributed to writing, he is listed first. See below for more detailed contributions. EB, LAG, RH, and KD designed the study and experiments. EB and JH performed flow cytometry experiments, PCR, and sample preparation for next-generation sequencing analysis. SK and HB performed Illumina next-generation sequencing. EB performed bioinformatics analysis. LAG, AFH, FB, TK, and RH characterized and contributed patients’ samples. BEW performed MRI examinations and analyzed data. KD, RH, and EB analyzed data and wrote the manuscript with contributions of all other authors. All authors reviewed and approved the manuscript. Supplemental material View Supplemental data Acknowledgments We are grateful to all subjects who participated in this study. We thank Edgar Meinl and Naoto Kawakami for comments on the manuscript, Nicolaus König for valuable support, and Katja Anslinger for zygosity determination, and acknowledge the Core Facility Flow Cytometry unit at the Biomedical Center, Ludwig Maximilian University of Munich, for providing equipment. The study was supported by the German Research Council through CRC128-A5, DO 420/3-1 DACH, the Munich Cluster for Systems Neurology (SyNergy), the Dr. Leopold and Carmen Ellinger Foundation, the Gemeinnützige Hertie Stiftung, the national division of the German MS Society (DMSG), the Bavarian Association of the German MS society (DMSG-Landesverband Bayern), the Federal Ministry of Education and Research (BMBF) organization Krankheitsbezogenes Kompetenznetz Multiple Sklerose, and the association Verein zur Therapieforschung für MS Kranke e.V. FB is supported by the National Institute for Health Research Biomedical Research Centre at University of College London Hospitals. Footnotes Conflict of interest: The authors have declared that no conflict of interest exists. Copyright: © 2019, American Society for Clinical Investigation. Reference information: J Clin Invest. https://doi.org/10.1172/JCI128475. References Dendrou CA, Fugger L. Immunomodulation in multiple sclerosis: promises and pitfalls. Curr Opin Immunol. 2017;49:37–43. View this article via: PubMed CrossRef Google Scholar Hohlfeld R, Dornmair K, Meinl E, Wekerle H. The search for the target antigens of multiple sclerosis, part 1: autoreactive CD4+ T lymphocytes as pathogenic effectors and therapeutic targets. Lancet Neurol. 2016;15(2):198–209. View this article via: PubMed CrossRef Google Scholar Hohlfeld R, Dornmair K, Meinl E, Wekerle H. The search for the target antigens of multiple sclerosis, part 2: CD8+ T cells, B cells, and antibodies in the focus of reverse-translational research. Lancet Neurol. 2016;15(3):317–331. View this article via: PubMed CrossRef Google Scholar Reich DS, Lucchinetti CF, Calabresi PA. Multiple sclerosis. N Engl J Med. 2018;378(2):169–180. View this article via: PubMed CrossRef Google Scholar Papalexi E, Satija R. Single-cell RNA sequencing to explore immune cell heterogeneity. Nat Rev Immunol. 2018;18(1):35–45. View this article via: PubMed CrossRef Google Scholar Stubbington MJT, Rozenblatt-Rosen O, Regev A, Teichmann SA. Single-cell transcriptomics to explore the immune system in health and disease. Science. 2017;358(6359):58–63. View this article via: PubMed CrossRef Google Scholar Molodtsov A, Turk MJ. Tissue resident CD8 memory T cell responses in cancer and autoimmunity. Front Immunol. 2018;9:2810. View this article via: PubMed Google Scholar Park CO, Kupper TS. The emerging role of resident memory T cells in protective immunity and inflammatory disease. Nat Med. 2015;21(7):688–697. View this article via: PubMed CrossRef Google Scholar Kivisäkk P, et al. Human cerebrospinal fluid central memory CD4+ T cells: evidence for trafficking through choroid plexus and meninges via P-selectin. Proc Natl Acad Sci U S A. 2003;100(14):8389–8394. View this article via: PubMed CrossRef Google Scholar Amsen D, van Gisbergen KPJM, Hombrink P, van Lier RAW. Tissue-resident memory T cells at the center of immunity to solid tumors. Nat Immunol. 2018;19(6):538–546. View this article via: PubMed CrossRef Google Scholar Mackay LK, Kallies A. Transcriptional regulation of tissue-resident lymphocytes. Trends Immunol. 2017;38(2):94–103. View this article via: PubMed CrossRef Google Scholar Matloubian M, et al. Lymphocyte egress from thymus and peripheral lymphoid organs is dependent on S1P receptor 1. Nature. 2004;427(6972):355–360. View this article via: PubMed CrossRef Google Scholar Cibrián D, Sánchez-Madrid F. CD69: from activation marker to metabolic gatekeeper. Eur J Immunol. 2017;47(6):946–953. View this article via: PubMed CrossRef Google Scholar Kumar BV, et al. Human tissue-resident memory T cells are defined by core transcriptional and functional signatures in lymphoid and mucosal sites. Cell Rep. 2017;20(12):2921–2934. View this article via: PubMed CrossRef Google Scholar Mackay LK, et al. Hobit and Blimp1 instruct a universal transcriptional program of tissue residency in lymphocytes. Science. 2016;352(6284):459–463. View this article via: PubMed CrossRef Google Scholar Skon CN, Lee JY, Anderson KG, Masopust D, Hogquist KA, Jameson SC. Transcriptional downregulation of S1pr1 is required for the establishment of resident memory CD8+ T cells. Nat Immunol. 2013;14(12):1285–1293. View this article via: PubMed CrossRef Google Scholar Zaid A, et al. Chemokine receptor-dependent control of skin tissue-resident memory T cell formation. J Immunol. 2017;199(7):2451–2459. View this article via: PubMed CrossRef Google Scholar van Lieshout AW, et al. Regulation of CXCL16 expression and secretion by myeloid cells is not altered in rheumatoid arthritis. Ann Rheum Dis. 2009;68(6):1036–1043. View this article via: PubMed CrossRef Google Scholar De Stefano N, et al. Radiologically isolated syndrome or subclinical multiple sclerosis: MAGNIMS consensus recommendations. Mult Scler. 2018;24(2):214–221. View this article via: PubMed CrossRef Google Scholar Thompson AJ, et al. Diagnosis of multiple sclerosis: 2017 revisions of the McDonald criteria. Lancet Neurol. 2018;17(2):162–173. View this article via: PubMed CrossRef Google Scholar Friese MA, Fugger L. Autoreactive CD8+ T cells in multiple sclerosis: a new target for therapy? Brain. 2005;128(pt 8):1747–1763. View this article via: PubMed Google Scholar Machado-Santos J, et al. The compartmentalized inflammatory response in the multiple sclerosis brain is composed of tissue-resident CD8+ T lymphocytes and B cells. Brain. 2018;141(7):2066–2082. View this article via: PubMed CrossRef Google Scholar Skulina C, et al. Multiple sclerosis: brain-infiltrating CD8+ T cells persist as clonal expansions in the cerebrospinal fluid and blood. Proc Natl Acad Sci U S A. 2004;101(8):2428–2433. View this article via: PubMed CrossRef Google Scholar van Nierop GP, et al. Phenotypic and functional characterization of T cells in white matter lesions of multiple sclerosis patients. Acta Neuropathol. 2017;134(3):383–401. View this article via: PubMed CrossRef Google Scholar Held K, et al. αβ T-cell receptors from multiple sclerosis brain lesions show MAIT cell-related features. Neurol Neuroimmunol Neuroinflamm. 2015;2(4):e107. View this article via: PubMed CrossRef Google Scholar Junker A, et al. Multiple sclerosis: T-cell receptor expression in distinct brain regions. Brain. 2007;130(pt 11):2789–2799. View this article via: PubMed Google Scholar Salou M, et al. Expanded CD8 T-cell sharing between periphery and CNS in multiple sclerosis. Ann Clin Transl Neurol. 2015;2(6):609–622. View this article via: PubMed CrossRef Google Scholar Babbe H, et al. Clonal expansions of CD8(+) T cells dominate the T cell infiltrate in active multiple sclerosis lesions as shown by micromanipulation and single cell polymerase chain reaction. J Exp Med. 2000;192(3):393–404. View this article via: PubMed CrossRef Google Scholar Lassmann H. Pathogenic mechanisms associated with different clinical courses of multiple sclerosis. Front Immunol. 2018;9:3116. View this article via: PubMed Google Scholar Lebrun C, Kantarci OH, Siva A, Pelletier D, Okuda DT, , RIS Consortium. Anomalies characteristic of central nervous system demyelination: radiologically isolated syndrome. Neurol Clin. 2018;36(1):59–68. View this article via: PubMed CrossRef Google Scholar Cepok S, et al. Short-lived plasma blasts are the main B cell effector subset during the course of multiple sclerosis. Brain. 2005;128(pt 7):1667–1676. View this article via: PubMed Google Scholar Michel L, Touil H, Pikor NB, Gommerman JL, Prat A, Bar-Or A. B cells in the multiple sclerosis central nervous system: trafficking and contribution to CNS-compartmentalized inflammation. Front Immunol. 2015;6:636. View this article via: PubMed Google Scholar Obermeier B, et al. Matching of oligoclonal immunoglobulin transcriptomes and proteomes of cerebrospinal fluid in multiple sclerosis. Nat Med. 2008;14(6):688–693. View this article via: PubMed CrossRef Google Scholar Brändle SM, et al. Distinct oligoclonal band antibodies in multiple sclerosis recognize ubiquitous self-proteins. Proc Natl Acad Sci U S A. 2016;113(28):7864–7869. View this article via: PubMed CrossRef Google Scholar Beltrán E, et al. Intrathecal somatic hypermutation of IgM in multiple sclerosis and neuroinflammation. Brain. 2014;137(pt 10):2703–2714. View this article via: PubMed Google Scholar Palanichamy A, et al. Immunoglobulin class-switched B cells form an active immune axis between CNS and periphery in multiple sclerosis. Sci Transl Med. 2014;6(248):248ra106. View this article via: PubMed CrossRef Google Scholar Stern JN. B cells populating the multiple sclerosis brain mature in the draining cervical lymph nodes. Sci Transl Med. 2014;6(248):248ra107. View this article via: PubMed CrossRef Google Scholar Neu KE, Tang Q, Wilson PC, Khan AA. Single-cell genomics: approaches and utility in immunology. Trends Immunol. 2017;38(2):140–149. View this article via: PubMed CrossRef Google Scholar Nguyen A, Khoo WH, Moran I, Croucher PI, Phan TG. Single cell RNA sequencing of rare immune cell populations. Front Immunol. 2018;9:1553. View this article via: PubMed Google Scholar Ransohoff RM, Engelhardt B. The anatomical and cellular basis of immune surveillance in the central nervous system. Nat Rev Immunol. 2012;12(9):623–635. View this article via: PubMed CrossRef Google Scholar Smolders J, et al. Tissue-resident memory T cells populate the human brain. Nat Commun. 2018;9(1):4593. View this article via: PubMed CrossRef Google Scholar Günther C, Carballido-Perrig N, Kaesler S, Carballido JM, Biedermann T. CXCL16 and CXCR6 are upregulated in psoriasis and mediate cutaneous recruitment of human CD8+ T cells. J Invest Dermatol. 2012;132(3 pt 1):626–634. View this article via: PubMed Google Scholar Sato T, et al. Role for CXCR6 in recruitment of activated CD8+ lymphocytes to inflamed liver. J Immunol. 2005;174(1):277–283. View this article via: PubMed CrossRef Google Scholar van der Voort R, et al. Elevated CXCL16 expression by synovial macrophages recruits memory T cells into rheumatoid joints. Arthritis Rheum. 2005;52(5):1381–1391. View this article via: PubMed CrossRef Google Scholar de Graaf MT, et al. Central memory CD4+ T cells dominate the normal cerebrospinal fluid. Cytometry B Clin Cytom. 2011;80(1):43–50. View this article via: PubMed Google Scholar Pashenkov M, Huang YM, Kostulas V, Haglund M, Söderström M, Link H. Two subsets of dendritic cells are present in human cerebrospinal fluid. Brain. 2001;124(pt 3):480–492. View this article via: PubMed Google Scholar Picelli S, Faridani OR, Björklund AK, Winberg G, Sagasser S, Sandberg R. Full-length RNA-seq from single cells using Smart-seq2. Nat Protoc. 2014;9(1):171–181. View this article via: PubMed CrossRef Google Scholar Baym M, Kryazhimskiy S, Lieberman TD, Chung H, Desai MM, Kishony R. Inexpensive multiplexed library preparation for megabase-sized genomes. PLoS One. 2015;10(5):e0128036. View this article via: PubMed CrossRef Google Scholar Butler A, Hoffman P, Smibert P, Papalexi E, Satija R. Integrating single-cell transcriptomic data across different conditions, technologies, and species. Nat Biotechnol. 2018;36(5):411–420. View this article via: PubMed CrossRef Google Scholar Beltrán E, et al. Shared T cell receptor chains in blood memory CD4+ T cells of narcolepsy type 1 patients. J Autoimmun. 2019;100:1–6. View this article via: PubMed CrossRef Google Scholar Version history Version 1 (September 30, 2019): Electronic publication
|
|
Scooped by
Gilbert C FAURE
September 29, 2019 2:12 PM
|
Long & Holtzman provide a comprehensive overview of the molecules, cells, and mechanisms
of Alzheimer disease pathobiology and therapeutic strategies, critically discussing
failed strategies and offering a path forward.
|


 Scoop.it!