Your new post is loading...

|
Scooped by
Jeff Domansky
March 21, 2013 1:11 AM
|
Still haven’t gotten started on one of the fastest social media sites out there, Pinterest? Pin this: an infographic guide for marketers on how to get started with the service. The infographic covers everything from making good use of your "About" copy to the use of hashtags, running themed boards and more. Did you know that 79 percent of the Pinterest users are female and moms are 61 percent more likely to use Pinterest than any other demographic. Including the price on a pin generates an average of 36 percent more likes. Check out the full infograph here....
|
|
Scooped by
Jeff Domansky
March 20, 2013 8:21 AM
|
Master of Organic Search, Jason Corrigan explains how user-generated content can provide incredible SEO results as well as a substantial increase in consumer confidence of your brand.... The purpose of UGC is to allow for the expression and sharing of: Problem Processing News Research Social Chatter Social Engagement Consumer Relationship Development...
|
|
Scooped by
Jeff Domansky
March 19, 2013 11:38 AM
|
The Shoppe Designs created this photography poster series to simultaneously lament the constant irritations professional photographers are forced to put up with, and wittingly strike back at all those who put them down....
|
|
Scooped by
Jeff Domansky
March 18, 2013 9:56 AM
|
In this infographic, we’ll compare the attributes of spam and legitimate email marketing. We’ll illustrate how spam is an offensive intrusion, while the other is a welcome interaction with high business ROI....
|
|
Scooped by
Jeff Domansky
March 15, 2013 9:45 AM
|
Platforms such as Twitter and Facebook have revolutionised marketing, sales and community engagement for the vast majority of brands, but what about within the workplace itself – are businesses practicing what they preach by letting employees use social media in the office? Increasingly, yes. More than half (52.1 percent) of firms now let all of their employees access social media sites at work, with only a little more than one quarter (26.4 percent) actively blocking access to these channels. And while almost two-thirds (64.2 percent) don’t monitor the use of Twitter and Facebook in the office, 68.9 percent do have a social media policy in place.
In this infographic you will learn the worth of content in business. How a unique content helps reader to understand and take action regarding buying a product or availing any service. Many people use to read content before making any decision.
|
|
Scooped by
Jeff Domansky
March 13, 2013 1:42 AM
|
After you’ve written a major piece of content, do you know how to market it effectively? It’s vital that you do. Content marketing is crucial – and only getting more important – for SEO, developing your brand, generating leads and demonstrating thought leadership. For it to be effective, you need people to see your content. This infographic “Content Marketing: The Game” from Fisher Vista is a fun look at 14 methods that will help you win at the serious business of content marketing. The infographic was created by the creative folks at Fisher Vista for SocialEars HR - software for content marketers who want to get found, be shared and increase engagement.
Robin Good's insight: Lingospot for WordPress, a collaborative news curation platform that until now was specifically targeted at enterprise customers, has launched a new commercial service which allows anyone to monitor, filter, curate, share and more...
Via massimo facchinetti
|
|
Scooped by
Jeff Domansky
March 11, 2013 2:59 AM
|
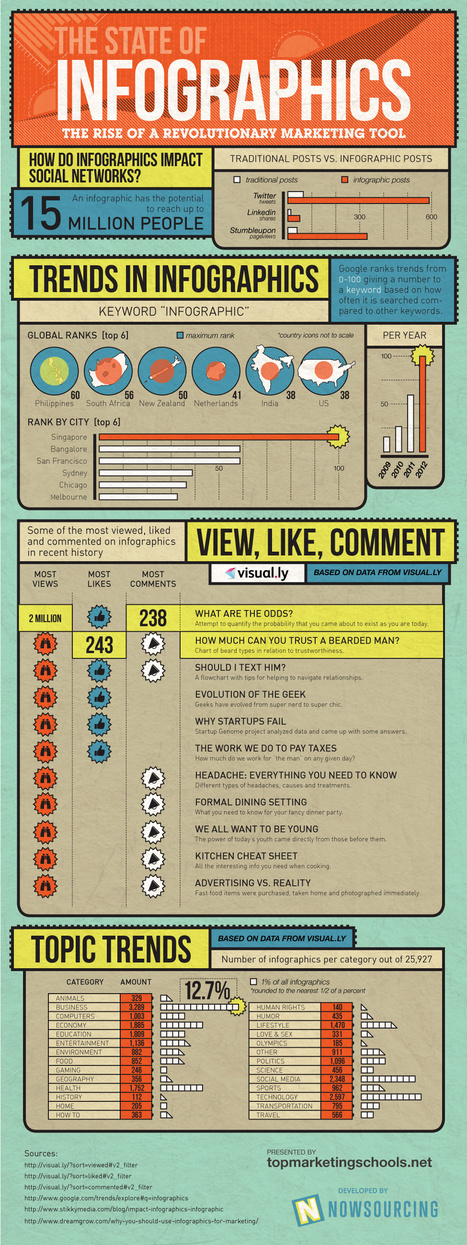
Infographics have become more popular with the rise of social media, fuelling the need for instant results by providing content in bite-size chunks.
|
|
Scooped by
Jeff Domansky
March 4, 2013 9:56 AM
|
The Top 20 Food Brands In Social Media
|
|
Scooped by
Jeff Domansky
February 28, 2013 10:42 PM
|
The app economy is booming and with the opportunities it creates, app development is becoming one of the trendiest professions.
|
|
Scooped by
Jeff Domansky
February 28, 2013 11:25 AM
|
An excellent infographic, plus additional resources on monitoring your online reputation - from Melissa Agnes's online crisis management blog. Yesterday, Jeffrey sent me a link to this excellent infographic on monitoring your online reputation. I thought it was so well-created that I wanted to share it with you here today. Below the infographic, you’ll find additional links to past posts I’ve written that take you deeper into actually putting the excellent advice within this infographic to use. Take a look....
|
|
Scooped by
Jeff Domansky
February 27, 2013 3:01 AM
|
Which CEO has the most influence when it comes to social media? Warren Buffett? Nope. Michael Dell? Not a bad guess, I suppose. Twitter’s Dick Costolo? He’s up there. AOL’s Steve Case? Good try. Richard Branson? You’re getting warmer. Facebook’s Mark Zuckerberg? According to this study, he doesn’t even make the top fifty. Yes indeed. According to the Reuters & Klout 50, which measures the most influential executives online, it’s Oprah Winfrey who ranks as the most influential social CEO, ahead of Rupert Murdoch, Richard Branson, Mark Cuban and Tim O’Reilly. Twitter co-founder (and now Square CEO) Jack Dorsey placed in fifth, while Twitter CEO Dick Costolo was fourteenth. Check out the incredibly well-designed infographic below for your top forty....
|
|
|
Scooped by
Jeff Domansky
March 21, 2013 1:02 AM
|
Buddy Media recently published a report titled “Strategies for Effective Tweeting: A Statistical Review.” The report is based on the data compiled from their analysis of user-engagement from over 320 Twitter profiles managed by various brands. Based on their data they make several recommendations for how best to maximize the use of Twitter as a business. After reviewing the study we decided to convert it into an infographic using most of the data found within the report. We focused on using the data that relates to some of the most common questions we receive from clients about Twitter best practices, including...
|
|
Scooped by
Jeff Domansky
March 20, 2013 7:32 AM
|
This post is #6 in DailyTekk’s famous Top 100 series which explores the best startups, gadgets, apps, websites and services in a given category.... I love a good infographic! After all, knowledge is power and the visualization of data makes absorbing information all the easier. Well-designed infographics have a way of pulling me into a subject I’d normally never care to know about. As a designer I can attest to the crazy amount of time it takes to make a compelling, useful infographic. I have to say I knew about many of the great links, resources and tools I’ve linked to here on this post before but I dug deep and found some new and exciting infographic tools that I’m willing to bet you haven’t seen before. Items 1-5 under the Data Visualization Tools and Software category are sufficiently capable of arming even a novice designer with the ability to produce a powerful infographic (though I’m sure experts will find them handy as well). In short, if you love infographics, data visualization and information design as much as I do, you’re going to love this post....
|
|
Scooped by
Jeff Domansky
March 19, 2013 9:25 AM
|
Social media is full of numbers, but most of the time we don't use them in any actionable way. The reason is simple: Social metrics are often too complicated to understand, and they provide few clues on how we can improve our success. The reality is that the return on social media marketing can vary widely for each business. Some companies see quick and immediate returns, while others fail to see much of anything at all. What could the problem be? And, more important, how can we be sure that our business won't fail online? This article looks to answer those questions by offering a few quick-and-dirty methods for gauging your online marketing strengths and weaknesses....
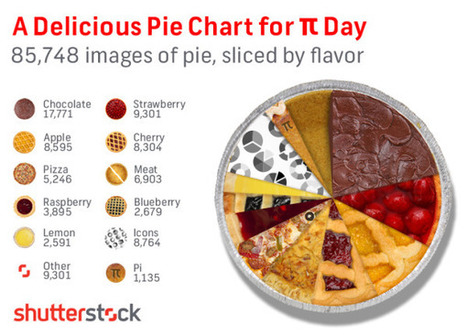
In honor of Pi Day (3/14) we took a dive into our library to suss out some Pie Knowledge, and ended up with the above appetizing infographic revealing the flavor breakdown of the 85,748 “pie” search results from our library. Yes, we know that “Pi” equals 3.14159… and not “Pie,” but we couldn’t resist the delicious comparison. Any way you slice it, this is some tasty data, and our mouths water for data here at Shutterstock.
|
|
Scooped by
Jeff Domansky
March 14, 2013 1:01 AM
|
Social media comes with a pretty steep learning curve, and for brands looking to implement these tools into their marketing and customer support strategy it can quickly become overwhelming. Where on earth do you begin? Well, first, you have to generate content, creating and sharing valuable information that is tailored to boost engagement. You’ll need to start conversations, listening, monitoring and responding to your customers. Of course, you’ll need a community, and the best way to build that is by connecting to the right social networks that best fit your business....
|
|
Scooped by
Jeff Domansky
March 13, 2013 1:44 AM
|
This infographic was inspired by the content marketing strategy I’m using at Informly. Feel free to share it or embed it on your site.
|
|
Scooped by
Jeff Domansky
March 13, 2013 1:36 AM
|
All about the Marketing funnel and the importance of content in feeding sales...
12 tips for launching a new infographic to help your site viewers relate to a lot of information and numbers. Numbers don’t lie. That’s true. But they can be really boring. When you have a lot of numbers, try to help the viewer relate to them. Infographics are very “in” these days but what are they? Simply put, they are a combination of information and graphics. Effective communication is the key when dealing with a lot of information. Although, an appealing design is crucial to attract readers, it is not everything. Here are our 12 tips for launching a new website infographic...
Pairing Wine & Food from Wine Folly is a simple, but incredibly useful infographic design. Tasty info graphic. ... Enough said.
|
|
Scooped by
Jeff Domansky
March 1, 2013 10:09 PM
|
Did you know that there are now close to two and a half billion internet users across the planet, a rise of more than 500 percent since the year 2000? And as the number of users grows, the internet changes accordingly – and so does the world. In these heady, modern times, and thanks to the rise of empowering social media platforms such as Twitter and Facebook, you can do – and be – anything you like on the internet. All of which has led to global change, huge shifts in ideologies and an ongoing rethink in how we absorb and process information – and what this might mean for the future....
|
|
Scooped by
Jeff Domansky
February 28, 2013 8:30 PM
|
Domino’s faced a major crisis in 2009 after two employees defiled their pizza on YouTube, but it only took the company three and a half weeks to restore a 22 percent drop in online sentiment, according to social media monitoring service SDL. How did they do it? Domino’s president Patrick Doyle put up his own YouTube video, in which he explained that the rogue employees were not only fired, but also faced criminal charges. YouTube commenters responded with the usual sarcasm, but addressing the problem on the same platform where it started helped contain it. United Airlines and Nestlé, which also faced backlash after a fail, were not so lucky. Below is a comparison of how the three companies’ responses to criticism from the public either reduced or increased the amount negative things people said about them online....
|
|
Scooped by
Jeff Domansky
February 27, 2013 2:29 PM
|
Every year FOLIO: conducts a nationwide survey with mid and executive-level editors. The survey maps out salary ranges across a number of demographics including gender, age, location, company size, education and more. The infographic below provides an interactive breakdown on several key trends that have occurred over the last five years....
|