


When you’re running a small business, time is literally money. Use these 6 time saving tips to shave hours off your work week and maintain your balance.

 Your new post is loading...
 Scoop.it!
When you’re running a small business, time is literally money. Use these 6 time saving tips to shave hours off your work week and maintain your balance.

No comment yet.
Sign up to comment
Scoop.it!

Time for a pop quiz! What common beverage helped start the agricultural revolution, helps prevent kidney stones, and has been around for thousands of years? If you said beer you would be correct. Man’s favorite drink has been around for several thousand years and holds a special place in our history. People’s desire for more beer brought forth some of our most important inventions, such as the plow and irrigation systems which allowed for more efficient farming....
Jeff Domansky's insight:
Mmmm. Beer!
Scoop.it!

...But what about small business? While they don’t have the resources to compete with the larger brands, by fully integrating social media into all aspects of their business strategy small brands can also use these tools to dramatically boost their digital profile, customer base and sales. The infographic below takes a closer look at why small businesses should use social media for all of their business needs, with goals, strategies, case studies and tips....
Scoop.it!

Jeff Domansky's insight:
Three great content marketing tactics: searchable, snackable, shareable.

Stefano Principato's curator insight,
March 29, 2013 9:34 AM
The infographic aims to further your understanding of these content dimensions and strengthen your content strategy accordingly. 
Tanja Elbaz's curator insight,
November 17, 2023 6:49 PM
Scoop.it!
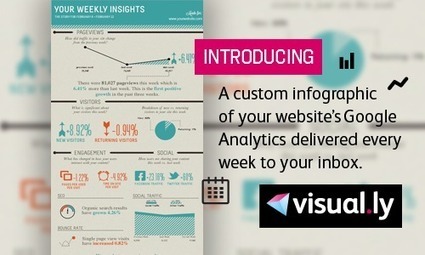
Have you ever tried to make quick sense of your website's Google Analytics report? Google Analytics is a great tool that provides a wealth of information about your website's traffic and engagement, but the dashboard style display of key metrics can be a little much to take in and meaningfully process. Yet more than 10 million people rely on this free tool to keep track of their daily web performance.
So the fine folks over at Visually created a Visually Google Analytics Report which can be automatically delivered to your inbox each week. The report transforms critical data about your website including the number of weekly page views, social engagement, SEO, and bounce rate into an easily accessible infographic.

Brian Yanish - MarketingHits.com's curator insight,
March 30, 2013 6:52 PM
Love it, great to send to a client. 
Charles Lipshay's curator insight,
March 30, 2013 7:07 PM
Now a Blog with place for analytics & seo http://www.empowernetwork.com/almostasecret.php?id=lipshaybiz 
Daniel Polecheck's curator insight,
March 31, 2013 3:33 AM
This could be a good marketing tool to put the client on the fence over the fence.
Scoop.it!

Some SME social media usage stats for you, this time via Sage. We need to get to the heart of the matter. Even if your ideal customers are on LinkedIn, Facebook or Twitter you still need to create content and share it with them on the platform of their choice....
Scoop.it!

Did you know that the time spent using social media apps on mobile devices grew by an incredible 387 percent between December 2011 and December 2012? Indeed, use of social media mobile software (such as the official Facebook and Twitter clients) led all types of apps in overall usage growth, beating media/entertainment (+268 percent) and shopping (+247 percent) apps into second and third place respectively. Overall, consumers spent 132 percent more time using all apps year-on-year. This infographic takes a closer look at this data and the impact that these apps are making in retail commerce....
Scoop.it!

Trust and Tweets. That's the focus of the two infographics we have for you today, on this fine Twinfographics Tuesday. We found both of these graphics thanks to our friends at VisualLoop...
Scoop.it!

The value of visual storytelling will only increase over time. You don’t need a research grant from the feds to reach this conclusion. There are only so many words a human brain can process before the overload buzzer goes off (unless you’re Stephen Hawking). Which brings us to the infographic. If a picture is worth a thousand words, then an infographic must weigh in at around 10,000 words. Yet, grapevine chatter has the media suffering from “IF,” infographic fatigure. Jesus Diaz from Gizmodo shared this in an exchange with Sam Whitmore at SWMS...
Scoop.it!

Our newest infographic “The 4 C’s of Social Media” illustrates how tech buyers and marketers are currently using social media, and how these four strategies can be used to get the most out of future social media efforts. The infographic was shaped by the results of UBM Tech’s 2013 Social Media @Work research report, which takes a deep dive into the role social media plays in the business technology market. The research was based on a survey taken by 462 IT buyers, as well as 155 b-to-b technology marketers conducted in late 2012....
Scoop.it!

Back in 2009, a group of University of Vermont researchers published asurprising paper in the Journal of Happiness Studies. In it, they outlined the process of determining the saddest day in recent memory, the day Michael Jackson died using data culled from blogs. The happiest, they found, was November 4, 2008--the day Obama was elected.
The paper’s underlying concept dates back to 1881, when an Irish scientist conceived of an instrument called a “hedonometer” that could measure the happiness of a population. The 2009 study does something similar, using millions of words scraped from the blogs and ranked according to happiness levels. In 2011, they refined the methodology further and applied it to Twitter alone, analyzing 46 million words.
Scoop.it!

From
visual

We're discussing the latest trends in social sharing: the ecosystem gets busier and busier, and now everybody seems to share (and overshare) stuff all day within their social graph. We tried to zoom out as much as possible for you to be able to see the whole picture: the state of social sharing in the beginning of 2013 and everything you need to know about its eight major players. -- get stellar web hosting from http://www.webhostingbuzz.com/ get high quality infographics from http://mostash.com
Jeff Domansky's insight:
Find out who's sharing what in this interesting infographic.

Linda Dap's curator insight,
March 26, 2013 12:27 PM
Geen Nederlandse cijfers, toch interessant om te zien wie wat op welk kanaal deelt.
Scoop.it!

From
visual
Now that the Harlem Shake is over we can ask: How did a dance move turn into a wild internet meme? Find out the truth behind the meme in this infographic....
|
Scoop.it!
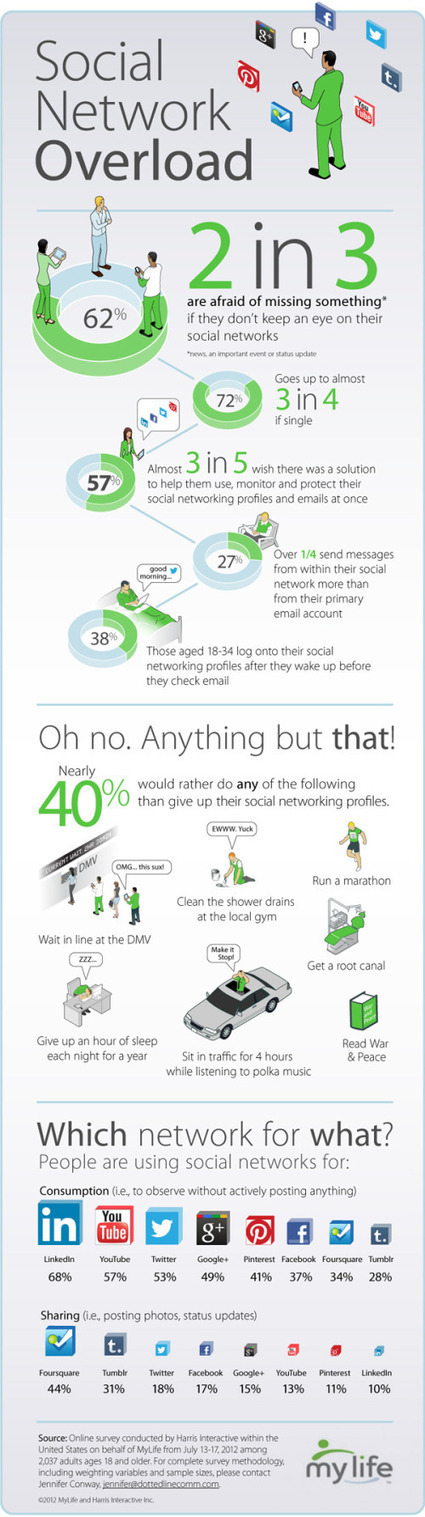
How often have you checked your social media accounts today? Feeling unplugged is a problem for many people. Social Network Overload from mylife.com talks about how people are addicted to social media, and what they rather do than give up their Internet lifeline. Afraid you’re missing something important on your email, Facebook, Twitter, or other accounts? You are not alone. Two out of three people feel the same way. In the same survey, three out of five people wished there was a solution to monitor their various communication options. Here’s an interesting infographic based on a survey by Harris which illustrates a growing trend—social media overload...

Phillip Ennis's curator insight,
April 4, 2013 11:16 AM
Equally hilarious and terrifying. Nearly 40% of the people polled say they would rather clean the shower drain at their local gym or get a root canal, than give up social media. Of course, the best way to share this infographic is...social media!
Scoop.it!

As an example of this opportunity, Paul Roger’s recent post on using products to increase conversion rate showed the power of video to persuade consumers about a product. For example, Matt Lawson, Head of Conversion at Appliances Online explains: “Video gives us the opportunity to wow our customers and this in turn delivers results. We have tested and proven that when someone watches our video reviews they’re 120.5% more likely to buy, spend 157.2% longer on the site and spend 9.1% more per order. So my focus this quarter is increase customers watching video. Simple.”...
Scoop.it!

This infographic shows you a few ways to optimize your Tweets to get more people to engage, Retweet and click on them
Jeff Domansky's insight:
Top Twitter tactics to target top twits.
Scoop.it!

Opportunities for mobile-friendly sites are growing larger every day. As of 2012, mobile traffic alone makes up 10% of all Internet use the world over Via Brian Yanish - MarketingHits.com
Jeff Domansky's insight:
Good motivation for mobile...
Scoop.it!

If you’ve ever been the victim of an unfollow on Twitter, you may just fit the profile of an obnoxious tweeter. The following infographic, created by Israel-based company Conduit, details 11 of the tech industry’s most annoying Twitter users.
Some examples of feed-cloggers include “The Eventaholic,” who tweets about every pseudo-interesting person he meets at every single gathering he attends, and “The Social Media Butterfly,” who constantly provides updates in a bid to gain more followers....
Scoop.it!

This March Madness-themed infographic uncovers key information on search privacy concerns, social influence, efficacy of images in search results, social sharing behavior, social preferences by social network and demographic, and more....
Scoop.it!

An 8-Step Social Media Marketing Strategy For Brands If you’re a brand getting started with social media, it can quickly get overwhelming. Platforms such as Twitter and Facebook come with a pretty steep learning curve – certainly when used for business marketing – and to maximise return on investment it’s essential that you implement a winning strategy. For starters, you’ll need to empower the right employees to manage your social channels, sharing responsibility and goals. You must learn to listen to your audience, using specific metrics to analyse feedback and success. You’ll need to position yourself as an authority within your field, identifying the one thing that separates you from your competitors. And, perhaps most importantly, your brand needs to be human, as social media is very much about people – not logos. The infographic below presents an 8-step strategy for successful social media marketing....
Phillip Ennis's curator insight,
March 28, 2013 10:41 AM
Often overlooked, these basics for marketing with social media are the driving force behind a successful plan.
Scoop.it!

Social media expert Michelle Bucher debunks myths about social media professionals and how they spend their day. ... Being a full time social media marketer, I wanted to bring a bit more insight into the attached infographic, “The Hectic Schedule of a Social Media Marketer.” My perspective comes from being an entrepreneur and owning my own social media agency. Social media is definitely not a 9-5 job. We are continuing to see this with large brands being active on weekends and during large sporting events like the Super Bowl...-
Scoop.it!

First impressions are everything, but sometimes they creep up on you. As a job candidate, 86% of potential employers will look at your social profiles — even if you don't explicitly share those links. While Facebook red-cup duty is common practice for job seekers, you might be surprised to know that recruiters think poor spelling looks worse than drinking. Along with copyediting yourself, data shows you may want to keep Burning Man references under cover, too — 18% of recruiters reacted negatively to the festival. Column Five Media put together an infographic of tips for using social media to make first impressions — and included a few things every job seeker should avoid. Data is courtesy of Jobvite....
Scoop.it!

Tweet the wrong thing on Twitter and you have the potential for a viral campaign of the very wrong kind that provides a new category of embarrassment. Embarrassment at speed. ... Here are 14 Twitter mistakes to be avoided to ensure that the boss values you on Monday morning, your wife still loves you on Friday evening and your career path is not hijacked by an insane moment....
Scoop.it!

If you're thinking about advertising on Facebook or Google, this infographic will give you useful and helpful information about their ad performances.
Scoop.it!

From
visual
Mobile devices, with the help of social media, are taking over media creation. Here's a fascinating trend to keep an eye on.
|






