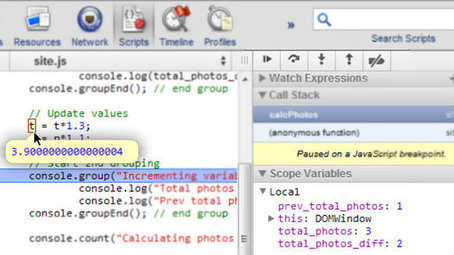

Over the last five years, thanks largely to the rise of frameworks such as jQuery and Prototype, JavaScript has risen to become a first tier language for scripting on the web. This increased popularity and ease of use, has led to the creation of fully fledged applications such as Gmail, which contain thousands of lines of JavaScript code that required teams of talented developers to create.
As a result of this increasing complexity however, when something does go wrong developers need powerful JavaScript debugging tools in order to quickly root out the cause of the issue and fix it efficiently. A simple var dump via the alert() dialogue simply won’t cut it anymore.
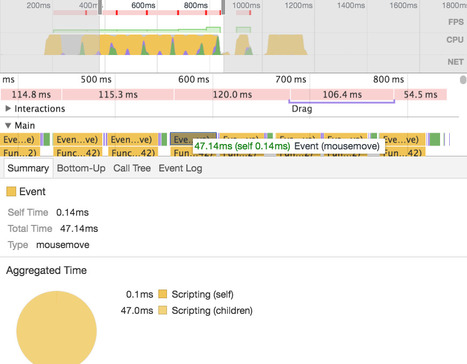
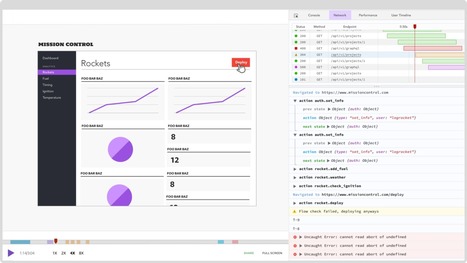
In this tutorial I’ll outline some of the features of modern developer tools that you can use today to help make JavaScript debugging less painful. We’ll focus primarily on the Chrome developer tools and Firebug but many of these features are available in other tools such as Opera Dragonfly.


 Your new post is loading...