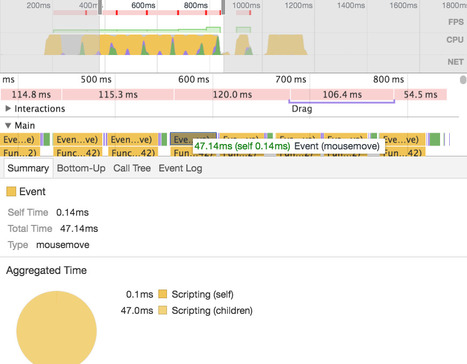
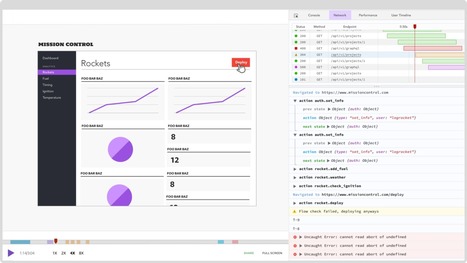
In this quick video, I walk through how to effectively use DevTools Flame Charts for visually representing your app’s JavaScript processing over time. This can be useful if you’re concerned it may be suffering from particularly long function executions and you want to dive into them further.
Flame Charts compliment the existing JavaScript CPU Profile’s Tree and Heavy views, displayed lower down. For those unfamiliar with the CPU profiler, it shows where CPU time is statistically spent on your code.


 Your new post is loading...