


The Nobel Prize in Physiology or Medicine 2025 was awarded to Mary E. Brunkow, Fred Ramsdell and Shimon Sakaguchi “for their discoveries concerning peripheral immune tolerance.”
Get Started for FREE
Sign up with Facebook Sign up with X
I don't have a Facebook or a X account


 Your new post is loading...
 Your new post is loading...
Your new post is loading...
The Nobel Prize in Physiology or Medicine 2025 was awarded to Mary E. Brunkow, Fred Ramsdell and Shimon Sakaguchi “for their discoveries concerning peripheral immune tolerance.” 
No comment yet.
Sign up to comment
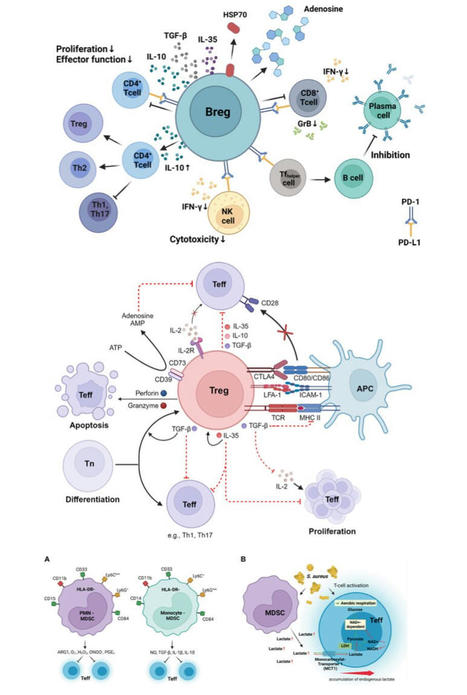
#Immunity | #Infection | #Cancer | #Immunotherapy | #Bregs | #Tregs | #MDSCs | Mechanisms Underlying #Immunosuppression by #Regulatory Cells | Breaking OPEN…

Sos's curator insight,
February 15, 2024 8:05 PM
Amazing
https://buypsychedelicdrugs.com/product-category/dmt/ https://buypsychedelicdrugs.com/product/5-meo-dmt/ https://buypsychedelicdrugs.com/product/4-aco-dmt/ https://buypsychedelicdrugs.com/product/ayahuasca/ https://buypsychedelicdrugs.com/product/changa-dmt/ https://buypsychedelicdrugs.com/product/buy-dmt-vape-pen/ https://buypsychedelicdrugs.com/product/lsd-tabs/ https://buypsychedelicdrugs.com/product/buy-mimosa-hostilis-root-bark-powdered-mhrb/ https://buypsychedelicdrugs.com/product/nn-dmt/ https://buypsychedelicdrugs.com/product/amanita-muscaria/ https://buypsychedelicdrugs.com/product/buy-dragons-dynamite-truffles/ https://buypsychedelicdrugs.com/product/golden-teachers/ https://buypsychedelicdrugs.com/product/buy-high-hawaiians-truffles/ https://buypsychedelicdrugs.com/product/liberty-caps/ https://buypsychedelicdrugs.com/product/buy-microdosing-psilocybin-truffles-10-pack/ https://buypsychedelicdrugs.com/product/buy-microdosing-psilocybin-truffles-2-pack-in-stock/ https://buypsychedelicdrugs.com/product/buy-microdosing-psilocybin-truffles-20-pack/ https://buypsychedelicdrugs.com/product/golden-teachers/ https://buypsychedelicdrugs.com/product/buy-penis-envy-mushroom/ https://buypsychedelicdrugs.com/product/codeine-promethazine/ https://buypsychedelicdrugs.com/product/ecstasy-mdma/ https://buypsychedelicdrugs.com/product/microdosing-psilocybin-truffles-1-pack-for-sale/ https://buypsychedelicdrugs.com/product/mush-rocks-truffles-for-sale/ https://buypsychedelicdrugs.com/product/pcp-powder/ https://buypsychedelicdrugs.com/product/cocaine/ https://buypsychedelicdrugs.com/product/methamphetamine/ https://buypsychedelicdrugs.com/product/xanax/ https://buypsychedelicdrugs.com/product/lsd-gel-tabs/ https://buypsychedelicdrugs.com/product/lsd-liquid/
https://caluaniemuelearoxidizeusa.com/product/buy-10l-caluanie-muelear-pasteurize/ https://caluaniemuelearoxidizeusa.com/product/buy-20l-caluanie-muelear-oxidize/ https://caluaniemuelearoxidizeusa.com/product/buy-5l-caluanie-muelear-pasteurize/ https://caluaniemuelearoxidizeusa.com/product/buy-caluanie-muelear-pasteurize/
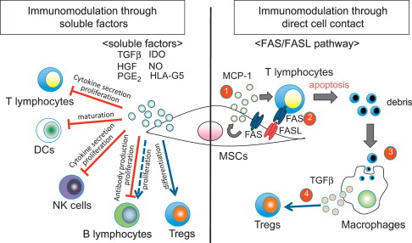
T Cell Proliferation T cell proliferation leads to formation of millions of T cells expressing specific cell membrane TCRs, capable of binding the most diverse antigens, including self-antigens. From: Epigenetic Principles of Evolution (Second Edition), 2019 Related terms: View all Topics Stem Cell-Based Approach to Immunomodulation Kathryn J. Wood, ... Ou Li, in Regenerative Medicine Applications in Organ Transplantation, 2014 61.3.4 Modulation of T-Cell Responses in Rejection by MSCs T-cell proliferation and activation are prerequisites for allograft rejection [2,85]. A large body of data demonstrate that MSCs can modulate T-cell proliferation, activation, and function both in vitro and in vivo[28,44,86–89]. Moreover, the capacity for MSCs to inhibit Th17 cell differentiation [90,91] or to shift the T-helper cell balance in favor of a more anti-inflammatory phenotype has been demonstrated in vitro [92–96]. The mechanisms utilized by MSCs in mediating these effects vary between in vitro and in vivo models. However, the secretion of soluble factors by MSCs is a common feature (English, 2012). IDO and PGE-2 have been implicated in MSC inhibition of Th17 differentiation [90,91]. In the case of PGE-2, the steps involved in the process require contact-dependent COX-2 induction of PGE-2 and direct inhibition through EP4 [90]. MSCs can also mediate this effect through suppressing the Th17 transcription factor RORγt and upregulating Foxp3 to induce a Treg phenotype producing IL-10 [96]. MSC-derived TGF-β has been shown to play a partial role in shifting the balance of Th1/Th2/Th17 and Treg in an autoimmune disease model [31]. A role for matrix metalloproteinase (MMP)2 and MMP9 secreted by MSCs facilitating cleavage of CD25 expressed on CD4+ T cells thereby inhibiting alloantigen driven proliferation and so preventing islet allograft rejection has also been described [44]. Other evidence suggests that MSC-derived MMPs also cleave CCL2 which subsequently inhibits Th17 activation via a STAT3-dependent pathway [97]. MSCs also have the capacity to expand or induce Treg in the setting of an alloimmune response [43,45,98,99] and in some cases can generate a state of Treg-dependent tolerance [30,45]. Both of these studies elegantly demonstrate the importance of Treg in MSC-induced tolerance using Treg depletion strategies with IDO potentially playing a significant role [30]. In vitro, MSC induction of Treg is thought to involve cell contact, PGE-2, and TGF-β [94]. In vivo, MSC-derived TGF-β was required for the generation of antigen-specific Treg and overall, TGF-β seems to be the major soluble factor involved in MSC promotion of Treg in vivo [29,31,100,101]. T-Cell Activation and Tolerance Erik J. Peterson, Jonathan S. Maltzman, in Clinical Immunology (Fifth Edition), 2019 Coreceptors Transduce Signals That Are Integrated With TCR Signals T-cell proliferation and the initiation of effector function require that the T cell must receive signals in addition to the TCR via other cell surface receptors.18 This requirement for multiple signals allows the T cell to be extremely sensitive to TCR binding while protecting against the inappropriate activation of potentially dangerous effector cells. Because T cells respond to antigens presented on APCs, stimulation under physiological conditions involves the potential engagement of multiple coreceptors on the T cell by cognate ligands on the APCs. Some coreceptors may function to increase the avidity of T cells for interacting APCs. However, many coreceptors exhibit intrinsic signal-transducing capacity. Some signal independently of the TCR; others intersect with TCR-driven signaling machinery. Additionally, coreceptors may function as recruiters of cytoplasmic signaling molecules, including adaptor proteins, as described above. The most intensively studied coreceptors are CD4 and CD8 (Chapter 4). CD4 or CD8 expression on peripheral T cells define subsets that respond to MHC class II- or class I-bound peptide antigens, respectively (Chapter 6). Either CD4 or CD8 can contribute to enhanced TCR signal strength because they each associate with LCK.19 This constitutive interaction, which occurs via specific residues within the CD4 and CD8 cytoplasmic domains, localizes a key effector enzyme to the TCR complex. Cytokines in Hematopoietic Stem Cell Transplantation Kate A. Markey, Geoffrey R. Hill, in Cytokine Effector Functions in Tissues, 2017 IL-6 IL-6 promotes T cell proliferation, the differentiation of cytotoxic T lymphocyte populations, and, when present in combination with TGF-β, promotes Th-17 development.65,66 Preclinical studies of IL-6 in GVHD and GVL confirm its key role as a pathogenic cytokine in GVHD. The absence of IL-6 in the donor T cell pool (using IL-6 deficient donor mice) or systemic blockade of IL-6 with an anti-IL-6R antibody results in decreased aGVHD with no loss of GVL effects in the models used.9,67 Recent data demonstrate that IL-6 is the major cytokine detectable in patient plasma early after BMT and that it appears to play a dominant role in conditioning-related pathology.68 Blockade of IL-6 with tocilizumab (soluble IL-6R) has now progressed through a successful phase I/II clinical trial with low levels of acute GVHD in comparison to historical controls.68 This represents a promising new strategy for GVHD prevention. Macrophages Galen B. Toews, in Asthma and COPD (Second Edition), 2009 Macrophages and Initiation of Antigen-specific T2 Immune Responses in Asthma Resident pulmonary AMs actively suppress T-cell proliferation induced by antigen or polyclonal stimuli [73]. Changes occur within the local inductive milieu of the lung in patients with asthma. AM suppression is reduced after exposure to allergens [106–108]. The tissue microenvironment is a crucial regulator of specific immune response generation (Fig. 11.1). The presence of IgE on APCs likely promotes the uptake and the processing of allergens and their eventual presentation to naïve T-cells. DCs express both FcεR I and FcεR II. These two receptors could function to capture allergen bound to allergen-specific IgE and thus focus the immune response through facilitated antigen presentation [109]. Antigens also deliver signals via quantitative variation in ligand density on APC. Peptide/MHC class II complexes that interact strongly with the TCR favor T1 responses, whereas weak interactions result in the priming of T2 responses. The overall binding affinity can be varied by modifying the peptide, which results in different signals. The mechanisms by which signals delivered via the TCR control differentiation is uncertain; differential TCR aggregation may result in differential intracellular signals that favor distinct cytokine gene expression or certain MHC–TCR interactions may favor differential co-receptor expression [110]. As noted above, co-stimulatory molecules may direct the polarization of T-cells into T1 or T2 cells; B7.2 provides only a moderate signal for T2 cell differentiation; and co-stimulatory signals may be delivered either by the APC that presents the antigen or by the bystander APC. Thus, macrophages may serve as bystander APC and influence DC-induced T-cell proliferation [111]. Soluble cytokines produced by cells of the innate immune response are likely the major regulators of T-cell differentiation (see “Innate Control of Adaptive Immune Responses” section). Immunotherapy in Transplantation Kentaro Akiyama, ... Takuo Kuboki, in Stem Cell Biology and Tissue Engineering in Dental Sciences, 2015 61.2.1.1 Interaction with T-Lymphocytes MSCs are known to inhibit T-cell proliferation by arresting the cell cycle in the G1/G0 phase and down-regulating cyclin D2 expression [6]. As part of the mechanisms involved in this process, MSCs produce a large number of soluble factors that work as anti-inflammatory agents. Di Nicola M et al. reported that human bone marrow MSCs inhibit both CD4+ and CD8+ T-lymphocyte proliferation by secreting transforming growth factor beta 1 (TGFβ1), hepatocyte growth factor (HGF), and prostaglandin E2 (PGE2) in vitro [7]. Another study showed that MSCs inhibit stimulated lymphocyte proliferation and mitogenic response independently of the major histocompatibility complex (MHC) [8]. MSCs also produce indoleamine 2,3-dioxygenase (IDO), which accelerates tryptophan degradation and kynureine synthesis resulting in inhibition of T-lymphocyte proliferation [9]. Nitric oxide (NO) is another immune regulation factor secreted by MSCs [10,11]. NO inhibits proliferation of T-lymphocytes by suppressing phosphorylation of transcription factor, signal transducer, and activator transcription-5 (STAT-5) [12]. Human leucocyte antigen-G5 (HLA-G5) from MSCs is a trigger for inhibition of T-lymphocyte function, followed by up-regulation of T-helper type 2 (Th2) and regulatory T-cell (Tregs) [13,14]. On the other hand, MSCs are able to inhibit T-lymphocyte proliferation by direct cell-to-cell contact [15–17]. Krampera et al. reported that MSCs physically hinder T-lymphocytes from contacting antigen presenting cells in a non-cognate fashion [18]. T-lymphocytes have several subsets. CD8+CTL plays an important role in MHC-dependent allogenic or virus- infected cell depletion. MSCs showed reducing CTL cytotoxicity by inhibiting CTL formation [19]. It has been indicated that the relationship between gamma-delta T-lymphocytes (γδT) and acute graft-vs-host disease (GvHD). MSCs suppress γδT-lymphocyte proliferation without any functional inhibition in vitro (Figure 61.1) [20]. Furthermore, some reports indicated that immunomodulation of MSCs are not only through inhibition of T-lymphocyte proliferation, but also by induction of T-lymphocyte apoptosis. A previous study demonstrated that MSCs secrete IDO, induce 3-Hydroxyanthranilic acid (HAA) synthesis during tryptophan metabolism, and induce cell apoptosis by inhibiting the NFκB pathway in T-lymphocytes [21]. Augello et al. reported that MSCs induce apoptosis of T-lymphocytes by activation of the programmed death 1 pathway [22]. More recently, MSCs have been demonstrated to induce T-lymphocyte apoptosis through the FAS/FAS ligand (FASL) pathway, and consequently lead to immunotolerance (Figure 61.1) [23]. Neuropeptides for Mucosal Immunity David W. Pascual, Kenneth L. Bost, in Mucosal Immunology (Third Edition), 2005 Tachykinins and VIP as costimulation factors for T lymphocytes Early studies showed that SP supports T-cell proliferation (Payan et al., 1983; Stanisz et al., 1986), suggesting that T lymphocytes can express NK1-R. In support of this possibility, recent investigations by several laboratories have demonstrated in vitro and in vivo expression of NK1-R by T lymphocytes. NK1-R mRNA expression by cultured murine (McCormack et al., 1996) and human T cells (Li et al., 2000) or T-cell lines has been reported. In addition, the functionality of NK1-R expression by T lymphocytes has been demonstrated in co-cultures with SP-producing dendritic cells (Lambrecht et al., 1999). It is interesting that NK1-R mRNA expression was observed in intraepithelial and lamina propria T lymphocytes but not in splenic T cells (Qian et al., 2001a). During the host response against respiratory syncytial virus, NK1-R expression was markedly increased in CD4+ T lymphocytes (Tripp et al., 2002). However, the most compelling evidence to date for the importance of NK1-R expression on T lymphocytes comes from studies by Weinstock and colleagues, using a murine model of schistosomiasis. Using NK1-R−/– mice, they observed significant reductions in the size of schistosome-induced granulomas in comparison with disease in wild-type mice (Blum et al., 1999). The limited IFN-γ production by infected NK1-R−/– mice suggested that T cells may be an important target for SP during schistosomiasis. Additional studies clearly demonstrated that the presence of NK1-R on T lymphocytes was largely responsible for schistosome antigen–induced IFN-γ production (Blum et al., 2003). Mechanistic studies demonstrated that schistosome antigen, as well as IL-12, could induce expression of NK1-R during murine schistosomiasis (Blum et al., 2001). Collectively, these studies clearly demonstrate the importance of NK1-R expression and activity during the host response to a parasitic infection. To further address the role of SP contribution to S-IgA responses, NK1-R−/– mice were orally immunized with an attenuated Salmonella construct expressing colonization factor antigen I (CFA/I). This vaccine construct has been shown to elicit a biphasic Th cell response (Pascual et al., 1999) supported by early robust IL-4- and IL-5-producing CD4+ T cells. When such a construct was used to orally immunize NK1-R−/– mice, a significant increase in antigen-specific S-IgA antibody titers was obtained (Trunkle et al., 2003). Surprisingly, no significant differences in IFN-γ production were observed between NK1-R/+/+ and NK1-R−/– mice, but increased production to IL-6 was obtained. This evidence suggests, minimally, that some intracellular infections are resolvable in the absence of NK1-R function, perhaps via increases in S-IgA antibody responses. VIP-containing nerve fibers also extend into the T-cell regions of the Peyer's patches (Ottaway et al., 1987) to affect the CD4+ T cells, whereby stimulation of CD4+ T cells by SP or VIP can affect Ig synthesis. While SP has been shown to exert stimulatory effects upon T cells, VIP has the opposite effect and will inhibit mitogen-induced T-cell proliferation (Stanisz et al., 1986; Ottaway and Greenberg, 1984). This effect apparently occurs through a reduction of IL-2 synthesis (Ottaway, 1987; Metawali et al., 1993) and an inhibition of IL-4 in anti-CD3-stimulated T cells incubated with VIP (Wang et al., 1996). These early studies suggested that VIP exhibited anti-inflammatory properties, but this was not confirmed until recently. As stated earlier, VPAC1 is constitutively expressed, whereas VPAC2 is inducible when T cells are stimulated with anti-CD3 antibody (Delgado et al., 1996). Upon stimulation, VPAC1 levels decrease, while VPAC2 levels are induced. This evidence suggests that VIP action on CD4+ T cells is via the effect of VPAC2 acting specifically upon Th2 cells. To begin to address the regulation of VPAC1 and VPAC2, a mouse deficient in VPAC2 was derived and exhibited enhanced delayed-type hypersensitivity (DTH) responses supported by increased IFN-γ production (Goetzl et al., 2001). To exacerbate Th2 cell function, a transgenic mouse was derived in which CD4+ T cells express the human VPAC2 (Voice et al., 2001). These mice showed increased serum IgE and IgG1 but not IgA antibodies. This Th2 cell bias was evidenced as enhanced susceptibility to TNP-induced cutaneous anaphylaxis and depressed DTH responses. Studies have yet to determine whether VPAC1 and VPAC2 are regulated in a similar fashion by Peyer's patch Th cells, in a manner analogous to that seen with splenic Th cells. Bone Marrow DANIEL A. ARBER, in Modern Surgical Pathology (Second Edition), 2009 T-CELL PROLYMPHOCYTIC LEUKEMIA T-PLL is a clonal T-cell proliferation that occurs most commonly in elderly patients and has a slight male predominance.328,372,373 The disease also occurs frequently in younger patients with ataxia telangiectasia.374 Patients have a markedly elevated white blood cell count as well as organomegaly and lymphadenopathy. Nodular or maculopapular skin lesions are also common. The peripheral blood white blood cell count is usually greater than 100 × 109/L with a predominance of medium-sized cells with abundant basophilic cytoplasm and a single prominent nucleolus (Fig. 43-27). These cells are similar to B-cell prolymphocytes but may have a more convoluted nucleus than in B-PLL. Normocytic anemia and thrombocytopenia are common. The bone marrow may not be involved to the degree that would be expected by the marked elevation in peripheral blood prolymphocytes. The pattern of involvement may be interstitial, diffuse, or mixed and reticulin fibrosis is frequently present (Fig. 43-28).353 In general, T-PLL is an aggressive disease with short survival. However, a subpopulation of patients with T-PLL, including many with ataxia telangiectasia, have an initial, indolent disease course that eventually transforms to the more typical aggressive disease.375 Immunophenotyping is necessary to distinguish T-PLL from B-PLL and is often helpful in excluding acute leukemia. T cell-associated antigens CD2, CD3, CD5, and CD7 are expressed by T-PLL and surface CD3 is present. Most cases are CD4+, but a subset of cases expresses CD8 or both CD4 and CD8. The absence of both CD20 and immunoglobulin light-chain expression excludes B-PLL. The lack of TdT and CD1a expression and the presence of surface CD3 exclude most cases of T-cell ALL. T-cell receptor gene rearrangements are uniformly detectable in T-PLL. Cytogenetic abnormalities in T-PLL include inv(14)(q11q32) and t(14;14)(q11;q32), involving the TCL1 gene in the region of the T-cell receptor α/β locus, iso(8q), trisomy 8, 12p13 deletions, and t(X;14)(q28;q11).375,376 Abnormalities of chromosome region 11q22-23, involving the ATM tumor suppressor gene that is consistently mutated in ataxia telangiectasia are present in some patients with T-PLL even in the absence of ataxia telangiectasia.377 Some T-cell chronic lymphoproliferative disorders have cells with morphologic features similar to those of B-CLL without the prominent nucleolus typical of usual-type PLL.378,379 Cases of this type are considered small cell variants of T-PLL, and the term T-cell CLL should no longer be used. Although the median age and white blood cell count are lower in these patients than in usual-type T-PLL, these cases have immunophenotypic and cytogenetic features similar to those of T-PLL and a similarly aggressive clinical course. Development of T Cell Immunity Jeong M. Kim, in Progress in Molecular Biology and Translational Science, 2010 E Granzyme Dependent Cytotoxicity Treg cell mediated inhibition of in vitro effector T cell proliferation was demonstrated to require cell-to-cell contact. Although the molecular basis for contact-mediated suppression is largely unknown, recent reports have revealed that Tregs also require cellular contact for target cell killing via the granule exocytosis pathway.150,151 Granule-mediated cytoxicity is dependent on granzymes, granule resident proteases, which initiate a cascade of apoptosis-promoting cleavage events. As in effector T cells, granzyme expression is induced in Tregs in response to T cell receptor signaling. While granzyme A is primarily expressed by activated human Tregs,151 granzyme B is the predominant granzyme induced in murine Tregs.150 Granzyme A and B differ in substrate specificity and the kinetics of cell death induction, but activated murine and human Tregs comparably induce effector T cell death at 1:1 ratio of regulatory to effector T cells. In vitro cytotoxicity was dependent on granzyme function, as suppression of effector T cell proliferation was severely compromised in cultures containing granzyme B deficient Tregs.150 Cytolytic granules also contain perforin, which is essential for target cell lysis in CD8+ CTLs and NK cells. The deposited perforin polymerizes on the target cell plasma membrane in a calcium dependent manner and generates holes that were hypothesized to serve as granzyme conduits into the target cell. However, accurate measurements of pores formed by perforin suggest that the diameter of polyperforin channels do not accommodate granzyme passage.152 Although the exact function of perforin remains unknown, phenotypic similarities in mice deficient in either perforin or granzyme B provide evidence that perforin plays a nonredundant role in targeted cytolysis by lymphocytes. In support of this idea, inhibiting perforin by either EDTA or concanamycin A treatment abrogates target cell killing by human Tregs. In contrast to these findings, perforin deficient murine Tregs were equally suppressive as its wild-type counterparts in vitro, suggesting that perforin is not essential for granzyme B dependent target cell lysis in murine Treg cells. These discrepant results may reflect the usage of different granzymes for target cell killing in mouse versus human Tregs. In this regard, granzyme A may be more dependent on perforin for killing that granzyme B. Alternatively, calicium chelators or concanamycin A may not be specific for perforin inhibition, affecting target cell cytolysis independent of perforin function. Human Tregs, additionally, have been demonstrated to kill monocytes, DCs, and activated CD8+ T cells151 (Fig. 3B). Murine Tregs are also capable of killing B cells in vitro.114 Assay for Antigen-Specific T-Cell Proliferation in Mice Şefik Ş. Alkan, in Immunological Methods, 1979 Publisher Summary This chapter discusses the assay for antigen-specific T-cell proliferation in mice. While lymphocyte proliferative responses to allogeneic cells or to mitogens in the mouse can be readily measured, the reliable assay of antigen-induced T-lymphocyte proliferation in culture has proved to be substantially more difficult to establish. The uncontrolled nature of proliferation and the contribution of B-cell responses have made these methods of questionable value as a T-cell assay. The novel features of the method are the use of only draining lymph node cells of primed mice instead of spleen cells and the use of horse serum in the culture medium instead of fetal calf serum. Only draining lymph node cells rich for antigen-reactive cells are used. Animals are sensitized by injecting antigen into the tail or footpads, the draining lymph nodes are removed, the cells are cultured in microculture plates in the presence or absence of antigens (and/or mitogens), and proliferation is measured by [3H] thymidine uptake. This technique can be used for several antigens, such as monovalent antigens and protein antigens. The Digestive Involvement in Systemic Autoimmune Diseases A.J. Czaja, in Handbook of Systemic Autoimmune Diseases, 2017 4.4 Regulatory T Cells Regulatory CD4+CD25+ T cells modulate CD8 T cell proliferation by exerting a direct suppressive effect on the production of IFN-γ while increasing secretion of IL-4, IL-10, and TGF-β [143–146]. They can also induce the apoptosis of inflammatory and immune cells [147], inhibit hepatic stellate cells [148], impair the secretion of IL-17 [149], and limit the proliferation of Th17 lymphocytes [149]. These cells have been decreased in number and function in the peripheral blood of patients with autoimmune hepatitis [144,150,151], and they have been less evident in the portal tracts of liver specimens (Table 2.3) [151]. A signaling defect that influences the function of the regulatory T cells may also contribute to regulatory failure [5]. Galectin 9 is a beta galactosidase–binding protein expressed on regulatory T cells, and its ligation with the mucin domain-3 receptor (TIM-3) on Th1 cells and dendritic cells induces the apoptosis of Th1 lymphocytes and dendritic cells [152,153]. In autoimmune hepatitis, the expression of galectin 9 on regulatory T cells and TIM-3 on Th1 cells is reduced, and these deficiencies may limit the ability of the regulatory T cells to restore immune tolerance [153]. Deficiencies in the function of regulatory T cells have also been described in the siblings and children of patients with PBC, and the suppressor activity of this subset may be modulated by genetic factors [146]. Regulatory T cells can be defined more rigidly by the phenotype CD4+CD25+CD127+(low)Foxp3+, and cells with this phenotype have had normal function in patients with autoimmune hepatitis. Furthermore, increased numbers of these cells have been described in the peripheral circulation and liver tissue of patients with autoimmune hepatitis [154]. These findings have challenged the hypothesis that perturbations in the regulatory T cell population are critical for the development of autoimmune hepatitis. The discrepant findings between studies may relate to differences in the phenotypic definition of the regulatory T cells, methods for the detection and evaluation of these cells, and the severity and treatment of the liver disease in the study population [155]. The abnormalities associated with regulatory T cells may be transient and improved by medications (corticosteroids, mycophenolate mofetil, or rapamycin) and the resolution of inflammatory activity [5,144]. Relative imbalances between the number and functions of the regulatory T cells and effectors cells may be the critical factor affecting the autoreactive response rather than the absolute number and function of an individual cell population.

Michael Craver 's curator insight,
June 17, 2021 8:19 PM
https://vaporwavepsychedelic.com 
keshavdamani3@gmail.com's curator insight,
August 19, 2021 1:08 AM
progressive ataxia and multisystem involvement, which requires early diagnosis and multidisciplinary management..Read more from https://www.pediatriconcall.com/pediatric-journal/view/fulltext-articles/1315/J/0/0/710/0

Abstract Via Krishan Maggon
Il1rl1 (also known as ST2) is a member of the IL-1 superfamily, and its only known ligand is IL-33. ST2 exists in two forms as splice variants: a soluble form (sST2), which acts as a decoy receptor, sequesters free IL-33, and does not signal, and a membrane-bound form (ST2), which activates the MyD88/NF-κB signaling pathway to enhance mast cell, Th2, regulatory T cell (Treg), and innate lymphoid cell type 2 functions. sST2 levels are increased in patients with active inflammatory bowel disease, acute cardiac and small bowel transplant allograft rejection, colon and gastric cancers, gut mucosal damage during viral infection, pulmonary disease, heart disease, and graft-versus-host disease. Recently, sST2 has been shown to be secreted by intestinal pro-inflammatory T cells during gut inflammation; on the contrary, protective ST2-expressing Tregs are decreased, implicating that ST2/IL-33 signaling may play an important role in intestinal disease. This review will focus on what is known on its signaling during various inflammatory disease states and highlight potential avenues to intervene in ST2/IL-33 signaling as treatment options.
Gilbert C FAURE's insight:
alarmins

Regulatory T cells (Tregs) are specialized in immune suppression and play a dominant role in peripheral immune tolerance. Treg cell lineage development and function maintenance is determined by the Foxp3 transcriptional factor, whose activity is fine-tuned by its post-translational modifications (PTMs) and interaction partners. In this review, we summarize current studies in the crystal structures, the PTMs and interaction partners of Foxp3 protein, and discuss how these insights may provide a roadmap for new approaches to modulate Treg suppression, and new therapies to enhance immune tolerance in autoimmune diseases. This article is protected by copyright. All rights reserved.
Gilbert C FAURE's insight:
more on tregs
Regulatory T cells (Tregs) are important for the induction and maintenance of peripheral tolerance therefore, they are key in preventing excessive immune responses and autoimmunity. In the last decades, several reports have been focussed on understanding the biology of Tregs and their mechanisms of action. Preclinical studies have demonstrated the ability of Tregs to delay/prevent graft rejection and to control autoimmune responses following adoptive transfer in vivo. Due to these promising results, Tregs have been extensively studied as a potential new tool for the prevention of graft rejection and/or the treatment of autoimmune diseases. Currently, solid organ transplantation remains the treatment of choice for end-stage organ failure. However, chronic rejection and the ensuing side effects of immunosuppressant represent the main limiting factors for organ acceptance and patient survival. Autoimmune disorders are chronic diseases caused by the breakdown of tolerance against self-antigens. This is triggered either by a numerical or functional Treg defect, or by the resistance of effector T cells to suppression. In this scenario, patients receiving high doses of immunosuppressant are left susceptible to life-threatening opportunistic infections and have increased risk of malignancies. In the last 10 years, a few phase I clinical trials aiming to investigate safety and feasibility of Treg-based therapy have been completed and published, while an increasing numbers o

Objectives-To explore the molecular mechanisms in which vitamin D (VD) regulates T cells, especially Th17 cells in collagen-induced arthritis (CIA).Methods-DBA1/J mice induced for CIA were intraperitoneally treated with VD. CIA clinical symptoms and inflammatory responses including Th1/Th17/Tregs percentages were determined and compared. Mouse naïve CD4+ T cells transduced with miR-124 inhibitor or not were polarized to Th17 cells with or without VD. Subsequently, cellular differentiation and IL-6 signaling moleculars were analyzed.Results-VD treatment significantly delayed CIA onset, decreased incidence and clinical scores of arthritis, downregulated serum IgG levels and ameliorated bone erosion. VD downregulated IL-17A production in CD4+ T cells while increased CD4+Foxp3+Nrp-1+ cells both in draining lymph nodes and synovial fluid in arthritic mice. VD inhibited Th17 cells differentiation in vivo and in vitro and potentially functioning directly on T cells to restrain Th17 cells through limiting IL-6R expression and its downstream signaling including STAT3 phosphorylation, while these effects were blocked when naïve CD4+ T cells were transduced with miR-124 inhibitor.Conclusions-VD treatment ameliorates CIA via suppression of Th17 cells and enhancement of Tregs. miR-124-mediated inhibition of IL-6 signaling, provides a novel explanation for VD’s role on T cells in CIA mice or RA patients and suggests that VD may have treatment implications in rheumatoid arthritis.

Transforming growth factor-β1 (TGF-β1) is one of very few cytokines produced in a latent form, requiring activation to exert any of its vastly diverse effects on development, immunity, and cancer. Regulatory T cells (Tregs) suppress immune cells within close proximity by activating latent TGF-β1 presented by GARP to integrin αVβ8 on their surface. We solved the crystal structure of GARP:latent TGF-β1 bound to an antibody that stabilizes the complex and blocks release of active TGF-β1. This reveals how GARP exploits an unusual medley of interactions, including fold complementation by the N terminus of TGF-β1, to chaperone and orient the cytokine for binding and activation by αVβ8. Thus, this work further elucidates the mechanism of antibody-mediated blockade of TGF-β1 activation and immunosuppression by Tregs.
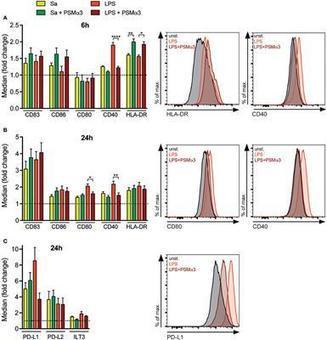
Staphylococcus aureus (Sa), as one of the major human pathogens, has very effective strategies to subvert the human immune system. Virulence of the emerging community-associated methicillin-resistant Sa (CA-MRSA) depends on the secretion of phenol-soluble modulin (PSM) peptide toxins e.g. by binding to and modulation of innate immune cells. Previously, by using mouse bone marrow-derived dendritic cells we demonstrated that PSMs in combination with various Toll-like receptor (TLR) ligands induce a tolerogenic DC phenotype (tDC) characterized by the production of IL-10 and impaired secretion of pro-inflammatory cytokines. Consequently, PSM-induced tDCs favored priming of CD4+CD25+FoxP3+ Tregs with suppressor function while impairing the Th1 response. However, the relevance of these findings for the human system remained elusive. Here, we analyzed the impact of PSMα3 on the maturation, cytokine production, antigen uptake, and T cell stimulatory capacity of human monocyte-derived DCs (moDCs) treated simultaneously with either LPS (TLR4 ligand) or S. aureus cell lysate (TLR2 ligand). Herein, we demonstrate that PSMs indeed modulate human moDCs upon treatment with TLR2/4 ligands via multiple mechanisms, such as transient pore formation, impaired DC maturation, inhibited pro- and anti-inflammatory cytokine secretion, as well as reduced antigen uptake. As a result, the adaptive immune response was altered shown by an increased differentiation of naïve and even CD4+ T cells fro

There are significantly more CD4+ Th1 cells but fewer regulatory T cells (Tregs) in

CD4+Foxp3+ Regulatory T-cells (Tregs) are a unique subset of helper T-cells, which regulate immune response and establish peripheral tolerance. Tregs not only maintain the tone and tenor of an immune response by dominant tolerance, but in recent years have also been identified as key players in resolving tissue inflammation and as mediators of tissue healing. Apart from being diverse in their origin (thymic and peripheral) and location (lymphoid and tissue resident), Tregs are also phenotypically heterogeneous as per the orientation of ongoing immune response. In this review, we discuss the recent advances in the field of Treg biology in general, and non-lymphoid and tissue resident Tregs in particular. We elaborate upon well-known visceral adipose tissue, colon, skin and tumor infiltrating Tregs and newly identified tissue Treg populations as in lungs, skeletal muscle, placenta and other tissues. Our attempt is to differentiate Tregs based on distinctive properties of their location, origin, ligand specificity, chemotaxis and specific suppressive mechanisms. Despite ever expanding roles in maintaining systemic homeostasis, Tregs are employed by large varieties of tumors to dampen anti-tumor immunity. Thus, a comprehensive understanding of Treg biology in the context of inflammation can be instrumental in effectively managing tissue transplantation, autoimmunity and anti-tumor immune responses.

Producing suppressive cytokines is a key molecular mechanism for Tregs to conduct
|
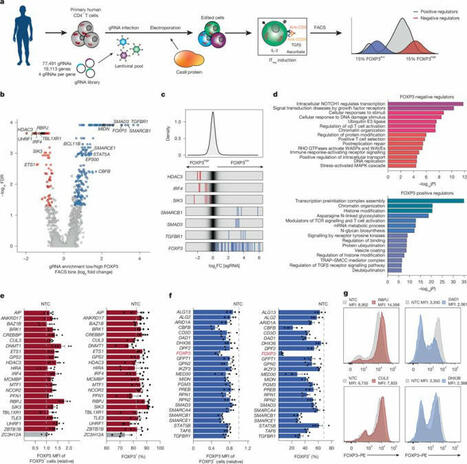
Genome-wide CRISPR screen in human T cells reveals regulators of FOXP3
Th2 Cell Th2 cells stimulate B cell and eosinophil proliferation and reduce IFN-γ production by Th1 cells, thereby promoting humoral and allergic responses. From: Neurobiology of Disease, 2007 Related terms: View all Topics Effector CD4+ T Cells in the Intestines Craig L. Maynard, Casey T. Weaver, in Mucosal Immunology (Fourth Edition), 2015 Th2 Cells Th2 cells augment the eradication of parasitic helminthes that induce expression of IL-4 by innate immune cells, such as basophils and tissue-resident mast cells. IL-4 signaling to antigen-activated, previously naïve CD4 T cells results in activation of STAT6 and subsequent induction of the transcription factor GATA-3 (Bonecchi et al., 1998). Via secretion of IL-4, IL-5, and IL-13, Th2 cells orchestrate B cell class switching to IgE (Bonecchi et al., 1998), thereby priming basophils and mast cells for granule release, recruit eosinophils, and enhance mucus production, respectively. Human Th2 cells can be distinguished by surface expression of CCR4 and CRTH2 (Bonecchi et al., 1998; Abe et al., 1999; Nagata et al., 1999). Host Defenses in Skin Hui Xu, ... Craig A. Elmets, in Clinical Immunology (Fifth Edition), 2019 Th2 responses. Th2 cells are involved in type 2 immune responses, which are important for eradication of extracellular parasites and bacterial infection. They produce IL-4, IL-5, IL-10, and IL-13, which are important for the induction and development of humoral immune responses. IL-4 and IL-13 activate B-cell proliferation, Ig class-switching, and antibody production. Th2 cell-mediated inflammation is characterized by the presence of eosinophils and basophils, as well as extensive mast cell degranulation—a process dependent on cross-linking surface-bound IgE.24 IL-5 is a potent hematopoietic cytokine, which stimulates bone marrow production of eosinophils as well as activation and chemotaxis of eosinophils and basophils to affected tissue. In mice, Th2-cell deficiency profoundly increases susceptibility to Leishmania infection in skin. In humans, Th2 cells appear to play a critical role in the pathogenesis of atopic dermatitis (Chapter 44). A recent clinical trial with dupilumab, a fully human mAb that targets the IL-4 receptor-αα and blocks IL-4 and IL-13 signaling, improved atopic symptoms . Role of CD4+ T Cells in the Pathophysiology of Multiple Sclerosis Fumitaka Sato, ... Ikuo Tsunoda, in Multiple Sclerosis, 2016 Role of Th2 cells Th2 cells may play a protective role in MS, as Th2 immune responses have been shown to increase during remission in RRMS (Araki et al., 2003; Clerici et al., 2001). Decreased disease progression and exacerbation of MS during pregnancy have been associated with Th2-biased immune responses (Al-Shammri et al., 2004), although the exact mechanism remains unclear. Suppression of MS disease activities by immunomodulatory drugs, such as glatiramer acetate, has also been associated with enhanced Th2 immune responses (Weber et al., 2007). Experimentally, Th2 cells have been shown to regulate EAE and TMEV-IDD. In EAE induced with mouse spinal cord homogenate, injection of anti-IL-4 neutralizing mAb during the induction phase rendered resistant BALB/c mice susceptible to EAE (Constantinescu et al., 2001). The adoptive transfer of PLP-specific Th2 cell clones at the time of sensitization or disease onset prevented EAE in mice sensitized with PLP (Kuchroo et al., 1995). While T cell immunoglobulin mucindomain containing (TIM)2 has been shown to be preferentially expressed on the surface of Th2 cells and to negatively regulate Th2 immune responses, blockade of TIM-2/TIM-2 ligand interaction by administration of soluble TIM-2 fusion protein delayed the onset and decreased the severity of PLP-induced EAE by enhancing Th2 immune responses (Chakravarti et al., 2005). In TMEV-IDD, Th2 immune responses have also been demonstrated to suppress inflammatory demyelination in the CNS. Hill et al. (1998) demonstrated that during the early chronic phase of TMEV infection, infected mice treated with IL-4 developed less severe inflammatory demyelination compared with controls. Thus, the findings in EAE and TMEV-IDD suggest that Th1 cells could contribute to the pathogenesis of MS, while Th2 cells may play a protective role (Table 3). Cell-Mediated Defense against Infection Tobias M. Hohl, in Mandell, Douglas, and Bennett's Principles and Practice of Infectious Diseases (Eighth Edition), 2015 Th2 Cells Th2 cells express a range of cytokines that influence B-cell differentiation and antibody production, eosinophil recruitment, and mucus production. The signature cytokines produced by Th2 cells are IL-4, IL-5, and IL-13, but Th2 cells can also produce IL-9, IL-10, IL-25, and amphiregulin.20 Th2 responses are generated when naïve T cells are exposed to IL-4 at the time of T-cell priming. In the setting of low antigen concentrations, IL-4 can be produced by responding T cells.21 After antigenic challenge, IL-4 can also be produced by mast cells and basophils in the vicinity of T-cell priming.22,23 IL-4 signals naïve T cells via the STAT6 pathway to express GATA3, the master regulator of Th2 differentiation,24 a process that can be enhanced by IL-4– and STAT6-independent GATA3 activation,25 all of which drives the expression of additional downstream activators. Although Th2 cells are best known for causing or contributing to allergic diseases such as atopic dermatitis, allergic rhinitis, and asthma, Th2 cells also contribute to defense against infections, particularly helminth infections of the gastrointestinal tract.26 In this setting, eosinophil recruitment, IgE production, and mucus hypersecretion can enhance parasite expulsion in an IL-4 and IL-13 signaling–dependent manner, a notion that is supported by murine studies of Nippostrongylus brasiliensis infection.27,28 The secretion of amphiregulin by Th2 cells can stimulate intestinal epithelial cell proliferation and expulsion of Trichuris muris, a nematode that infects mice.29 Besides Th2 cells, tissue-resident and Th2 cytokine-secreting innate lymphoid cells represent a significant source of IL-13 during the early stages of parasitic infection and promote expulsion.30-32 Aberrant Th2 responses to pathogens that require IFN-γ and Th1 responses for control can result in progressive infections and lethality. For example, Leishmania major infection of certain mouse strains induces Th2 responses that result in progressive in vivo replication and host death.33,34 In contrast, mouse strains that respond to L. major with Th1 responses clear and survive experimental infections. The mechanisms that determine whether an L. major–specific T-cell response will be predominately Th1 or Th2 are complex.35 In some mouse strains, Th2 responses occur because of T-cell responses to one dominant antigen called LACK (Leishmania analogue of the receptors of activated C kinase).36 In the absence of a T-cell response to this specific antigen, the responding CD4+ T cells differentiate into Th1 cells. In humans, the type of disease associated with Mycobacterium leprae infection is also tied to CD4+ T-cell differentiation. Th1 differentiation is associated with tuberculoid leprosy, a paucibacillary infection in which IFN-γ–producing T cells enhance microbial killing. The induction of type I interferon and IL-10 signaling in innate immune cells during leprosy can antagonize IFN-γ–dependent protection.37 Th2 differentiation is associated with high tissue densities of M. leprae and more robust, but ineffective, antibody responses.38,39 T Cells and Their Effector Functions Ruben C. Fragoso, ... Steven J. Burakoff, in Encyclopedia of Cancer (Second Edition), 2002 IV.B.2 Th2 T Cells Th2 cells promote IgE production and eosinophil function, which are the key players in the pathogenesis of allergic inflammation and immunity against parasitic infections. Cytokines such as IL-4 and IL-5 released by Th2 cells stimulate, respectively, B-cell switching to the production of IgE antibody and activation of eosinophils. The coordinate actions of these effector mechanisms result in heightened immunity against, for example, helminthic parasites, which can be coated with IgE and destroyed by the toxic granular contents of eosinophils. The balance between Th1 and Th2 cells may serve to determine the outcome of an infection. The Th1-mediated response is an effective deterrent for the protozoan parasite Leishmania major. In strains of mice with a genetic predisposition to mount predominately Th2 responses, infection by L. major results in a severe cutaneous and systemic disease that cannot be eliminated effectively. In contrast, if mice were vaccinized with leishmania antigens coadministered with IL-12 to induce a Th1 response, the mice are protected from subsequent challenges with L. major. In an analogous manner, responses to Mycobacterium leprae in humans can have two sharply different outcomes depending on the polarization of Th cells. In lepromatous leprosy, a Th2-dominated response can result in diffuse and destructive lesions due to an ineffective response against M. leprae antigens. In contrast, patients who develop a strong Th1-mediated immunity have a less destructive disease called tuberculoid leprosy. T-Cell Immunity Shannon A. Carty, ... Gary A. Koretzky, in Hematology (Seventh Edition), 2018 Th2 Cells Th2 cells are critical for the immune response against extracellular parasites, such as helminths, through production of IL-4, IL-5, and IL-13. At initial sites of parasitic infection, epithelial cells of the target organs, including the skin, lungs, and intestines, and resident cells of the innate immune system sense parasite-derived products and produce Th2-inducing cytokines, including thymic stromal lymphopoietin (TSLP), IL-4, IL-25, and IL-33. These cytokines then act on innate immune cells, including basophils and DCs, as well as directly on naive CD4+ cells to promote Th2 differentiation. Recent work has provided insight into how cytokine signaling, particularly IL-4 signaling, promotes Th2 differentiation. Through interaction with its receptor, IL-4 activates STAT6. STAT6 plays a vital role in Th2 differentiation, as evidenced by the profound reduction in development of this lineage in Stat6-deficient mice. STAT6 activation leads to its nuclear translocation and subsequent induction of the transcription factor GATA3, which, like T-bet for Th1 cells, is considered the master regulator of Th2 differentiation. GATA3 regulates Th2 cytokine production by binding and activating the “Th2 locus,” which includes the genes encoding IL-4, IL-5, and IL-13. When GATA3 function is abrogated, Th2 differentiation is virtually absent both in vitro and in vivo. In mature differentiated Th2 cells, GATA3 deficiency results in loss of IL-5 and IL-13 production. GATA3 is both necessary and sufficient for Th2 differentiation because forced expression either by retroviral constructs or transgenic expression promotes Th2 differentiation and represses Th1 differentiation. Repression of Th1 development occurs at least partially through GATA3-dependent inhibition of STAT4, thus interfering with Ifng gene transcription. TCR signal strength also is involved in determining if a naive T cell will differentiate into a Th1 or Th2 cell. Studies in mice using altered peptide ligands that have decreased affinity for particular TCRs and experiments using limiting doses of antigen have demonstrated that diminished TCR stimulation promotes Th2 cell differentiation. Differences in costimulation also affect Th2 pathway differentiation. Mice deficient in CD28 or its ligand have a more pronounced defect in Th2 responses, suggesting that these molecules may play a greater role in promoting Th2 differentiation than Th1 differentiation. IL-4 produced by mature Th2 cells acts in a positive feedback loop to promote further Th2 cell differentiation in naive T cells as they encounter antigen. Th2-derived IL-4 also mediates IgE class switching in B cells. Soluble IgE binds to and crosslinks its high-affinity receptor FcεRI on basophils and mast cells, promoting production of histamine and serotonin as well as several cytokines, including IL-4, IL-13, and TNF-α. IL-5 produced from Th2 cells recruits eosinophils, whereas Th2-derived IL-13 promotes both the expulsion of helminths during parasitic infection and also the induction of airway hypersensitivity. Th2 responses are critical for immunity against extracellular parasites, but excessive Th2 responses are associated with the pathologic conditions of allergy and airway hypersensitivity. The increase in asthma in the developed world has been linked to an imbalance of Th subsets with skewing toward “Th2-ness” in the population. Additional work is necessary to more firmly establish a molecular immunologic link to the epidemiology of these diseases. Chronic Inflammation and Atherosclerosis Jan Nilsson, ... Andreas Edsfeldt, in Early Vascular Aging (EVA), 2015 Interleukin-10 Th2 cells, Tregs, B-cells, monocytes, and macrophages are all potential sources of IL-10. The anti-inflammatory effects of IL-10 are mediated by inhibition of T-cell proliferation, macrophage apoptosis, antigen presentation, collagenase expression, and inflammatory cytokine production. In mice, IL-10 deficiency is associated with increased inflammatory cell invasion, a greater plaque burden, and an increased inflammatory cytokine response [40]. Human studies on circulating IL-10 revealed that high plasma levels of IL-10 are associated with an improved outcome and a lower risk for recurrent events in patients with acute coronary syndromes [41,42]. Group 2 Innate Lymphoid Cells in the Regulation of Immune Responses Ben Roediger, Wolfgang Weninger, in Advances in Immunology, 2015 7.8 IL-4/IL-4Rα Like Th2 cells, ILC2 cells express a functional IL-4 receptor (Doherty et al., 2012; Motomura et al., 2014), at least in the lung, and have been shown to produce IL-13 and IL-9 in response to IL-4 in vitro (Motomura et al., 2014). IL-4 was also shown to augment IL-2-driven proliferation of ILC2 cells in vitro (Motomura et al., 2014), which may relate to the STAT6 dependency of ILC2 cell proliferation in vivo (discussed further below). Animal Models of Immunity to Female Genital Tract Infections and Vaccine Development Charu Kaushic, ... Kenneth W. Beagley, in Mucosal Immunology (Fourth Edition), 2015 Th2 Cells CD4+ Th2 cells do not protect against chlamydial infection (Wang et al., 1999; Yang, 2001; Hawkins et al., 2002) and can exacerbate pathology (Chen et al., 2010; Wang et al., 1999; Perry et al., 1997) because of suppression of Th1 immunity. However, activation of Th2 cells is important for the production of IgG and IgA, both of which reduce infection in vivo. Th2 cells also may act as regulators of the Th1 response to limit tissue pathology after resolution of infection (Debattista et al., 2003). Indeed, it has been suggested that a human vaccine to prevent ascending infection and tissue inflammation should aim to elicit primarily a Th2 response to limit collateral damage (Vicetti Miguel and Cherpes, 2012). This approach would certainly be contrary to the current dogma driving vaccine research (see below).
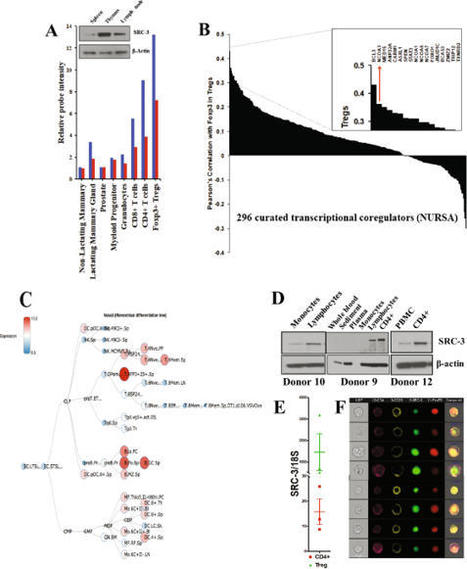
A subset of CD4 + lymphocytes, regulatory T cells (Tregs), are necessary for central tolerance and function as suppressors of autoimmunity against self-antigens. The SRC-3 coactivator is an oncogene in multiple cancers and is capable of potentiating numerous transcription factors in a wide variety of cell types. Src-3 knockout mice display broad lymphoproliferation and hypersensitivity to systemic inflammation. Using publicly available bioinformatics data and directed cellular approaches, we show that SRC-3 also is highly enriched in Tregs in mice and humans. Human Tregs lose phenotypic characteristics when SRC-3 is depleted or pharmacologically inhibited, including failure of induction from resting T cells and loss of the ability to suppress proliferation of stimulated T cells. These data support a model for SRC-3 as a coactivator that actively participates in protection from autoimmunity and may support immune evasion of cancers by contributing to the biology of Tregs.
Clinical MedicineCOVID-19 Open Access | 10.1172/jci.insight.142167 High levels of SARS-CoV-2–specific T cells with restricted functionality in severe courses of COVID-19 David Schub,1 Verena Klemis,1 Sophie Schneitler,2 Janine Mihm,3 Philipp M. Lepper,4 Heinrike Wilkens,4 Robert Bals,4 Hermann Eichler,5 Barbara C. Gärtner,2 Sören L. Becker,2 Urban Sester,3 Martina Sester,1 and Tina Schmidt1 First published September 16, 2020 - More info Abstract BACKGROUND. Patients infected with severe acute respiratory syndrome coronavirus 2 (SARS-CoV-2) differ in the severity of disease. We hypothesized that characteristics of SARS-CoV-2–specific immunity correlate with disease severity. METHODS. In this study, SARS-CoV-2–specific T cells and antibodies were characterized in uninfected controls and patients with different coronavirus disease 2019 (COVID-19) disease severity. SARS-CoV-2–specific T cells were flow cytometrically quantified after stimulation with SARS-CoV-2 peptide pools and analyzed for expression of cytokines (IFN-γ, IL-2, and TNF-α) and markers for activation, proliferation, and functional anergy. SARS-CoV-2–specific IgG and IgA antibodies were quantified using ELISA. Moreover, global characteristics of lymphocyte subpopulations were compared between patient groups and uninfected controls. RESULTS. Despite severe lymphopenia affecting all major lymphocyte subpopulations, patients with severe disease mounted significantly higher levels of SARS-CoV-2–specific T cells as compared with convalescent individuals. SARS-CoV-2–specific CD4+ T cells dominated over CD8+ T cells and closely correlated with the number of plasmablasts and SARS-CoV-2–specific IgA and IgG levels. Unlike in convalescent patients, SARS-CoV-2–specific T cells in patients with severe disease showed marked alterations in phenotypical and functional properties, which also extended to CD4+ and CD8+ T cells in general. CONCLUSION. Given the strong induction of specific immunity to control viral replication in patients with severe disease, the functionally altered characteristics may result from the need for contraction of specific and general immunity to counteract excessive immunopathology in the lung. FUNDING. The study was supported by institutional funds to MS and in part by grants of Saarland University, the State of Saarland, and the Rolf M. Schwiete Stiftung. Introduction Coronavirus disease 2019 (COVID-19), the disease caused by severe acute respiratory syndrome coronavirus 2 (SARS-CoV-2), can be asymptomatic or mild but also includes severe disease manifestations, such as acute respiratory distress syndrome, which can lead to multi-organ failure and death despite intensive medical treatment. The mortality rate is particularly high in older individuals and in patients with preexisting lung, heart, or immunodeficiency diseases (1, 2). Studies have shown that SARS-CoV-2 infection causes global changes in cellular immunity, mainly characterized by lymphopenia, skewed distribution of T cell subpopulations, and high plasma concentrations of proinflammatory cytokines (2, 3). In addition, T cell functionality appears to be altered as shown by impaired expression of IFN-γ (4–6). So far, mainly nonspecific general changes in the number and functionality of blood cells have been described, whereas specific T cell immunity directed against SARS-CoV-2 has as yet not been studied as extensively (7–11), especially in patients with different disease severity. It seems reasonable to suggest that the individual course of a SARS-CoV-2 infection depends on the induction and functionality of the adaptive immunity including both antibodies and T cells. Seroconversion in patients with COVID-19 does not seem to be delayed, because SARS-CoV-2–specific IgM and IgA antibodies are induced early after the onset of symptoms after a median of 5 days, while the median time for IgG seroconversion is 14 days (12–14). Thus far, it remains to be elucidated whether patients with different disease manifestations differ in the levels and functionality of SARS-CoV-2–specific T cells or antibodies. We have previously shown that symptomatic infections with persistent pathogens are associated with alterations in pathogen-specific T cell levels and impaired functionality as compared with individuals with successful immune control (15–20). Based on these observations, we hypothesized that T cells induced against SARS-CoV-2 may differ in quantity and functionality depending on the severity of symptoms of COVID-19. Moreover, we hypothesized that antigen-specific T cell characteristics may affect B cell subpopulations and SARS-CoV-2–specific antibodies. We therefore recruited 2 groups of patients who were similar in the time elapsed since onset of clinical symptoms. One group included hospitalized patients with a severe course of disease, whereas a second group comprised convalescent individuals who had mild disease manifestations and who completely recovered from SARS-CoV-2–related symptoms mainly in an outpatient setting. Results Study population. In this study, 50 patients with COVID-19 were included at a median of 42.5 (IQR 16.5) days after onset of symptoms. Among those, 14 were critically ill patients (64.3 ± 8.2 years) hospitalized in the intensive care unit (“ICU patients”), whereas 36 individuals (42.2 ± 13.6 years) had recovered from COVID-19 in an outpatient setting (“convalescent patients”) with no or mild remaining symptoms at the time of analysis: cough (n = 3), rhinitis (n = 2), myalgia (n = 2), and anosmia (n = 7). Both groups did not differ in the median time after onset of symptoms at the time of analysis (ICU patients: 40.0 [IQR 15.0] days; convalescent patients: 43.5 [IQR 16.5]) days; P = 0.37). Ten individuals without evidence for SARS-CoV-2 infection were recruited as negative controls (48.1 ± 11.4 years). The demographic and clinical characteristics of patients and controls are shown in Table 1. As expected, ICU patients were significantly older as compared with the other groups (P < 0.0001). Cardiovascular disease (10/14 ICU patients) and metabolic diseases (7/14 ICU patients, especially obesity) were the most common comorbidities in ICU patients. Median time from symptom onset to hospital admission was 5 (IQR 5.5) days and 7 (IQR 6) days to ICU admission. Eleven patients were mechanically ventilated, of which 7 were additionally treated with extracorporeal membrane oxygenation, and 7 received renal replacement therapy. Therapeutic drug regimens included hydroxychloroquine and azithromycin in 11 cases, 1 patient received tocilizumab, 1 patient received icatibant, and 2 patients underwent a 3-day course of high-dose steroid treatment. Viral load determinations were not performed for all patients on a regular schedule. Information on the duration of viral encounter was given in 8 patients, where at least 2 subsequent test results documented a median of up to 19.5 days (range 6–34 days) of continuous PCR positivity. Three patients died 8, 15, and 16 days after analysis, of which 1 still was SARS-CoV-2 PCR positive. Twelve out of 14 ICU patients became SARS-CoV-2 PCR negative during the hospital stay, with 11 patients known to have a first negative test result at least 8 days before the blood sampling (median 9 days; range 8–28 days). PCR results on follow-up were not available for 1 patient who was readmitted to the primary care hospital after the end of mechanical ventilation and clinical stabilization. SARS-CoV-2 PCR was performed in 33/36 convalescent patients after quarantine, and all tests were negative. Table 1 Demographic and clinical characteristics of the study population Altered counts of leukocytes and lymphocyte subpopulations in patients with severe COVID-19. Leukocyte numbers and differential white blood cell counts showed substantial differences between ICU patients and convalescent individuals, with increased levels of neutrophils and severe lymphopenia as the most prominent findings (Table 1). In contrast, convalescent individuals had similar levels as controls (Table 1). A more detailed analysis of lymphocytes and their subpopulations was performed from whole blood using flow cytometry. Absolute cell counts were calculated based on differential blood counts. As shown in Figure 1, lymphopenia affected all major lymphocyte subpopulations, such as NK cells, B cells, and T cells, including CD4+ and CD8+ T cells and Tregs. Figure 1 Reduced counts of lymphocytes and lymphocyte subpopulations in patients with severe COVID-19. Absolute cell numbers per microliter whole blood of lymphocytes and lymphocyte subpopulations were calculated in SARS-CoV-2–negative individuals (n = 10), patients with severe COVID-19 (n = 14), and convalescent patients (n = 21) based on flow cytometry and differential blood counts. Flow cytometry data were obtained from all convalescent patients, but 15/36 had to be excluded because no differential blood count was available. Natural killer (NK) cells were defined as CD3−CD16+/CD56+, B cells as CD19+, T cells as CD3+, CD4+ and CD8+ T cells as CD4+CD8− and CD8+CD4− T cells, and regulatory T cells (Tregs) as CD4+CD25hiCD127lo within lymphocytes, respectively. Bars represent medians with IQRs. Differences between the groups were calculated using Kruskal-Wallis test and Dunn’s posttest. **P < 0.01, ***P < 0.001, ****P < 0.0001. Significantly higher percentages of SARS-CoV-2–specific T cells in patients with severe COVID-19. To identify specific immunity against SARS-CoV-2, whole-blood samples were stimulated with overlapping peptide pools covering the major SARS-CoV-2 structural spike protein (spike N and C-terminal peptide sets, respectively), the nucleocapsid (NCAP) protein, the membrane protein VME1, and the envelope small membrane protein VEMP. Stimulation was carried out for 6 hours, and antigen-specific T cells were identified by intracellular staining of cytokines (IFN-γ, IL-2, and TNF-α) among activated CD69+ CD4+ and CD8+ T cells. Stimulation with Staphylococcus aureus enterotoxin B (SEB) allowed assessment of polyclonal T cell responses. DMSO was used to control for background reactivity, which was subtracted from specific stimulations. To characterize response patterns of stimulation-induced CD4+ and CD8+ T cells toward the various peptide pools, we first focused on IFN-γ+ T cells because IFN-γ is the most specific and readily induced in T cells toward a variety of clinically relevant pathogens (16, 17, 21). A typical set of contour plots from a hospitalized patient illustrating induction of SARS-CoV-2–specific T cell reactivity among CD4+ and CD8+ T cells is shown in Figure 2A. When analyzing all individuals, CD4+ T cell frequencies were highest after stimulation with spike N and VME1, followed by spike C and NCAP, whereas reactivity toward the smallest protein, VEMP, was largely absent. Antigen-specific CD8+ T cell levels were generally lower, with the most pronounced reactivity after stimulation with spike N and NCAP. In contrast, spike C, VME1, or VEMP elicited only modest or no reactivity with no difference between infected and noninfected groups (Figure 2B). When comparing antigen reactivity in the 3 groups, significantly higher levels of SARS-CoV-2–specific CD4+ T cells were found in both infected patient groups as compared with negative controls, who were largely nonresponsive (Figure 2B). A difference between infected and noninfected individuals was also observed for CD8+ T cells reacting toward spike N or NCAP, whereas CD8+ T cell reactivity toward the remaining peptide pools was equally low in both infected and noninfected groups (Figure 2B). Interestingly, among convalescent patients, individuals with lower respiratory symptoms, such as cough or dyspnea (n = 19), had significantly higher median levels of SARS-CoV-2–specific CD4+ T cells (0.16%, IQR 0.17%) than individuals without these symptoms (n = 17; 0.08%, IQR 0.127%; P = 0.015; data not shown). Figure 2 Increased percentages of SARS-CoV-2–specific T cells in patients with severe COVID-19. Whole-blood samples were stimulated with overlapping peptide pools spanning the SARS-CoV-2 spike protein (spike N, N-terminal; spike C, C-terminal), the NCAP protein, the membrane protein VME1, and the envelope small membrane protein VEMP. Stimulations with DMSO and SEB served as negative controls and polyclonal stimulus, respectively. (A) Contour plots illustrating specific immunity from a 56-year-old hospitalized patient are shown. Numbers indicate percentage of reactive (CD69+IFN-γ+) cells within total CD4+ and CD8+ T cells. (B) Percentages of CD4+ and CD8+ T cells specific for the different SARS-CoV-2 antigens were compared between SARS-CoV-2–negative individuals (negative, n = 10), patients with severe COVID-19 (ICU, n = 14), and convalescent patients (n = 36). (C) Total percentages of SARS-CoV-2–specific (CD69+IFN-γ+) T cells, determined by the sum of frequencies toward the individual peptide pools for each individual, and SEB-reactive T cell frequencies are compared between the 3 groups. Bars represent medians with IQRs. Differences between the groups were calculated using Kruskal-Wallis test and Dunn’s posttest. *P < 0.05, **P < 0.01, ***P < 0.001, ****P < 0.0001. To obtain an estimate of the total levels of SARS-CoV-2–specific T cells in each group, SARS-CoV-2–specific T cell frequencies toward the individual peptide pools were added up for each individual (Figure 2C). This showed that patients with a severe course had the highest levels of SARS-CoV-2–specific CD4+ T cells (0.48%, IQR 0.37%), which not only differed from negative controls (0.01%, IQR 0.01%) but also differed from convalescent individuals (0.13%, IQR 0.18%; P < 0.0001). This contrasts with polyclonal SEB-reactive CD4+ T cell frequencies, which were significantly lower in ICU patients (1.77%, IQR 1.76%) as compared with controls (3.97%, IQR 2.15%) or convalescent patients (5.06%, IQR 5.07%, P = 0.0001, Figure 2C). Likewise, total levels of SARS-CoV-2–specific CD8+ T cells were significantly higher in patients than in noninfected controls (P = 0.023), whereas the difference between ICU patients and convalescent patients did not reach statistical significance. Unlike in CD4+ T cells, SEB-reactive CD8+ T cell levels were similar among the 3 groups (P = 0.244). SARS-CoV-2–specific CD8+ T cell levels inversely correlated with time since onset of clinical symptoms (r = –0.37, P = 0.01), whereas this was not significant for specific CD4+ T cells (P = 0.1; Supplemental Figure 1; supplemental material available online with this article; https://doi.org/10.1172/jci.insight.142167DS1). Taken together, despite strong lymphopenia affecting both CD4+ and CD8+ T cells, and lower levels of polyclonal SEB-reactive CD4+ T cells, patients with severe COVID-19 were capable of mounting high levels of SARS-CoV-2–specific T cells. Restricted functionality of SARS-CoV-2–specific CD4+ T cells in patients with a severe course of COVID-19. To characterize the functionality of SARS-CoV-2–specific T cells in more detail, their cytokine expression profile regarding IFN-γ, IL-2, and TNF-α was analyzed using flow cytometry. Representative contour plots showing cytokine expression profiles after stimulation with the antigens are shown in Supplemental Figure 2. Boolean gating of activated CD69+ T cells resulted in assessment of 7 subpopulations of cells producing all 3 cytokines, 2 cytokines, or 1 cytokine only. As with results shown from IFN-γ+ subpopulations (Figure 2C), the total percentage of SARS-CoV-2–specific CD4+ T cells producing any of the 3 cytokines was also highest among ICU patients (P < 0.0001), with a trend also observed for specific CD8+ T cells (P = 0.055, Supplemental Figure 3). We then further characterized SARS-CoV-2–reactive CD4+ T cells for their cytokine expression profiles. All cytokine-positive cells were set to 100% in each individual and assessed for distribution of the 7 subpopulations. As shown in Figure 3A, the percentage of multifunctional, SARS-CoV-2–specific CD4+ T cells with the ability to simultaneously produce all 3 cytokines was significantly lower in patients with severe courses as compared with convalescent individuals. This was associated with a concomitant higher expression of cells simultaneously producing IL-2 and TNF-α. The same analysis was performed for cytokine-positive SEB-reactive CD4+ T cells. Both their magnitude (Supplemental Figure 3) and their cytokine profile were different from those of SARS-CoV-2–specific cells. Nevertheless, the SEB-reactive and SARS-CoV-2–specific cytokine profiles exhibited similar differences between patients with severe disease and convalescent individuals (Figure 3A). In addition, the cytokine expression profile of SEB-reactive CD4+ T cells in convalescent individuals did not differ from SARS-CoV-2–noninfected controls (data not shown). This indicates that patients with severe disease have a restricted cytokine expression profile with lower percentages of multifunctional cells simultaneously producing all 3 cytokines. Unlike in convalescent patients, this restricted expression profile also extends to polyclonal T cells in general. Figure 3 Altered cytokine profiles and characteristics of SARS-CoV-2–specific T cells in patients with a severe course of COVID-19. Expression patterns of SARS-CoV-2–specific T cells were determined from combined T cells reacting to the individual peptide pools for each individual. (A) SARS-CoV-2–specific and SEB-reactive CD4+ T cells were divided into 7 subpopulations according to their expression of the cytokines IFN-γ, IL-2, and TNF-α. Distribution of these subgroups was compared between ICU patients and convalescent patients. To ensure robust statistical analysis, cytokine profiling was restricted to CD4+ T cells and to all samples with at least 35 measurable CD69+IFN-γ+ cells (all ICU patients and 20 convalescent patients). (B) CTLA-4 expression of SARS-CoV-2–specific and SEB-reactive CD4+ and CD8+ T cells was compared between ICU patients and convalescent patients. Analysis was restricted to individuals with sufficient SARS-CoV-2–specific immunity, i.e., where the total number of measurable CD69+IFN-γ+ cells reached at least 20 cells (n = 13 and 3 ICU patients and 17 and 18 convalescent patients for CD4+ and CD8+ T cells, respectively). (C) In a subgroup of 10 patient samples (5 ICU patients and 5 convalescent patients), where a larger sample volume for in vitro stimulations was available, expression of PD-1, Ki67, and granzyme B of SARS-CoV-2–specific and SEB-reactive CD4+ and CD8+ T cells was analyzed. Overlaid contour plots (built using BD FACSDiva 8) of samples from a 31-year-old convalescent patient stimulated with SARS-CoV-2 antigens are shown in the upper panel. PD-1 MFI was analyzed from all stimulatory reactions with at least 20 CD69+IFN-γ+ cells (n = 8 and 4 for CD4+ and CD8+ T cells, respectively). Analysis of intranuclear presence of Ki67 (%Ki67+) and expression of granzyme B (%granzyme B+) was restricted to samples with at least 20 specific CD4+ (n = 8 for SARS-CoV-2 and n = 7 for SEB) or CD8+ T cells (n = 4), respectively. ICU patients are depicted by dark symbols and convalescent patients by light symbols. Bar charts in A represent mean and SD, and differences between the 2 groups were assessed using unpaired 2-tailed t test. Bars in B and C represent medians with IQRs. Differences between the groups were calculated using Mann-Whitney U test. *P < 0.05, **P < 0.01, ***P < 0.001, ****P < 0.0001. MFI, median fluorescence intensity. We also analyzed expression of cytotoxic T lymphocyte antigen 4 (CTLA-4) on SARS-CoV-2–specific and SEB-reactive T cells as phenotypical correlates of altered functionality commonly observed during active infections. This showed that SARS-CoV-2–specific CD4+ T cells from ICU patients had significantly higher expression levels of CTLA-4 than from convalescent patients (P = 0.035), which also held true for SEB-reactive CD4+ T cells (P < 0.0001, Figure 3B). Although the total number of patients with measurable SARS-CoV-2–reactive CD8+ T cells was lower, a similar trend was found for SARS-CoV-2–reactive or SEB-reactive CD8+ T cells (Figure 3B). Finally, a subset of 10 SARS-CoV-2–infected patients (5 hospitalized, 5 convalescent patients) was studied to further characterize SARS-CoV-2–specific CD4+ and CD8+ T cells for expression of programmed cell death 1 (PD-1), Ki67, and granzyme B, with contour plots shown in Figure 3C. This analysis was restricted to samples with sufficient amounts of detectable SARS-CoV-2–specific T cells. PD-1 expression levels and the percentage of Ki67+ cells were higher on SARS-CoV-2–specific CD4+ T cells than on polyclonal SEB-reactive CD4+ T cells. Likewise, although the number of individuals with sufficient numbers of SARS-CoV-2–specific CD8+ T cells was lower, some individuals had Ki67-expressing CD8+ T cells; a large fraction of SARS-CoV-2–specific CD8+ T cells expressed granzyme B, which was lower among SEB-reactive T cells (Figure 3C). Altered characteristics of global CD4+ and CD8+ T cells in patients with severe COVID-19. Because cytokine expression patterns and CTLA-4 expression in patients with severe courses were altered in both SARS-CoV-2–specific and SEB-reactive T cells, these alterations may also extend to T cells in general. To analyze bulk T cells in more detail, expression of CTLA-4 and PD-1, as well as Ki67+ cells, were analyzed directly from whole blood without prior stimulation, with representative contour plots shown in Figure 4A. As shown from MFIs in Figure 4B, both CD4+ and CD8+ T cells from ICU patients showed markedly increased expression of CTLA-4 and PD-1 as compared with controls, whereas respective expression in convalescent individuals was lower and similar to in controls. The same conclusion was reached if the percentage of CTLA-4– or PD-1–expressing cells was analyzed (Supplemental Figure 4). Interestingly, the percentage of recently proliferated Ki67+ CD4+ and CD8+ T cells was significantly higher in patients with a severe course as compared with controls and convalescent individuals. Figure 4 Altered characteristics of global CD4+ and CD8+ T cells in patients with severe COVID-19. (A) Representative contour plots showing expression of CTLA-4 and PD-1 and intranuclear Ki67 expression of unstimulated total CD4+ and CD8+ T cells from an ICU patient and a convalescent individual. Because cells showed a continuum in the expression of CTLA-4 and PD-1, cell surface expression levels of CTLA-4 and PD-1 were expressed as MFI. Numbers indicate expression levels (MFI) of CTLA-4 and PD-1 and percentage of Ki67+ cells among total CD4+ and CD8+ T cells. (B) Results were compared among SARS-CoV-2–negative individuals (negative, n = 10), patients with severe COVID-19 (ICU, n = 14), and convalescent patients (n = 36). Bars represent medians with IQRs. Differences between the groups were calculated using Kruskal-Wallis test and Dunn’s posttest. *P < 0.05, **P < 0.01, ***P < 0.001, ****P < 0.0001. Strong correlation of SARS-CoV-2–specific CD4+ T cell levels with specific IgG and IgA antibodies and plasmablasts. To comparatively analyze cellular and humoral immunity against SARS-CoV-2, specific IgA and IgG antibodies were determined using ELISA. As shown in Figure 5A, all individuals with severe courses were positive for SARS-CoV-2–specific IgG and IgA. Interestingly, their levels were significantly higher than those of convalescent individuals, among whom only 83% (30/36 patients) had positive IgG and 69% (25/36 patients) had IgA above the detection limit. Intermediate IgA and IgG titers were found in 2 individuals each. SARS-CoV-2–negative controls did not show any specific IgG or IgA. In line with the role of CD4+ T cells in providing help for induction of humoral immunity, the percentage of SARS-CoV-2–specific CD4+ T cells showed a significant correlation with both specific IgG (r = 0.77, P < 0.0001) and IgA antibodies (r = 0.67, P < 0.0001), whereas no correlation was observed with specific CD8+ T cells (P = 0.78 for IgG; P = 0.52 for IgA, Figure 5B). To elucidate whether the observed differences in specific antibody levels were related to differences in B cells among the groups, we analyzed CD19+ B cell subpopulations by their expression of IgD and CD27, with contour plots of a 64-year-old hospitalized patient shown in Figure 5C. As with B cell lymphopenia in general (Figure 1), the numbers of naive (IgD+CD27–), non-switched memory (IgD+CD27+), and switched memory B cells (IgD–CD27+) were significantly lower in patients with a severe course (Figure 5C). Interestingly, however, the number of plasmablasts, which were identified as CD38+ switched memory B cells, was significantly higher than in controls or convalescent patients. In line with the central role of plasmablasts in initiating antibody production, their numbers showed a strong correlation with both IgG (r = 0.53, P = 0.0014) and IgA antibody levels (r = 0.54, P = 0.0013, Figure 5D). Figure 5 Strong correlation of SARS-CoV-2–specific CD4+ T cell levels with specific IgG and IgA antibodies and plasmablasts. (A) Levels of SARS-CoV-2–specific IgG and IgA were compared among SARS-CoV-2–negative individuals (negative, n = 10), patients with severe COVID-19 (ICU, n = 14), and convalescent patients (n = 36). (B) Correlation between levels of SARS-CoV-2–specific IgG or IgA with frequencies of SARS-CoV-2–specific CD69+IFN-γ+ CD4+ or CD8+ T cells expressed in patients with SARS-CoV-2. (C) Representative contour plots of a 64-year-old hospitalized patient showing the differentiation status of B cells characterized by surface expression of IgD and CD27, with plasmablasts identified among switched memory B cells by additional staining of CD38. Numbers of B cell subpopulations and plasmablasts were compared between groups, and (D) plasmablasts were correlated with levels of SARS-CoV-2–specific IgG and IgA. Antibody levels were determined semiquantitatively by dividing the optical density of an individual sample by that of a positive control serum. Bars in A and C represent medians with IQRs. Differences between the groups were calculated using Kruskal-Wallis test and Dunn’s posttest. *P < 0.05, **P < 0.01, ***P < 0.001, ****P < 0.0001. Correlations in B and D were analyzed according to Spearman. Dotted lines indicate detection limits for IgG and IgA, indicating negative, intermediate, and positive levels, respectively, as per manufacturer’s instructions. Discussion Manifestation of SARS-CoV-2 infections may range from asymptomatic infections or mild symptoms to severe courses of disease with a high risk of fatal outcome (2). In this study, we show that SARS-CoV-2–specific immunological characteristics in patients with a severe course are clearly distinct from infected individuals who recovered from mild disease that could be managed in an outpatient setting. Both groups were analyzed at the same time after onset of COVID-19 symptoms. As main findings, we show that patients with severe disease had high levels of SARS-CoV-2–specific CD4+ and CD8+ T cells as well as high titers of specific IgG and IgA antibodies as compared with convalescent individuals, where levels were significantly lower. However, SARS-CoV-2–specific T cells in severe cases had a restricted cytokine expression profile with fewer multifunctional cells and strongly expressed CTLA-4 as a hallmark of T cells in the contraction phase of an immune response after active encounter with the virus. In contrast, convalescent individuals who had recovered from mild or moderate disease had lower levels of SARS-CoV-2–specific humoral and cellular immunity, and antigen-specific T cells showed fewer signs of functional alterations. Finally, differences between the infected patient groups were also found for major lymphocyte subpopulations, such as B cells, NK cells, Tregs, and CD4+ and CD8+ T cells. Apart from severe lymphopenia, CD4+ and CD8+ T cells from patients with severe COVID-19 exhibited increased expression of CTLA-4 and PD-1 and a high expression of Ki67 as a marker for recent proliferation. In addition, the percentage of cells responding after polyclonal stimulation was lower and restricted in functionality. In contrast, lymphocyte characteristics from convalescent individuals were similar as in noninfected controls. Taken together, this indicates that the severity of clinical disease in patients with COVID-19 is not only associated with prominent changes in the innate immune system but also characterized by a marked alteration of adaptive humoral and cellular immunity that includes both SARS-CoV-2–specific and global T cell function. Up to now, only few studies have described SARS-CoV-2–specific T cells in patients with COVID-19 (7–11, 22). With results from our study, key characteristics of SARS-CoV-2–specific T cells emerge. SARS-CoV-2–reactive T cells exhibit immediate effector function with proliferative potential, and expression of IFN-γ, IL-2, and TNF-α, which suggests a Th1 phenotype. This is supported by results from supernatants of stimulated peripheral blood mononuclear cells showing detectable IFN-γ, IL-2, and TNF-α and low levels of IL-5, IL-13, IL-9, IL-10, and IL-22 (7, 11). Reactive T cells exist among both CD4+ and CD8+ T cells, and CD8+ T cells were able to produce effector molecules such as granzyme B, and evidence of perforin and CD107a expression was recently found (10). In line with other reports (8, 10, 11), SARS-CoV-2–specific CD4+ T cell levels were higher than those of CD8+ T cells. Unlike CD4+ T cells, specific CD8+ T cell levels inversely correlated with time after onset of symptoms, which may reflect higher stability of CD4+ T cells. Alternatively, antigen-specific CD8+ T cells might have been recruited to the lungs as the site of massive SARS-CoV-2 replication because signatures for clonally expanded CD8+ T cells were found in bronchoalveolar lavage samples of patients with SARS-CoV-2–associated lung disease (23). Previous studies show that SARS-CoV-2–specific T cell levels differ in infected and noninfected individuals (7–11, 22). Our results suggest that SARS-CoV-2–specific CD4+ T cells allowed for a better distinction not only of noninfected and infected individuals but also of patients with different severity of disease. This distinction may further be improved using immunodominant peptides for stimulation. So far, a relative immunodominance of the spike protein has been described (8, 11, 22). This was also observed in our study, but the 4 viral structural proteins differed in their ability to induce specific immunity among CD4+ and CD8+ T cells. The VEMP protein elicited hardly any reactivity, which may be related to its small size and its relatively low abundance in the virus particle (24). Reactive CD4+ T cells were found toward all other proteins with a dominance of the spike and the VME1 proteins. Interestingly, apart from the N-terminal portion of the spike protein, CD8+ T cells showed pronounced reactivity toward the NCAP protein. NCAP may be more readily processed to be presented in MHC class I molecules because of its predominant localization in the cytoplasm, whereas all other membrane proteins are directly assembled in the ER membrane (25). It was striking that patients with severe courses of disease had significantly higher levels of both SARS-CoV-2–specific antibodies and T cells as compared with convalescent patients, which is in line with recent observations (10). Because all analyses were performed in a short time frame after onset of symptoms, we consider it unlikely that antibody and T cell levels in convalescent individuals had been similarly high during active viral replication and had decreased after successful control of infection. Instead, the levels of specific humoral and cellular immunity needed to control viral replication may be directly related to the viral load during primary infection. Thus, patients with a severe course may have required induction of higher levels of specific immunity. Whether this may be due to potentially higher viral load or prolonged periods of active viral replication needs further study with regular sampling. So far it is known that infection efficiency is high in nasal epithelial cells of the upper airways and decreases in epithelial cells of the lower respiratory tract along an angiotensin converting enzyme 2 receptor gradient (26). Therefore, viral replication may remain restricted to the upper airway in the majority of infected individuals with mild symptoms. Further seeding of virus to the lung may be favored by high viral load in the upper airways with subsequent microaspiration events that are more frequent in patients at risk for severe courses of COVID-19, such as elderly people or individuals with diabetes or obesity. Thus, lower viral load with local restriction to the upper airways may require less pronounced specific immunity as compared with higher viral load and/or further dissemination of the virus to the lower respiratory tract. This may be supported by our observation that SARS-CoV-2–specific CD4+ T cell levels showed significant differences among convalescent individuals with or without symptoms of the lower respiratory tract (cough and dyspnea) (P = 0.015). The induction of specific immunity may further be modulated by preexisting cross-reactive immunity against common cold coronaviruses. This is illustrated by influenza vaccine studies, where preexisting immunity against influenza is associated with a less pronounced induction of vaccine-specific immunity as compared with influenza-naive subjects (27, 28). Evidence for cross-reactive immunity also exists among coronaviruses. In our study, very low levels of SARS-CoV-2–reactive T cells were in part detectable among control subjects without SARS-CoV-2 infection. However, as shown in recent studies using longer stimulation times, evidence for cross-reactive T cells is found in 20% to up to 50% of noninfected controls (8–11). Based on a variety of clinically relevant pathogens, the quantity and the characteristics of antigen-specific T cells have been shown to differ in relation to the pathogen activity in the context of primary infections or reactivations. As exemplified for immunity against cytomegalovirus, varicella zoster virus, HIV, or mycobacteria, T cells induced by primary infection or reactivation during active encounter with the pathogen show a low percentage of multifunctional cells and increased expression of inhibitory surface receptors such as CTLA-4 or PD-1, whereas the expression of these molecules decreases with successful control of the pathogen (15–18, 21, 29). In this respect, the lower CTLA-4 expression levels on SARS-CoV-2–specific T cells of convalescent individuals are compatible with successful viral control, whereas the increased expression of CTLA-4 on SARS-CoV-2–specific T cells in patients with severe disease may result from a prolonged and more intense encounter with the virus. Consistent with primary induction, specific T cells had a restricted cytokine pattern with a low percentage of multifunctional cells and a relative dominance of single or dual cytokine-producing cells expressing IL-2, which is different from reactivations, where the loss in multifunctional cells is associated with a shift toward cells exclusively expressing IFN-γ (18, 30). Although this functional profile of SARS-CoV-2–specific T cells in patients with severe disease has several characteristics of an exhausted phenotype found in patients with symptomatic disease in the context of chronic infections and/or reactivations, exhaustion is frequently associated with a quantitative decrease in specific T cells (15, 17). In contrast, our patients were able to mount a strong adaptive T cell response with proliferative potential, and the majority of patients achieved control of viral replication. Therefore, the high expression levels of CTLA-4 and the restricted functionality may reflect a physiological contraction mechanism to downregulate immune hyperactivation and specific immunity after its strong induction and to compensate for excessive immunopathology in the lung. This process appears to have notable effects on lymphocyte subpopulations and their functional characteristics in general, which show the same pattern of inhibitory surface receptors and functional restriction and thereby may account for an increased susceptibility for other opportunistic infections in patients with severe COVID-19 (31, 32). As with SARS-CoV-2–specific T cells, specific antibody responses were also highest in patients with severe disease. Interestingly, despite severe B cell lymphopenia that affected all major subpopulations, the increased antibody levels showed a direct correlation with the number of circulating plasmablasts, which were significantly higher than in convalescent patients and noninfected controls. Because high antibody responses were shown to correlate with neutralization capacity, this may directly contribute to viral clearance (13, 14, 33). However, given the association with disease severity, further studies should address whether antibodies may also contribute antibody-dependent enhancement of viral entry into Fc receptor–expressing cells, such as macrophages, thereby leading to increased inflammation and lung injury (34). Our study is limited by a low sample size, especially regarding some parameters that were analyzed in a subset of patients only. Nevertheless, differences in general as well as antigen-specific immunity between the 2 patient groups are very pronounced and correlate well with the severity of the disease. Moreover, we did not perform any longitudinal analyses of specific T cells and antibodies to evaluate whether the levels of specific immunity during primary infection determined stability and protection in the long term. Data on SARS-CoV-1–specific immunity indicated that both antibodies and T cells were detectable for several years, with highest stability in patients with more severe disease (35, 36). Similar studies with larger sample sizes are needed to evaluate whether the more pronounced immunity in patients with severe COVID-19 may result in higher stability after recovery and better protection from reinfection with SARS-CoV-2 in the long term. Knowledge gained from this study may have implications for vaccine design and therapeutic management. Our study revealed an immunodominance of specific T cells toward the spike protein as the main vaccine target. In addition, other viral proteins may represent promising antigens to achieve a broad vaccine-induced T cell response comparable to natural infection. Up to now, the role of immunosuppressive drugs for treatment of COVID-19 has been controversially discussed (37). Our results show that patients with severe disease mount a particularly strong cellular and humoral immune response. Although this immune response seems to be efficient in controlling viremia, contraction is required to prevent immunopathology associated with a hyperactive immune system. It is therefore tempting to speculate that immunosuppressive drugs are harmful when given in the induction phase but may have particular benefit in the contraction phase of the immune response. Data emerging from the RECOVERY Trial indeed provide first evidence for a particular survival benefit of dexamethasone treatment in ventilated patients with severe disease (38). Methods Study design and patient population. Patients who were hospitalized with PCR-confirmed COVID-19 (ICU patients) and patients with a milder course of disease in an outpatient setting were recruited, who had been matched with ICU patients according to the time since onset of clinical symptoms. In addition, individuals without evidence for infection with SARS-CoV-2 were tested as negative controls. ICU patients were recruited within the CORSAAR study, a cohort study on patients with COVID-19. Information on clinical symptoms was derived from patient charts or collected based on a questionnaire. Blood samples (4.7 mL) were collected in lithium heparin–containing tubes, and all analyses of antigen-specific T cells and lymphocyte subpopulations were carried out within 24 hours. Antibody testing was performed using frozen plasma samples. Quantitation of lymphocyte populations. Quantitation and characterization of lymphocyte subpopulations were performed on 100 μL of heparinized whole blood as described before (39) using monoclonal antibodies against CD3 (clone SK7), CD4 (clone SK3), CD8 (clones RPA-T8 and SK1), CD16 (clone 3G8), CD19 (clone HIB19), CD25 (clone M-A251), CD27 (clone L128), CD38 (clone HB7), CD56 (clone B159), CD127 (clone eBioRDR5, eBioscience, Thermo Fisher Scientific), CTLA-4 (clone BNI3), IgD (clone IA6-2), and PD-1 (clone MIH4, all from BD Biosciences). For samples that included anti-CD27 and anti-IgD, whole blood was washed with medium (RPMI) before staining to remove soluble CD27 and IgD. After 25 minutes of incubation, samples were treated with lysing solution (BD Biosciences). Thereafter, cells were washed with FACS buffer (PBS, 5% filtered FCS, 0.5% bovine serum albumin, 0.07% NaN3) and analyzed using flow cytometry (BD FACSCanto II) and FACSDiva V6.1.3 software (BD Biosciences). Gating strategies for each staining procedure are provided in Supplemental Figure 5. Intranuclear staining of Ki67 (clone B56) was performed using the Foxp3/transcription factor staining buffer set according to the manufacturer’s instructions (eBioscience, Thermo Fisher Scientific). Differentiation status of CD19+ B cells was assessed using antibodies against IgD and CD27. Plasmablasts were identified among switched memory B cells by additional staining of CD38. In addition, T cells were analyzed for expression of PD-1 and CTLA-4. Differential blood counts were used to calculate absolute lymphocyte numbers. CD4+ and CD8+ T cells were quantified among CD3+ T cells and these among lymphocytes. NK cells were identified using antibodies against CD3, CD16, and CD56 and quantified as CD3–CD16+/CD56+ lymphocytes. Tregs were identified among CD4+ T cells by high expression of CD25 and low CD127 expression. Detailed information on antibodies for flow cytometric stainings is given in Supplemental Table 1. Stimulation assays. Whole-blood samples were stimulated with overlapping peptide pools spanning the SARS-CoV-2 spike protein (spike vial 1, N-terminal receptor binding domain; and spike vial 2, C-terminal portion including the transmembrane domain), the NCAP protein, the membrane protein VME1, and the envelope small membrane protein VEMP (1 μg/mL each; JPT, Supplemental Table 2) to induce antigen-specific activation and cytokine induction as described previously (17). As a negative control, samples were treated with the diluent DMSO. Cells were stimulated with 2.5 μg/mL SEB (MilliporeSigma) to assess general characteristics of polyclonally stimulated T cells. Stimulation was performed from whole blood in the presence of costimulatory antibodies against CD28 and CD49d (1 μg/mL each) for 6 hours, with 10 μg/mL brefeldin A added after 2 hours of incubation. After 6 hours, samples were treated with 20 mM EDTA for 15 minutes; thereafter, cells were fixed using BD lysing solution, and stimulated cells were immunostained using anti-CD4 (clone SK3), anti-CD69 (clone L78), anti–IFN-γ (clone 4S.B3), anti–IL-2 (clone MQ1-17H12), anti–TNF-α (clone MAb11), anti–PD-1 (clone MIH4), anti–CTLA-4 (clone BNI3), anti-Ki67 (clone B56), or anti–granzyme B (clone GB11). All stainings except for PD-1 were performed after fixation. Ki67 staining was performed using the Foxp3/transcription factor staining buffer set as described above. Cells were analyzed using flow cytometry. Gating strategies are provided in Supplemental Figures 6 and 7. A schematic representation for cytokine profiling after stimulation with SARS-CoV-2 peptides and SEB is shown in Supplemental Figure 8. Analysis of SARS-CoV-2–specific antibodies. SARS-CoV-2–specific antibodies were quantified from heparinized plasma samples using an IgG and IgA assay coated with recombinant S1 domain of SARS-CoV-2 spike protein antigen according to the manufacturer’s instructions (Euroimmun). Antibody levels are expressed as ratios that are defined as the extinction of the patient sample divided by the extinction of a calibrator serum. Ratios less than 0.8 were scored negative, ratios between 0.8 and 1.1 were scored intermediate, and ratios of or greater than 1.1 were scored positive. Statistics. Statistical analysis was carried out using GraphPad Prism 8.0 software using 2-tailed t tests. An unpaired nonparametric Kruskal-Wallis test with Dunn’s posttest was used to analyze differences for lymphocyte subpopulations, T cell and antibody levels, as well as PD-1, CTLA-4, and Ki67 of total T cells among the 3 groups. Mann-Whitney U test was performed to compare nonparametric data between 2 groups (time since onset of symptoms and expression of CTLA-4, PD-1, Ki67, and granzyme B of specific T cells). Data with normal distribution were analyzed using unpaired t test (cytokine expression) or 1-way ANOVA test (age). Differences in sex were analyzed using χ2 test. Correlations between T cell levels, antibody titers, plasmablasts, and time from onset of symptoms were analyzed according to Spearman. A P value of less than 0.05 was considered statistically significant. Study approval. The study was approved by the ethics committee of the Ärztekammer des Saarlandes (references 76/20; l62/20), and all individuals or their legal representatives gave written informed consent. Author contributions DS, TS, US, SS, BCG, SLB, and MS designed the study; DS, TS, US, and MS designed the experiments. DS, VK, and TS performed experiments; SS, BCG, PML, HW, RB, JM, and HE contributed to study design, patient recruitment, and clinical data acquisition. DS, TS, US, and MS supervised all parts of the study, performed analyses, and wrote the manuscript. All authors approved the final version of the manuscript. Supplemental material Acknowledgments The authors thank Candida Guckelmus and Rebecca Urschel for excellent technical assistance. The authors also thank all participants in this study who contributed to the gain in knowledge from this project. The study was supported by institutional funds to MS and in part by grants of Saarland University (to MS and RB), the State of Saarland, and the Rolf M. Schwiete Stiftung to RB. Footnotes Conflict of interest: The authors have declared that no conflict of interest exists. Copyright: © 2020, Schub et al. This is an open access article published under the terms of the Creative Commons Attribution 4.0 International License. Reference information: JCI Insight. 2020;5(20):e142167.https://doi.org/10.1172/jci.insight.142167. References Huang C, et al. Clinical features of patients infected with 2019 novel coronavirus in Wuhan, China. Lancet. 2020;395(10223):497–506. View this article via: PubMed CrossRef Google Scholar Guan WJ, et al. Clinical characteristics of coronavirus disease 2019 in China. N Engl J Med. 2020;382(18):1708–1720. View this article via: PubMed CrossRef Google Scholar Wang F, et al. Characteristics of peripheral lymphocyte subset alteration in COVID-19 pneumonia. J Infect Dis. 2020;221(11):1762–1769. View this article via: PubMed CrossRef Google Scholar Chen G, et al. Clinical and immunological features of severe and moderate coronavirus disease 2019. J Clin Invest. 2020;130(5):2620–2629. View this article via: JCI PubMed CrossRef Google Scholar Wang F, et al. The laboratory tests and host immunity of COVID-19 patients with different severity of illness. JCI Insight. 2020;5(10):137799. View this article via: JCI Insight PubMed Google Scholar Zheng HY, et al. Elevated exhaustion levels and reduced functional diversity of T cells in peripheral blood may predict severe progression in COVID-19 patients. Cell Mol Immunol. 2020;17(5):541–543. View this article via: PubMed CrossRef Google Scholar Ni L, et al. Detection of SARS-CoV-2-specific humoral and cellular immunity in COVID-19 convalescent individuals. Immunity. 2020;52(6):971–977.e3. View this article via: PubMed CrossRef Google Scholar Grifoni A, et al. Targets of T cell responses to SARS-CoV-2 coronavirus in humans with COVID-19 disease and unexposed individuals. Cell. 2020;181(7):1489–1501.e15. View this article via: PubMed CrossRef Google Scholar Le Bert N, et al. SARS-CoV-2-specific T cell immunity in cases of COVID-19 and SARS, and uninfected controls. Nature. 2020;584(7821):457–462. View this article via: PubMed CrossRef Google Scholar Sekine T, et al. Robust T cell immunity in convalescent individuals with asymptomatic or mild COVID-19. Cell. 2020;5(49):eabd6160. View this article via: CrossRef Google Scholar Weiskopf D, et al. Phenotype and kinetics of SARS-CoV-2-specific T cells in COVID-19 patients with acute respiratory distress syndrome. Sci Immunol. 2020;5(48):eabd2071. View this article via: PubMed CrossRef Google Scholar Guo L, et al. Profiling early humoral response to diagnose novel coronavirus disease (COVID-19). Clin Infect Dis. 2020;71(15):778–785. View this article via: PubMed CrossRef Google Scholar Wölfel R, et al. Virological assessment of hospitalized patients with COVID-2019. Nature. 2020;581(7809):465–469. View this article via: PubMed CrossRef Google Scholar Okba NMA, et al. Severe acute respiratory syndrome coronavirus 2-specific antibody responses in coronavirus disease patients. Emerging Infect Dis. 2020;26(7):1478–1488. View this article via: PubMed CrossRef Google Scholar Sester M, Leboeuf C, Schmidt T, Hirsch HH. The “ABC” of virus-specific T cell immunity in solid organ transplantation. Am J Transplant. 2016;16(6):1697–1706. View this article via: PubMed CrossRef Google Scholar Schub D, et al. CTLA-4-expression on VZV-specific T cells in CSF and blood is specifically increased in patients with VZV related central nervous system infections. Eur J Immunol. 2018;48(1):151–160. View this article via: PubMed CrossRef Google Scholar Sester U, Presser D, Dirks J, Gärtner BC, Köhler H, Sester M. PD-1 expression and IL-2 loss of cytomegalovirus- specific T cells correlates with viremia and reversible functional anergy. Am J Transplant. 2008;8(7):1486–1497. View this article via: PubMed CrossRef Google Scholar Schub D, et al. Altered phenotype and functionality of varicella zoster virus-specific cellular immunity in individuals with active infection. J Infect Dis. 2015;211(4):600–612. View this article via: PubMed CrossRef Google Scholar Schub D, et al. Assay for improved detection of antigen-specific immune cells from extrasanguinous fluids. Eur J Immunol. 2018;48(8):1412–1414. View this article via: PubMed CrossRef Google Scholar Schmidt T, et al. BK polyomavirus-specific cellular immune responses are age-dependent and strongly correlate with phases of virus replication. Am J Transplant. 2014;14(6):1334–1345. View this article via: PubMed CrossRef Google Scholar Sester U, et al. Whole-blood flow-cytometric analysis of antigen-specific CD4 T-cell cytokine profiles distinguishes active tuberculosis from non-active states. PLoS One. 2011;6(3):e17813. View this article via: PubMed CrossRef Google Scholar Braun J, et al. SARS-CoV-2-reactive T cells in healthy donors and patients with COVID-19 [published online July 29, 2020]. Nature. https://doi.org/10.1038/s41586-020-2598-9. Liao M, et al. Single-cell landscape of bronchoalveolar immune cells in patients with COVID-19. Nat Med. 2020;26(6):842–844. View this article via: PubMed CrossRef Google Scholar Naqvi AAT, et al. Insights into SARS-CoV-2 genome, structure, evolution, pathogenesis and therapies: structural genomics approach. Biochim Biophys Acta Mol Basis Dis. 2020;1866(10):165878. View this article via: PubMed CrossRef Google Scholar de Wilde AH, Snijder EJ, Kikkert M, van Hemert MJ. Host factors in coronavirus replication. Curr Top Microbiol Immunol. 2018;419:1–42. View this article via: PubMed Google Scholar Hou YJ, et al. SARS-CoV-2 reverse genetics reveals a variable infection gradient in the respiratory tract. Cell. 2020;182(2):429–446.e14. View this article via: PubMed CrossRef Google Scholar Sester U, Schmidt T, Kuhlmann MK, Gärtner BC, Uhlmann-Schiffler H, Sester M. Serial influenza-vaccination reveals impaired maintenance of specific T-cell memory in patients with end-stage renal failure. Vaccine. 2013;31(38):4111–4120. View this article via: PubMed CrossRef Google Scholar Schmidt T, et al. CD4+ T-cell immunity after pandemic influenza vaccination cross-reacts with seasonal antigens and functionally differs from active influenza infection. Eur J Immunol. 2012;42(7):1755–1766. View this article via: PubMed CrossRef Google Scholar Barber DL, et al. Restoring function in exhausted CD8 T cells during chronic viral infection. Nature. 2006;439(7077):682–687. View this article via: PubMed CrossRef Google Scholar Elsäßer J, et al. Antigen-specific CD4 T cells are induced after intravesical BCG-instillation therapy in patients with bladder cancer and show similar cytokine profiles as in active tuberculosis. PLoS One. 2013;8(9):e69892. View this article via: PubMed CrossRef Google Scholar Chen N, et al. Epidemiological and clinical characteristics of 99 cases of 2019 novel coronavirus pneumonia in Wuhan, China: a descriptive study. Lancet. 2020;395(10223):507–513. View this article via: PubMed CrossRef Google Scholar Rawson TM, et al. Bacterial and fungal co-infection in individuals with coronavirus: a rapid review to support COVID-19 antimicrobial prescribing [published online May 2, 2020]. Clin Infect Dis. https://doi.org/10.1093/cid/ciaa530. Zhao J, et al. Antibody responses to SARS-CoV-2 in patients of novel coronavirus disease 2019 [published online May 28, 2020]. Clin Infect Dis. https://doi.org/10.1093/cid/ciaa344. Taylor A, Foo SS, Bruzzone R, Dinh LV, King NJ, Mahalingam S. Fc receptors in antibody-dependent enhancement of viral infections. Immunol Rev. 2015;268(1):340–364. View this article via: PubMed CrossRef Google Scholar Cao WC, Liu W, Zhang PH, Zhang F, Richardus JH. Disappearance of antibodies to SARS-associated coronavirus after recovery. N Engl J Med. 2007;357(11):1162–1163. View this article via: PubMed CrossRef Google Scholar Tang F, et al. Lack of peripheral memory B cell responses in recovered patients with severe acute respiratory syndrome: a six-year follow-up study. J Immunol. 2011;186(12):7264–7268. View this article via: PubMed CrossRef Google Scholar Vabret N, et al. Immunology of COVID-19: current state of the science. Immunity. 2020;52(6):910–941. View this article via: PubMed CrossRef Google Scholar RECOVERY Collaborative Group, et al. Dexamethasone in hospitalized patients with Covid-19 - preliminary report [published online July 17, 2020]. N Engl J Med. https://doi.org/10.1056/NEJMoa2021436. Schoch J, et al. Quantitative, phenotypical, and functional characterization of cellular immunity in children and adolescents with down syndrome. J Infect Dis. 2017;215(10):1619–1628. View this article via: PubMed CrossRef Google Scholar Version history Version 1 (September 16, 2020): In-Press Preview Version 2 (October 15, 2020): Electronic publication

good health's curator insight,
January 12, 2024 7:18 AM
Acquista Online La Prescrizione Di Perdita Di Peso
https://globalefarmacia.com/Prodotto/acquista-ozempic-online/
https://www.bing.it/url?q=https://globalefarmacia.com/Prodotto/acquista-ozempic-online/

Clinical MedicineImmunologyPulmonology Free access | 10.1172/JCI128654 The alveolar immune cell landscape is dysregulated in checkpoint inhibitor pneumonitis Karthik Suresh,1 Jarushka Naidoo,2,3 Qiong Zhong,1 Ye Xiong,1 Jennifer Mammen,4 Marcia Villegas de Flores,5 Laura Cappelli,5 Aanika Balaji,2 Tsvi Palmer,1 Patrick M. Forde,2,3 Valsamo Anagnostou,2,3 David S. Ettinger,2 Kristen A. Marrone,2,3 Ronan J. Kelly,2,3 Christine L. Hann,2,3 Benjamin Levy,2,3 Josephine L. Feliciano,2,3 Cheng-Ting Lin,6 David Feller-Kopman,1 Andrew D. Lerner,1 Hans Lee,1 Majid Shafiq,1 Lonny Yarmus,1 Evan J. Lipson,3,4 Mark Soloski,5 Julie R. Brahmer,2,3 Sonye K. Danoff,1 and Franco D’Alessio1 First published July 16, 2019 - More info Abstract BACKGROUND. Checkpoint inhibitor pneumonitis (CIP) is a highly morbid complication of immune checkpoint immunotherapy (ICI), one which precludes the continuation of ICI. Yet, the mechanistic underpinnings of CIP are unknown. METHODS. To better understand the mechanism of lung injury in CIP, we prospectively collected bronchoalveolar lavage (BAL) samples in ICI-treated patients with (n = 12) and without CIP (n = 6), prior to initiating first-line therapy for CIP (high-dose corticosteroids). We analyzed BAL immune cell populations using a combination of traditional multicolor flow cytometry gating, unsupervised clustering analysis, and BAL supernatant cytokine measurements. RESULTS. We found increased BAL lymphocytosis, predominantly CD4+ T cells, in patients with CIP. Specifically, we observed increased numbers of BAL central memory T cells, evidence of type I polarization, and decreased expression of cytotoxic T lymphocyte–associated protein 4 and programmed cell death protein 1 in BAL Tregs, suggesting both activation of proinflammatory subsets and an attenuated suppressive phenotype. CIP BAL myeloid immune populations displayed enhanced expression of IL-1β and decreased expression of counterregulatory interleukin-1 receptor antagonist. We observed increased levels of T-cell chemoattractants in the BAL supernatant, consistent with our proinflammatory, lymphocytic cellular landscape. CONCLUSION. We observe several immune cell subpopulations that are dysregulated in CIP, which may represent possible targets that could lead to therapeutics for this morbid immune-related adverse event. FUNDING. NIH, Department of Defense, and the Bloomberg~Kimmel Institute for Cancer Immunotherapy. Graphical Abstract Introduction With recent clinical trials demonstrating clear efficacy for immunotherapy in patients with locally advanced and advanced-stage non–small-cell lung cancer (NSCLC) as well as other tumors, the use of immune checkpoint inhibitors (ICIs) for the treatment of NSCLC has rapidly increased (1–3), becoming the standard of care. ICIs, however, are associated with a constellation of toxicities termed immune-related adverse events (irAEs). These toxicities include arthritis, colitis, endocrinopathies, and lung injury; the last is termed checkpoint inhibitor pneumonitis (CIP) (4, 5). Clinically, patients with CIP present with acute to subacute onset of dyspnea, hypoxemia, and pulmonary infiltrates similar to that seen in patients with lung injury from acute respiratory distress syndrome (6). Although CIP can result in high morbidity, it was previously thought to be an uncommon complication of ICI therapy, with an incidence of around 3% to 5% (7, 8) based on clinical trial data. Recent evidence from our group and others suggests, however, that the occurrence of CIP may be higher in real-world settings (9, 10). For instance, using a multidisciplinary, standardized approach (11), we recently observed an incidence of 19% in a cohort of 205 patients with NSCLC treated with ICI (12). In addition, we also observed an association between CIP development and increased mortality rates in patients with NSCLC treated with ICI (13). Despite the rising incidence of CIP and its association with increased mortality, the current paradigms for diagnosis and treatment of CIP are largely based on anecdotal evidence, primarily because fundamental knowledge of CIP pathobiology is lacking (14). CIP is diagnosed by the presence of compatible symptoms (shortness of breath, hypoxia, cough), new radiographic infiltrates, which can be either unilateral or bilateral (15, 16), typically with ground glass and consolidative components (Figure 1), and the exclusion of infectious etiologies (with sputum cultures or bronchoalveolar lavage [BAL]). There are currently no diagnostic biomarkers for CIP, so the diagnosis remains largely one of exclusion. Once diagnosed, clinical severity is used to determine CIP grade (Supplemental Table 1; supplemental material available online with this article; https://doi.org/10.1172/JCI128654DS1). For CIP grade 2 (i.e., symptomatic patients with compatible radiographic infiltrates) and higher, ICI therapy is immediately discontinued, and empiric high-dose steroids are initiated. More targeted, disease-specific therapy is not instituted as first-line treatment for CIP in part because there are currently no available data on the mechanism of lung injury in CIP. Due to the lack of diagnostic and therapeutic options, patients diagnosed with CIP are typically also not eligible for further ICI; this is particularly disadvantageous in individuals with ongoing tumor response. Figure 1 Radiographic presentation of CIP. Representative computed tomography images of an ICI-treated NSCLC patient (A) prior to development of CIP, (B) at the time of CIP diagnosis, and (C) after 3 weeks of steroid treatment. *Denotes area of preexisting post-radiotherapy changes that were stable before initiation of ICI. As part of a multidisciplinary immune-related toxicity (irTox) team (11) engaged in diagnosis, management, and study of irAEs following ICI therapy, we prospectively collected BAL fluid (BALF) specimens from patients treated with ICI who have no evidence of CIP as well as those with suspected CIP. Clinical, laboratory, and radiographic data of patients suspected of having CIP were subsequently reviewed by the irTox team, and a determination was made as to whether the presenting symptoms were due to CIP or another etiology. Using these specimens, we performed multiparametric flow cytometric analysis on BALF samples to better understand the landscape of immune dysregulation in CIP. In part due to the lack of available data on the biology of lung injury in CIP, we utilized unbiased clustering analytic techniques to examine our flow cytometric results. Such approaches have the advantage of detecting changes in small cell populations that may otherwise be excluded with manual gating. Importantly, the control group comprised patients who also received ICI but did not exhibit any clinical evidence of CIP at the time of bronchoscopy. Results BAL lymphocytosis is a hallmark for CIP. Study design as well as baseline clinical characteristics for the patients enrolled in this observational study are shown in Figure 2 and Table 1, respectively. Clinical grade, management, and outcomes data for the 12 patients with CIP are presented in Supplemental Table 2. We first manually counted BAL cell differentials in a subset of control and CIP samples. We found a relative increase in lymphocytes with a concomitant decrease in monocytes in CIP (Supplemental Figure 2) compared with patients without CIP. Notably, BAL neutrophils were not abundant in patients with CIP. To further characterize subsets of BAL immune cells, we performed multiparametric flow cytometric analysis using optimized T cell and monocyte panels (Supplemental Table 3). We initially analyzed these data using traditional gating methods, and similar to our manual cell differentials, found an increase in the percentage of T lymphocytes in patients with CIP (Figure 3). Specifically, we found an increase in CD3+CD4+ cells (Figure 3A; P = 0.04) and a possible association with increased CD3+CD8+ cells (Figure 3B; P = 0.073). We also noted a decrease in monocytes, specifically CD3–CD19–CD14+ cells (Figure 3C; P = 0.04). We did not observe any differences in the percentage of Tregs (CD3+CD4+CD127loCD25+Foxp3+) among patients who were CIP+ and CIP– (data not shown). Figure 2 Study design and participating patients. Consort diagram showing study enrollment and adjudication of patients into control and CIP groups. *Pertinent clinical, radiographic, laboratory and microbiologic (including BAL culture when available) data were reviewed by the immune-related toxicity (irTox) team before and (in cases of suspected CIP) after bronchoscopy. At both time points, patients with suspected CIP with an alternative etiology for symptoms were excluded from the CIP group (n = 2). ICI, immune checkpoint inhibitor; VATS, video-assisted thoracic surgery; CIP, checkpoint inhibitor pneumonitis. Figure 3 BAL lymphocytosis in patients with CIP. Scatter plots showing number of (A) CD4+, (B) CD8+, (C) CD14+, and (D) CD16+ T cells (A and B) and monocytes (C and D), respectively, in control and CIP samples. n = 6 (CIP–), 12 (CIP+). Comparisons between groups performed using Mann-Whitney test. Table 1 Baseline characteristics Unsupervised clustering reveals differential T cell subpopulations in CIP. To understand immune cell subpopulations in our samples in more granular detail, we next turned to unsupervised clustering analysis. The total numbers of cells per condition used for our unsupervised analyses are shown in Supplemental Table 4. We represent the results of our clustering analysis using star charts. As shown in Supplemental Figure 1, groups of cells that share similar cytokine profiles are identified as a node and represented by a circle. The diameter of the circle reflects the number of cells present within that subpopulation. The cell surface or intracellular mean fluorescence intensity (MFI) for each fluorophore is expressed as a wedge within the circle; the radius of the wedge segment represents the expression level of that particular marker. For instance, in Supplemental Figure 1B, a node with very high PD-1, CD45RA, and CD127 expression is shown. Topologically, nodes are arranged by similarity to each other in a cluster map (Supplemental Figure 1C). Cell subsets occupy distinct areas within a map; for instance, in the T cell cluster map, as expected, CD4+ and CD8+ cells are clustered together in opposite ends because they are very distinct from each other (Supplemental Figure 1, D and E). In control, unstimulated T cells, we observed clustering around 2 cell populations: CD4+ cells with high PD-1 expression (Figure 4A) and CD8+ cells with moderate PD-1 expression (Figure 4A). Unstimulated CIP samples exhibited increased CD8+ cell populations compared with unstimulated controls (Figure 4B) as well as a local shift in CD4+ Treg populations (Figure 4B), as discussed in more detail in the information to follow. Figure 4 T cell populations in CIP. Unsupervised clustering of T cells in BALF samples of patients without (control, n = 6) and with CIP (n = 12). Cluster maps showing distribution of T cell subpopulations in (A) unstimulated controls and (B) unstimulated CIP. Within each cluster map, larger cell populations distinct to that particular condition are highlighted (square boxes). To better understand the specific T cell subsets that were up/downregulated in patients with CIP, we examined the differential cluster map of T cell subsets, which highlights only clusters where the magnitude of difference between groups was greater than 95%. As shown in Figure 5, in CIP, we observed a significant increase in CD4+CD45RA+CD25– cells that also expressed CD62L. Because this cytokine profile resembled that of central memory T cells (Tcms), a non-Treg (i.e., conventional) T cell subpopulation characterized by high CD62L and low CD45RA expression, we performed manual gating for Treg and non-Treg subpopulations (Supplemental Figure 3) and observed a significantly higher percentage of Tcm in CIP samples (P = 0.01). As mentioned earlier, we observed a shift in CD4+FoxP3+ cells between unstimulated control and CIP cluster maps. Closer examination of these clusters revealed that while clusters of PD-1loCTLA-4lo Tregs were similarly expressed in both CIP and controls, a subpopulation of Tregs with high PD-1 and CTLA-4 expression was only seen in controls, and these effector molecules were downregulated in alveolar Tregs in CIP (Figure 5). Compared with controls, multiple CD8+TNF-αhi subpopulations were upregulated at baseline in CIP (Figure 5). Ex vivo stimulation of CIP samples polarized T cells toward a type 1 phenotype with increased TNF-α and IFN-γ production across multiple cell subsets with varying degrees of CD8 expression; these cell populations were not increased in control cells following stimulation (Supplemental Figure 4). Figure 5 Abnormal T cell subsets in CIP. Differential cluster map (center) shows clusters where the number of cells within the cluster were increased by 95% in controls (red, n = 6) or CIP (cyan, n = 12). Cytokine profile (inset) and scatter plot of relevant cytokines showing MFI in the selected clusters (red) compared with MFI across all clusters (black) in (counterclockwise): (i) CD4+FoxP3loCD25–CD62LhiCD45RAlo cluster increased in CIP; (ii) PD-1hiCTLA-4hi clusters of Tregs increased in controls, scatter plot showing PD-1/CTLA-4 MFI in selected clusters; (iii) similar (i.e., <95% difference) expression of PD-1loCTLA-4lo Treg clusters in CIP and controls, scatter plot showing PD-1/CTLA-4 MFI in selected clusters; (iv) a CD3+CD4lo CD8–TNF-αhi population increased in CIP, scatter plot showing CD4/TNF-α MFI in selected clusters; (v) CD8+TNF-αhiPD-1hi clusters increased in CIP, scatter plot showing CD8/TNF-α MFI in selected clusters; and (vi) a second set of CD8+TNF-αhi clusters increased in CIP. In summary, these findings suggest multiple dysregulated T cell subsets in patients with CIP. At baseline, we observe in CIP: (a) increased Tcms, (b) loss of PD-1hi/CTLA-4hi CD4+ Tregs and (c) upregulation of proinflammatory (i.e., TNF-αhi, IFN-γhi) CD8+ cells. With stimulation, we observe an increase in numbers of CD8+ TNF-αhi subsets and the amount of TNF-α expression in stimulated CIP samples compared with controls. Upregulation of IL-1βhi monocytes in CIP and IL-1RA–expressing B cells in controls. Next, we sought to examine population differences in non–T (i.e., CD3–) cells. Similar to our T cell analyses, we represented the results in cluster maps where the distinct cell populations (e.g., CD14+ monocytes, CD16+ monocytes, B cells) occupy various regions within the map (Supplemental Figure 5). We observed clear differences between unstimulated control and CIP samples (Figure 6). As shown in Figure 6, A and B, and in closer detail in Figure 7, two reciprocal populations were upregulated in controls and CIP, respectively. In controls, we observed a large increase in several clusters corresponding to IL-1RA–expressing CD86+ B cells (CD19+). While this cluster was downregulated in CIP, a different cluster of IL-1βhiTNF-αhiCD-11bhi myeloid cells (CD19–, CD14int/CD16int) was significantly upregulated in CIP. Similar to our T cell analysis, we confirmed the presence of a TNF-αhiIL-1βhiCD11bhi population in CIP samples with manual gating (Supplemental Figure 6). Unlike T cells, we did not observe significant differences in cluster profiles between unstimulated and stimulated cells either in the control or CIP condition (Supplemental Figure 7). Figure 6 Monocyte populations in CIP. Unsupervised clustering of non–T cells (singlet, live, CD3–) in BALF samples of patients without (control, n = 6) and with CIP (n = 12). Cluster maps showing distribution of myeloid subpopulations in (A) unstimulated controls and (B) unstimulated CIP. Figure 7 Abnormal monocyte subsets in CIP. Differential cluster map of myeloid cells showing clusters that are increased by at least 95% between unstimulated controls (n = 6) and unstimulated CIP (n = 12) samples. Cytokine profiles and scatter plot of relevant cytokines showing MFI in the selected clusters (red) compared with MFI across all clusters (black) showing: (i) population of IL-1RAhi B cells (CD19+) increased in controls and (ii) large population of related clusters of IL-10hiIL-1βhi myeloid cells (CD14loCD16loCD19–) increased in CIP. We also compared the subpopulations identified previously as being significantly different in controls or CIP to the results of a meta-clustering analysis, to determine whether the subpopulations selected to be differentially upregulated in our prior analyses were also identified as distinct populations using an autogating strategy. As shown in Supplemental Figure 8, meta-clustering identified the clusters previously examined in our T cell and monocyte/B cell cluster maps (Figure 4 and Figure 6) as distinct subpopulations. Upregulation of lymphocyte chemoattractants in the BALF of patients with CIP. To determine whether BALF cytokines were promoting the cellular phenotypes observed in our flow cytometry data, we measured key cytokines in the cell-free BAL supernatant (Figure 8, A–C, and Supplemental Table 5). Surprisingly, despite observing an increased number of IL-1βhi cells in our flow analysis, we observed decreased levels of IL-1β in CIP BAL supernatants. We observed no differences in TNF-α levels, but discovered increased levels of the type 1 skewing cytokine IL-12p40. We also measured levels of cytokines involved in the recruitment of inflammatory cells to the alveolus. We observed lower levels of IL-8, the classical neutrophil chemoattractant, in CIP. Although no differences were seen in levels of monocyte chemoattractant proteins 1 or 4, we observed lower levels of macrophage inflammatory protein-3α (MIP-3α), a significant increase in levels of the IFN-γ–induced protein 10 (IP-10, or CXCL-10) and a trend toward increased levels of T cell chemoattractant protein TARC (also known as CCL17; P = 0.06). Figure 8 BALF cytokine analysis. (A) Heatmap showing expression of various cytokines in control and CIP BAL supernatant samples. Cytokines are scaled, centered, and hierarchically clustered (using the Euclidean distance). (B) Box-and-whisker plots showing median, minimum, and maximum with individual data point overlay (dots) for select cytokines involved in alveolar inflammation and immune cell skewing (B) or inflammatory cell recruitment/chemotaxis (C). *Denotes significant difference from control BALF samples (Mann-Whitney, P < 0.05). Discussion In this study, we describe multiple baseline and functional abnormalities in both lymphoid and myeloid alveolar cell types in patients who developed CIP. These abnormalities involve both upregulation of proinflammatory subsets and downregulation of the counterregulatory antiinflammatory process in both T cells and myeloid cells (Figure 9). In healthy adults, the BAL is composed primarily of macrophages (>85%) and lymphocytes (10%) (17). These percentages are similar to the pattern seen in our control samples (i.e., patients who received ICI but did not have CIP at the time of bronchoscopy), suggesting that ICI therapy alone does not appear to significantly alter the alveolar immune cell pattern. In contrast, we observed lymphocytosis of greater than 20% in most of our CIP+ BAL samples. BAL lymphocytosis has been reported in other conditions such as sarcoidosis, hypersensitivity pneumonitis, cryptogenic organizing pneumonia, nonspecific interstitial pneumonia, and radiation pneumonitis. Our finding of lymphocytosis in the BALF of patients with CIP argues for the use of BAL cell count differentials and flow cytometry for CD4+/CD8+ cells as part of the clinical evaluation scheme during BAL in patients with suspected CIP. As no biomarker currently exists for this disease, this discovery represents a translational application of our current findings. Figure 9 Summary of dysregulated immune cell phenotypes in CIP. Our unbiased clustering approach identified several subpopulations of T cells that are likely to be playing key roles in the pathobiology of CIP. First, CD4+ central memory subsets (Tcms, CD4+CD45RA–CD62L+) were increased in CIP. Tcms have been shown to be more resistant to steroid-induced apoptosis than other conventional T cells, such as effector memory T cells. Moreover, CD62L+ cells play an important role in adhesion to inflammatory sites and can perpetuate injury (18). Increased Tcm in CIP might explain why some patients fail high-dose steroid therapy. We recently reported steroid-refractory disease in up to 40% of patients with CIP in our cohort (10); from a lung injury standpoint, this feature of CIP is unique compared with other lymphocytic pneumonitides, which generally tend to be steroid responsive. The incidence of CIP is significantly higher in patients with underlying NSCLC than other cancers, and we have shown (5) that within patients with NSCLC, tumor histology further stratifies CIP incidence and risk. These findings, coupled with our current data, suggest that Tcm could be responding to tumor-specific antigens. T cell receptor sequencing of the T cell subsets in CIP samples will be useful in this regard. Second, a subpopulation of CD4+ cells skewed toward a type I phenotype with high IFN-γ and TNF-α production is upregulated in CIP. Type I lymphocytes have been linked to several lung diseases including sarcoidosis, hypersensitivity pneumonitis, and lung allograft rejection (19–21). Thus, the combination of “sticky” lung CD4+ T cells (i.e., CD62L+ CD4+ cells) and type I skewing may be synergistically contributing to lung injury seen in patients with CIP. Third, we observed decreased CTLA-4 and PD-1 expression within Treg (i.e., FoxP3+) populations, suggesting an attenuated Treg suppressive phenotype. One explanation for our findings is that, in CIP, loss of Treg suppression may be promoting exuberant Th1 T cell responses. We have shown that alveolar Tregs play a pivotal role orchestrating resolution of lung inflammation and are present in humans with lung injury (22), while others have shown that PD-1+ Tregs are more suppressive to control CD8+ T cells (23). In addition to PD-1, the lack of CTLA-4 may further impair Treg ability to control conventional T cell (such as Tcm) and macrophage proinflammatory responses (24). Overall, our findings suggest highly activated alveolar T cells with loss of a regulatory, antiinflammatory Treg suppressive phenotype contributing to unchecked immune dysregulation seen in CIP. Interestingly, while we observed decreased numbers of CD14+ monocytes based on traditional gating methods, our clustering data show additional dramatic shifts in myeloid populations between controls and patients with CIP, such as a significant increase in CD11bhiIL-1βhi, myeloid cells with varying degrees of CD14/CD16 expression. This is accompanied by a loss of IL-1RA+CD19+ cells in patients with CIP, reflected in the cluster maps as a relative upregulation of these cells in controls. These findings suggest that an imbalance in IL-1 signaling, along with overexuberant TNF-α signaling may be contributing to the pathobiology of lung injury in patients with CIP. The concomitant presence of increased Tcms, as discussed earlier, may also serve to augment T cell and monocyte inflammation. Our BALF cytokine results also point toward a proinflammatory, chemoattractant cytokine milieu. Interestingly, we observed a decrease in soluble IL-1β, while an increase in IL-1β–expressing monocyte subsets was observed in flow cytometry. The dynamics of IL-1β production and release is complex, however, and thought to be related to the strength of the inflammatory stimulus (25). Thus, one possibility is that, in CIP, the underlying source of inflammation promotes IL-1β translation and endosomal storage, but not membrane release. Another possibility is that soluble IL-1β release occurs earlier in injury and is decreased by the time our samples are obtained (generally 2 to 3 days at a minimum, after symptom onset). This lack of time resolution in our BALF data may also explain why TNF-α levels were not significantly different. Another explanation is that, although our controls did not have CIP, they underwent bronchoscopy prior to tumor sampling/resection; this bias may be skewing our control IL-1β results. Despite these findings, our IL-12p40 and CXCL-10 (IP-10) data further implicate CD4+ cells in the pathobiology of CIP. IL-12 is a known orchestrator of tissue inflammation and type I polarization. IL-12p40 can form heterodimers with IL-12p70 and IL-23 (26); however, neither of these cytokines was elevated in the BALF of subjects with CIP (Supplemental Table 5). Thus, we postulate that the increased IL-12p40 observed in CIP constitutes the monomeric form. This secreted form has been reported to be 10- to 20-fold in excess compared with IL-12p70 in stimulated human peripheral blood cells (27) and has been known to be elevated in patients with asthma during airway inflammation (28). Additionally, IP-10 is known to guide Tcm lymphocytes (a T cell subset seen to be upregulated in our flow cytometry data) to their destination within lymph nodes (29). Therapeutically, antibody-mediated blockade of IL-12p40 and CXCL10 has been used to treat inflammatory diseases (30, 31). Our chemotactic cytokine data collectively reflect a lack of neutrophil chemoattraction to the lung (decreased IL-8). Similarly, MIP-3α, which is decreased in patients with CIP BALF, has been previously observed in the context of airway infections (32), is thought to have antimicrobial properties. This observation, along with our IL-8 data and lack of significant neutrophil predominance in our BAL cell differentials (Supplemental Figure 2) further supports the notion that CIP may not be a bacterial infection–triggered phenomenon. Lastly, our finding of increased CCL17 levels correlates with our flow cytometric finding of increased CD11bhi populations of myeloid cells; CD11b+ cells have been previously identified as a key source of the CCL17-honing chemokine in the lung (33). Our findings suggest several targets for therapeutic consideration in patients with steroid-refractory CIP. We note upregulation of several TNF-αhi subsets (lymphoid and myeloid) at baseline in CIP; this finding provides some tissue-specific rationale for the use of infliximab for steroid-refractory CIP, although our BAL cytokine data suggest that timing of TNF-α inhibition may need to be further explored. Importantly, our data also identify several potentially novel populations upregulated in CIP (such as CD62Lhi Tcms and IL-1β–expressing monocytes) that could be targeted using existing therapies. Anti-CD62L antibodies or small-molecule inhibitors have been used to attenuate models of lung injury (34, 35), although these inhibitors are not currently approved for any clinical indication. Biological agents against IL-1β (e.g., anakinra or canakinumab) are currently either in trials or in use, and thus, further validation of these results could provide the rationale for testing these therapies either as first-line adjuncts or as salvage therapies for high-grade CIP. It is known that transient expression of IL-1β can induce lung inflammation, increase TNF-α, and contribute to progressive tissue fibrosis (36); hence, targeting IL-1β could represent an attractive target in treating CIP. CCL-17 (TARC) the ligand for CCR4 is usually considered a selective chemoattractant for type 2 cells, although it has been shown to be elevated in sarcoidosis, a classical type I–mediated lung disease (37). Blocking TARC or its receptor CCR4 could decrease T cell infiltration into the inflamed CIP lungs. Alternatively, transiently enhancing Treg suppressive function could lead to multiple beneficial effects, such as improving control of exuberant type I responses and limiting proliferation, abrogating macrophage proinflammatory responses and ultimately orchestrating lung repair (22, 38). For instance, we have previously shown that a short-course administration of the DNA methyltransferase inhibitor decitabine can potently augment endogenous Tregs and mediate resolution of lung inflammation and promote lung repair (39). Analysis of CIP rates in ongoing trials utilizing ICI/DNA methyltransferase inhibitor combinations could provide further insight into a potential beneficial effect for these agents from a CIP standpoint. Although our data provide insight into potential pathobiologic mechanisms in CIP, CIP is unique in comparison to other irAEs regarding incidence (across cancer types) (40) and relationship to overall survival (OS). CIP is much more common in lung cancers compared with other cancers, and although other irAEs have been associated with improved OS, we did not observe a similar association with CIP (13). Thus, we do not believe that our results are necessarily generalizable to other irAEs. There are several limitations to this study. First, due to the logistical challenges associated with identifying and promptly performing lavage in patients with suspected CIP before antibiotic or steroid administration, our sample sizes are low and thus preclude adjustment for clinical comorbidities (such as chronic obstructive pulmonary disease) that may confound our results. Second, while only patients with a negative infectious work-up were included in the CIP cohort, it is possible that BAL cultures did not identify a focus of infection in patients thought to have CIP. Third, although BAL of CIP infiltrates were performed in areas not previously affected by tumor, it is possible that presence of malignancy in the nearby airways could have influenced our results. In conclusion, our data provide several hypothesis-generating insights into the dysregulated alveolar immune dysregulation in patients with CIP. In the absence of a preclinical model for CIP, our findings provide the first rigorous report to our knowledge of immunological mechanisms underlying CIP. In addition to validation in larger clinical cohorts, these data could inform the design of preclinical and translational studies aimed at further understanding the mechanistic basis of CIP, so that targeted therapies can be developed for this morbid complication of immunotherapy. Methods Study population. Patients were enrolled in this prospective observational study if they were (a) diagnosed with NSCLC and (b) treated with ICIs. Patients who received neoadjuvant ICI underwent bronchoscopy with the collection of BALF prior to surgery. Otherwise, BALF was collected whenever patients underwent bronchoscopy. If CIP was suspected, the BALF sampled was categorized as “CIP” if (a) the sample was obtained before initiating steroids and antibiotics and (b) a clinical diagnosis of CIP was adjudicated by the multidisciplinary irTox team (information to follow). After adjudication, patients with CIP were treated with high-dose steroids (1 mg/kg prednisone). Second-line agents (infliximab, i.v. immunoglobulin, or mycophenolate mofetil) were added at the discretion of the treating team if no improvement was noted after 72 hours, as described previously (12). CIP diagnosis. CIP was defined as (a) shortness of breath, decreased exercise tolerance, exertional desaturation, and/or cough along with (b) the presence of new radiographic infiltrates and (c) lack of evidence of infection (negative cultures on BAL, negative respiratory viral swab) or alternate etiologies (diffuse alveolar hemorrhage, heart failure). Radiographic assessment was performed based on response evaluation criteria in solid tumors (RECIST); cases where the new infiltrates were deemed to represent tumor progression were excluded from both control and CIP groups. A diagnosis of CIP was adjudicated following review and discussion of the pertinent microbiologic and radiographic (11, 12) data by the primary oncologist, a second oncologist (JN), 2 pulmonologists (KS, SD), and a radiologist (CTL), with additional input from other members of the immune-related toxicity team (11) (such as radiation oncology or infectious disease), as needed. Patients in whom clinical equipoise regarding infection was present (e.g., clinical presence of fever, purulent sputum, sick contacts, elevated bands on complete blood count differential) were not adjudicated as CIP even if the BAL cultures were negative. BAL. In control patients, the middle lobe was lavaged. In patients with CIP, an area with new infiltrates not previously known to be associated with tumor was lavaged. The volume of instilled and returned saline was abstracted from the BAL procedure note. BAL specimens were processed with ammonium chloride–potassium lysis solution. Cells were then counted following trypan blue staining to exclude dead cells. Manual cell differentials. BALF cells were stained with Diff-Quik (Thermo Fisher) and equal numbers of total cells (n = 500) were counted per specimen by 2 investigators blinded to the sample group classification as previously described (22). BAL cytokine measurements. BAL supernatant was collected following centrifugation of the cellular components and stored at –80° until further processing. Cytokine measurements were performed using the Mesoscale Discovery platform. Values were normalized to total volume of BAL fluid returned, as noted during bronchoscopy. Flow cytometry. After thawing samples at 37°C, cells were stained for flow cytometry. Approximately 1 × 10⁶ cells per sample were stained with violet LIVE/DEAD (Invitrogen). Cells were incubated with human IgG (Rockland Immunochemicals) to block Fc receptors. Cells were then surface stained with BD Biosciences–Pharmingen antibodies: BV510-conjugated anti-CD3 (UCHT1), BUV395-conjugated anti-CD4 (RPA-T4), allophycocyanin-Cy7–conjugated anti-CD25 (M-A251), BUV737-conjugated anti-CD8 (SK1), PE-CF594–conjugated anti-CD62L (DREG-56), BV421-conjugated anti-CD127 (HIL-7R-M21), BV650-conjugated anti-CD45RA (HI100), PE-Cy7–conjugated anti-CD14 (MoP9), BV711-conjugated anti–PD-1 (EH12), BB700-conjugated anti-CD19 (SJ25C1), PE-Cy7–conjugated anti-CD80 (L307), APC-Cy7–conjugated anti–HLD-DR (G46-6), BV650-conjugated anti-CD11b (M1/70), BV711-conjugated anti-C86 (2331-FUN-1), APC-R700–conjugated anti-CD274 (MIH1), BV786-conjugated anti-CD206 (19.2), PE-conjugated anti–IL-1RA (AS-17), and BUV395-conjugated anti-CD16 (3G8), and intracellularly stained with allophycocyanin-conjugated anti-Foxp3 (PCH101; eBioscience). The following intracellular antibodies from BD Biosciences were also used: Alexa-488–conjugated anti–IL-4 (8D4-8), PE-conujgated anti–IL-10 (JES3-9D7), APC-R700–conjugated anti–IL-17A (N49-653), BV605-conjugated anti–IFN-γ (B27), BV750-conjugated anti–TNF-α (Mab11), BV786-conjugated anti–CTLA-4 (BNI3), PE-CF594–conjugated anti–TGF-β (TW4-9E7), BV510-conjugated anti–IL-8 (G265-8), and BV421-conjugated anti–IL-1β (H1b-98; BioLegend). A UV-excitable LIVE/DEAD discrimination assay (Invitrogen) was applied. Cells were then analyzed on a FACSAria (BD Biosciences). Data were analyzed using either FlowJo (TreeStar, Inc.) for traditional gating analyses or R/Bioconductor for unsupervised clustering, as detailed in the information to follow. BAL cell ex vivo stimulation. Cells were resuspended in a 96-well U-bottom plate using Iscove’s modified Dulbecco medium (Thermo Fisher) (10% heat-inactivated fetal bovine serum, 1% sodium pyruvate, 1% HEPES, 2 mM GlutaMax, 100 U/mL penicillin/streptomycin, and 50 μM β-mercaptoethanol). For lymphocyte stimulation, cells were stimulated with PMA (40 ng/mL) and ionomycin (500 ng/mL) for a total for 4 hours, and GolgiStop and GolgiPlug (BD Biosciences) were added the last 3 hours. For myeloid stimulation, cells were stimulated with LPS (1 μg/mL) and IFN-γ (100 ng/mL) for a total of 4 hours, with GolgiStop and GolgiPlug added for the last 3 hours. BAL biomarker measurements using Vplex immunoassays. BAL supernatants were used to measure C-reactive protein, eotaxin, eotaxin-3, FGF (basic), GM-CSF, ICAM-1, IFN-γ, IL-1α, IL-1β, IL-2, IL-4, IL-5, IL-6, IL-7, IL-8, IL-8 (HA), IL-10, IL-12 (p40), IL-12 (p70), IL-13, IL-15, IL-16, IL-17A, IL-21, IL-22, IL-23, IL-27, IL-31, IP-10, MCP-1, MCP-4, MDC, MIP-1α, MIP-1β, MIP-3α, PlGF, SAA, TARC, Tie-2, TNF-α, TNF-β, VCAM-1, VEGF-A, VEGF-C, VEGF-D, and VEGFR-1/Flt-1 using Vplex immunoassays (Meso-Scale Discovery), according to the manufacturer’s instructions. Samples were run in duplicate. All BAL supernatants were diluted equivalently, the cytokine results were normalized for the amount of BALF recovered, and the results are thus expressed as micrograms per milliliter of recovered BALF, as per the guidelines for measurement of acellular BALF components (17, 41). Statistics. Unsupervised clustering analysis was conducted using the FlowSOM and flowCore packages in R/Bioconductor (42). Briefly, scaled, transformed MFIs for each cell are used as the coordinates for a data point in n-dimensional space, where n is the number of fluorophores. A self-organizing map of nodes in this space was to maximize similarity within each node. The distances between nodes reflects the degree of similarity between groups of cells. Importantly, MFI is treated as a continuous variable, thus allowing visualization and analysis of cell subsets where a surface marker expression may be intermediate. Further, because this method of analyzing flow cytometry data incorporates the MFIs for each fluorophore for each cell, it allows for greater resolution of differences in cytokine expression in a multiparametric flow cytometric data set. A graphical abstract of the algorithm is provided in Supplemental Figure 1A. All MFI values are compensated, scaled, and transformed as previously described (43, 44). For both T cells (i.e., singlet, live, CD3+ cells) and monocytes/B cells (i.e., singlet, live, CD3–), the cluster map was first constructed on a concatenated data set composed of unstimulated control, stimulated control, unstimulated CIP, and stimulated CIP samples. This concatenated set represents the sum total of biological replicates (n = 18; 6 controls and 12 CIP cases). Next, group comparisons between controls and CIP as well as unstimulated and stimulated samples were made by generating group-specific cluster maps as well as a differential cluster map, where a node was considered to be upregulated if there was a greater than 95% difference between groups. As the initial conditions for the clustering algorithm is randomly chosen, the map shape can differ slightly with each run; each analysis was rerun 5 times to ensure that the same clusters were upregulated across multiple runs (map stability). Lastly, a meta-clustering analysis was performed. This represents an auto-gating strategy where the algorithm attempts to classify cell populations across clusters based on their cytokine profile. The code used to generate the clustering analysis and high-resolution copies of cluster maps are provided in the supplemental data. Scaled, centered values were used to generate the heatmap for BALF cytokine data (gplots package, R). Cytokine profiles were hierarchically clustered (using complete linkage clustering and Euclidean distance). Individual cytokine comparisons were plotted and compared using GraphPad Prism. Two-tailed nonparametric tests (Mann-Whitney) were used to compare mean differences between control and CIP cytokine values. A P value less than 0.05 was accepted as significant. Study approval. IRB and ethical approval as well as consent was obtained for all participants in this study. All human work was approved by the IRB at the Johns Hopkins Hospital. Author contributions KS was responsible for flow cytometric and multiplex experimental design, data processing and statistical analysis, manuscript writing and review, and figure preparation. JN was responsible for study design, IRB and clinical database design/administration, clinical data analysis, and manuscript writing and review. KS, FD, JN, JRB, SKD, M Shafiq, PMF, JM, MVF, LC, M Soloski, and VA were responsible for study design. KS, FD, QZ, YX, TP, AB, JM, MVF, LC, VA, DSE, KAM, RJK, CLH, BL, JLF, CTL, DFK, ADL, HL, M Shafiq, LY, M Soloski, and EJL were responsible for conducting experiments/adjudication of patient data/data acquisition. QZ, YX, TP, KS, FD, and AB were responsible for data analysis. KS, FD, JN, and SKD were responsible for writing the manuscript. All authors reviewed and edited the manuscript. Supplemental material Acknowledgments We wish to thank Naresh Punjabi, Larissa Shimoda, and Mahendra Damarla for their comments on design and interpretation of unsupervised clustering analyses, the Bayview Immunomics Core for their technical expertise with BALF cytokine measurement, and the Bloomberg~Kimmel Institute for Cancer Immunotherapy for research and administrative support. This research supported in part by the National Institutes of Health (NIH HL132055, HL131812), Department of Defense (DoDW81XWH-16-1-0510) and the Bloomberg~Kimmel Institute for Cancer Immunotherapy. Footnotes Conflict of interest: The authors have declared that no conflict of interest exists. Copyright: © 2019, American Society for Clinical Investigation. Reference information: J Clin Invest. https://doi.org/10.1172/JCI128654. References Lipson EJ, Forde PM, Hammers HJ, Emens LA, Taube JM, Topalian SL. Antagonists of PD-1 and PD-L1 in cancer treatment. Semin Oncol. 2015;42(4):587–600. View this article via: PubMed CrossRef Google Scholar Brahmer J, et al. Nivolumab versus docetaxel in advanced squamous-cell non-small-cell lung cancer. N Engl J Med. 2015;373(2):123–135. View this article via: PubMed CrossRef Google Scholar Hellmann MD, et al. Nivolumab plus ipilimumab as first-line treatment for advanced non-small-cell lung cancer (CheckMate 012): results of an open-label, phase 1, multicohort study. Lancet Oncol. 2017;18(1):31–41. View this article via: PubMed CrossRef Google Scholar Balaji A, Verde F, Suresh K, Naidoo J. Pneumonitis from anti-PD-1/ PD-L1 therapy. Oncology (Williston Park, NY). 2017;31(10):739–746, 754. Suresh K, Naidoo J, Lin CT, Danoff S. Immune checkpoint immunotherapy for non-small cell lung cancer: benefits and pulmonary toxicities. Chest. 2018;154(6):1416–1423. View this article via: PubMed CrossRef Google Scholar ARDS Definition Task Force , et al. Acute respiratory distress syndrome: the Berlin Definition. JAMA. 2012;307(23):2526–2533. View this article via: PubMed Google Scholar Khunger M, et al. Incidence of pneumonitis with use of programmed death 1 and programmed death-ligand 1 inhibitors in non-small cell lung cancer: a systematic review and meta-analysis of trials. Chest. 2017;152(2):271–281. View this article via: PubMed CrossRef Google Scholar Forde PM, Chaft JE, Pardoll DM. Neoadjuvant PD-1 blockade in resectable lung cancer. N Engl J Med. 2018;379(9):e14. View this article via: CrossRef Google Scholar Cho JY, et al. Characteristics, incidence, and risk factors of immune checkpoint inhibitor-related pneumonitis in patients with non-small cell lung cancer. Lung Cancer. 2018;125:150–156. View this article via: PubMed CrossRef Google Scholar Suresh K, et al. Pneumonitis in non-small cell lung cancer patients receiving immune checkpoint immunotherapy: incidence and risk factors. J Thorac Oncol. 2018;13(12):1930–1939. View this article via: PubMed CrossRef Google Scholar Naidoo J, et al. A multidisciplinary toxicity team for cancer immunotherapy-related adverse events. J Natl Compr Canc Netw. 2019;17(6):712–720. View this article via: PubMed CrossRef Google Scholar Suresh K, et al. Pneumonitis in non-small cell lung cancer patients receiving immune checkpoint immunotherapy: incidence and risk factors. J Thorac Oncol. 2018;13(12):1930–1939. View this article via: PubMed CrossRef Google Scholar Suresh K, et al. Impact of checkpoint inhibitor pneumonitis on survival in NSCLC patients receiving immune checkpoint immunotherapy. J Thorac Oncol. 2019;14(3):494–502. View this article via: PubMed CrossRef Google Scholar Puzanov I, et al. Managing toxicities associated with immune checkpoint inhibitors: consensus recommendations from the Society for Immunotherapy of Cancer (SITC) Toxicity Management Working Group. J Immunother Cancer. 2017;5(1):95. View this article via: PubMed CrossRef Google Scholar Naidoo J, et al. Pneumonitis in patients treated with anti-programmed death-1/programmed death ligand 1 therapy. J Clin Oncol. 2017;35(7):709–717. View this article via: PubMed CrossRef Google Scholar Tirumani SH, et al. Radiographic profiling of immune-related adverse events in advanced melanoma patients treated with ipilimumab. Cancer Immunol Res. 2015;3(10):1185–1192. View this article via: PubMed CrossRef Google Scholar Meyer KC, et al. An official American Thoracic Society clinical practice guideline: the clinical utility of bronchoalveolar lavage cellular analysis in interstitial lung disease. Am J Respir Crit Care Med. 2012;185(9):1004–1014. View this article via: PubMed CrossRef Google Scholar Lucas M, et al. Ex vivo phenotype and frequency of influenza virus-specific CD4 memory T cells. J Virol. 2004;78(13):7284–7287. View this article via: PubMed CrossRef Google Scholar Agostini C, et al. Involvement of the IP-10 chemokine in sarcoid granulomatous reactions. J Immunol. 1998;161(11):6413–6420. View this article via: PubMed Google Scholar Prasse A, et al. Th1 cytokine pattern in sarcoidosis is expressed by bronchoalveolar CD4+ and CD8+ T cells. Clin Exp Immunol. 2000;122(2):241–248. View this article via: PubMed CrossRef Google Scholar Yamasaki H, Ando M, Brazer W, Center DM, Cruikshank WW. Polarized type 1 cytokine profile in bronchoalveolar lavage T cells of patients with hypersensitivity pneumonitis. J Immunol. 1999;163(6):3516–3523. View this article via: PubMed Google Scholar D’Alessio FR, et al. Resolution of experimental lung injury by monocyte-derived inducible nitric oxide synthase. J Immunol. 2012;189(5):2234–2245. View this article via: PubMed CrossRef Google Scholar Gianchecchi E, Fierabracci A. Inhibitory receptors and pathways of lymphocytes in the role of PD-1 in Treg development and their involvement in autoimmunity onset and cancer progression. Front Immunol. 2018;9:2374. View this article via: PubMed Google Scholar Rowshanravan B, Halliday N, Sansom DM. CTLA-4: a moving target in immunotherapy. Blood. 2018;131(1):58–67. View this article via: PubMed Google Scholar Lopez-Castejon G, Brough D. Understanding the mechanism of IL-1β secretion. Cytokine Growth Factor Rev. 2011;22(4):189–195. View this article via: PubMed CrossRef Google Scholar Cooper AM, Khader SA. IL-12p40: an inherently agonistic cytokine. Trends Immunol. 2007;28(1):33–38. View this article via: PubMed CrossRef Google Scholar D’Andrea A, et al. Production of natural killer cell stimulatory factor (interleukin 12) by peripheral blood mononuclear cells. J Exp Med. 1992;176(5):1387–1398. View this article via: PubMed CrossRef Google Scholar Walter MJ, Kajiwara N, Karanja P, Castro M, Holtzman MJ. Interleukin 12 p40 production by barrier epithelial cells during airway inflammation. J Exp Med. 2001;193(3):339–351. View this article via: PubMed CrossRef Google Scholar Sung JH, et al. Chemokine guidance of central memory T cells is critical for antiviral recall responses in lymph nodes. Cell. 2012;150(6):1249–1263. View this article via: PubMed CrossRef Google Scholar Mannon PJ, et al. Anti-interleukin-12 antibody for active Crohn’s disease. N Engl J Med. 2004;351(20):2069–2079. View this article via: PubMed CrossRef Google Scholar Mayer L, et al. Anti-IP-10 antibody (BMS-936557) for ulcerative colitis: a phase II randomised study. Gut. 2014;63(3):442–450. View this article via: PubMed CrossRef Google Scholar Starner TD, Barker CK, Jia HP, Kang Y, McCray PB. CCL20 is an inducible product of human airway epithelia with innate immune properties. Am J Respir Cell Mol Biol. 2003;29(5):627–633. View this article via: PubMed CrossRef Google Scholar Medoff BD, et al. CD11b+ myeloid cells are the key mediators of Th2 cell homing into the airway in allergic inflammation. J Immunol. 2009;182(1):623–635. View this article via: PubMed CrossRef Google Scholar Ridings PC, et al. A dual-binding antibody to E- and L-selectin attenuates sepsis-induced lung injury. Am J Respir Crit Care Med. 1995;152(1):247–253. View this article via: PubMed CrossRef Google Scholar Seekamp A, Regel G, Rother K, Jutila M. The effect of anti-L-selectin (EL-246) on remote lung injury after infrarenal ischemia/reperfusion. Shock. 1997;7(6):447–454. View this article via: PubMed CrossRef Google Scholar Kolb M, Margetts PJ, Anthony DC, Pitossi F, Gauldie J. Transient expression of IL-1beta induces acute lung injury and chronic repair leading to pulmonary fibrosis. J Clin Invest. 2001;107(12):1529–1536. View this article via: JCI PubMed CrossRef Google Scholar Heffner DK. Treatments for pulmonary sarcoidosis. Respir Med. 2008;102(11):1674. View this article via: PubMed CrossRef Google Scholar Mock JR, et al. Foxp3+ regulatory T cells promote lung epithelial proliferation. Mucosal Immunol. 2014;7(6):1440–1451. View this article via: PubMed CrossRef Google Scholar Singer BD, et al. Regulatory T cell DNA methyltransferase inhibition accelerates resolution of lung inflammation. Am J Respir Cell Mol Biol. 2015;52(5):641–652. View this article via: PubMed CrossRef Google Scholar Puzanov I, et al. Managing toxicities associated with immune checkpoint inhibitors: consensus recommendations from the Society for Immunotherapy of Cancer (SITC) Toxicity Management Working Group. J Immunother Cancer. 2017;5(1):95. View this article via: PubMed CrossRef Google Scholar Haslam PL, Baughman RP. Report of ERS Task Force: guidelines for measurement of acellular components and standardization of BAL. Eur Respir J. 1999;14(2):245–248. View this article via: PubMed Google Scholar R Core Team. R: A language and environment for statistical computing. R Foundation for Statistical Computing, Vienna, Austria. http://www.R-project.org/ Accessed July 11, 2019. Hahne F, et al. flowCore: a Bioconductor package for high throughput flow cytometry. BMC Bioinformatics. 2009;10:106. View this article via: PubMed Google Scholar Van Gassen S, et al. FlowSOM: using self-organizing maps for visualization and interpretation of cytometry data. Cytometry. 2015;87(7):636–645. View this article via: PubMed Google Scholar Version history Version 1 (July 16, 2019): In-Press Preview Version 2 (September 4, 2019): Electronic publication
Il1rl1 (also known as ST2) is a member of the IL-1 superfamily and its only known ligand is IL-33. ST2 exists in two forms as splice variants: a soluble form (sST2), which acts as a decoy receptor, sequesters free IL-33, and does not signal, and a membrane bound form (ST2), which activates the MyD88/NF-κB signaling pathway to enhance mast cell, Th2, regulatory T cell (Treg), and innate lymphoid cell type 2 (ILC2) functions. sST2 levels are increased in patients with active inflammatory bowel disease, acute cardiac and small bowel transplant allograft rejection, colon and gastric cancers, gut mucosal damage during viral infection, pulmonary disease, heart disease, and graft-versus-host disease (GVHD). Recently, sST2 has been shown to be secreted by intestinal pro-inflammatory T cells during gut inflammation; on the contrary, protective ST2 expressing Tregs are decreased, implicating that ST2/IL-33 signaling may play an important role in intestinal disease. This review will focus on what is known on its signaling during various inflammatory disease states and highlight potential avenues to intervene in ST2/IL-33 signaling as treatment options.
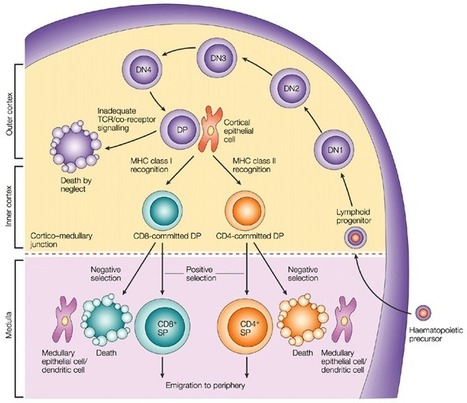
T Lymphocytes Development and markers for major T cell subtypes It is well established that CD4-CD8- T cell precursors migrate to the thymus where they undergo the following phenotypical stages: CD44+CD25- (DN1), CD44+CD25+ (DN2), CD44-CD25+ (DN3), and CD44-CD25- (DN4), followed by the progression of DN4 cells into the double-positive CD4+CD8+ T cells [5] (Figure 1). Infection by various pathogens causes activation and proliferation of naïve T cells, which differentiate into lineages with effector and memory fates. Naive CD4+ T cells recognize antigens presented by major histocompatibility complex (MHC) class II on antigen-presenting cells. Depending on the specific stimuli, the CD4+ T cells can differentiate into various subtypes, including the helper TH1, TH2 and TH17 cells and regulatory T cells (Tregs). A subset of TH2 cells differentiate into allergic disease-related H2A cells, with a CD45RBlow CD27− phenotype and coexpression of the chemoattractant receptor CRTH2, the natural killer cell marker CD161, and the homing receptor CD49d [6]. Memory T cells vary in their surface receptor expression, effector and trafficking abilities. There are four major subsets of memory T cells: central memory, effector memory, tissue-resident memory and stem memory T cells. Multiple signals regulate the differentiation of CD4+ T cells into central and peripheral memory cells. CD4+ T central memory cells express CD62L and CCR7, which are important for their migration [7]. The peripheral T stem cell memory cells express CXCR3 and CD95 molecules. In addition, both naive and memory T-cell subsets express a variety of functional molecules (Table 1). Process Antigen Function Costimulation/Survival CD27 Costimulation CD28 Costimulation CD127 IL-7 signaling PD-1 Inhibition of effector function CD122 IL-2/IL-15 signaling CD132 γc cytokine signaling KLRG-1 Inhibition of effector function Activation HLA DR Peptide presentation CD38 Calcium flux/signal transduction CD69 Proliferation Adhesion CD11a Adhesion to APC/endothelium CD58 Adhesion to APC CD99 Transendothelial migration Migration CD62L Secondary lymphoid tissues homing CD103 Gut homing CCR4 Chemokine response/TH2 associated CCR5 Homing to inflamed tissues CCR6 Chemokine response/TH17 associated CCR9 Gut homing CCR10 Skin homing CXCR3 Homing to inflamed tissues CXCR4 Homing to bone marrow CLA Skin homing Cytolytic molecules Granzyme A Cleavage of cellular proteins Granzyme B Cleavage of cellular proteins Perforin Pore-forming Miscellaneous CD161 Regulation of proliferation/cytotoxicity IL-18Ra 18Ra Response to IL-18 c-Kit Response to SCF CD130 Response to IL-6 The second major group of T cells, CD8+ T cells, mediates direct killing of antigen-presenting target cells. Naive CD8+ T cells are activated upon recognition of antigens presented by MHC class I on dendritic cells in the spleen or lymph nodes. Activated CD8+ T cells expand and become effector CD8+ T cells. The majority of the T cells bear α and β chains in their T cell receptor (TCR). However, there is a population of T cells, which have TCR formed by γ and δ chains. These cells, gamma delta T cells, are significantly enriched in epithelia [9, 10]. Gamma delta T cells regulate immune responses by various mechanisms, including suppression of effector T cell and TH1 cell functions, blockage of neutrophil influx and regulation of antigen-presenting cell activity. Markers for maturation processes Naive T cells are considered as precursors of the majority of antigen-activated T cell subpopulations. Human naïve CD4+ T cells express CD45RA, CCR7, CD62L and CD27. Upon recognition of antigens presented by major histocompatibility complex (MHC) class II on antigen-presenting cells, naïve CD4+ T cells undergo proliferation and differentiation into functionally different T cell subsets including IFN-γ producing helper T cell-1 cells (TH1), IL-4-producing TH2, IL-17-producing TH17 cells, and inducible regulatory T cells (iTregs) (Figure 2). Each T cell subset expresses specific transcription factors, such as T-bet (TH1), GATA3 (TH2), RORγt (TH17), and Foxp3 (CD25+ Tregs). With regard to TH17 cells, their differentiation is under control TGF-β and IL-6-induced differentiation, IL-21-induced activation, and IL-23-regulated stabilization [11, 12]. As to iTregs, FOXP3 was found to an important marker of natural CD4+CD25+ regulatory T cells. Moreover, transfection of CD4+CD25- T cells with Foxp3 stimulates their regulatory activity [13]. In addition, TGF-β was found to be crucial for the differentiation of naive CD4+ T cells into Foxp3+ Tregs [14]. Also, IL-2 is commonly required for TGF-β-regulated iTreg differentiation [15]. With regard to cytotoxic T cells, there are several peripheral subsets of different subsets of CD8+ T cells based on the expression of CD45RA and CCR7: a CD45RA+CCR7+ subset of naive cells, a CD45RA-CCR7+ subset of antigen-experienced memory T cells, a CD45RA-CCR7- effector memory cell subset, and a CD45RA+CCR7− subset of differentiated, antigen-experienced effector cells. Also, there are effector memory CD8+ T cells expressing CD69 and CD103 and residing in non-lymphoid tissues [16, 17]. A subpopulation of CD8+ T cells shows a memory cell phenotype: CD62L-/+CCR7+CD27-/+. Activated cytotoxic CD8+ T cells downregulate expression of L-selectin and CCR7 and upregulate surface expression of CD44, LFA-1 and/or α4β1 integrin. Additional phenotypical markers of Tregs There are several additional phenotypical markers expressed in both human and mouse Tregs. They include CTLA-4, CD103, GITR and OX40. In particular, CTLA-4 is important for both inhibitory functions and homeostasis of Tregs. Intracellular expression of CTLA-4 was observed in CD4+CD25+ human Tregs [18]. Another marker, integrin α (CD103) is expressed by Tregs and CD4+CD25+CD103+ Tregs were demonstrated to produce IL-10 actively [19]. In addition, GITR (CD357) is expressed in CD4+CD25+ human Tregs in peripheral blood [20]. Also, OX40 (CD134) was shown to stimulate the proliferation of CD4+FoxP3+ Tregs [21]. Moreover, OX40 stimulates migration of Tregs into the peripheral lymphoid and other tissues during inflammation [22]. T cell subsets that regulate B cell functions in the germinal centers Several specific T cell subsets, including follicular B helper T cells (TFH), follicular regulatory T cells (TFR) and cytotoxic CD8+ T cells, reside in the germinal centers and regulate the B cell proliferation [23]. Among these T cell subpopulations, TFH cells belong to CD4+ T cells and assist follicular B cells located in secondary lymphoid tissues, such as lymph nodes, spleen, and tonsils. Concerning the specific markers, high expression of CXC-chemokine receptor 5 (CXCR5) characterizes TFH cells [24]. Its interaction with CXC-chemokine ligand 13 (CXCL13) produced by follicular stromal cells mediates the homing of TFH cells into lymphoid follicles [24]. The development of TFH cells is strongly dependent on IL-2 production, as naїve IL2-secreting CD4+ T cells are destined to differentiate into TFH cells, while other CD4+ T cells, which do not produce IL-2, develop into non-TFH cells [25]. In addition to a universal T cell marker Thy1 (CD90) and CXCR5, TFH cells express ICOS and PD-1 molecules. Upregulation of CXCR5 expression stimulates TFH cells to migrate into the germinal centers, where these cells stabilize their phenotype by contacts with local B cells via ICOS-ICOSL binding [26]. Concerning the regulation of TFH functions, γδ T cells (TCRγδ+CXCR5+ T cells), which also reside in the lymph nodes, have recently been shown to present antigens to TFH cells and induce their activation [27]. Cellular interactions with TFH cells regulate the proliferation and maturation of B cells in the germinal centers [28]. Besides, TFH cells secrete Il-4 and IL-21 cytokines, which are crucial for the functioning of the germinal centers [28]. Moreover, in the germinal centers, TFH cells are represented by two distinct subpopulations: IL-21+ T cells regulating the selection of high-affinity B cells and IL-4+ T cells promoting differentiation of plasmocytes [29]. Several studies have shown that chronic viral infection strongly induces differentiation of TFH, which leads to non-specific B cell activation [30]. In addition to TFH cells, researchers have identified TFR cells in the germinal centers. This subset of T cells expresses Foxp3 and also regulates the activity of germinal centers [31]. TFR cells suppress the proliferation of B cells and the production of IgM and IgG antibodies [31, 32] and diminish the secretion of IL-4 and IL-21 by TFH cells in the germinal centers [33]. Measurement of T cell immune responses The standard methods for measurement of T cell immune responses include Enzyme-Linked Immuno Spot assay (ELISpot), Intracellular Cytokine Staining assay (ICS), Tetramer assay and Flow Cytometry. The ELISpot and ICS assays apply in vitro stimulation to analyze the cytokine expression profiles of responding cells. The ELISpot method detects spots of cytokines secreted by individual cells, and ICS examines surface markers and produced cytokines. Multiple approaches can measure the proliferation of T cells in response to specific antigens, including thymidine incorporation assay, flow cytometric analysis of CD38 expression or ELISA detection of BrdU incorporation into DNA of proliferating T cells. T cell immunotherapy T cell immunotherapy has yielded promising results for cancer treatment. Generally speaking, there are two main methods of T cell immunotherapy: 1) application of genetically modified T cell receptors (TCRs) recognizing tumor antigens in relation to HLA and 2) application of chimeric antigen receptors (CARs), which allow binding antigens without HLA recognition [34]. In contrast to CARs, TCRs may recognize both membrane and intracellular antigens. The α and β chains of TCRs recognize T cell targets, and genetic modification of TCR chains modifies antigen specificity. In particular, TCR for MART-1, gp100, and NY ESO-1 have shown anti-cancer activity in patients with melanoma [35]. Other tumors sensitive to TCR modification therapy include lymphoma [36], neuroblastoma [37] and sarcoma [38]. CARs also modify antigen-specific T cell functions and were effective for the treatment of B cell malignancies [39]. The insertion of co-stimulatory signaling regions into the cytoplasmic domain of CARs significantly upregulated the activity of CAR-modified T cells [40, 41]. These co-stimulatory regions include different domains, such as CD28 [42] and OX40 [43], and can modify the T cell cytotoxic activity, proliferation, and survival. The therapeutic method of applying cells expanded ex vivo is named adoptive cell transfer. This treatment uses specific T cells isolated from fragmented tumor tissues. Isolated T cells can be expanded with the help of IL-2, selected and adoptively transferred into patients. Before the adoptive cell transfer, the patients undergo lymphodepletion by either chemotherapy or irradiation [44]. B Lymphocytes Markers for major B cell subtypes There are three main subsets of naïve B lymphocytes: follicular B cells, marginal zone B cells and B1 B cells. Mature follicular B cells migrate through blood and lymph, reside in specific B cell areas of lymph nodes, Peyer’s patches, and the spleen and may present T-dependent antigens to T cells. Marginal zone CD19+CD21+CD23-CD24+IgM+ B cells reside in the marginal sinus of the spleen and mediate the transport of antigen in immune complexes. B1 cells are involved in the development of IgM responses to bacterial T cell-independent antigens. These cells can migrate from the peritoneum and reside in mesenteric lymph nodes. Memory B-cells are represented by three subsets: pre-switch IgD+IgM+CD27+ B cells, IgD-IgM+CD27+ B cells, post-switch IgA+CD27+ and IgG+CD27+ B cells and IgA+CD27- and IgG+CD27- memory B cells [45]. Circulating plasmablasts can be identified by the expression of CD38 and CD138 [46]. Expression of BCR expression is highly important for maintaining B cells in the peripheral immune system. However, only 30% of B cells in spleen develop into mature B cells. Moreover, mice, which have mutations in genes encoding BCR-related proteins, including BLNK, Btk, and Vav, show disruption of the maturation process [47, 48]. B cell maturation markers Lymphoid progenitors Lin-KITlowCSA1lowIL-7R+ are considered to be a lymphoid progenitor group and can differentiate into both B and T cells. Also, in vitro studies have demonstrated that B220-CD19+ cells can differentiate into myeloid or B cells [49] and Lin-KITlowSCA1lowIL-7R+FLT3+CD34- cells or B220-KITlowSCA1+CD24+CD43+ cells contain increased numbers of B cell precursors [50, 51]. Early B220+ precursors of B cells do not express cell surface immunoglobulin (Ig), reside in the bone marrow and include pre-pro-B cells, pro-B cells, and pre-B cells. Immature pre-B cells migrate to the spleen, where they differentiate into mature B cells and plasmocytes (Figure 3). Peripheral B cell subsets, including transitional, mature, memory and antibody-secreting cells, express different surface markers (Table 2). Name Type Phenotype Markers to sub-fractionate Functions Transitional T1 IgD+CD27neg CD10+CD24highCD38highMTG+ Precursor to T2; IL10 production (?) T2 IgD+CD27negCD10+CD24high/+CD38high/+MTG+ Precursor to T3; IL10 production (?) T3 IgD+CD27negCD10negCD24+/lowCD38+/lowMTG+ Precursor to mature-naive; IL10 production (?) Mature-naive IgD+CD27negCD10negCD24+/lowCD38+/lowMTGneg CD23, CD69, CD80, CD86 Precursor to GC, memory, and antibody-secreting cells Memory Double-negative IgDnegCD27neg CD21, CD24, CD95, CXCR3 Recall responses Non-switched IgD+CD27+ CD1c, CD21, CD24 Immunoprotective self antibody, regulatory IgM-only IgM+IgDnegCD27+ CD1c, CD21, CD24 Immunoprotective self antibody, regulatory Switched IgMneg IgDnegCD27+ CD21, CD24, CD95, CXCR3 Pathogen protection; autoimmune pathology Antibody-secreting cell Plasmablast IgDnegCD27highCD38highCD138neg CD20, HLA-DR Antibody secretion Plasma cell IgDnegCD27highCD38highCD138+ CD20, HLA-DR Antibody secretion In addition to IgG production, a subpopulation of splenic B cells can possess regulatory functions. Regulatory B cells (Bregs) affect various parts of the immune system with IL-10 playing a key role in these processes. The B10 subgroup of B cells was shown to act as regulatory cells in experimental models of lupus and autoimmune encephalomyelitis [53]. Moreover, IL-10 producing Bregs with the surface phenotype CD19+CD24hiCD38hi were found in the peripheral blood in SLE patients [54]. In addition, regulatory phenotypes CD19+, CD24+CD27+ and CD19+IgD+CD24hiCD38hiCD5hi were shown to have suppressive functions in humans [55, 56]. Regulatory B cells Several subsets of Bregs were characterized in human peripheral blood. These subsets include B cells with different levels of maturity: transitional CD19+CD24hiCD38hi Bregs [57, 58], CD19+CD27intCD38+, plasmablasts [59] and CD19+CD25+CD71+ B regulatory 1 cells [60]. Recent studies suggest that differentiation and stimulation of Bregs are likely to be induced by inflammation associated with either infection or autoimmune reactions. In particular, toll-like receptor agonists of bacterial origin were shown to activate Bregs in vitro [61, 62]. In addition, the proliferation of Bregs was reported in a murine model of autoimmune arthritis [63]. In addition to the subsets of Bregs mentioned above, Tim-1+ B cells were also shown to regulate immune reactions, since Tim-1 mucin domain-mutated mice develop autoimmune disorders [64]. Tim-1+ Bregs were identified within different B cell subpopulations, including CD19+CD1dhiCD5+, MZ and B1 cells [65]. Also, human CD73−CD25+CD71+ BR1 cells were demonstrated to be involved in the development of allergen tolerance [60]. Membrane regulatory molecules expressed by Bregs include CD25, CD71 and CD274 [54, 66, 67]. Measurement of antibody production One of the most important functions of B cells is antibody production. Enzyme-linked immunosorbent assay (ELISA) can analyze secreted antibodies, plaque-forming cell (PFC) assays can detect antibody-secreting B cells, and ELISPOT can indicate the number of antibody-producing B cells. Antibodies against T and B Cell Markers in the Literature Labome surveys formal publications to develop Validated Antibody Database (VAD). Table 3 lists the most cited antibodies against T cell markers and B cell markers among the 60,000 articles Labome has surveyed as of Jan 2019. Protein Gene ID Num Top three suppliers B220 5788 4117 Invitrogen 14-0452-86 (116), BioLegend 103202 (103), BD Biosciences 560777 (56) c-kit 3815 338 BioLegend 313201 (16), Cell Signaling Technology 3074 (15), Invitrogen MA5-12944 (9) CD1C 911 81 BioLegend 331501 (15), Miltenyi Biotec 130-090-508 (12), Invitrogen AHS0198 (5) CD1D 912 745 BD Biosciences 339186 (79), BioLegend 350302 (3), Santa Cruz Biotechnology sc-19632 (2) CD4 920 2492 Invitrogen MHCD0400 (118), BD Biosciences 555344 (86), BioLegend 317404 (37) CD5 921 147 Invitrogen MA5-13308 (21), Beckman Coulter IM2637U (6), BD Biosciences 644487 (6) CD8 925 2364 Invitrogen MHCD0800 (153), BD Biosciences 339188 (71), Dako M7103 (62) CD10 4311 225 Invitrogen MA5-14050 (56), BD Biosciences 555373 (15), BioLegend 312202 (10) CD11a 3683 74 Invitrogen MA1-19003 (7), BD Biosciences 555381 (4), Abcam ab52895 (3) CD19 930 1362 BioLegend 302202 (53), BD Biosciences 564457 (52), Invitrogen MHCD1921 (39) CD21 1380 89 Invitrogen MA5-11417 (11), BD Biosciences 555421 (9), Dako M0784 (5) CD23 2208 64 Invitrogen MA5-14572 (11), BD Biosciences 550386 (3), Santa Cruz Biotechnology sc-18910 (1) CD24 100133941 311 Invitrogen MA5-11833 (72), BD Biosciences 555428 (26), BioLegend 311102 (5) CD25 3559 778 BD Biosciences 560356 (57), BioLegend 302602 (27), Invitrogen MHCD2506 (17) CD27 939 641 BD Biosciences 561408 (33), Invitrogen 14-0271-82 (26), BioLegend 302839 (25) CD28 940 392 BioLegend 302902 (18), BD Biosciences 556620 (16), Invitrogen 16-0289-85 (13) CD38 952 542 BD Biosciences 646852 (27), Invitrogen MA1-19316 (24), BioLegend 303502 (24) CD44 960 2374 BioLegend 103002 (106), Invitrogen 14-0441-81 (89), BD Biosciences 550392 (31) CD45RB 5788 4117 Invitrogen 14-0452-86 (116), BioLegend 103202 (103), BD Biosciences 560777 (56) CD49d 3676 102 BD Biosciences 555501 (7), BioLegend 304302 (6), R&D Systems BBA37 (6) CD58 965 11 BD Biosciences 555921 (3), Beckman Coulter IM3702 (2), BioLegend 330902 (1) CD62L 6402 306 Invitrogen MA1-10259 (27), BD Biosciences 555542 (22), BioLegend 304802 (15) CD69 969 360 BioLegend 310902 (27), BD Biosciences 560740 (24), Invitrogen MA1-207 (14) CD71 7037 870 Invitrogen 13-6800 (435), BD Biosciences 555534 (13), BioLegend 334102 (4) CD73 4907 173 BD Biosciences 550257 (45), Invitrogen 41-0200 (4), Santa Cruz Biotechnology sc-32299 (3) CD80 941 300 BD Biosciences 557223 (22), BioLegend 305201 (19), Invitrogen MA1-19215 (15) CD86 942 489 Invitrogen MA1-10293 (33), BioLegend 305402 (29), BD Biosciences 555656 (21) CD95 355 334 BD Biosciences 555670 (24), EMD Millipore 05-201 (14), BioLegend 305614 (11) CD99 4267 32 Dako M3601 (16), Invitrogen MA5-12287 (5), BioLegend 915603 (1) CD103 3682 85 Invitrogen 14-1038-82 (7), BioLegend 350202 (7), Beckman Coulter IM1856U (4) CD130 3572 9 BioLegend 362003 (1), BD Biosciences 555757 (1) CD134 7293 27 BD Biosciences 555838 (4), BioLegend 350002 (3), Invitrogen 14-1347-82 (1) CD138 6382 133 Dako M7228 (15), Abcam ab34164 (11), BD Biosciences 650660 (11) CD161 3820 127 BioLegend 339902 (14), BD Biosciences 556079 (9), Miltenyi Biotec 130-092-676 (4) CD127 3575 270 Invitrogen 14-1278-82 (26), BioLegend 351302 (20), BD Biosciences 552853 (16) CD274 29126 338 BioLegend 329701 (16), Invitrogen 14-5983-80 (14), Abcam ab205921 (5) CD357 8784 12 Invitrogen 12-5875-42 (3), BioLegend 311610 (1) CCR4 1233 49 BD Biosciences 551121 (11), BioLegend 359402 (5), R&D Systems MAB1567-100 (4) CCR5 1234 102 BD Biosciences 555991 (12), BioLegend 313712 (4), Invitrogen 12-1957-42 (1) CCR6 1235 154 BD Biosciences 559560 (16), BioLegend 353402 (15), Invitrogen 14-1969-82 (4) CCR7 1236 314 BD Biosciences 552174 (31), BioLegend 353202 (26), Invitrogen 14-1979-82 (13) CCR9 1238 8 R&D Systems MAB1364 (3), BD Biosciences 561607 (2) CCR10 1238 8 R&D Systems MAB1364 (3), BD Biosciences 561607 (2) CLA 6404 25 BD Biosciences 550407 (4), BioLegend 328805 (2), Abcam ab68143 (1) CXCR3 2833 156 BioLegend 353702 (16), BD Biosciences 557183 (8), R&D Systems MAB160-100 (2) CXCR4 7852 275 BioLegend 306502 (16), Invitrogen 35-8800 (15), BD Biosciences 555971 (12) CRTH2 11251 23 BioLegend 350102 (4), BD Biosciences 558412 (4), Beckman Coulter A07413 (1) FoxP3 50943 506 Invitrogen 14-4776-82 (56), Abcam ab20034 (34), BioLegend 320102 (12) Granzyme A 3001 21 BioLegend 507202 (9), BD Biosciences 557449 (1) Granzyme B 3002 320 Invitrogen MA1-80734 (53), BD Biosciences 561151 (28), BioLegend 515406 (21) IL-18Ra 8809 26 BioLegend 313802 (4), R&D Systems MAB840-100 (4), Invitrogen MA1-20257 (1) KLRG-1 10219 27 BioLegend 138429 (6), Santa Cruz Biotechnology sc-32755 L (1), Miltenyi Biotec 130-103-638 (1) MTG 5646 PD-1 5133 509 BioLegend 329902 (42), Invitrogen 14-2799-80 (11), BD Biosciences 562138 (11) Perforin 5551 89 BioLegend 308102 (12), Invitrogen 14-9994-82 (9), BD Biosciences 556434 (8) SCA1 836 1941 Cell Signaling Technology 9664 (362), Novus Biologicals NB100-56708 (41), BD Biosciences 559565 (34) Of Note CD45, also called leukocyte common antigen(LCA), regarded as a pan-immune marker, has also been found in rare epithelial cells in mouse intestine [68], more specifically in tuft-2 cells [69].
Regulatory T cells (Tregs) can impair anti-tumor immune responses and are associated with poor prognosis in multiple cancer types. Tregs in human tumors span diverse transcriptional states distinct from those of peripheral Tregs, but their contribution to tumor development remains unknown. Here, we used single cell RNA-Seq to longitudinally profile conventional CD4+ T cells (Tconv) and Tregs in a genetic mouse model of lung adenocarcinoma. Tissue-infiltrating and peripheral CD4+ T cells differed, highlighting divergent pathways of activation during tumorigenesis. Longitudinal shifts in Treg heterogeneity suggested increased terminal differentiation and stabilization of an effector phenotype over time. In particular, effector Tregs had enhanced expression of the interleukin 33 receptor ST2. Treg-specific deletion of ST2 reduced effector Tregs, increased infiltration of CD8+ T cells into tumors, and decreased tumor burden. Our study shows that ST2 plays a critical role in Treg-mediated immunosuppression in cancer, highlighting new potential paths for therapeutic intervention.

Visualizing TGF-β1 regulation by GARP Via Krishan Maggon

IV. THE ORIGIN OF DARWINIAN IMMUNITY IN VERTEBRATES Above, we argued that the origin of Darwinian immunity constitutes a major transition in evolution. We now speculate on how it might have happened in the lineage of vertebrates. We propose that the transition occurred only once, before the split between jawed and jawless vertebrates, and explain why we believe that the transition was limited by a difficult evolutionary innovation, rather than the presence or absence of selection pressure for Darwinian immunity. We offer a hypothesis on the nature of the limiting innovation, and outline possible routes of stepwise evolution once the bottleneck had been passed. (1) A single origin There are good reasons to believe that the Darwinian immune systems of jawless and jawed vertebrates can be traced back to a common root, and thus that the major transition occurred only once, in a common ancestor of the two lineages. Lampreys have three distinct classes of lymphocytes that provide cellular and humoral immunity, resembling both major lineages of T cells and B cells of jawed vertebrates, respectively (Guo et al., 2009; Hirano et al., 2013). The similarities between not only functions, but also gene expression profiles suggest that the three kinds of lymphocytes are homologous between the two groups and pre‐date the divergence of jawed and jawless vertebrates (Flajnik, 2014; Kasahara & Sutoh, 2014). In addition, jawless fish have thymus‐like lympho‐epithelial structures (‘thymoids’) that are thought to serve as the sites of lymphocyte development (Bajoghli et al., 2011), and express the lamprey orthologue of the gene encoding forkhead box N1 (Foxn1) transcription factor, a marker of the thymopoietic microenvironment in jawed vertebrates. Finally, receptor diversity in jawless fish is generated by the action of enzymes that are closely related to the gnathostome activation‐induced cytosine deaminase (AID) (Rogozin et al., 2007), which is active in the diversification of B‐cell receptors. The apparent homology of multiple components of clonal selection‐based immunity between jawed and jawless vertebrates strongly suggests that the roots of the system originated in the common ancestor of all vertebrates. (2) Chance or necessity The apparently unique origin of Darwinian immunity can be explained in two possible ways. Either, the transition involved a difficult (i.e. low‐probability) event that occurred only once, ‘by chance’, in a common ancestor of all vertebrates [classifying this transition as ‘variation‐limited’ (Számadó & Szathmáry, 2006)]; or, the selective forces that favour the emergence of Darwinian immunity appeared first (and only) in vertebrates and have then driven, ‘by necessity’, the stepwise evolution of the system [in the frame of a ‘selection‐limited’ transition (Számadó & Szathmáry, 2006)]. Historically, the discovery of the intricate molecular mechanisms of V(D)J recombination (the only mechanism of somatic receptor diversity then known) led researchers to favour the first alternative, assuming a once‐only low‐probability event for the origin of this system. Marchalonis & Schluter (1990, p. 16) termed this event ‘a “Big Bang” because sophisticated rearranging systems consisting of multiple elements appear in a fully functional form without foreshadowing in the antecedent species’. This notion was further strengthened by the recognition that the molecular machinery of V(D)J recombination likely arose by the integration of recombination‐activating genes (RAGs) into the vertebrate genome by horizontal gene transfer (Bernstein et al., 1996; Fugmann, 2010). However, subsequent discoveries have challenged the key role of V(D)J recombination in the origin of Darwinian immunity. First, the discovery of RAG1/2 in sea urchins (Fugmann et al., 2006) suggested that the original horizontal gene transfer event must have preceded the origin of vertebrates. Second, we now know that RAG‐mediated V(D)J recombination [enhanced with non‐templated nucleotide addition diversity (Kallenbach et al., 1992)] is far from being the only mechanism that can generate somatic receptor diversity. Jawless fish generate receptor diversity by RAG‐independent gene conversion (Nagawa et al., 2007), subsets of immunoglobulin (Ig) genes in some jawed vertebrates (sharks, birds, rabbits, sheep) rely heavily on gene conversion and hypermutation to generate antibody diversity (Flajnik & Kasahara, 2010), and invertebrate systems of shotgun immunity generate somatic diversity by gene conversion, alternative splicing, RNA editing, post‐translational modifications, and possibly even somatic recombination (Ghosh et al., 2011). Mechanisms of somatic diversity have thus evolved multiple times independently, and are unlikely to be a limiting ‘bottleneck’ in the evolution of Darwinian immunity. Although it cannot be ruled out that the evolution of V(D)J recombination in particular might have been triggered by a second (intragenomic) transposition event that inserted the RAG transposon into a variable innate immune receptor gene (Koonin & Krupovic, 2015), this can no longer be regarded as ‘the Big Bang’ of adaptive immunity, but rather as one of several ‘smaller bangs’ (Bartl et al., 2003; Flajnik, 2014). Kasahara (1997, 1998) argued that the triggering event of the ‘Big Bang’ might have been the one or two rounds of whole‐genome duplication (WGD) that occurred close to the origin of vertebrates (Smith et al., 2013; Smith & Keinath, 2015). This event duplicated many genes related to immunity, and it ‘might have provided unique opportunities to create many accessory and effector molecules of the adaptive immune system’ (Kasahara et al., 1997, p. 92). We will return to this idea in Section IV.4, proposing possible scenarios as to how the WGD event might have triggered the origin of Darwinian immunity. In turn, several studies have argued against the key role of a single triggering event. Klein & Nikolaidis (2005, p. 174) [along the lines of an earlier argument by Bartl et al. (2003)] favour gradual evolution that ‘consisted initially of changes unrelated to immune response that were selected to serve other functions’ and that, by chance, attained a combination that integrated the elements into a new function giving rise to adaptive immunity. Litman, Rast & Fugmann (2010) also emphasized co‐option and redirection of pre‐existing systems as the main source of innovation, at the same time perceiving ‘no reason to assume that vertebrates require a complex immune system any more than do complex invertebrates’ (Litman et al., 2010, p. 552). However, if the origin of Darwinian immunity is not dependent on a ‘difficult’ (i.e. low‐probability) transition, then vertebrates must have some specific traits that favour Darwinian immunity in this group, but are absent from others. (3) Selective scenarios: not exclusive to vertebrates Long lifespan (Klein, 1989; Lee, 2006) and slow reproduction (Flajnik, 1998; Lee, 2006; Flajnik & Kasahara, 2010), high metabolic intensity (Rolff, 2007; Sandmeier & Tracy, 2014), efficient closed circulation (van Niekerk, Davis & Engelbrecht, 2015), low population density (Klein, 1989) and large (Klein, 1989; Flajnik & Kasahara, 2010) or morphologically complex (Boehm, 2012) bodies have been invoked as factors favouring (Darwinian) adaptive immunity. However, these traits are not exclusive to vertebrates, and, in fact, the last common chordate ancestor (and therefore also the ancestral vertebrate) was probably a lancelet‐(amphioxus‐)like creature (Lowe et al., 2015): small, not particularly long‐lived, and rather inconspicuous. The most extensive phylogenetic analysis so far estimated that the lineages of jawed vertebrates and jawless fish diverged about 650 million years ago (Blair & Hedges, 2005). While molecular clock estimates might be sensitive to assumptions on the tempo and mode of evolution, fossil evidence of two distinct types of jawless fish dated to around 520 million years ago (Shu et al., 1999) confirms that the split must have occurred before or shortly after the Cambrian Explosion: Darwinian immunity must therefore have provided a selective advantage already in the Precambrian or early Cambrian world of small body sizes and simple body plans. Many extant invertebrates very likely surpass the last common ancestor of vertebrates in both size and life expectancy, and yet (to our current knowledge) lack Darwinian immunity. Cephalopods can have large bodies and long lifespan, but Darwinian immunity (clonal selection acting on heritable somatic receptor diversity) has not been found in the group (Castellanos‐Martínez & Gestal, 2013). It must nonetheless be noted that the species investigated so far have been octopuses that have short lifespans; studies of immunity in Nautilus species that can live for several decades (Saunders, 1984) are much awaited. Some further ancestral traits of vertebrates might also have facilitated or favoured the evolution of Darwinian immunity. A closed circulatory system, which seems to be an ancestral chordate character (Stach, 2008), may well be a prerequisite of effective immune surveillance by lymphocytes; however, cephalopods also have a closed circulation. Filter feeding seems to be an ancestral trait for deuterostomes (Gans & Northcutt, 1983; Yu & Holland, 2009; Lowe et al., 2015), and is present in echinoderms (sea urchins, sea cucumbers), tunicates (sea squirts), and also cephalochordates (amphioxus), which are thought to most closely resemble the common ancestor of vertebrates (Gans & Northcutt, 1983; Yu & Holland, 2009). The evolution of this lifestyle probably generated selection pressure for improved immunity (to fight pathogens, and to avoid unnecessary or harmful responses to the myriad harmless microorganisms in the filtrate). Echinoderms (Hibino et al., 2006), amphioxus (Huang et al., 2008) and, independently, also mussels (Gerdol & Venier, 2015) and sponges (Degnan, 2015), the most ancient group of filter‐feeding organisms, took the path of expanding their repertoire of innate pattern‐recognition receptors. While expanded innate receptors indeed imply selection pressure for improved immunity, the defining traits of Darwinian immunity have not been found in any of these groups to date. It has also been noted that vertebrates harbour more complex microbiomes than invertebrates, which tend to have either relatively simple microbial communities or rely on microbial partners that are shielded from immunity within the cells or in compartments enclosed in physical barriers (McFall‐Ngai, 2007). Managing a complex microbiome has been invoked as a selection pressure that may have driven the evolution of Darwinian immunity specifically in vertebrates (Pancer & Cooper, 2006; Weaver & Hatton, 2009; Lee & Mazmanian, 2010; Boehm, 2012). However, this explanation only leads one step back, to another question: why would vertebrates be special in terms of needing a complex microbiome? We find it more plausible that Darwinian immunity evolved for another reason (a rare event that opened up a difficult evolutionary path), and could then enable the acquisition of a more complex microbiome – which then might have provided an evolutionary edge to vertebrates. A further hypothesis has been proposed by Pancer & Cooper (2006, p. 512), who posited that novel selection pressure might have arisen at the origin of vertebrates because a large arsenal of innate receptors ‘presented serious autoimmunity problems at a time of rapid developmental and morphologic innovation’, and rapid changes in the endosymbiotic communities might also have occurred. As a consequence, the complexity of the innate immune system might have been reduced, creating increased selection pressure for the evolution of an alternative system. However, innate receptors, even those belonging to complex families, tend to target classes of molecules that are not present in the host, and the complexity of the vertebrate body plan increased not so much by expanding the set of molecular building blocks, but rather by regulatory and organizational complexity (Heimberg et al., 2008; Lowe et al., 2011). Such an evolutionary trajectory would not have raised the risk of autoimmunity by innate recognition. It is also unclear why the evolution of vertebrate characteristics would have generated a selection pressure for rapid shifts in the microbiome, sufficiently strong to compensate for drastically reduced (innate) immune defence against pathogens. The discoverer of clonal selection, Burnet himself entertained the idea that it might have been the increased developmental flexibility of vertebrates that created the selection pressure for adaptive immunity (Burnet, 1968). He argued that flexible development resulted in an increased risk of cancer, and the threat from the ‘modified self’ of tumours called for a mechanism that was itself variable and adaptable. However, Darwinian immunity requires reliable mechanisms of immune tolerance to be able to target patterns that are similar to those found in the host self. As we will explain in later sections, it is likely to have started targeting motifs that showed relatively small similarity to host motifs, and could expand to riskier targets only as gradual evolution improved the specificity of targeting and the capacity for antigen‐specific tolerance. Distinguishing tumours from normal self is likely to be the most challenging task for Darwinian immunity that could only be added at advanced stages of its evolution – it cannot have been the initial trigger. Finally, we note that extant vertebrates encompass huge diversity in terms of lifestyles, body size (from shrews to the blue whale) and lifespan (from weeks to >100 years), and while some species have lost or simplified elements of adaptive immunity, the presence of clonal selection‐based Darwinian immunity seems ubiquitous across this dizzying diversity of size and form. (Moreover, the species with reduced adaptive immunity do not seem to follow any discernible pattern of size or lifestyle: these examples may simply reflect stochastic loss in some lineages). Considering that most components of vertebrate Darwinian immunity appear to be scalable in terms of diversity, and a higher diversity of innate immune recognition would probably be quite straightforward to re‐evolve [indeed Atlantic cod (Gadus morhua) have lost MHC class II and have expanded their innate Toll‐like receptor (TLR) repertoire (Star et al., 2011)], the ubiquitous maintenance of Darwinian immunity in vertebrates suggests that this type of adaptive immune defence provides benefits across a very wide range of life‐history parameters. It is hard to see how this wide range also would not cover the lifestyles of a large number of invertebrate species. To conclude, while a number of life‐history traits likely exerted selection pressure on the ancestral vertebrate to develop sophisticated immunity, and some features of the vertebrate body plan might have acted as necessary pre‐adaptations, none of these selection pressures and physical traits seem to be exclusive to this group, and Darwinian immunity would likely be beneficial for many invertebrates as well. We therefore argue that a key piece of the puzzle is still missing: there must have been a difficult evolutionary innovation that emerged, as far as we know, only in vertebrates. (4) Immunological Big Bang 2.0 What had to be invented for the transition from the invertebrate immunity of an amphioxus‐like ancestor to Darwinian vertebrate immunity? The necessary components for the somatic generation of receptor diversity were all in place: amphioxus has RAG1 (Huang et al., 2014; Zhang et al., 2014) and proto‐MHC (Abi‐Rached et al., 2002); sea urchins have RAG1/2 (Fugmann et al., 2006); and the presence of orthologous ancestral genes in both jawed and jawless vertebrates indicates that the vertebrate ancestor had both BCR/TCR and VLR precursors (Flajnik & Kasahara, 2010). In addition, lymphocyte‐like cells have been found in amphioxus (Huang et al., 2007), along with homologues of several genes that are active in immune signalling in the Darwinian immunity of vertebrates (Yu et al., 2005), and recently discovered innate lymphoid cells in mammals perform many functions associated with T cells without expressing T‐cell receptors (Walker, Barlow & McKenzie, 2013). These cells can be induced by microbial products, and NK cells that bear germline‐encoded antigen receptors (specific, e.g. for conserved structures of viruses) establish immune memory by the survival of an amplified cell population (O'Sullivan et al., 2015), possibly constituting a system of proto‐Darwinian immunity. Similar lymphocyte‐like cells bearing germline‐encoded receptors might have existed in the ancestral vertebrate [innate lymphoid cells might be present in jawless fish, as well (Eberl, Di Santo & Vivier, 2015)], and might already have possessed both the genetic circuitry required for pathogen‐induced proliferation and antimicrobial effector mechanisms. In addition to these pre‐existing components, clonal selection‐based Darwinian immunity requires two key properties (Du Pasquier, 2006). First, as recognized very early by Burnet (1970), monoallelic (or at most oligoallelic) expression of the somatically generated, clonally heritable antigen receptors is needed to allow for specific amplification (clonal selection) of an appropriate response. Stable expression and clonal heritability are required to maintain targeting specificity over time and across cell divisions; monoallelic expression is necessary to prevent the simultaneous presence of useful and useless or harmful receptors on the same cell, which would greatly abrogate the efficiency of clonal selection. Second, antigen‐specific immune tolerance is needed to avoid autoimmunity when a somatically generated receptor responds to a molecular pattern of the host (‘self’). We propose that the evolution of antigen‐specific immune tolerance is a difficult (low‐probability) transition that requires major innovations in gene regulation, and therefore imposes a critical bottleneck in the evolution of Darwinian immunity. We argue that in the evolution of vertebrates this transition was made possible by an abrupt increase in regulatory complexity [precipitated by a WGD event and a series of segmental genome duplications (Smith et al., 2013; Smith & Keinath, 2015)] before the divergence of jawless and jawed vertebrates, and once this difficult transition had been achieved, pre‐existing mechanisms of somatic receptor diversity could quickly be co‐opted for clonal selection. We term this concept the ‘Immunological Big Bang 2.0’, and below provide further arguments in its support. Of the two components of the transition, monoallelic expression of receptor genes does not seem to be particularly difficult to evolve. In addition to the antigen receptors of lymphocytes in jawed and jawless vertebrates (Pancer et al., 2004), monoallelic expression occurs in many mammalian genes not associated with immunity (Nag et al., 2013), while inhibitory receptors on mammalian NK cells (Cichocki, Miller & Anderson, 2011) are characterized by the stochastic expression of a subset of receptor genes from a larger germline‐encoded repertoire, and the 185/333 immune‐response genes expressed in sea urchin coelomocytes (a type of immune cell) display near‐monoallelic expression from a set of germline‐encoded alleles (Majeske et al., 2014). However, amplifying lymphocytes with ‘random’ (i.e. somatically generated) receptors carries the risk of autoimmunity – which brings us to the necessity of antigen‐specific tolerance for clonal selection‐based Darwinian immunity. Whereas an autoreactive response without amplification inflicts damage analogous to a fixed dose of a toxic substance, an amplifiable response is analogous to an infectious agent that can multiply and do great harm even at a very low initial dose. As soon as clonal amplification extends to immune recognition motifs that can potentially target self patterns, protective mechanisms are needed to neutralize effector cells based on their self‐reactive targeting specificity. Two main mechanisms operate in jawed vertebrates: clonal deletion (‘negative selection’) removes autoreactive cells during the maturation of lymphocytes (Palmer, 2003) to enable ‘recessive tolerance’ (tolerance by the absence of autoreactivity); by contrast, regulatory T cells (Tregs) enable ‘dominant tolerance’ by actively downregulating autoreactive immune responses in the targeted tissues (Coutinho et al., 2001; Sakaguchi, 2004). Both mechanisms are based on intricate gene regulation mechanisms that are likely to be difficult to evolve, and the (near) simultaneous appearance of both systems is highly unlikely. We propose that the ‘Big Bang’ of vertebrate immunity might have been triggered by the evolution of Treg‐mediated dominant tolerance, facilitated by the greatly increased potential for regulatory complexity following the WGD event that gave rise to vertebrates. Below we explain why dominant, rather than recessive tolerance might have been the key innovation, and show that its main genomic components probably originated at or near the WGD event. We argue that reliable immune tolerance can be achieved by Treg‐mediated dominant tolerance, but not by negative selection alone. Both mechanisms are necessarily imperfect (and must have been even less efficient in the beginning), but there is an important difference in the way the two mechanisms can ‘fail’. Imperfect negative selection is imperfect in terms of coverage: some auto‐reactive clones escape selection; imperfect dominant tolerance is imperfect in terms of degree: all autoimmune reactions are affected, but the degree of control is limited. In the former case, a single escaped clone could wreak havoc without additional control by Tregs in the peripheries, because repeated rounds of clonal expansion would induce exponential growth of the autoimmune reaction. By contrast, imperfect dominant tolerance can afford mistakes, because a self‐reactive clone activated by a stochastic glitch in tolerance could still be brought under control later: negative selection has one chance to act, dominant tolerance has many. To suffice alone, negative selection should be perfect; dominant tolerance just needs to be ‘good enough’ to have a statistically high chance of bringing self‐reactive clones under control before they can do too much damage. We therefore argue (in agreement with Janeway, 2001) that the evolution of regulatory T cells (dominant tolerance) was probably necessary for the emergence of Darwinian immunity. Once dominant tolerance jumpstarted the evolution of Darwinian immunity, the evolution of mechanisms for negative selection against major self‐antigens could provide an economical advantage, removing highly autoreactive cells before they had their first chance to expand. If dominant immune tolerance was a necessary innovation to achieve Darwinian immunity, it certainly cannot have been an easy one. Foxp3 acts as a central switch: it forms complexes with hundreds of genes (Rudra et al., 2012), and affects the expression of more than 2000 genes in mouse T cells (Xie et al., 2015). The task is indeed not trivial. Foxp3+ Tregs often have to respond in the opposite reaction compared with conventional (non‐regulatory) effector T cells: TCR signalling (with co‐stimulation) induces effector functions in conventional T cells, but repressor functions acting on neighbouring T cells in Tregs. In addition, regulatory activity must strike a delicate balance between too little regulation resulting in runaway autoimmunity, and too much, which could downregulate useful responses against pathogens (self antigens are also presented in the vicinity of pathogen invasion). To achieve this complex functionality, Foxp3 acts not only as a repressor of activation‐associated genes, but also upregulates a large number of genes (Zheng et al., 2007), and is likely to operate a bistable autoregulatory loop to maintain a stable identity of regulatory cell clones (Rubtsov et al., 2010). The complexity and difficulty of the task supports the notion that Treg‐mediated tolerance might indeed constitute the major bottleneck towards Darwinian immunity that, in vertebrates, could only be passed by a rare burst of regulatory complexity. Phylogenetic evidence is compatible with the origin of Treg‐mediated dominant tolerance in the vertebrate common ancestor. Foxp3, the key regulatory gene for the development of regulatory T cells (Hori, Nomura & Sakaguchi, 2003), belongs to the ancient eukaryotic family of Forkhead box (Fox) transcription factors. Remarkably, the Foxp class of the family has a single orthologue in invertebrates (including sea urchin), but four members in most vertebrates (Andersen, Nissen & Betz, 2012), which is consistent with the origin of the class at the WGD event [followed by segmental duplication involving Foxp loci (Smith & Keinath, 2015)]. The analysis of the sea lamprey (Petromyzon marinus) genome identified homologues of Foxp1, 2 and 4, but did not find Foxp3 (Smith et al., 2013). However, Foxp3 is most closely related to Foxp4, and both were created by the last gene duplication in the family (Santos et al., 2011). The Foxp4 ortholog identified in lamprey might therefore be homologous to the common ancestor of Foxp3 and Foxp4 [a situation with known precedents among duplicated transcription factors (Kasahara & Sutoh, 2014)], and might perform the regulatory role of Foxp3 in jawless fish. While Foxp3 is at the top of the regulatory cascade of dominant tolerance, the evolution of this complex regulatory function likely required the involvement of a whole suite of regulatory genes – which may have depended on the sudden availability of duplicated genes in the ancestral vertebrate. Of note, the transcription factors Helios and GATA‐3, which are key interacting partners of Foxp3 in the orchestration of the regulatory phenotype (Rudra et al., 2012; Kim et al., 2015), both belong to gene families that were duplicated in the WGD event (Gillis et al., 2009; John, Yoong & Ward, 2009). Another member of the Foxp class, Foxp1 is involved in the regulation of B‐ and T‐cell development and homeostasis (Hu et al., 2006; Feng et al., 2010), and further classes of duplicated regulatory genes might also have contributed to the expanding genetic circuitry of immune cell fates (Rothenberg & Pant, 2004; John et al., 2009). In addition to duplicated transcription factors, the increased regulatory complexity of vertebrates arose partly from a massive increase in microRNAs (miRNAs) in the stem lineage of vertebrates (preceding the split between jawless and jawed vertebrates), both due to genome duplication and to the acquisition of new miRNA families (Heimberg et al., 2008, 2010). miRNAs play multiple complex roles in the development and control of vertebrate adaptive immunity (Xiao & Rajewsky, 2009; Mehta & Baltimore, 2016), including mechanisms of both central and peripheral tolerance (reviewed in Simpson & Ansel, 2015). In particular, the selective disruption of miRNAs in Tregs results in autoimmune pathology closely resembling that caused by deficiency in Foxp3 (Zhou et al., 2008), while the selective knockout of miRNAs in thymic epithelial cells compromises promiscuous gene expression (Ucar et al., 2013) that is crucial for the thymic induction of tolerance against peripheral self‐antigens. By contrast, V(D)J recombination does not seem to require miRNA control (Xiao & Rajewsky, 2009). Compatible with our scenario, the operation of specific immunological tolerance depends on regulatory complexity acquired at the origin of vertebrates, but the generation of receptor diversity does not. Thus many components of the genetic circuitry (transcription factors, miRNAs) seem to have appeared in the series of genomic duplications that occurred at the root of the vertebrate lineage. Since duplicated genes tend to get inactivated then lost unless they acquire new functions, the integration of a large number of elements, duplicated within a short time frame, is consistent with a rapid, ‘Big Bang’ like episode of evolution. Conversely, the construction of the highly complex genetic circuitry of dominant tolerance might have depended on the simultaneous presence of a large number of recently duplicated elements. The analysis of the gene regulatory networks (Martinez‐Sanchez et al., 2015) might eventually elucidate how the duplicated regulatory elements might have triggered the evolution of a Treg cell phenotype. We have thus argued that dominant immune tolerance might be a necessary condition for Darwinian immunity, that the regulatory circuitry required for this function might be very difficult to evolve, and that in vertebrates the origin of the involved genetic machinery apparently goes back to the rare burst of genomic innovation that gave rise to the lineage. Thus, while Burnet (1968) believed that the greater flexibility of development in vertebrates created the selection pressure for adaptive (Darwinian) immunity, we suggest that it created not the need, but the opportunity. However, we note that the presence of Tregs in jawless fish still needs to be demonstrated, and while it is plausible to assume a crucial role of dominant tolerance in Darwinian immunity, the evidence is not unequivocal. We argued that both somatic receptor diversity and clonal selection might have had pre‐existing components, and it was the linking of the two that required a difficult evolutionary innovation: specific (and probably dominant) immune tolerance. However, while the existence of multiple mechanisms of somatic diversity has clearly been demonstrated, clonal selection (amplification) has not been described in any invertebrate to date. It is possible that the machinery for clonal amplification by itself is difficult to evolve, and we cannot exclude that it was this step that imposed a bottleneck for the evolution of Darwinian immunity (L. Du Pasquier, personal communication) that could only be passed by the increased regulatory complexity of vertebrates. We also note that the ‘burst of regulatory complexity’ at the root of the lineage is not quite straightforward to explain. WGDs have occurred rarely, but still multiple times in animals, and much more frequently in plants (Otto & Whitton, 2000). However, while some of these events have given rise to successful new clades and/or duplicated regulatory factors, the origin of vertebrates appears to be unique with respect to the number of regulatory elements retained, and the abrupt increase in regulatory complexity and developmental flexibility that accompanied it. It remains to be elucidated what additional factors (selection pressures, pre‐adaptations, low‐probability genomic events) might have contributed to the rare constellation of conditions that allowed for the rapid increase in regulatory complexity that very likely laid the foundations for the evolutionary success of vertebrates, and opened the trajectory towards Darwinian immunity. To summarize, the lack of a selective scenario specific to vertebrates argues very strongly for a ‘Big Bang’‐type origin of Darwinian immunity, limited by a difficult evolutionary innovation; the abrupt increase in regulatory complexity at the origin of vertebrates was very likely a prerequisite (and possible trigger) to passing this bottleneck; and antigen‐specific dominant immune tolerance is a plausible (but not the sole) candidate for the limiting evolutionary innovation. (5) The chicken and egg problem of Darwinian immunity Beyond the initial bottleneck for Darwinian immunity, an apparent chicken and egg problem arises. Clonal amplification of immune responses with stochastic (somatically diversified) targeting is unsafe without specific (dominant) tolerance; however, specific tolerance might not make much sense without stochastic immune targeting. We argued previously that the emergence of dominant tolerance might have been the key to the evolution of Darwinian immunity in vertebrates – but what drove it in the first place? If specific tolerance evolved against the backdrop of innate or shotgun immunity that did not allow for the clonal amplification of somatically diversified immune responses, what was then the initial selective advantage? There are two ways to resolve this apparent paradox. First, some limited form of clonal amplification, involving immune responses with a limited scope of diversified targeting, might be beneficial even without specific tolerance, if the benefits of improved defence outweigh the costs (including some limited auto‐immunity). Below we shall discuss possible incremental stages in the evolution of randomized immune targeting: it is not impossible that the very first steps could be taken without dominant immune tolerance. In this scenario, a slightly enhanced form of proto‐Darwinian immunity (with restricted somatic diversification, and amplification limited in both space and time) might have preceded the emergence of dominant immune tolerance, and mitigating the low‐level auto‐immunity associated with the former might have provided an immediate evolutionary benefit. If this is true, this level of proto‐Darwinian immunity should eventually be found in extant invertebrates [the near‐monoclonally expressed 185/333 immune‐response genes of sea urchins (Majeske et al., 2014) might constitute a candidate system]. Note that while this scenario somewhat blurs the line between shotgun immunity and Darwinian immunity, a large gap still remains, and bridging that gap very likely required the evolution of specific immune tolerance. Alternatively, Treg‐mediated dominant tolerance might have evolved first to afford specific tolerance to beneficial symbiotic bacteria (Weaver & Hatton, 2009). Innate and shotgun immunity tend to target broad classes of conserved microbial patterns and cannot discriminate and selectively spare potentially beneficial species. By providing this function (downregulating innate mechanisms with narrow targeting), specific tolerance, even in early rudimentary forms, might have provided an immediate benefit even in the absence of somatically diversified immune effector targeting. Remarkably, the gut of extant vertebrates (mice), which holds the largest diversity and biomass of the microbiome, is enriched in Tregs that are reactive to commensal microbes and are essential for the maintenance of immune tolerance against these (Chai, Zhou & Hsieh, 2014; Sefik et al., 2015). Improved microbiome management might afford a huge metabolic benefit (McFall‐Ngai, 2007), and is thought to have been a major driver of immune evolution from the earliest animals (Bosch, 2014). In this scenario, Tregs might even have been the first cell type to evolve somatically diversified targeting, which could then be co‐opted for effector targeting, as the broadening scope of specific tolerance allowed it. Because the generation of regulatory cells depends on an education period when they encounter antigens under non‐inflammatory conditions, the scope of specific tolerance under this scenario could easily be extended to cover self‐antigens. (6) Stepwise evolution of Darwinian immunity after the ‘Big Bang’ After the emergence of an early form of specific immune tolerance, the subsequent evolution of vertebrate Darwinian immunity could proceed in small incremental steps, increasing the potential of somatic receptor diversification and clonal amplification to match and drive further the improving capacity of specific tolerance. We consider in turn how the scope and potential of somatic receptor diversification, clonal amplification and specific immune memory, and specific tolerance might have evolved through a series of gradual improvements. Receptor targeting might have evolved in terms of broadening epitope coverage, shifting from germline‐encoded receptors to increasing somatic diversification, and towards higher specificity. Mechanisms of receptor diversification very likely existed even before the immunological ‘Big Bang’ (Loker et al., 2004), either to generate shotgun immunity [e.g. by somatic hypermutation (Du Pasquier et al., 1998; Lee et al., 2002)] or expressed in the germline to generate variation rapidly across generations. LRR‐ and RAG/Ig‐based systems of gene assembly might also have had their origin at this stage, e.g. the sea urchin homologues of Rag1/2 are expressed in coelomocytes that perform immune functions (Fugmann et al., 2006), and RAG transposition still appears to play a role in generating germline‐encoded receptor diversity across generations in sharks (Lee et al., 2000; Hsu et al., 2006). Such pre‐existing mechanisms of receptor diversity could then be conveniently co‐opted for clonally selected lymphocytes once specific tolerance had appeared. Initially, the germline‐encoded receptors must have targeted safe molecular patterns that were reliably associated with potential pathogens but were absent from the host species (Ohno, 1990), and the scope of somatic diversification in the frame of shotgun immunity must have been optimized (limited) to keep the repertoire within these safe boundaries. Then, after the ‘Big Bang’, the gradual improvements of specific tolerance allowed these safe boundaries to expand, and the mechanisms of somatic receptor diversity had multiple ways to take advantage of this opportunity and expand accordingly (Fig. 4). First, germline‐encoded receptor genes (or their modular components) might have expanded by gene duplication and divergence to allow the targeting of novel domains in the ‘epitope space’ of possible targeting motifs. Second, the extent of somatic diversification (the possible distance from the germline‐encoded target specificities) might also have increased gradually, e.g. by increasing the rate of hypermutation or by expanding the genomic regions affected. The first mechanism could create new foci of epitope targeting, while the second could increase the action radius of existing foci in epitope space. Both would allow immune targeting to expand gradually into domains of epitope space that used to carry a high risk of autoimmunity, but were becoming safe due to improving specific tolerance. Mechanisms based on gene assembly also offer multiple ‘scalable’ solutions for both aspects of expanding epitope coverage. The number of genomic segments is freely scalable, and the set and probability of possible combinations can also be regulated. For example, Ig genes of cartilaginous fish are still characterized by the (probably) ancestral cluster organization of V(D)J miniloci, which involves very limited numbers of gene segments within each locus, and rearrangements are allowed only within the miniloci (Hsu et al., 2006) (Fig. 5A). This genomic arrangement constrains the possible foci of epitope targeting. By contrast, most Ig genes in tetrapods feature translocon organization, in which multiple gene segments are allowed to recombine, generating much greater combinatorial diversity (Fig. 5B). Remarkably, teleost fish have both cluster and translocon organization in different Ig genes or in different species, underlining the flexibility of gradual evolution towards increasing (or decreasing) combinatorial diversity (Hsu et al., 2006). Furthermore, even with translocon organization, ‘random’ somatic recombination does not necessarily imply that all possible combinations (specificities) are produced with the same probability. The generation of V(D)J recombinants can be skewed (Jackson et al., 2013; Elhanati et al., 2014), and some lymphocyte subsets [e.g. several types of unconventional T cells (Godfrey et al., 2015)] are characterized by a highly focused receptor repertoire with limited gene combinations and diversity. The degrees of freedom in combinatorial diversity might have evolved gradually with improving specific tolerance, and if some parts of ‘receptor space’ were more likely to be useful, regulatory mechanisms could apparently evolve to ensure the skewed production of these predictably useful specificities. There is also no reason why additional mechanisms of somatic receptor diversity could not be fine‐tuned towards generating broader or more constrained diversity. For example, some vertebrates first generate a limited repertoire relying on somatic recombination only, and switch on the expression of terminal deoxynucleotidyl transferase (TdT; responsible for nucleotide addition diversity) only at later stages of ontogeny (Schwager et al., 1991; Bogue et al., 1992). Knock‐out mice lacking TdT display reduced lymphocyte receptor diversity (Gilfillan, Benoist & Mathis, 1995), but are also less prone to autoimmune disease (Conde et al., 1998). The extent of TdT‐mediated junctional diversity could probably be flexibly tuned during evolution to match the evolving capabilities of tolerance mechanisms, and the same is likely to be true for the additional mechanisms of hypermutation and gene conversion. In jawed vertebrates, MHC restriction of adaptive immune responses offers a further scalable solution for the coverage of somatic receptor diversity. Most peptide antigens are able to elicit an immune response only when presented on the surface of a cell bound to an MHC molecule. MHC presentation requires the successive steps of proteasomal cleavage (for class I MHC only), translocation into the lumen of the endoplasmic reticulum (where MHC molecules are loaded), and binding to an MHC molecule. Each of these steps are selective (Hoof et al., 2012), and the degree of selectivity can be fine‐tuned by the substrate specificity of cleavage and translocation, and the number and binding specificity of MHC alleles. The analysis of the highly conserved genome of the elephant shark (Callorhinchus milii) (Venkatesh et al., 2014) suggests that MHC alleles were originally in genetic linkage with the genes of the antigen receptors that could bind to them. Such an arrangement might have facilitated the control of the set of peptides involved in MHC presentation, and might also have allowed somatic diversity to get started without thymic positive selection of lymphocytes (because coupled MHC–TCR pairs could be selected for binding over generations). Tissue‐specific restriction offers a further solution to restricting autoimmune collateral damage when specific tolerance is not (yet) efficient. Of note, unconventional T cells tend to recognize antigens in the context of non‐polymorphic antigen‐presenting molecules, some of which are expressed in a tissue‐specific manner (Godfrey et al., 2015). Clonal amplification and specific memory might also have evolved in incremental steps, contributing to the stepwise co‐evolution of the effector and regulatory arms of Darwinian immunity. Clonal amplification can be safe even without specific tolerance for effector cells bearing germline‐encoded receptors that are selected for safe targeting across generations (Boehm, 2006), and the genetic circuitry for inducible expansion might have evolved prior to the origins of Darwinian immunity for such cell types (as in NK cells). Then clonal amplification might have been co‐opted for cell types using a limited repertoire of somatically diversified receptors [focused on patterns typically associated with pathogens, similar to some classes of unconventional T cells (Godfrey et al., 2015) in extant organisms], and finally also for cells with the broadest diversity of targeting. The evolving genetic circuitry of programmed cell expansion and contraction also incorporated transcription factors that were created in the ancient vertebrate genome duplication event (Rothenberg & Pant, 2004). In addition to the breadth of targeting involved in clonal amplification, the extent and durability of the amplification could also evolve in gradual steps. In particular, if an immune reaction is short‐lived and no memory cells survive, then collateral damage is limited to the time span of the primary immune reaction (launched against an invading pathogen), and this one‐time cost might be outweighed by the benefit of efficient defence against the pathogen. That immune effector cells cross‐reactive to self would be induced against potentially dangerous non‐self antigens, but not to self tissues in the first place, could be ensured by the dependence of clonal amplification on danger signals from the very beginning of Darwinian immunity. The use of danger signals was probably easy to evolve: the new effector mechanisms simply needed to be built on top of the original (innate) decision cascades, co‐opting pre‐existing inducers of innate immunity as ‘danger signals’ for evolving Darwinian immunity. This way, self‐reactive cells inflicted only limited collateral damage during acute immune responses, and starting from such a situation, any (initially imperfect) measure of specific tolerance would have been useful and favoured by selection. The scalability of clonal amplification and specific immune memory can still be observed in the immune systems of extant vertebrates. For example, in sharks ‘the memory response is clearly inferior to that of the higher vertebrates’ (Flajnik & Kasahara, 2010, p. 50), and repeated challenge with an antigen cannot boost the antibody response beyond the peak of the initial response (Dooley & Flajnik, 2005). Even mammals have several lymphocyte subsets that display limited receptor diversity, tend to target conserved microbial structures, and are able to launch very rapid responses, but generate limited immune memory (Baumgarth, Tung & Herzenberg, 2005; Godfrey et al., 2015). This combination of characteristics may reconstitute (or preserve) the early stages of the evolution of Darwinian immunity, in that restricted somatic diversity and limited memory allow for safe responses without strict check‐points (that delay the response of highly diverse classes of lymphocytes) and advanced mechanisms of immune tolerance. The efficiency of tolerance mechanisms is also likely to have evolved in a stepwise manner. Genome duplication created surplus copies of regulatory factors, but wiring these into a genetic circuitry for regulatory T cells must have taken considerable evolutionary time, and each improvement in regulatory function could further potentiate the evolution of the effector components of Darwinian immunity. Of note, the deletion of Foxp3 in zebrafish results in only a moderate inflammatory phenotype (in contrast to the fatal autoimmune disease observed in Foxp3‐deficient mice) (Sugimoto et al., 2017), which is compatible with the view that the capacity of both effector and regulatory immune mechanisms has improved gradually during the evolution of vertebrates. The action of Treg cells could then also be complemented by the evolution of negative selection, improving not only the reliability, but also the cost efficiency of immune tolerance, by neutralizing autoreactive cells before they had their first chance to expand. In principle, some simple form of negative selection might even have preceded Treg‐mediated dominant tolerance in the frame of proto‐Darwinian immunity with restricted germline‐encoded receptor diversity. In a possible extant analogy, mammalian NK cells go through a period of ‘education’ early in their development, during which they are able to tune their responsiveness according to the level of inhibitory and stimulatory ligands in their environment (Orr & Lanier, 2010). However, we note that although NK cells are traditionally regarded as components of innate immunity, they are still embedded in the higher regulatory complexity of vertebrates, and it is unclear whether such fine‐tuned regulation had been possible before the ‘Big Bang’ of the WGD event. We cannot rule out that the ‘Big Bang’ of increasing regulatory complexity opened the way simultaneously to both Treg‐mediated dominant tolerance and recessive tolerance by negative selection; remarkably, Foxn1 transcription factor, a marker of the thymopoietic microenvironment, also originated at the WGD event (Singh, Arora & Isambert, 2015). Then, at least in jawed vertebrates, the evolution of the intricate mechanism of promiscuous gene expression in dedicated cells of the thymus (Derbinski et al., 2001) could extend the education of thymocytes (and thereby improve the efficiency of tolerance) to self antigens that are normally restricted to specific tissues. The gene of the transcription factor Aire, the central orchestrator of promiscuous gene expression in the thymus, has been found in the elephant shark (Venkatesh et al., 2014), an ancestral jawed vertebrate, but not yet in lamprey (Smith et al., 2013). Recent studies in mice indicate that promiscuous gene expression promotes the generation of Treg cells involved in dominant tolerance to tissue‐specific antigens (Aschenbrenner et al., 2007; Yang et al., 2015); in a recurring theme of immune evolution, new components of immunity tend to evolve interdependencies with pre‐existing components. As the increasing capacity for somatic receptor variability and clonal amplification allowed for increasing repertoire diversity, targeting could also evolve towards higher specificity. This allowed the targeting of variable (not evolutionarily conserved) patterns of potential pathogens, and facilitated the differential recognition of not only self and non‐self (Borghans, Noest & De Boer, 1999), but also of distinct pathogens that can be controlled by different effector mechanisms (Borghans & De Boer, 2002). The evolutionary scenario (including pre‐‘Big Bang’ pre‐adaptations and selection pressures) for the evolution of Darwinian immunity in vertebrates is shown in Fig. 6. (7) Darwinian immunity as a key driver of vertebrate evolution Finally, we argue that the origin and evolution of Darwinian immunity might have played a crucial role at several stages in the evolution of vertebrates. There are no known vertebrates without Darwinian immunity. Thus, either the innovation was necessary for the subsequent evolution of the vertebrate body plan, or the evolutionary advantage was so large that all other forms without it were outcompeted and went extinct without descendants. The latter possibility becomes highly unlikely once considerable adaptive radiation has occurred, so the emergence of the fundamental framework of vertebrate Darwinian immunity must have happened either shortly after the adaptive radiation of early vertebrates, or even before it, possibly contributing to the evolutionary success of vertebrates. The situation is somewhat analogous to the origin of eukaryotes and mitochondria. All extant eukaryotes either possess mitochondria or are derived from ancestors that had them. While it is unclear whether it was the acquisition of mitochondria that triggered the burst of evolutionary innovations that led to the last common eukaryotic ancestor (Poole & Gribaldo, 2014), the symbiogenetic event conferred sufficient selective advantage to drive all other protoeukaryotic lineages to extinction. Darwinian immunity evolved along with a whole package of evolutionary innovations triggered by the WGD event. While the exact contribution of Darwinian immunity to the evolutionary success of vertebrates cannot be directly estimated, the apparent extinction of several intermediate stages of its evolutionary trajectory argues that it must have been a major driver of vertebrate evolution. As argued in previous sections, the selective advantage provided by Darwinian immunity might have included improved cost efficiency of defence against pathogens and/or improved microbiome management. In addition, the pattern of two alternative implementations of Darwinian immunity in jawless and jawed vertebrates is far from straightforward to explain, and may have further implications for the evolution of vertebrates. Assuming that the evolution of Darwinian immunity was indeed initiated by the establishment of a framework for specific immune tolerance in the common ancestor of all vertebrates, two alternative scenarios can explain the extant pattern of two unrelated implementations of receptor diversity. In the first scenario, one of the two systems (VLR in jawless fish; TCR/BCR in jawed vertebrates) evolved first in the common ancestor of both lineages, but was then replaced by the other system in one of the lineages. It has been speculated that VLR might have evolved first, because all the required genes seem to have been present in the last common vertebrate ancestor, while the horizontal gene transfer that inserted RAG genes into an ancestral TCR/BCR‐like gene locus occurred after the split, in the jawed vertebrate lineage (Kato et al., 2012; Kasahara & Sutoh, 2014). Alternatively, the two systems might have arisen independently, each in the common ancestor of one of the lineages, over the background of some form of shotgun and/or proto‐Darwinian immunity. The first scenario (replacement) would imply that the more recent of the two systems had, already in its early rudimentary form, a selective advantage over the more ancient system, which at that time had already undergone some period of adaptive evolution. If VLR is indeed more ancient (Kato et al., 2012; Kasahara & Sutoh, 2014), then the BCR/TCR system must be more efficient, and it is tempting to speculate that it might have contributed to the much greater evolutionary success of jawed versus jawless vertebrates. Under the replacement scenario (irrespective of which system appeared first), the evolution of the second, more powerful system might have been helped by the presence of the tolerance mechanisms that co‐evolved with the first system of somatic diversity. In turn, the alternative scenario of independent origins of both systems from shotgun immunity would imply that two vertebrate lineages that acquired Darwinian immunity remained successful to this day, while all ancestral lineages without it have (apparently) been lost. Finally, we note that while at the moment, Darwinian immunity is practically synonymous with vertebrate adaptive immunity, independently evolved systems of Darwinian immunity might yet be found in invertebrates. The lessons from vertebrates suggest that higher developmental complexity and, in particular, extensive genome duplications might be prerequisites for the emergence of Darwinian immunity, while filter‐feeding and/or reliance on symbiotic microorganisms might give rise to particularly strong selection pressure for improved immunity: invertebrate groups displaying combinations of these traits should be investigated with particular scrutiny. If the last decade has taught us anything, it was that the diversity and ingenuity of invertebrate immune systems is far greater than previously thought: we are certain that the explosive growth of comparative immunology will not fail to deliver further surprises. We list some of the outstanding questions below. (8) Outstanding questions of Darwinian immunity What conditions (life‐history traits) favour Darwinian immunity over other types of adaptive and innate immunity? Has Darwinian immunity evolved in any invertebrate taxa? Is the monoallelic expression of variable immune receptors in sea urchins associated with clonal selection? Is there clonal selection (based on clonally stable receptor identity) in NK cells? Has Darwinian immunity been lost completely in any vertebrate? How exactly did the genomic duplication(s) at the origin of vertebrates facilitate the emergence of specific immune tolerance? What drove the exceptional increase in regulatory complexity, in contrast to other genome duplication events? How do species that appear to have no homologues of Foxp3 [some birds (Andersen et al., 2012); possibly sea lamprey] operate dominant immune tolerance? Do they have a divergent form of the gene (Denyer et al., 2016), or an alternative mechanism has taken over its function? Is the LRR‐based somatic receptor diversity of jawless vertebrates the ancestral vertebrate condition, or did both LRR‐based and Ig/RAG‐based somatic diversity evolve after the split of jawless and jawed vertebrates? Is MHC restriction a fortuitous ‘complication’ in jawed vertebrates, or is this function necessary (inevitable) beyond some level of complexity or potency of Darwinian immunity? In the latter case, are jawless fish below this level, or do they have an analogous system to perform this function?

Regulatory T cells (Tregs) are crucial for suppressing autoimmunity and inflammation mediated by conventional T cells. To be useful, some Tregs should have overlapping specificity with relevant self-reactive or pathogen-specific clones. Whether matching recognition between Tregs and non-Tregs might arise through stochastic or deterministic mechanisms has not been addressed. We tested the hypothesis that some Tregs that arise in the thymus or that are induced during Ag-driven expansion of conventional CD4+ T cells might be clonally related to non-Tregs by virtue of asymmetric Foxp3 induction during cell division. We isolated mouse CD4+ thymocytes dividing in vivo, wherein sibling cells exhibited discordant expression of Foxp3 and CD25. Under in vitro conditions that stimulate induced Tregs from conventional mouse CD4+ T cells, we found a requirement for cell cycle progression to achieve Foxp3 induction. Moreover, a substantial fraction of sibling cell pairs arising from induced Treg stimulation also contained discordant expression of Foxp3. Division-linked yet asymmetric induction of Treg fate offers potential mechanisms to anticipate peripheral self-reactivity during thymic selection as well as produce precise, de novo counterregulation during CD4+ T cell–mediated immune responses.
bioRxiv - the preprint server for biology, operated by Cold Spring Harbor Laboratory, a research and educational institution
Gilbert C FAURE's insight:
Abstract T follicular helper (Tfh) and regulatory (Tfr) cells regulate B cell activation and ultimately antibody production. While concordant results show that Tfh cells are specific for the immunizing antigens, limited and even controversial results have been reported regarding the specificity of Tfr cells. Here we used high-throughput T cell receptor (TCR) sequencing to address this issue. We observed that although the Tfh- and Tfr-cell repertoires are less diverse than those of effector (Teff) and regulatory T (Treg) cells, they still represent thousands of clonotypes after immunization with a single antigen. T-cell receptor beta variable (TRBV) gene usage distinguishes both follicular T cells (Tfol) from non-Tfol cells, as well as helper (Teff and Tfh) vs. regulatory (Treg and Tfr) cells. Analysis of the sharing of clonotypes between samples revealed that a specific response to the immunizing antigen can only be detected in Tfh cells immunized with a non-self-antigen and Tfr cells immunized with a self-antigen. Finally, the Tfr TCR repertoire is more similar to that of Tregs than to that of Tfh or Teff cells. Altogether, our results highlight a bystander Tfol-cell activation during antigenic response in the germinal centres and support the Treg cell origin of Tfr cells.
|


Nice narrative of the discovery
https://www.linkedin.com/posts/simon-maechling_the-immune-system-is-powerful-sometimes-ugcPost-7380905384573566976-aaqS?utm_source=share&utm_medium=member_desktop&rcm=ACoAAAEUlUEBjBzCt-7iGxpT1YxyTNO5IV61nAI
Nature
https://www.nature.com/articles/d41586-025-03193-3
75 posts on this topic
https://www.scoop.it/topic/immunology?q=tregs