Resources, tips, and tools for conducting, presenting, and communicating Environmental Science and Resource Management research. Topped off with a smattering of career development advice for the soon-to-be graduate.
Drawing requires a level of skill and technique. A drawing can be inserted into various forms of art, such as animation. To create a base drawing for a character, a line art drawing is generally created and then manipulated in a computer program. A computer program such as Adobe Photoshop can be used to clean the sketchy lines of a drawing and...
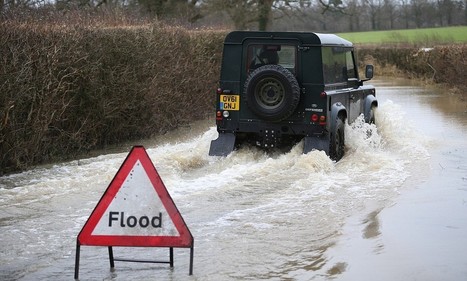
The exact link between global warming and flooding is much less certain, and those who keep pursuing the topic are taking attention away from the true problem of over-development, scientists have warned.
Need a break from data? Come to the UCSD Neurosciences Graduate Program Social at SfN! For details, see this link: http://tinyurl.com/UCSDSfN Monday, Novembe...
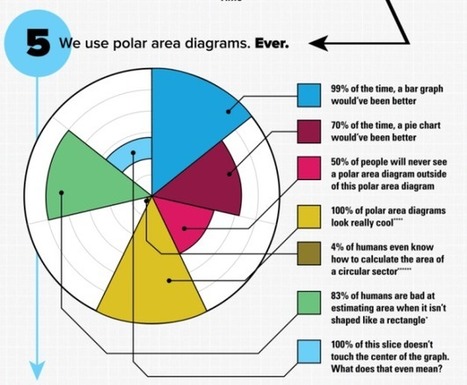
SMBC pokes fun at big "informational" graphics with a self-referencing graphic that displays 6 reasons why said graphic is useful.
It's not so much the size as it is the non-information displayed as something worth knowing.
At least one of these things lands in my inbox per day, and it always surprises me. Do people still share these things? I mean, these non-information graphics were popular five years ago, and there was a novelty aspect, but I rarely see them in my feed these days.
See also the big graphic blueprint and a tall infographic.
A visualization system, scientifically designed with your info in mind. Find the perfect diagram and download the PowerPoint-ready file for just $0.99.
slide:ology: The Art and Science of Creating Great Presentations [Nancy Duarte] on Amazon.com. *FREE* shipping on qualifying offers. No matter where you are on the organizational ladder, the odds are high that you've delivered a high-stakes presentation to your peers
In today's world, brimful as it is with opinion and falsehoods masquerading as facts, you'd think the one place you can depend on for verifiable facts is science.
Basic tutorial on Raw, an online app for designers and vis geeks, aiming at providing a missing link between spreadsheet applications (e.g. Microsoft Excel, Apple…
Sometimes it can be a challenge to produce data graphics in vector format, which is useful for high-resolution prints. Raw, an alpha-version tool by Density Design, helps make the process smoother.
I quite like this tool. It is still a bit limited at the moment, but if it happens to work for you particular graphing needs, take this sucker for a spin.
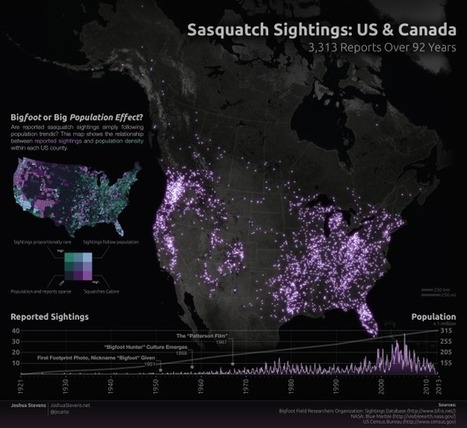
Josh Stevens, a PhD candidate at Penn State, mapped 92 years of sasquatch sightings, based on data from the Bigfoot Field Researchers Organization. Before you furiously type that the map is just population density, Stevens addresses that.
Using LinkedIn in your job search is a smart move not only because the majority of recruiters use it when they’re identifying talent, but also because it helps you use the greatest job search tool ...
As the Asiana Airlines Inc. jet neared Los Angeles International Airport, Captain Vic Hooper told his Korean co-pilot to make a visual approach, meaning he’d manually fly instead of letting automation do the work.
A sobering example of why "yes, you need to know that." Good academic training includes things well beyond the simple, minimal amount of knowledge/skills necessary for routine or day-to-day tasks.
Even if you won't be landing planes, you will certainly be called upon to do things/execute tasks at times with very little notice or preparatory time. You simply need to know the material ahead of time. Google won't save your butt.
RIVERSIDE -- The water flowing through the Tequesquite Arroyo may be a sign of better things to come for the Santa Ana sucker, a small fish that has been at the center of a big disagreement involving Inland Empire water providers, an environmental group and the U.S. Fish and Wildlife Service.
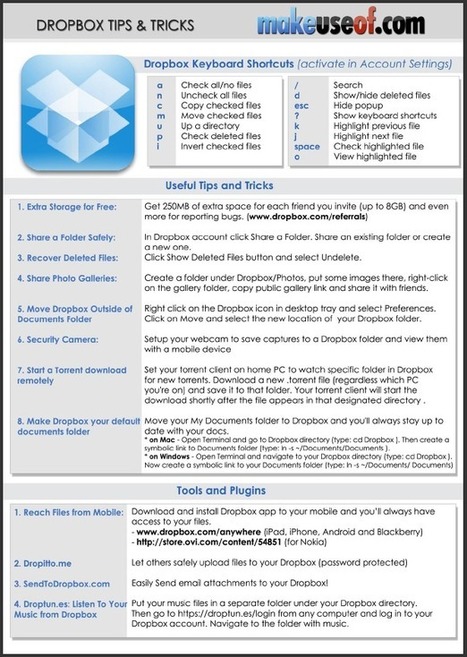
Dropbox is an extremely popular, easy-to-use online file hosting and sharing service that was founded by two MIT graduates. It lets anyone easily backup important files and also synchronize those files across multiple computers as well as mobile devices. This cheat sheet outlines handy Dropbox keyboard shortcuts, some of its useful features and third-party websites…
Duarte creates presentations and offers training based on our unique VisualStory™ methodology, which applies storytelling and visual thinking to craft persuasive communications designed to shift audience beliefs and behaviors
This is good watch for those of you new to giving talks. The presentation techniques are a bit obvious and I have a bit of a problem with her having "suddenly" discovered this, but the lessons are nevertheless a good suggestion for a place to start.
Duarte creates presentations and offers training based on our unique VisualStory™ methodology, which applies storytelling and visual thinking to craft persuasive communications designed to shift audience beliefs and behaviors
In 2012, education startups attracted millions of students—and a surge of interest from universities and the media—by offering massive open online courses, or MOOCs. Now some core features of these wildly popular courses are being dissected, enabling the course providers to do some learning of their own. As these companies analyze user data and experiment with different features, they are exploring how to customize students’ learning experiences, and they are amassing a stock of pedagogical tricks to help more students finish their courses.
MOOCs are an interesting experiment, but the data so far shows that folks don't learn from them the same way folks learn in traditional classrooms. There is much heat and little light.
Totally! From the data I've seen and the folks I talked with the only folks who consistently seem to get much quality learning are the folks who take the MOOCs with their friends and stay working together as a study group. This helps motivate, etc. All other models seem to leave the learning in a lurch.
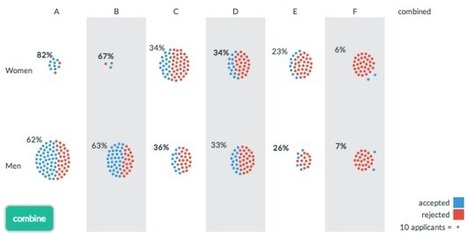
When you look for overall trends, you often poke around the data in aggregate, but when you zoom out too far, you could miss details or within-category variation. Sometimes when you zoom in, you see a completely opposite trend of what you saw overall. This is known as Simpson's Paradox. Lewis Lehe and Victor Powell explain in a series of small, interactive charts.
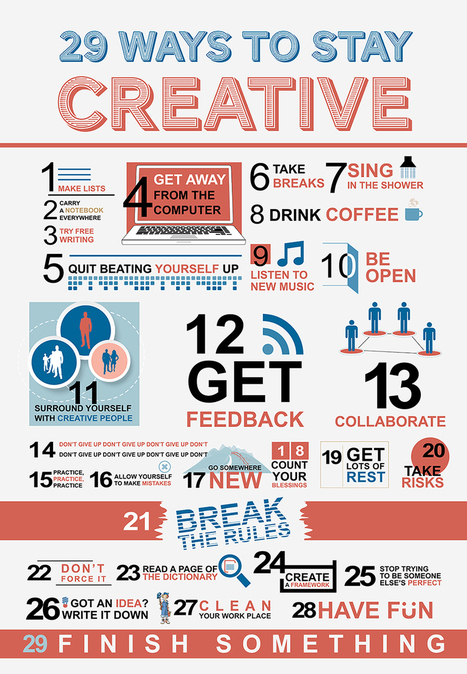
As content curators, we sometimes think we might not have anything super interesting to say or struggle to add value on top of the message within the content we’re curating — but your insight is invaluable and an incredibly important part of the curation and knowledge sharing process. Here are a few ways to re-spark your creativity while curating! Enjoy!
This is something of a pat approach to "creativity" but it still is worth a quick glance. If you have not tried all of these, give them a shot next time you are stuck staring at a blank screen.
Invited so-called experts "debate" public funding for science. They consider bias, scientific responsibility, and how politics influences research findings.
You would do well to familiarize yourself with this insane, anti-science, anti-Lockean view of the social contract.
These anti-social groups have gained much ground in recent years and are a large part of why many people ask "Why are we funding that? It won't cure cancer!" These are the numb nuts behind the deep cuts to the National Science Foundation, Department of Energy, NASA, etc.
While I am hesitant to call these folks our "enemy," the maxim of "know your enemy" applies in this case.
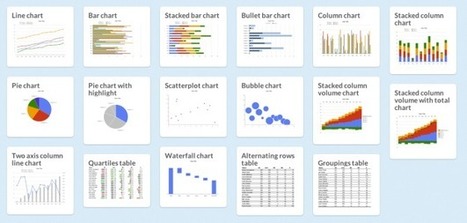
There are a lot of charts to choose from, and if you pick the wrong one you'll end up communicating the wrong message or make it hard for others to read your data. Luckily, Juice Analytics has you covered with an interactive Chart Chooser, based on Andrew Abela'sflowchart from a few years ago.
There are toggle buttons on the top that let you filter based on what you're looking for, such as a trend or relationship. For example, if you select comparison, distribution, and composition, you're left with a bar chart. Don't care about distribution? You can also try a stacked bar chart.
I actually thought this was an okay post until I tried to use it. While no such "chart picker" dichotomous key will ever be the end all be all of graphing, this has grown on me. I think you will find this a useful aid when you are starting out and trying to figure out how to go about selecting a figure type to present your data.
To get content containing either thought or leadership enter:
To get content containing both thought and leadership enter:
To get content containing the expression thought leadership enter:
You can enter several keywords and you can refine them whenever you want. Our suggestion engine uses more signals but entering a few keywords here will rapidly give you great content to curate.


 Your new post is loading...

















This one requires Photoshop, but it should work to remove lines if you have it.
-Erin Merrill