 Your new post is loading...
We live in the world where online shopping has become a new way for us to purchase items from electronics to books, travel coupons to cookware and clothes to beauty products. Online shopping has basically changed the way we live and has made life much simpler and convenient. It is a fact that most of the internet users have made at least one online purchase and this is enough to stress on the popularity of this phenomenon...
What did we do before mobile devices? I remember trying to arrange to meet friends when I was a teenager and you never quite knew if they were going to turn up late or not but today it doesn’t matter as you can tweet, Whatsapp, text or even -heaven forbid – actually call them. This enables us all to have that constant always-on access to the internet and stay in touch by our social media channels....
I’ve been reading some advice from successful writers lately and exploring what their routines are like to see what I can learn about.Here are six of the most common pieces of advice I came across that have helped me a lot improving my writing here at Buffer.It also features actionable tips for you on how to implement them in your own writing....
Infographics are all over the place nowadays. How do you know which ones to trust? Follow these three easy steps to save yourself from getting duped.
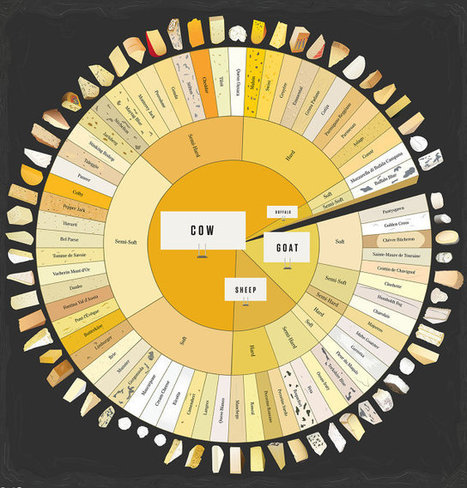
Over the course of the year, we saw infographics on a wide range of subjects, including 20th-century camera and sneaker design, house alliances of The Game Of Thrones, a colorwheel of cheeses, undersea internet cabling, beard typography, Batman symbols, and much, much more.
For years, marketers without a lick of design sense were slapping clip art on any data set that came their way and calling the finished poster an infographic. In 2013, there was a backlash against shoddy infographics. Perhaps that's why it feels like this year's data viz design is the most sophisticated, and the most accessible, yet: infographics don't have to be stupid anymore to be for everyone.
For your end-of-year perusal, we've collected 21 of our favorite infographics of 2013 in the slide show above. On the data viz front, we can't wait to see what 2014 has in store. Enjoy!...

|
Scooped by
Jeff Domansky
December 19, 2013 10:04 AM
|
Blogging in 2014 will be more challenging than ever. Have you formed a plan on how you will improve your own blogging? I’ve been thinking about it for weeks and have come up with many ideas on things I’d like to do better in 2014. Here are 9 things on my front burner for Inspire to Thrive’s blogging in 2014...
We all know that content is king on the Internet; and when it comes to types of content, it looks like video is at the top of the food chain. Video is everywhere online, from feature-length films, to sales pitches, to amateur videos of people at the zoo. Year over year, YouTube comes out with statistics showing staggering growth in videos uploaded and viewed.
The good folks at MultiVisionDigital published the infographic below to put into perspective how the omnipresent video is affecting consumer decision-making and behaviour. If you are trying to sell products or services, you may want to add video to your online strategy (if it isn’t there already) as consumers are 64% more likely to purchase a product after watching an online video....
iStock has queried creatives from around the world to determine what to look for in 2014 design trends. Entitled Hot or Not (oh how we miss the original Am I Hot or Not), the infographic gives a thumbs up/thumbs down look at flat design and skeumorphic design; short form storytelling versus long form; real models versus retouched; 3D and offset printing; and more. Give it a look.
Today's post is one example of this collaborative co-construction of the content of this blog. I was sent this wonderful graphic from one of my readers and I found it very relevant to what we have been talking about in the digital storytelling section here in Educational Technology and Mobile Learning. The infographic below has been designed by CMA and features the 7 steps to the perfect story.
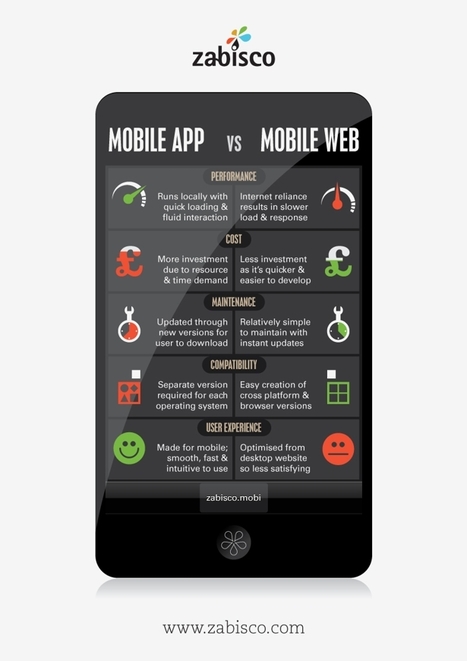
I've gathered together ten great infographics on m-commerce, QR codes, apps vs web, coupons, payments, mobile marketing and more.Where possible, I've added the infographics to this post in a readable size, but for others you can click on the image to see a larger version..
When a product or service doesn’t work as promised, some people get angry. Really angry.
Cloud contact center provider Five9 released a report and infographic today looking at “customer rage” and what companies can do to prevent it. Turns out 85 percent of consumers will retaliate against a company if their customer service needs are not met. 49 percent of all consumers will stop doing business with that company, and 18-34 year olds are three times as likely to vent their frustrations on social media.
|
|
Scooped by
Jeff Domansky
November 17, 2013 10:33 PM
|
Companies that blog generate 67 per cent more leads than those that don’t, 78 per cent of CMO’s think that content marketing is the future of marketing, and next year marketing teams will spend an extraordinary $135 billion on digital marketing collateral.
These are just three of the more fascinating stats contained in an infographic produced by WebDam Solutions, a US based digital asset management company.
Why Social Media & Search Marketing go hand in hand. Taking the example of the Flower & Gifts Industry.
...We believe that Social Media and Search Marketing go hand in hand because Social conversations can lead keyword strategy in a certain direction, and Search keywords can influence Social content strategy. By combining your Search & Social Marketing efforts, you can make sure to provide your audience with the right content, based on what they search for the most and what engages them on Social Media. Today we will take a look at the Flowers & Gifts Industry as an example of Social Media & Search Marketing alignment...
|
LinkedIn has re-defined the resume. So a well organised LinkedIn profile is now essential. Here are 21 key steps to create an awesome LinkedIn profile from Jeff Bullas' blog....
Want to know, what words to use when sharing your blog title or what to say in your social media posts that people really like and share?
Blog posts headlines containing the words hacks, surprising and history are most likely to be shared.
Twitter tweets containing Please Retweet/RT, check it out, social media and new blog post are most likely to be re-tweeted.
A highly shareable and viral Facebook posts does at least one of the following words: Gives, amazes, amazes and inspire....
Is your business website really built to generate leads... or is it just an expensive, online version of your company's brochure?
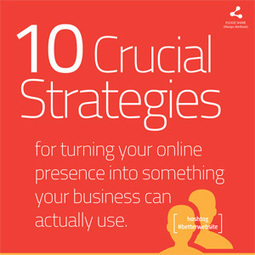
... In the short e-book this infographic is based upon, I share 10 of the most important strategies with you. These aren't just concepts or techniques that we’ve dreamed up over coffee, but proven tactics we've used again and again to produce extraordinary results. What kinds of results am I talking about? A 500% increase in new leads over a six-month time period hasn't been unusual, once we get all the components in place and working in harmony.It's just as important to note that these don't just create new sales opportunities, but potentially better ones, with more lifetime value from each account.
That's because, when new buyers are voluntarily coming to you for answers and requesting information from your company rather than responding to your sales or advertising efforts, the relationship starts off on a significantly better foot. There is more trust on both sides, with fewer negotiations over price, making it easier for a healthy long-term partnership to develop....
So. You think you’ve got yourself a good blog post. You chose your writing style. You knocked out the first draft. You allowed it to sit for an hour or a day. Now it’s time to edit that bad dog — ruthlessly....But you’re not done. You also must ensure that your blog post has all of the essential ingredients it needs.Ingredients like these, as presented in this infographic by our lead designer Rafal Tomal. Print it, pin it, but whatever you do … use it.
For many businesses using Twitter has become a staple in an effective marketing campaign. Engaging customers through tweeting daily tips, facts can be greatly enhanced by following these Twitter tips.
Building high-profile links from media sources isn't that difficult when you know how to approach journalists with a good story....
There's no quick fix. Even before search was on my radar, I'd always believed in integrated communications. Link-building is just another component of what should be a multi-faceted approach, and as such, I believe that links are symptomatic of a well-executed PR campaign.
For any marketing campaign you should be looking to use multiple channels. However, the purpose of this post is to specifically explore ways of working with the media, and consequently how to build links on top-tier media sites....
In my previous post I shared some advice from Randy Krum, author of Cool Infographics, about creating infographics. In his book Randy devotes a chapter to design tools. Many of the tools used by professional designers cost hundreds or thousands of dollars. But you don't have to spend anything if you want your students to try their hands at creating a data visualization in the form of an infographic. Here are five free tools that your students can use to create infographics...
|
|
Scooped by
Jeff Domansky
December 3, 2013 2:57 AM
|
LivePerson, a provider of digital engagement solutions, today announced the results of its second annual Connecting with Customers research, a comprehensive global study examining trends in online behavior and consumer expectations.
Infographics creation and sharing has exploded. Short attention spans require optimal visual communication. Here are the 7 keys to successful infographics...
The change extends not just to the words and platforms but the visual communication. We are rapidly moving to a visual web that communicates with 6 second videos captured on mobiles using social visual platforms like “Vine”. We have fast growing social networks that destroy the communication (photos or videos with a text) after the receiver has read or viewed the message. That ephemeral and temporary service is provided by the exploding social network, SnapChat (which has just turned down a $3 billion cash buyout from Facebook).
We all know the importance of images and photos to drive sharing on Facebook. Twitter has just added images to the stream and research show that it increases engagement. That is why infographics creation and sharing has exploded in the last couple of years. Short attention spans require optimizing communication that tells a story in a glance....
|
|
Scooped by
Jeff Domansky
November 21, 2013 4:34 PM
|
This analogy was new to me until earlier this month when Jason Miller from LinkedIn shared it at a content marketing summit in San Francisco. He created this while at Marketo, and for anyone struggling to create the right mix of content types it’s a great set of basic guidelines. Don’t take this too literally, it’s not a pyramid and can’t guarantee long life, but worth checking out....
17 LinkedIn Profile Must-Haves is a how-to infographic that walks the reader through optimizing their LinkedIn profile page. Published by MarketMeSuite working with Maximize Social Business.com’s Neal Schaffer.This year has been a big one for LinkedIn. With new features like the Creative Portfolio Display, you now have the ability to visually showcase your professional portfolio. But before diving any deeper with the latest add-ons, does your LinkedIn profile have all the elements that will help you rise to the top? This new infographic has all the tips you need to elevate your LinkedIn profile: 17 LinkedIn Profile Must-Haves! Everyone can use great tips, so please share the LinkedIn love!...
Some marketing skeptics claim that infographics are dead. I disagree. I think bad infographics are dead, and always have been. Well-designed and executed infographics, on the other hand, are not just alive — they are a thriving and essential part of any integrated content marketing strategy. With all the competition for consumer attention on the web, it takes more than just creative wording to rivet eyeballs. An infographic is a compelling way to use visual content to tell a rich story at a glance.
Here are some of the reasons why infographics are the perfect way to capture consumer attention...
|



















Next, check out our blog post on how you can increase online sales
http://www.intechnic.com/blog/ten-tips-for-increasing-online-sales/