Your new post is loading...

|
Scooped by
Gilbert C FAURE
June 21, 9:47 AM
|
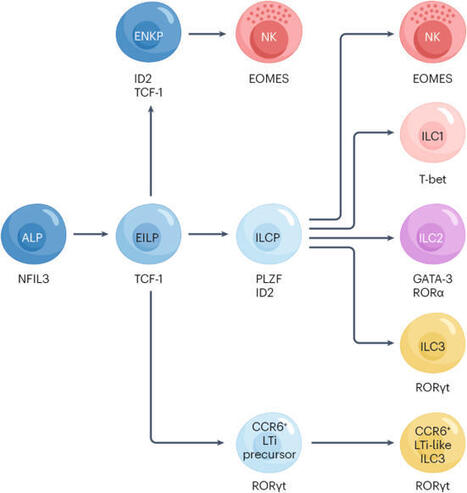
Innate lymphoid cells (ILCs) are emerging as critical modulators of inflammation in rheumatoid arthritis, contributing to both disease pathology and resolution. Group 3 ILCs (ILC3s) mirror TH17 cells in their production of IL-17A and IL-22, promoting fibroblast activation, neutrophil recruitment and synovial inflammatory cascades. By contrast, group 2 ILCs (ILC2s) engage reparative and immunoregulatory pathways via secretion of IL-9, IL-13 and IL-10. Lymphoid tissue inducer (LTi) ILCs contribute to ectopic lymphoid tissue neogenesis and stromal remodelling in early disease. Clinically, alterations in ILC subset composition correlate with disease activity, therapeutic responsiveness and inflammatory burden. Advances in high-dimensional immunophenotyping, spatial transcriptomics and single-cell multi-omics now enable precise mapping of ILC subsets and their effector programmes across peripheral blood and synovial tissue, supporting their use in biomarker discovery and treatment pipelines. Furthermore, modulation of ILCs by targeting upstream cytokines, signalling pathways or the use of microbiota-derived metabolites is a potential therapeutic strategy. Finally, cell-based avenues include IL-10-producing ILC2s (ILC210) and engineered chimeric antigen receptor (CAR)-ILC2s for targeted, tissue-resident immune modulation. Although still in the preclinical stages, these approaches highlight the translational potential of ILCs as biomarkers and therapeutic targets in rheumatoid arthritis. Innate lymphoid cells (ILCs) influence rheumatoid arthritis by amplifying inflammatory circuits through ILC3 activity and promoting immune regulation via ILC2 responses. These context-dependent functions position ILC subsets as emerging biomarkers and targets for innovative therapies.
|
|
Scooped by
Gilbert C FAURE
January 16, 2024 1:15 PM
|
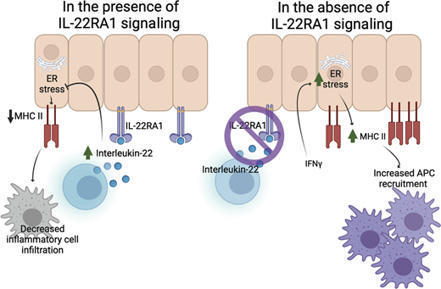
IL-22 directly suppresses interferon-γ–induced intestinal and respiratory epithelial cell MHC II. While suppression of IL-22–driven epithelial MHC II may be ben
|
|
Scooped by
Gilbert C FAURE
March 29, 2022 3:37 AM
|
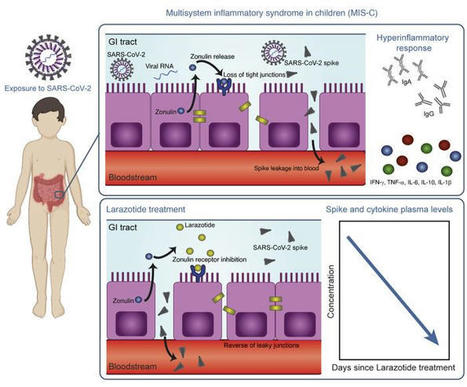
This study included biospecimens from 100 children: 19 children were clinically diagnosed with MIS-C as defined by CDC criteria (Supplemental Table 1; supplemental material available online with this article; https://doi.org/10.1172/JCI149633DS1); 26 children had COVID-19 confirmed by RT-PCR; and 55 children served as non–COVID-19 controls (32 pre-pandemic). The average age of the children with MIS-C (8 years old) was younger than that of the children who presented with COVID-19 (14 years old), which is consistent with the national averages (2, 15). The patients with MIS-C presented with a median of 3 days of acute symptoms associated with MIS-C (range, 1–28 days), after a previous COVID-19 exposure or SARS-CoV-2 infection 26 days prior to the presentation with MIS-C (range, 13–62 days). Notably, GI symptoms were predominant in the MIS-C cohort, affecting 89% of these patients, compared with 27% of children with acute COVID-19 (Fisher’s exact test, P < 0.0001; Table 1). Figure 1 outlines the specimens collected for the analysis and the timing of specimen collection from the children with MIS-C or acute COVID-19. Figure 1Study overview. Timing of sample collection and sample analysis for children with MIS-C or acute COVID-19. Table 1Age and sex for all pediatric patients and controls, and clinical features of illness for the children with acute COVID-19 or MIS-C SARS-CoV-2 in the GI tract of children with MIS-C coincides with a loss of intestinal epithelial barrier function. MIS-C develops several weeks after a SARS-CoV-2 infection or exposure (Table 1), and the viral load in respiratory secretions is known to decrease over the course of 7–10 days after infection (11, 16, 17). As most children with MIS-C have negative nasopharyngeal viral swabs (11), MIS-C is unlikely to be related to this initial infection of the respiratory tract. To assess the presence of SARS-CoV-2 in the GI tract, we measured SARS-CoV-2 RNA from MIS-C stool samples collected several weeks after the initial SARS-CoV-2 infection or exposure. Indeed, a majority of the patients showed detectable viral loads in the stool ranging from 1.5 × 10² to 2.5 × 10⁷ RNA copies/mL, suggesting an ongoing nidus of infection in MIS-C (Supplemental Table 1). An intact, functional intestinal mucosal barrier should prevent the passage of large antigens from the gut lumen into the bloodstream, including viral antigens derived from SARS-CoV-2 present in the GI tract (12). Zonulin belongs to a family of structurally and functionally related proteins that reversibly regulate intestinal permeability by modulating intercellular tight junctions (18–20). Increased circulating zonulin levels resulting in increased intestinal permeability have been reported in several diseases (21) including autoimmune and hyperinflammatory diseases such as celiac disease (22), inflammatory bowel disease (23), and Kawasaki disease (24). Zonulin release from epithelial cells can result in permissibility of paracellular trafficking of large inflammatory antigens from the gut lumen into the bloodstream. In this study, mass spectrometry showed that, compared with controls, children with MIS-C had significantly increased release of zonulin into the circulation (P = 0.003; Figure 2A), which can result in a breakdown of mucosal barrier function. Correspondingly, children with MIS-C also had increased LPS-binding protein (LBP) levels compared with controls (P = 0.007; Figure 2B), signaling increased microbial translocation. Levels of soluble CD14, another marker of microbial translocation, were also increased in children with MIS-C (P = 0.1; Figure 2C), indicating a loss of GI mucosal barrier integrity. None of these markers of GI barrier integrity — zonulin, LBP, or CD14 — was significantly increased in the children with acute COVID-19 infection. Identification of SARS-CoV-2 within the stool, coupled with the loss of competency of tight junctions seen in MIS-C, but not acute COVID-19, suggests that GI sources of SARS-CoV-2 viral components could breach the mucosal barrier and enter the circulation. Figure 2Plasma (A) zonulin, (B) LPS-binding protein, and (C) soluble CD14 levels were quantified by multiplexed MS–based proteomics (54, 55) for children with MIS-C (n = 13) or COVID-19 (n = 21) and for non–COVID-19 control participants (n = 23). Results were compared by ANOVA. (D) SARS-CoV-2 spike, (E) S1, and (F) nucleocapsid protein levels were quantified in plasma from children with MIS-C (n = 16), children with acute COVID-19 (n = 22), and pre-pandemic healthy controls (n = 32). Results were compared by 1-way ANOVA with multiple comparisons. * P < 0.05, **P < 0.01, ***P < 0.001, and ****P < 0.0001. Median values and 95% CI are presented. Children with MIS-C have SARS-CoV-2 antigenemia. Although viremia and antigenemia have been shown to correlate with severe acute COVID-19 in adults (17, 25), viremia has not been detected in MIS-C (11), and antigenemia has not previously been assessed in children. Using single-molecule array (Simoa) assays (25), we detected SARS-CoV-2 spike, S1, and nucleocapsid antigens in the plasma of children with MIS-C despite being weeks past their initial SARS-CoV-2 infection or exposure. The SARS-CoV-2 spike protein was significantly elevated in patients with MIS-C compared with healthy controls (P < 0.0001) and compared with children with acute COVID-19 (P < 0.001; Figure 2D). We also detected the SARS-CoV-2 S1 protein at significantly elevated levels in patients with MIS-C compared with healthy controls (P = 0.004) and with children with acute COVID-19 (P = 0.02; Figure 2E). SARS-CoV-2 nucleocapsid protein levels were increased in patients with MIS-C, although these levels did not reach significance (Figure 2F). We detected no significant increase in SARS-CoV-2 antigenemia in children with acute COVID-19 as compared with healthy controls. SARS-CoV-2 antigens showed no correlation with age (Supplemental Figure 1). Circulating SARS-CoV-2 antigen indicates that viral components have leaked from infected tissues. We attribute circulating antigen in patients with MIS-C to leakage from the GI system, as corroborated by the increased zonulin levels and microbial translocation markers we detected in the patients with MIS-C. The SARS-CoV-2 spike protein, specifically the S1 component (9, 10), has been hypothesized to have superantigen-like properties that are similar to those seen in the bacterial superantigen–mediated toxic shock syndrome. Superantigens bind to specific β-chains of T cell receptors (TCRs) at the variable domain in a complementary-determining region 3–independent (CDR3-independent) manner (26), thereby bypassing TCR specificity and resulting in skewing and overrepresentation of specific TCRs. Recent reports have identified TCR β variable (TRBV) gene skewing in MIS-C, with a profound expansion of TRBV11-2 (10, 27). Our data reveal a strong correlation between S1 antigenemia and the previously reported expression of TRBV11-2 in MIS-C (ref. 10; Pearson’s correlation, r = 0.89, P = 0.0005; Supplemental Figure 2). We found no correlation between the spike or nucleocapsid antigens and TRBV11-2 expression (Supplemental Figure 2). Consistent with hyperinflammatory responses, children with MIS-C experienced a cytokine storm with significantly elevated levels of IL-1β, IL-6, IL-10, and TNF-α (Supplemental Figure 3, A–D). Notably, the antiviral cytokine IFN-γ was also significantly increased in patients with MIS-C compared with both healthy controls and children with acute COVID-19 (Supplemental Figure 3E). This increase in IFN-γ is typical of a viral exposure, however, it can be paradoxically suppressed in adults with severe acute COVID-19 (28). We also assessed IL-12p70, IL-8, IL-5, and IL-22 levels but found that they were not altered in the children with MIS-C or acute COVID-19 (Supplemental Figure 3, F–I). MIS-C immunoprofiles reflect ongoing mucosal exposure to SARS-CoV-2. The immunoglobulin IgM, IgG, and IgA subsets targeting SARS-CoV-2 antigens in patients with MIS-C were most highly elevated against spike and S1 proteins (Figure 3, A–C, and Supplemental Figure 4), corresponding to the antigens most highly detected in the bloodstream of these children. As expected, anti–spike IgM was highest in children with acute COVID-19, reflecting early adaptive immune responses (Figure 3A). However, anti–spike IgM levels remained higher than would be expected, given that MIS-C presents weeks after the original infection with or exposure to SARS-CoV-2, but was on a downward trend over time (Figure 3D). As expected, anti–spike IgG, anti–S1 IgG, and anti–RBD IgG were highest in the children with delayed-onset MIS-C (Figure 3B and Supplemental Figure 4) and remained plateaued over time (Figure 3E). IgA is the immunoglobulin most reflective of mucosal immunity and typically wanes following viral clearance (29). Here, the levels of anti–spike IgA, anti–S1 IgA, and anti–RBD IgA were all significantly increased in the patients with MIS-C (Figure 3C and Supplemental Figure 4), and anti–spike IgA remained unexpectedly elevated for months after the initial SARS-CoV-2 infection (Figure 3F). The persistence of elevated anti–SARS-CoV-2 IgA and IgM in patients with MIS-C supports the hypothesis of ongoing viral antigenic exposure and inflammation in the GI mucosal surfaces of children with MIS-C. Figure 3Peak values of (A) anti–spike IgM, (B) anti–spike IgG, and (C) anti–spike IgA were quantified in plasma from children with MIS-C (n = 16), children with acute COVID-19 (n = 22), and pre-pandemic healthy controls (n = 32). Results were compared by 1-way ANOVA with multiple comparisons. Time course of (D) anti–spike IgM, (E) anti–spike IgG, and (F) anti–spike IgA were plotted over time following symptom onset for MIS-C. (G) The IC50 for antibody neutralization for children with MIS-C and children with acute COVID-19 were compared by Mann-Whitney t test. Mean values and the SD are presented. *P < 0.05, **P < 0.01, and ****P < 0.0001. We compared the capacity of plasma neutralization against SARS-CoV-2 between children with MIS-C and those with acute COVID-19. Interestingly, although the children with MIS-C had significantly elevated IgG antibody titers against SARS-CoV-2 relative to those with acute COVID-19, the neutralization titers were comparable between the children from both groups (Figure 3G). This suggests that in children with MIS-C, increasing quantities of IgG antibodies against the SARS-CoV-2 spike protein did not result in a gain in neutralizing capacity over time. Ineffective neutralization and poor antigen clearance, combined with ongoing viral antigen leakage from GI sources, could partially explain the high levels of antigen detected in the children with MIS-C. Temporal kinetics reveal that SARS-CoV-2 antigenemia is inadequately contained by humoral responses in MIS-C. Both SARS-CoV-2 antigen and immunoglobulins were detectable in patients with MIS-C at levels significantly higher than those detected in healthy controls. Antigenemia in adults occurs early in the COVID-19 disease course and is associated with pulmonary symptoms (25), whereas in MIS-C, antigenemia is found in the setting of prominent GI symptoms weeks to months after resolution of a SARS-CoV-2 upper respiratory tract infection or asymptomatic infection. To understand the relationship between viral antigenemia and the humoral response, we studied longitudinal samples from patients with MIS-C. First, we assessed antigens over time following MIS-C symptom onset. Previous reports show that in adults with acute COVID-19, SARS-CoV-2 antigens are rapidly cleared as the patient reaches seroconversion (25, 30). In contrast, our studies showed that spike antigens rose over the first few days of MIS-C symptoms and persisted for more than 10 days, occasionally through 6 months (Supplemental Figure 5), despite seroconversion to anti–spike IgG and anti–spike IgA antibodies. The elevated presence of spike protein in seroconverted patients was not observed in any adult COVID-19 cases (25). We also found that SARS-CoV-2 antigen levels did not significantly decrease in our cohort following the initiation of steroid and/or intravenous immunoglobulin (IVIG) replacement therapy (Figure 4A), which are the only currently recommended treatments for MIS-C (31). This suggests that current therapies are targeted toward the downstream consequences of MIS-C, namely the inflammatory responses, but fail to address the ongoing antigenemia instigating ongoing inflammation. Figure 4B provides a detailed overview of spike antigenemia and the humoral inflammatory responses in a representative hospitalized child with MIS-C, relative to SARS-CoV-2 exposure, symptom onset, and treatment course. Figure 4(A) SARS-CoV-2 spike, S1, and nucleocapsid levels in plasma from children with MIS-C were quantified before treatment with steroids and/or immunoglobulin replacement therapy, through 14 days following treatment (n = 11). Shaded regions signify the limit of detection for each specific antigen test. (B) Spike and anti–spike IgM, anti–spike IgG, and anti–spike IgA levels were measured over the course of illness of a child with MIS-C. Of note, the spike protein remained above the limit of detection for the spike antigen test at the 213-day follow-up point. Zonulin antagonism reduces spike antigenemia and cytokine storm, with subsequent improvement in clinical outcomes in MIS-C. Although steroids and IVIG do not block leakage of SARS-CoV-2 antigen across the mucosal barrier, therapies targeting GI mucosal permeability could potentially reduce or prevent antigenemia. Larazotide, a zonulin antagonist, is an investigational therapy that has been well characterized in preclinical trials (32, 33), with an excellent safety profile (34), and is currently in phase III trials for the treatment of refractory celiac disease (35). Given this theoretical benefit, we obtained US FDA approval for compassionate use of larazotide, 10 μg/kg every 6 hours, to treat a critically ill 17-month-old boy with MIS-C after he failed to improve with antiinflammatory therapies. The toddler, who had a complex past medical history including partial duplication of chromosome 14, biliary atresia status post Kasai procedure, and gastrotomy tube placement, with frequent episodes of ascending cholangitis, required hospitalization for severe COVID-19, complicated by respiratory failure and cardiac resuscitation. One month after he was diagnosed with COVID-19, he developed abdominal compartment syndrome with a C-reactive protein (CRP) level of 286 mg/L, a ferritin level of 51,223 μg/L, and a N-terminal pro-b–type natriuretic peptide (NT-proBNP) level of 16,462 pg/mL without evidence of cardiac injury on echocardiogram. He was treated with IVIG, steroids, and anakinra with transient improvement of inflammatory markers but rapid recrudescence of symptoms. We detected 1020 copies of SARS-CoV-2 RNA in the patient’s stool, as quantified by RT-PCR, and a plasma spike antigen level of 566 pg/mL more than 2 weeks after initiation of IVIG and steroid treatment for MIS-C. After the initiation of larazotide, his CRP level, which had quickly rebounded to 173 mg/L following withdrawal of anakinra, dropped by 85% from peak values, and spike antigen levels dropped by 90% to 59 pg/mL (Figure 5A). The SARS-CoV-2 nucleocapsid protein levels also dropped by 98% from 77 pg/mL to 1.45 pg/mL (limit of detection). His fever curve, which also rebounded after discontinuation of anakinra, improved, as did his ferritin and D-dimer levels (Figure 5A). The patient also experienced an improvement in cytokine and inflammatory mediator levels, including IL-1β, IFN-γ, IL-2R, and IL-17, representing an improvement in inflammasome activation, virus-induced IFN release, and immune cell activation (Figure 5B). These cytokines and inflammatory mediators initially spiked during the development of MIS-C, then improved following IVIG but plateaued or rebounded despite steroid treatment. We observed an improvement in these inflammatory mediators following the precipitous drop in SARS-CoV-2 antigens, which occurred as a result of or coincident with the initiation of larazotide therapy. Importantly, the patient achieved his longest stretches without fever since his hospital admission, his GI symptoms improved and he was able to resume full feedings, and his ventilatory status improved. Figure 5Timeline for the child treated with larazotide. The hospital course is delineated by hospitalization for acute COVID-19 (day 0) followed by development of MIS-C (day 39), with the treatment courses identified along the time course. (A) CRP and SARS-CoV-2 spike antigen levels, the median daily temperature (temp) curve, and D-dimer and ferritin levels throughout the hospital course are shown. Light blue shading represents a normal body temperature. The light gray shading highlights the days of larazotide treatment. (B) Inflammatory cytokine IL-17F, IL-2R, IFN-γ, and IL-1β levels following the development of MIS-C, in relation to the treatment courses.
|
|
Scooped by
Gilbert C FAURE
January 19, 2022 5:03 AM
|
Innate lymphoid cells (ILCs) and in particular ILC3s have been described to be vital for mucosal barrier functions and homeostasis within the gastrointestinal (GI) tract.Importantly, IL-22-secreting ILC3 have been implicated in the control of inflammatory bowel disease (IBD) and were shown to reduc...
|
|
Scooped by
Gilbert C FAURE
August 27, 2020 7:43 AM
|
Nutr Clin Pract. Author manuscript; available in PMC 2016 Dec 1. Published in final edited form as: Published online 2015 Oct 8. doi: 10.1177/0884533615609899 PMCID: PMC4838018 NIHMSID: NIHMS777222 PMID: 26449893 The Gut Microbiome: What we do and don’t know Gail A. Cresci, PhD, RD, LD, CNSC, Associate Staff and Emmy Bawden, RD The publisher's final edited version of this article is available at Nutr Clin Pract See other articles in PMC that cite the published article. Introduction Interest in and knowledge of the gut microbiome has increased exponentially in the past decade. An internet search using key words such as “gut microbiome” or “gut microbiota” generates between 1 and 2.2 million results. Once overlooked, this component of the gastrointestinal (GI) tract is now gaining appreciation for its importance in optimal health. The food industry has taken this to full heights and a plethora of food and supplement products touting “probiotic” or “fermented foods” populate store shelves; and advertisements for them can be found in magazines, the internet and television commercials. Never before has the discussion of one’s bowel habits and GI symptoms been more mainstream. Interestingly, this rapid growth has left both consumers and many clinicians confused as the data, while growing, still leave many unanswered questions. Dating back to the early 1900’s Eli Metchnikoff, a Russian scientist of the Pasteur Institute in Paris, associated longevity of rural Bulgarians to their consumption of fermented milk products. He postulated that the lactic acid bacteria in the fermented milk products ingested by these peasants living in harsh climate and poverty provided an anti-aging effect which contributed to their greatly outliving wealthier Europeans. He named the organism “Lactobacillus bulgaricus.” As Metchnikoff researched, he hypothesized that seeding the gut with healthy bacteria by drinking fermented milk products could fight off harmful bacteria and prolong life. He was the first scientist to suggest that it was possible to modify the gut microbiome by replacing bad bacteria with good bacteria, and he earned a Nobel Prize in 1908 for his work in immunity. The discovery of penicillin in 1928 by Sir Alexander Fleming, a Scottish biologist, turned the attention of researchers away from using bacteria to assist with healing to that of using soil fungi derivatives to kill bacteria. During the golden age of antibiotic discovery from 1940–1960, most antibiotics were originally isolated by screening soil-derived actinomycetes (1). However as returns diminished on this discovery platform, new discoveries were based upon synthetic compounds. However this target-focused screening process of large libraries also failed, partly due to the inability of these synthetic compounds to penetrate the bacterial envelope (1). Unfortunately the deceleration of antibiotic discovery is accompanied with the spread of resistant bacteria, and a major public health threat of untreatable infections. With advances in micro- and molecular biology techniques, the culture is poised to revisit past successes with bacterial therapy for gut health and immunity in order to develop future treatments. One of several international efforts, the Human Microbiome Project (HMP) utilizes high through multi ‘omics analyses to identify and study the microbiome in human health (2,3). Funded by the NIH common fund in 2008, the HMP has resulted in the isolation and sequencing of over 1,300 reference strains thus far from the human body (2,3). The HMP Consortium has reported the structure and function of the human microbiome in 300 healthy adults (18–40 yrs) at 18 body sites from a single time point. This has led to an unprecedented amount of data about the complexity of the human microbiome allowing for a baseline for further research into the impacts of the microbiome on health and disease. As a precursor to the Human Microbiome Project, the Human Gut Microbiome Project has widened our appreciation for the bacterial ecosystem that resides within the human intestinal tract. This system is comprised of microorganisms such as bacteria, archaea, fungus and viruses that are distributed throughout the entire gastrointestinal tract (4). Ongoing investigations are revealing the importance of the gut microorganisms in exerting beneficial effects on human health. The typical healthy person is inhabited with trillions of microbes (Figure 1). But to confuse matters, two healthy people may have very different microbiomes. Analysis of HMP samples with lifestyle and history questionnaires has revealed associations between life-history characteristics and microbiome composition (5). Ding and Schloss analyzed a 16S rRNA gene sequence data set from the HMP Consortium. As a significant difficulty in analyzing microbiome data has been the considerable intra- and interpersonal variation in the composition of the human microbiome, this study took the approach of clustering samples into bins based on their taxonomic similarity. Using bacterial community structures collected from18 body sites and up to three time points, they applied community typing analysis to better understand the factors that affect the structure of the microbiome and contribute to human health. Using Dirichlet multinomial mixture models to partition the data into community types for each body site, their analysis of simulated data and the HMP data suggest that the community types represent clusters of relative abundance profiles. Three important observations were made with this approach. Firstly, there were strong associations between whether someone was breastfed, their gender and education level with their community types at several body sites. Secondly, the community types of the oral cavity and gut microbiome were predictive of each other even though the specific taxonomic compositions were different. Lastly, stability of community types was least stable in the oral cavity and most stable in the vagina and gut communities over the course of the sampling period. Therefore the authors concluded that despite substantial intra- and interpersonal variation in the human microbiome, by partitioning this variation intocommunity types, the types became predictive of each other and are likely the result of life-history characteristics (5). The gut microbiome is influenced by multiple factors including mode of infant delivery and feeding, aging process, diet composition, geography, medications, and stress (Figure 2). The following sections provide a brief overview of current knowledge regarding variances in the gut microbiota related to these factors. Our first colonization In utero It was previously believed that the GI tract was sterile in utero, and that during the birthing process was when first colonization and initiation of the gut microbiome occurred (6). However, recent studies have challenged this belief by demonstrating the presence of microorganisms in the placenta, amniotic fluid and umbilical cord (7–9). This work is still preliminary but deserves further study as it highlights the importance of maternal gut microbiota health. It is hypothesized that by swallowing amniotic fluid and its bacteria in utero, the fetus begins to colonize the developing GI tract (10). The meconium, the first infant stool sample, has also been shown to contain microorganisms (11). Notably, the meconium from preterm infants shows a different microbiota composition from that seen in a sample acquired after the first week of life, demonstrating how normal gut colonization takes place throughout the course of fetal development (10). Absence of this progressive colonization could place preterm infants at risk for various gastrointestinal infections, including necrotizing enterocolitis (NEC) (10). As a means to mimic the natural inoculation of the gut, multiple studies have evaluated probiotic supplementation as a means to influence the incidence and severity of NEC. A recent Cochrane review, which included 24 randomized controlled trials (n=5529), assessed the role of probiotic supplementation in preterm neonates. The review confirmed previous findings that probiotic supplementation significantly reduces the risk of stage II or greater necrotizing enterocolitis and all cause mortality in this patient population (12). As probiotics are known to have potentially beneficial effects on gut function and maturity, Athalye-Jape et al conducted a meta-analysis that included 25 randomized controlled trials (n=5895) to determine if probiotic supplementation influenced the time to establish first full enteral feeds in preterm neonates (13). Overall, the subjects supplemented with probiotics took less time to achieve full feeds (mean difference: −1.54 d; 95% CI: −2.75, −0.32d; p=0.01; I2 = 93%). The type and/or number of probiotic strains (e.g., Bifidobacterium or non-Bifidobacterium) did not influence this improvement. Additionally, probiotic supplementation reduced hospital length of stay, feeding intolerance, and duration of indirect hyperbilirubinemia as well as increased weight gain and growth velocity. None of the trials reported adverse effects of probiotics on outcomes. Delivery Mode The birthing process exposes newborns to a wide range of microorganisms that also contribute to the colonization of the gut microbiome. The mode of delivery affects the composition of the infant’s gut microbiota, and interestingly, the gut microbiota of the newborn will closely resemble the microbiota with which they encountered during birth. During a vaginal birth, the infant is inoculated with vaginal microbiota, which differs from skin microbiota encountered during a caesarian section (14). At the phylum level, studies have shown that infants delivered vaginally have a larger population of Bacteroidetes than Firmicutes when compared to infants delivered via cesarean section (15). Despite exposure in utero, the majority of microbes that will colonize the infant gut are acquired postpartum. The initial colonization pattern is thought to be chaotic, and increasing evidence suggests that environmental exposures early in life, including diet, are responsible for these variations (16). Gut colonization in an infant occurs in a succession of stages. Early on, the gut becomes colonized by primarily aerobic organisms, such as enterobacteria, staphylococci, and streptococci, many of which have the potential to be pathogenic. These early colonizers begin to change the gut environment, paving the way for colonization by an increasingly anaerobic community of microbes (17). The structure of the gut community continues to change over the first year of life and thereafter in response to external factors such as diet and antibiotic use (18, 19). Weaning, breastfeeding status, and the successive introduction of different types of food all correspondingly affect the infant gut microbiome and immune system (20). Infant Feeding Method Breast milk is the optimal food for infants as it meets all their nutritional and physiologic requirements. Human milk contains protein, fat and carbohydrate, as well as immunoglobulins and endocannabinoids (21). Breast milk is not sterile as it contains as many as 600 different species of bacteria including beneficial Bifidobacterium breve, B. adolescentis, B. longum, B. bifidum, and B. dentium (22). In addition to lactose, the carbohydrate component of human milk also contains oligosaccharides which comprise the third largest solid component (23). Human milk oligosaccharides are indigestible polymers formed by a small number of different monosacchrides that serve as prebiotics by selectively stimulating growth of members of the genus Bifidobacterium(23). Some of the beneficial effects of breast feeding over formula feeding are attributed to the effects of oligosaccharides on the beneficial bacteria as an increased proportion of Bifidobacteria is noted in breast-fed infants compared to those fed formula (24). Bifidobacteria have been linked with strengthening gut mucosal protection through activities against pathogens (25). Bifidobacteria have been shown to increase the production of immunoglobulin A which is correlated with modulation of the intestinal immune system (26). Schwartz et al studied breast-fed and formula-fed infants and their mothers. Stool samples from each infant were collected, and microbial DNA was extracted and sequenced; and mRNA was isolated from stool containing host gut exfoliated epithelial cells and processed for microarray analysis (20). They found that the microbiome of breast-fed infants to be significantly enriched in genes associated with virulence functionality, and demonstrated a multivariate correlation between the gut flora genes associated with bacterial pathogenicity and the expression of host genes associated with immune and defense mechanisms. Interestingly, the operational taxonomic unit (OTU) composition and genetic potential of the microbiota differed between breast-fed and formula-fed infants. The researchers suggested their findings indicate human milk promotes the mutualistic crosstalk between the mucosal immune system and the microbiome in the maintenance of intestinal homeostasis. More research is needed to better determine the mechanisms by which Bifidobacteria produce these effects. Aerotolerance of the intestinal microbiota also seems to differ between breast-fed and formula-fed infants. Aerobic organisms are more common in the feces of breast-fed infants, whereas anaerobic and facultatively anaerobic organisms, which preferentially use anaerobic glycolysis, are more frequently identified in feces of formula-fed infants (27). Bacteroides and Clostridia colonization differs between the two types of feeding, with breast-fed infants characterized with lower concentrations of both (28–30). With a better understanding of the composition of human breast milk, developments of complex infant formulas have attempted to mimic its nutritional value making them an acceptable alternative for mothers unable to breast-feed. Infant formulas are not a perfect substitute for human milk since bioactive compounds contained in breast milk known to affect nutrient absorption and digestion, immune protection, and defense against potentially pathogenic microbes are lacking (21). Unfortunately it is difficult to mimic the actions of these bioactive compounds. While infants fed a formula enriched with oligosaccharides have been shown to harbor more Bididobacteria in the feces, more evidence is needed for affirmation that infant formulas designed to mimic breast milk are beneficial (31). Changes in the Gut Microbiome with Age Revealed by metagenomic analysis, gut microbiota composition transforms throughout early stages of human development and is influenced by the diet (32). As an infant’s diet comprises breast milk and formula, this is reflective in that the microbiome has minimal diversity and is enriched in genes to facilitate lactate utilization (33). A shift in the functional capacity to preferentially utilize plant-derived glycans occurs prior to the introduction of solid foods. Around 3-years of age, the bacterial composition resembles that of an adult and remains stable until old age when variability in community composition increases (34). In terms of ecological succession, the Bifidobacterium-dominated microbiota of the infant changes over time into the Bacteroidetes- and Firmicutes-dominated microbiota of the adult (35). This distribution remains fairly stable throughout adulthood in the absence of perturbations, such as long-term dietary changes or repeated antibiotic usage. Declines in dentition, salivary function, digestion and intestinal transit time may affect the gut microbiota upon ageing (36). There are notable differences in the microbiota in elderly people compared to young adults, with relative proportions of Bacteroidetes predominating in the elderly compared to higher proportions of Firmicutes in young adults (37). The elderly are also noted to have significant decreases in Bifidobacteria, Bacteriodes, and Clostridium cluster IV (38). Variability varies greatly among individuals ranging from 3 to 92% for Bacteroidetes and 7 to 94% for Firmicutes (34). However the microbiota are less variable within individual subjects (34). Alterations in gut microbiome are associated with health concerns pertaining to the elderly, such as frailty. A significant reduction in microbial diversity with reduced composition of lactobacilli, Bacteroides/Prevotella and Faecalibacterium prausnitzii, and increased proportions of Ruminococcus, Atopobium and Enterobacteriaceae was observed in people with high frailty scores (39). Claesson et al investigated the links between diet, environment, health and microbiota in 178 older people (>65 years) subjects and found an association between gut microbiome diversity and functional independence (39). Decreased microbial diversity was noted in individuals living in short- or long-term residential care compared to those living in the community, and this difference was associated with increased frailty, decreased diet diversity and health parameters as well as increased inflammatory markers (serum TNF-α, IL-6, IL-8 and C-reactive protein) (38). Dietary patterns in residential location correlated with separations based on microbiota composition with the most discriminating food types being vegetables, fruit and meats. Complete linkage clusterings revealed four dietary groupings: low fat/high fiber and moderate fat/high fiber included 98% of the community and day hospital subjects; and moderate fat/low fiber and high fat/low fiber included 83% of long-stay subjects (39).Significant associations between several health/frailty measurements were found with minimum variability amongst community dwellers, but within the long-stay subjects the most significant associations were related to functional independence, Barthel index (functional assessment) and nutrition, followed by blood pressure and calf circumference. The authors speculated that the later may be attributable to the influence of diet and/or the microbiota on muscle mass and sarcopenia and hence frailty. Influences on the Gut Microbiome Geography Geographical location and ethnicity have been shown to be determinants of the diversity and overall composition of microbiota. A 2013 study performed by Prideaux (40) et al looked at Caucasian and Chinese subjects in the United States and Hong Kong and found that microbial composition differed between countries and between ethnicities within the same country. In an elegant study, Yatsunenko et al characterized bacterial species in fecal samples from 531 individuals comprised of healthy children and adults from the Amazonas of Venezuela, rural Malawi and US metropolitan areas and included mono- and dizygotic twins (41). All populations studied showed shared features of gut microbiome development during the first three years of life including age-associated changes in the genes involved in vitamin biosynthesis and metabolism. Phylogenetic composition of fecal microbiota was significantly altered between individuals living in the different countries, with pronounced separation occurring between the US and the Malawian and Amerindian gut communities; this was true for individuals aged 0–3 years, 3–17 years, and for adults. However there was also separation between the non-US populations. Bacterial diversity increased with age in all three populations with the microbiome of the US population having the least diversity. Microbiome datasets from breastfed children (n=110: (24 babies (0.6–5 months old), 60 children and adolescents (6 months to 17 years old) and 26 adults) were analyzed to determine which bacterial taxa changed monotonically with increasing age within and between the three sampled populations. In all babies 16S rRNA sequences mapped to members of the Bifidobacterium genus, and while Bifidobacteria dominated fecal communities during the first year of life, they proportionally declined during this period. Also noted were age and population-related changes in metabolism. A total of 476 enzymes were identified as being significantly different in US versus Malawian and Amerindian breastfed babies (p<.0.001). The most prominent differences involved pathways related to vitamin biosynthesis and carbohydrate metabolism. Malawian and Amerindian babies, but not adults, had higher representation of enzymes that were components of the vitamin B2 (riboflavin) biosynthetic pathway. Compared with adults, baby microbiomes were enriched in enzymes involved in the scavenging of glycans represented in breastmilk and the intestinal mucosa (mannans, sialylated glycans, galactose and fucosyloligosaccharides), with several of these genes significantly overrepresented in Amerindian and Malawian baby microbiomes compared with US. Interestingly, urease gene representation was significantly higher but decreased with age in Malawian and Amerindian baby microbiomes, as opposed to the United States, where it was low from infancy to adulthood. Urea, which comprises up to 15% of the nitrogen present in human breast milk, is broken down by urease to ammonia which can then be used for microbial biosynthesis of essential and nonessential amino acids. Urease also has a crucial role in nitrogen recycling, particularly when diets are deficient in protein making urease potentially advantageous to both the microbiome and host when dietary nitrogen supply is suboptimal (42). A typical US diet is rich in protein, whereas diets in Malawian and Amerindian populations are dominated by corn and cassava. The differences between US and Malawian/Amerindian microbiomes can be related to these differences in diet. The enzymes that were the most significantly enriched in US fecal microbiomes parallel differences observed in carnivorous versus herbivorous mammals (43). Interestingly, several enzymes involved in the degradation of amino acids were overrepresented in adult US fecal microbiomes including aspartate, proline, ornithine and lysine as were enzymes involved in the catabolism of simple sugars (glucose-6-phosphate dehydrogenase and 6-phosphofructokinase), sugar substitutes (L-iditol 2-dehydrogenase, which degrades sorbitol), and host glycans (α-mannosidase, β-mannosidase and α-fucosidase). By contrast Malawian and Amerindian microbiomes had an over-representation of α-amylase which participates in the degradation of starch reflecting their corn-rich diet. Perhaps reflecting a fat-rich diet, the US microbiomes had an over-representation of enzymes involved with vitamin biosynthesis (cobalamin, biotin and lipoic acid), in the metabolism of xenobiotics (phenylacetate CoA ligase), which participates in the metabolism of aromatic compounds, and mercury reductase, and in bile salt metabolism (choloylglycine hydrolase). To obtain insights into commonalities and differences between gut microbiomes across different populations, Arumugam et al sequenced 22 European metagenomes from Danish, French, Italian and Spanish individuals that were selected for diversity and combined them with previous sequencing results from Japanese and Americans to total 39 individuals (44). They found that despite the vast number of species residing in the gut and their inter-individual variability, the microbiota composition can be classified into at least 3 distinct groups, or enterotypes. The enterotypes contain functional markers that correlate with individual features such as age and body mass index (BMI). For example, starch degradation enzymes such as glycosidases and glucan phosphorylases increase with age, which could be a reaction to decreased efficiency of host breakdown of dietary carbohydrates with age (45). Three marker modules, two of which were ATPase complexes, correlated strongly with the hosts’ BMI supporting the link found between the gut microbiota’s capacity for energy harvest and obesity in the host (46). The authors concluded that these functional markers might be utilizable for diagnostic and perhaps even prognostic tools for numerous human disorders, for instance colorectal cancer and obesity-linked co-morbidities such as metabolic syndrome, diabetes and cardiovascular pathologies. Food Supply Diet has emerged as one of the most relevant factors in influencing the gut microbiome. Significant and meaningful changes in the gut microbiota have been associated with dietary alterations, primarily consumption of dietary fiber from fruits, vegetables and other plants. A diet that is varied and complex is associated with a more diversified microbiome. Globally the microbiome composition is noted to be different amongst different populations and cultures. De Filippo et al compared the gut microbiota of children aged 1–6 years living in a village of rural Africa in an environment that still resembles that of Neolithic subsistence farmers with the gut microbiota of western European children (Florence, Italy) of the same age, with dietary habits and living conditions typical of the developed world (47). Traditionally the African children are breast-fed until the age of 2 after which their diet is predominantly vegetarian; low in fat and animal protein and rich in starch, plant polysaccharides and fiber. All food resources are completely produced locally, cultivated and harvested nearby the village. The dietary content of carbohydrate, fiber and non-animal protein is very high. Animal protein intake is low and consists of mainly chicken and termites during the rainy season. The European children were breast-fed for up to 1 y of age after which they ate a typical Western diet high in animal protein, sugar, starch, and fat and low in fiber. Average caloric intake differed between the two populations (African children: 1–2 y old, 672 kcal/d; 2–6 y old, 996 kcal/d; European children: 1–2 y old, 1,068 kcal/d; 2–6 y old, 1,512 kcal/d). Multiplex pyrosequencing of the 16S rRNA gene revealed that 94.2% of the sequences in all of the African and European samples were found to belong to the four most populated bacterial phyla, namely Actinobacteria, Bacteroidetes, Firmicutes,and Proteobacteria, in agreement with previous studies describing such phyla as those contributing to the majority of human gut microbiota (48). Relevant differences were found in the proportions of four phyla: Actinobacteria and Bacteroidetes were more represented in African than in European children’s microbiota (10.1% versus 6.7% and 57.7% versus 22.4%, respectively), whereas Firmicutes and Proteobacteria were more abundant in European than in African children (63.7% versus 27.3% and 6.7% versus 0.8%, respectively). Firmicutes were twice as abundant in the European children as evidenced by the different ratio between Firmicutes and Bacteroidetes (F/B ratio ± SD, 2.8 ± 0.06 in European and 0.47 ± 0.05 in African). While short-chain fatty acid (SCFA)-producing bacteria were found in both populations, bacteria (Xylanibacter, Prevotella, Butyrivibrio, and Treponema) which use xylane, xylose, and carboxymethylcellulose to produce high levels of SCFAs and have a protective role against gut inflammation (49) were found exclusively in the African children. Notably, the African children had higher levels of total SCFA than the European children, with 4 times higher levels of butyrate and propionate. The authors concluded a correlation exists between polysaccharide-degrading microbiota and the calories that the host can extract from his/her diet, potentially influencing the survival and fitness of the host, suggesting that the microbiome of the African children co-evolved with their diet to assist with energy harvest by producing high levels of SCFA. Microbial enrichment has been associated with diets high in fruits, vegetables and fiber compared to a Western diet rich in fat, sugars and animal protein and depleted of fiber. Zimmer et al analyzed the fecal flora of a large group of healthy volunteers on a strict vegetarian or vegan diet with classical microbiological culture and compared them with age and gender matched subjects consuming an omnivorous diet (50). The faecal microbiota of vegetarian and vegan subjects showed significantly lower microbial counts of Bifidobacterium, Bacteroides, E. coli and Enterobacteriaceae species and lower stool pH compared with omnivores. Compared to an omnivore diet, a vegetarian/vegan diet is associated with a higher carbohydrate and fiber content in which the undigestible polysaccharides can be fermented into SCFA by the gut microbiota. Production of SCFA is associated with decreasing luminal pH. The fact that E. coli and Enterobacteriacea do not thrive in lower pH ranges (5.5–6.5) and that they prefer proteins as their energy source, may explain the lower counts in the subjects consuming a vegan/vegetarian diet. Depleted microbial biodiversity of the gut microbiota in people consuming a Western diet is associated with increasing incidence of obesity, coronary vascular disease, metabolic syndrome and certain malignancies. Detailed discussion of each of these associations is beyond the scope of this paper. At a minimum, the diversity of the gut microbiome may be a future biomarker of long-term consumption of a “healthy” versus “unhealthy” diet which may be linked to potential for disease development. Stress Stress is defined as an organism’s total response to environmental demands or pressures. There are several different types of stressors, such as acute or chronic, acute on chronic, or repetitive acute. Stress can be predictable and controllable as well as unpredictable and uncontrollable, mild or severe, and occur in or out of context (51). Both the perception of stress and the persistence of its consequences vary between people. Stress contributes to susceptibility to disease and disabilities, therefore represents a severe economic burden. Psychological and physical stressors activate the hypothalamic-pituitary-adrenal (HPA) axis. This results in a series or hormonal responses including release of corticotrophin-releasing hormone which induces the release of adrenocorticotrophic hormone systemically with then stimulates glucocorticoid synthesis (cortisol) in the adrenal cortex (52). Additionally, catecholamines (noradrenaline and adrenaline) are also released following psychological and physical stressors. The GI tract, and more recently known, the gut microbiota, is sensitive to stress and stress mediators. Enteric bacteria respond to the release of stress-related neurochemical mediators by the host which can influence the response to a bacterial infection (53). Recent theory suggests that bacteria act as delivery vehicles for neuroactive compounds, and therefore can affect host physiology by providing neurochemicals (54). Physiological Stress-Exercise High intensity exercise is a physiological stressor that can lead to gastrointestinal distress. There are some reports that between 30–90% of distance runners have experienced intestinal problems related to exercise (55). The degree of intestinal distress can range from mild to severe, and symptoms include nausea, vomiting, abdominal angina, and bloody diarrhea. High intensity training has been associated with reduced GI blood flow, tissue hyperthermia and hypoxia leading to possible alterations of microbiota and gut barrier. Athletes often have different dietary pattern from non-athletes depending upon the type of activity they in which they participate. In a study of professional rugby players during a regulated environment of preseason training, Clarke et al demonstrated the impact of exercise and associated dietary changes on the gut microbiota (56). Enhanced gut microbial diversity was significantly higher and positively correlated with increased exercise and dietary protein intake in athletes as compared with size matched (high Body Mass Index – BMI ~30 kg/m2) and age/gender matched (lower BMI <25) non-athletic control groups, with fewer differences seen between the two control groups. Interestingly, when compared to controls, the athletes also exhibited lower inflammatory markers and improved metabolic markers. Athletes consumed more calories, with a higher percentage of protein, and grazed eating throughout the day compared to non-athletes. Microbiota diversity measures were positively correlated with protein intake and plasma creatine kinase levels, a marker of extreme exercise, suggesting that both diet and exercise were influencing changes in microbial diversity. The athlete’s increased microbial diversity was reflected by the presence of representatives of 22 phyla of bacteria in contrast to 11 and 9 phyla in the low and high BMI controls, respectively. There are several potential mechanisms by which physical activity and fitness might modify the microbiota. Abrupt exercise produces multiple metabolites and inflammatory mediators whereas habitual exercise and fitness leads to suppression of basal inflammatory cytokines suggesting a regulatory loop between exercise biology and host immunity (57). Regular exercise has an anti-inflammatory effect which improves the immunological profile in type 2 diabetes mellitus, coronary artery disease, peripheral arterial disease and obesity (58–61). In animal models, repeated exercise results in reduced pro-inflammatory cytokine expression and increased anti-inflammatory IL-10 expression (62, 63). Regular exercise also decreases colonic oxidative insult in a rat model of colitis (64). Contrary to the benefits of regular exercise, prolonged excessive exercise can negatively affect intestinal function. As high-intensity exercise can lead to prolonged intestinal hypo-perfusion, intestinal ischemia may result. Increased intestinal permeability can result making the gut susceptible to endotoxin translocation (65–67). Probiotic supplements, in conjunction with other dietary strategies, have been studied in athletes as a means to improve gut health, as characterized by decreased symptoms of nausea, cramping, bloating and diarrhea,as well as improved immunity. Primarily supplements containing Lactobacillus and/or Bifidobacterium species have been utilized. Products have been provided from 1 to 6 months, before and/or after exercise or a competition, and at varying doses (109–1012 CFU/day). Some studies report clinical outcomes of improved upper respiratory tract illness (64–69), gastrointestinal illness (70–72)), as well as immunological measures and outcomes (67, 68, 73–76)). Physiological Stress-Critical Illness As seen in high intensity exercise, intestinal hypoperfusion resulting from redistribution of splanchnic circulation severe enough to cause gut ischemia and mucosal injury, often occurs in the critically ill. In the critically ill, the gut has an important role in promoting infectious complications and multiple organ dysfunction syndrome (MODS). This is due to deteriorated intestinal epithelium, altered gut immune system, and dysfunctional metabolic activities of commensal bacteria (77). Shimizu et al, evaluated the gut microbiota and gut environment (fecal pH and presence of organic acids) in patients with systemic inflammatory response syndrome (SIRS) (78). In comparison to healthy controls, patients with severe SIRS had significantly lower total anaerobic bacterial counts (especially 2–4 log fewer commensal Bifidobacterium and Lactobacillus) and 2 log higher potentially pathogenic Staphylococcus and Pseudomonas group counts. Concentrations of total organic acids, in particular the short-chain fatty acids (SCFA) acetate, propionate and butyrate, were significantly decreased in the patients, whereas pH was markedly increased. This group of researchers further investigated the impact of fecal pH in critical illness in 138 trauma patients (79). Patients with acidic or alkaline feces were noted to have decreased Bacteroide and Bifidobacterium species. The incidence of bacteremia in patients with an acidic or alkaline fecal pH was significantly higher than those with a fecal pH in the normal range (P < 0.05 versus normal range). The incidence of both bacteremia and mortality were associated with an increased pH of 6.6. When the pH level was increased or decreased by one, the incidence of bacteremia more than tripled and mortality more than doubled. Total SCFA (propionate, butyrate) concentrations decreased with pH >6.6; lactic, succinic, and formic acids were increased in acidic feces which is notable as these are produced by Enterobacteriaceae (80). Whether these changes are a cause or consequence of SIRS is yet to be determined. While this study lends potential that fecal pH could be a risk factor marker, it does have limitations because these data were made with the use of culture-based interrogation of the microbiota and because the pH was not specified by gastrointestinal region. Alterations in the gut microbiome have been shown to occur within 6 hours of a metabolic insult and the microbiome fails to return to microbial patterns seen in healthy controls (81). Numerous studies attempting to modify the gut microbiome and improve clinical outcomes in the critically ill by providing probiotics, prebiotics or synbiotics have been performed (82–89). Details of these studies are beyond the scope of this review. Methods of dosing, supplement duration and supplements utilized vary amongst studies making general recommendations difficult. Several meta-analyses and systematic reviews have been performed evaluating probiotics in the critically ill (89–91)). The choice of the studies included in the analysis will determine the overall outcome of the study. Generally, it seems probiotic supplementation in the critically ill favorably improves outcomes. However, the issue of heterogeneity and lack of good quality studies is a highlight of systematic reviews of probiotic use in critically ill patients. Knowing that unrecoverable gut dysbiosis occurs early after metabolic insult and knowing the potential mechanisms of action of certain probiotic strains, further rigorous study on probiotic provision in the critically ill deserves attention. Future studies should focus on 1) clarification of viable probiotic strain(s) provided, and their dosage, route and timing of delivery; 2) clear definitions for the outcomes attempting to modify (ventilator associated pneumonia, diarrhea); and 3) focus effect of probiotic supplementation on meaningful clinical endpoints (mortality, duration of mechanical ventilation, other infections, length of stay). Psychological Stress The discovery of hormonal regulation of digestion initiated the concept of the gut-brain axis (92). The interaction of psychological factors and altered gut physiology via the gut-brain axis, where brain and gut symptoms are reciprocally influencing each other’s expression, is a conceptual framework of functional GI disorders (irritable bowel syndrome, functional dyspepsia). Early life stressors (e.g., psychological, sexual and/or physical abuse) have been suggested as important contributors to the pathogenesis of functional GI disorders (93–96)). This is a crucial developmental period when the gut microbiota are diversifying, thus making it particularly vulnerable to these stressors. Animal models of maternal separation, a model commonly used for early life stress, induces prolonged HPA-axis hyperactivity (97–103), anxiety-like behavior (100,,104–106), visceral hypersensitivity (107, 108–110), and altered cholinergic activity in the gut (111, 112), along with increased intestinal permeability (107, 113–116). This model results in a dysfunctional gut-brain axis and produces phenotypes found in irritable bowel syndrome patients (106, 116– 118). This animal model also yields gut dysbiosis in addition to other physiological and behavioral features of irritable bowel syndrome (118–120)). Various means to restore gut dysbiosis with probiotics have been investigated and appear to improve the negative stress-induced effects (107, 111, 120– 122).). Morphologic changes also result from maternal separation with increased goblet cells in the crypts of proximal colon with a subsequent increase in mucus secretion and a thinner mucosal layer (112). Thus changes in the gut microbiota in maternally separated animals could be resultant from changes to gut physiology (111– 114)) and morphology (112). Although the exact mechanisms are unknown, data thus suggest that stress, whether acute or chronic, creates a dysbiotic gut microbiome which then may induce anxiety and depression (52). It seems that metabolites produced by the gut microbiota might modulate brain biochemistry and behavior (54, 123–125). Through regulation of the vagus nerve, behavior can be altered by the gut microbiota which then affects neurotransmitter metabolism (126, 127)) or other undefined pathways (128)). Thus futuristic therapy for patients with irritable bowel syndrome with co-morbid depression or anxiety may be targeted probiotic and/or synbiotic either alone or as an adjuvant to traditional therapy. Pharmaceuticals There is substantial variation in the pharmacokinetics of most commonly used drugs, and large differences in the responses of ill persons to therapeutics. The gut microbiota assists in the conversion of inactive therapeutics (e.g., prodrugs) and dietary bioactives into their active forms (129–131). For example, a medication prescribed for ulcerative colitis, sulfasalazine remains inactive until it reaches the distal gut. This prodrug consists of an ant-iinflammatory 5-aminosalicylic acid (5-ASA) molecule connected to a sulfapyridine molecule through an N-N double bond. Gut microbiota encoded azoreductases cleave the N-N double bond to release active 5-ASA (131). Likewise, foods such as fruits, vegetables, cereals and coffee contain conjugated hydroxycinnamates, antioxidant and anti-inflammatory compounds which are activated following microbial biotransformation (132). Therefore, a question arises whether variation in medication response amongst people is due to alterations in their gut microbiome? The host possesses many protective mechanisms to protect against ingested pathogens including an acidic gastric environment, optimal bile flow, peristalsis and the gut microbiota. Current data suggest that the gut microbiota protects the host from pathogens by competing for binding sites, competing for requirements, and by direct inhibition through release of inhibitory molecules (133). When these protective mechanisms are disrupted, an imbalance in the gut microbiota can occur. Gastric Acid Suppression Several conditions such as intestinal dysmotility, altered GI anatomy, immune deficiencies, and hypochlorhydria (134) are predisposing factors for the development of small intestinal bacterial overgrowth (SIBO). While hypochlorhydria can be a result of Helicobacter pylori colonization and aging, many people also take medications to reduce their gastric acidity for stress ulcer prophylaxis or gastric esophageal reflux disease. The pH of gastric acid in the stomach lumen is normally 1.5–3.5; maintaining intragastric pH above 3.5–5.0 prevents gastric mucosal injury and may be facilitated with histamine 2 receptor antagonists (H2RAs), sucralfate, and proton pump inhibitors (PPIs) (135). Previous studies show that PPIs are known to alter the GI bacterial population in 50% of patients on long-term treatment with any type of effective antisecretory drug (135, 136). Lombardo et al, conducted a study in 200 patients with gastroesophageal reflux disease (GERD) receiving PPI treatment, 200 patients with irritable bowel syndrome (IBS) not receiving PPI treatment, and 50 healthy control subjects not receiving PPI treatment greater than 10 years and showed that SIBO occurs more frequently in long-term PPI users than patients with IBS or control subjects (137). They found the incidence of SIBO was significantly different (P< .001) in patients using PPIs (50%) as compared to patients with IBS not using PPIs (24.5%), and healthy control subjects (6%). According to a multivariate analysis including 5,387 elderly subjects, the presence of diarrhea was significantly associated with use of PPIs (odds ratio [OR] 2.97, 95% confidence interval [CI] 2.03–4.35) and antibiotics (OR 4.58, 95% CI 1.95–10.73) (138). Theisen et al, found that the suppression of gastric acid with omeprazole led to a high prevalence of SIBO, leading to a markedly increased concentration of unconjugated bile acids (139). Conversely a retrospective chart review completed in 1,191 patients with glucose hydrogen breath testing (GHBT) evaluated whether this value positively correlated with patients on PPI therapy (134). Interestingly, GHBT was positively associated with older age and antidiarrheal use, but not with PPI use. Therefore, the authors concluded that PPI use was not associated with the presence of SIBO as measured by GHBT. However, Lombardo (140) challenged these results making a point that PPI use has become very common, both prescription and over-the-counter, and many patients may not consider non-prescription use as a medication and not disclose it to their physician. The authors were unable to confirm actual use of PPI due to the nature of a retrospective chart review. Additionally, as PPI duration is related to incidence of SIBO, the lack of knowledge regarding the duration the patients were taking a PPI leads one to speculate that if they only took it for a short time would it have an influence in GHBT results? Knowing the protective role gastric acidity has in regards to protecting the host against ingested pathogens, it is plausible that prolonged use of gastric acid suppressants contributes to the incidence of SIBO and that clinicians should be judicious in recommending their use. Antibiotics Antibiotic therapies not only target pathogenic microorganisms, but also the host-associated microbial communities in the gut. Most antibiotics have broad-spectrum activity so they can be used to treat many diseases. Thus, although antibiotics are designed to target pathogenic organisms, related members of the microbiota are also affected, leaving a lasting negative effect on the gut microbial community long after the antibiotics have ceased (141). Antibiotics can also promote the expansion of antibiotic-resistant strains which can act as a reservoir for resistance genes in the gut microenvironment (142). Decreased diversity in the microbiome typically follows antibiotic treatment, and even though most of the microbiota return to pretreatment levels, some members are lost from the community indefinitely (142). As microorganisms can be dependent upon other colonizers for the provision of nutrition, secondary metabolites or removal of toxic waste products, alterations in microbial co-dependence can leave detrimental effects (143). The antibiotic spectrum of activity will influence the shift in gut microbiota composition. Additionally, the administration dose of the antibiotic is also important in determining the ecological impact it will have on the microbiota. While the sub-therapeutic antibiotic dosing often used by the agriculture industry prophylactically and to promote animal growth does not reduce the total bacterial mass, this use is criticized as it shifts the composition of the microbiota and promotes dangerous levels of antibiotic resistance (144). Similarly in humans, antibiotic therapeutic doses are designed to minimize these effects, but despite these efforts, subsets of the microbiota can shift to that of increased colonization by opportunistic pathogens such as Clostridium difficile and Candida albicans. Noteworthy is that these effects of antibiotic delivery are not limited to oral delivery. Intravenously delivered antibiotics can have an effect on the gut microbiota as they become incorporated into bile and secreted into the intestine via the biliary system (144). Gut microbial community alterations can result in dysregulation of host immune homeostasis and an increased susceptibility to disease. Host-microbial interactions are very specific and antibiotic therapy causes alterations or loss of highly co-evolved processes (145, 146). Antibiotic-induced changes that are important to microbial regulation of host immunity include loss of bacterial ligands that are recognized by the host, loss of specific bacterial signals, and alterations in the metabolites produced by the microbiota such as short-chain fatty acids (147). Short-chain fatty acids (SCFA) are beneficial for gut health as they serve as a primary fuel source for the colonocyte, are involved with water and electrolyte absorption, help to maintain the intestinal barrier, and modulate cell proliferation, differentiation, growth and apoptosis (147). Provision of butyrate during broad-spectrum antibiotic therapy mitigated the negative effects of antibiotics on gut health, notably the mRNA and protein expression for several anion exchangers, butyrate receptor and transports as well as protein expression of intestinal tight junction proteins (148). Changes in gut immunity increase host susceptibility to infection by pathogens. For instance, treatment with metronidazole, an antibiotic that targets anaerobic bacteria, reduces the integrity of the mucus layer and accelerates mucosal attachment of C. rodentium (149). Changes in gut microbiota structure and function after antibiotic treatment create a metabolic environment that favors C. difficile germination and colonization and associated infectious diarrhea (150). While antibiotic therapy is the major risk factor for C. difficile colonization, the accepted treatment for C. difficile infection is further antibiotic therapy, initially with metronidazole and then vancomycin, if C. difficile persists (151). Repeated antibiotic use is often necessary in the treatment of recurrent Clostridium difficile infections which unfortunately causes further disruption of an imbalanced microbiota (152). Chang et al, identified that patients with recurrent C. difficile infection possessed a microbiota characterized by markedly reduced overall diversity compared to controls and to patients with an initial episode of the infection (152). C. difficile infection is debilitating to patients and extremely costly, with symptoms ranging from diarrhea to fulminant colitis, toxic megacolon and death (153). Fecal Microbiota Transplantation (FMT) is the process by which a homogenized stool sample from a healthy donor is administered into the GI tract of an individual. This therapy is now becoming a sought-out treatment to eradicate C. difficile colonization and correct gut dysbiosis. FMT has been shown to be a successful treatment option to eliminate recurrent and refractory C. difficile infection and to re-establish a healthy colony in certain patients (154). With its 91% primary and 98% secondary cure rates, FMT is gaining increased interest among researchers as a treatment option for other gastrointestinal disorders (154). Perspective and future directions With technological advances, knowledge regarding the gut microbiome has expanded from earlier beliefs (155, 156). The topics covered in this review are examples of what is currently understood regarding how the human gut microbiome is first established and how certain life encounters alter the composition, but they are by no means inclusive. The influence of the gut microbiome on health and disease is currently one of the most exciting areas of science. Learning more about how breaches upon the gut microbiome early in life coupled with further insults throughout life influences health may provide new insights for treatments of many challenging syndromes and diseases (e.g., fibromyalgia, irritable bowel disease, IBD, autism). We are just beginning to uncover the impact of how things we ingest can influence pathology. Future research should direct its focus to the gut microbiome as a biomarker for dietary intake and disease development, the effect of probiotic supplementation on clinical endpoints, and bacterial therapy for gut health, immunity and therapeutic treatments. New available and developing technologies to uncover the metabolon opens the path of exploration to this exciting frontier. The horizons are broad with exciting developments sure to come. Supplementary Material Copyright Click here to view.(14K, docx) Contributor Information Gail A. Cresci, Department of Gastroenterology/Hepatology, Cleveland Clinic, Cleveland, OH 44195, Ph: 216-445-8317, Fax: 216-444-9401. Emmy Bawden, Dietetic Intern, Cleveland Clinic, Cleveland, OH 44195. References 1. Lewis K. Platforms for antibiotic discovery. Nature Reviews. 2013;12:371–387. [PubMed] [Google Scholar] 2. Human Microbiome Project Consortium. A framework for human microbiome research. Nature. 2012;486:215–221. [PMC free article] [PubMed] [Google Scholar] 3. Human Microbiome Project Consortium. Structure, function and diversity of the healthy human microbiome. Nature. 2012;86:207–214. [PMC free article] [PubMed] [Google Scholar] 4. Backhed F, Ley RE, Sonnenburg JL, Peterson DA, Gordon JI. Host-bacterial mutualism in the human intestine. Nature. 2005;307:1915–1920. [PubMed] [Google Scholar] 5. Ding T, Schloss PD. Dynamics and associations of microbial community types across the human body. Nature. 2014;509(7500):357–60. [PMC free article] [PubMed] [Google Scholar] 6. Salazar N, Arboleya S, Valdés L, et al. The human intestinal microbiome at extreme ages of life. Frontiers in Genetics. 2014;5:1–9. [PMC free article] [PubMed] [Google Scholar] 7. DiGiulio DB. Diversity of microbes in amniotic fluid. Semin Fetal Neonatal Med. 2012;17:2–11. [PubMed] [Google Scholar] 8. Jiménez E, Fernándes L, Marín M, et al. Isolation of commensal bacteria from umbilical cord blood of healthy neonates born by cesarean section. Curr Microbiol. 2005;51:270–274. [PubMed] [Google Scholar] 9. Aagard K, Ma J, Antony K, et al. The placenta harbors a unique microbiome. Sci Transl Med. 2014;6:237–265. [Google Scholar] 10. Moles L, Gomez M, Heilig H, Bustos G, Fuentes S, de Vos W, Fernández L, Rodríguez JM, Jiménez E. Bacterial diversity in meconium of preterm neonates and evolution of their fecal microbiota during the first months of life. PLoS ONE. 2013;8:1–13. [PMC free article] [PubMed] [Google Scholar] 11. Jimenez E, Marín ML, Martín R, et al. Is meconium from healthy newborns actually sterile? Res Microbiol. 2008;159:187–193. [PubMed] [Google Scholar] 12. Alfaleh K, Anabrees J. Probiotics for prevention of necrotizing enterocolotis in preterm infants. The Cochrane Database Syst Rev. 2014;4:CD005496. [PubMed] [Google Scholar] 13. Athalye-Jape G, Deshpande G, Rao S, Patole S. Benefits of probiotics on enteral nutrition in preterm neonates: a systematic review. Am J Clin Nutr. 2014;100:1508–19. [PubMed] [Google Scholar] 14. Clemente JC, Ursell LK, Parfrey LW, et al. The impact of the gut microbiota on human health: An integrated view. Cell. 2012;148:1258–1270. [PMC free article] [PubMed] [Google Scholar] 15. Jakobsson HE, Abrahamsson TR, Jenmalm MC, et al. Decreased gut microbiota diversity, delayed Bacteriodetes colonisation and reduced Th1 responses in infants delivered by caesarean section. Gut. 2014;63:559–566. [PubMed] [Google Scholar] 16. Koenig JE, Spor A, Scalfone N, et al. Succession of microbial consortia in the developing infant gut microbiome. Proc Natl Acad Sci U S A. 2011;108(Suppl 1):4578–85. [PMC free article] [PubMed] [Google Scholar] 17. Pop M. We are what we eat: how the diet of infants affects their gut microbiome. Genome Biology. 2012;13:152. [PMC free article] [PubMed] [Google Scholar] 18. Palmer C, Bik EM, DiGiulio DB, Relman DA, Brown PO. Development of the human infant intestinal microbiota. PLoS Biol. 2007;5:e177. [PMC free article] [PubMed] [Google Scholar] 19. Morowitz MJ, Denef VJ, Costello EK, Thomas BC, Poroyko V, Relman DA, Banfield JF. Strain-resolved community genomic analysis of gut microbial colonization in a premature infant. Proc Natl Acad Sci U S A. 2011;108:1128–1133. [PMC free article] [PubMed] [Google Scholar] 20. Schwartz S, Friedberg I, Ivanov I, Davidson LA, Goldsby JS, Dahl DB, et al. A metagenomic study of diet-dependent interaction between gut microbiota and host in infants reveals differences in immune response. Genome Biology. 2012;13:r32. [PMC free article] [PubMed] [Google Scholar] 21. Le Huerou-Luron I, Blat S, Boudry G. Breast- v. formula-feeding: impacts on the digestive tract and immediate and long-term health effects. Nutr Res Rev. 2010;23:23–36. [PubMed] [Google Scholar] 22. Martín R, Jiménez E, Heilig H, Fernández L, Marín ML, Zoetendal EG, Rodríguez JM. Isolation of Bifidobacteria from breast milk and assessment of the bifidobacterial population by pcr-denaturing gradient gel electrophoresis and quantitative real-time pcr. Applied and Environmental Microbiology. 2009;75:965–969. [PMC free article] [PubMed] [Google Scholar] 23. German JB, Freeman SL, Lebrilla CB, Mills DA. Human Milk Oligosaccharides: Evolution, Structures and Bioselectivity as Substrates for Intestinal Bacteria. Nestle Nutr Workshop Ser Pediatr Program. 2008;62:205–222. [PMC free article] [PubMed] [Google Scholar] 24. Balmer SE, Wharton BA. Diet and faecal flora in the newborn: breast milk and infant formula. Arch Dis Child. 1989;64:1672–7. [PMC free article] [PubMed] [Google Scholar] 25. Fukuda S, Toh H, Hase K, et al. Bifidobacteria can protect from enteropathogenic infection through production of acetate. Nature. 2011;469:543–7. [PubMed] [Google Scholar] 26. Ouwehand A, Isolauri E, Salminen S. The role of the intestinal microflora for the development of the immune system in early childhood. Eur J Nutr. 2002;41(Suppl 1):I32– 7. [PubMed] [Google Scholar] 27. Stark PL, Lee A. The microbial ecology of the large bowel of breast-fed and formula-fed infants during the first year of life. J Med Microbiol. 1982;15:189–203. [PubMed] [Google Scholar] 28. Harmsen HK, Wildeboer-Veloo AC, Raangs GC, Wagendorp AA, Klijn N, Bindels JG, Welling GW. Analysis of intestinal flora development in breast-fed and formula-fed infants by using molecular identification and detection methods. J Pediatr Gastroenterol Nutr. 2000;30:61–7. [PubMed] [Google Scholar] 29. Stark PL, Lee A, Parsonage BD. Colonization of the large bowel by Clostridium difficile in healthy infants: quantitative study. Infect Immun. 1982;35:895–9. [PMC free article] [PubMed] [Google Scholar] 30. Marcobal A, Barboza M, Sonnenburg ED, et al. Bacteroides in the infant gut consume milk oligosaccharides via mucus-utilization pathways. Cell Host Microbe. 2011;10:507–14. [PMC free article] [PubMed] [Google Scholar] 31. Beereman-Wauters G, Staelens S, Van de Broek H, et al. Physiological and bifidogenic effects of prebiotic supplements in infant formulae. J Pediatr Gastroenterol Nutr. 2011;52:763–71. [PubMed] [Google Scholar] 32. Koenig JE, Spor A, Scalfone N, Fricker AD, Stombaugh J, Knight R, Angenent LT, Ley RE. Succession of microbial consortia in the developing infant gut microbiome. Proc Natl Acad Sci USA. 2011;108(Suppl 1):4578–4585. [PMC free article] [PubMed] [Google Scholar] 33. Salazar N, Arboleya S, Valdés L, et al. The human intestinal microbiome at extreme ages of life. Frontiers in Genetics. 2014;5:1–9. [PMC free article] [PubMed] [Google Scholar] 34. Claesson MJ, Cusack S, O’Sullivan O, Greene-Diniz R, de Weerd H, Flannery E, Marchesi JR, Falush D, Dinan T, Fitzgerald G, et al. Composition, variability, and temporal stability of the intestinal microbiota of the elderly. Proc Natl Acad Sci USA. 2011;108(Suppl 1):4586– 4591. [PMC f
|
|
Scooped by
Gilbert C FAURE
March 10, 2020 2:57 PM
|
|
|
Scooped by
Gilbert C FAURE
September 1, 2019 4:34 AM
|
Chronic rhinosinusitis (CRS) is defined as inflammation of the mucosal lining of the nasal cavity and paranasal sinuses that has been present for more than 3 months, causing characteristic symptoms such as nasal blockage, discharge, reduction or loss of smell sensation and facial pressure. It is a broad clinical description that encompasses several phenotypes, most often divided into CRS with polyps and CRS without polyps. CRS may be the endpoint of several different inflammatory pathways and may be secondary to specific conditions such as cystic fibrosis or fungal aetiology, but most often cannot be attributed to a single pathophysiological trigger. CRS places an enormous burden on both physicians and its sufferers. It is common among the general population, affecting approximately 11% of UK adults,1 and causes greater detriment to quality of life (QoL) than angina or chronic lower respiratory tract disease.2 Not only is it a QoL issue, patients with CRS frequently have comorbid asthma, and poorly controlled CRS is associated with more frequent asthma exacerbations and a need for hospitalisation. The socio-economic cost of CRS is significant with 57% of patients reporting absenteeism and 28% experiencing associated anxiety and depression.3 4 One per cent of all UK adults will visit their general practitioner (GP) with CRS symptoms each year and require an average of four appointments each year; despite this, one in three patients in primary care has poorly controlled symptoms.5 CRS that cannot be adequately managed in primary care may require referral to secondary care, and data from Hospital Episode Statistics show that in a single year there were approximately 120 000 outpatient consultations for CRS and 40 000 sinus operations performed in England and Wales.6 However, there remains considerable debate regarding optimum management strategies leading to wide variation in practice.7 Treatment evidence and guidelines The touchstone for treatment of CRS is The European Position Paper on Rhinosinusitis and Nasal Polyps published in 2012 (EPOS 2012).8 EPOS 2012 syntheses the best available evidence and expert opinion into easy to follow treatment flowcharts for both primary care physicians and ear, nose and throat specialists, but acknowledges the large gaps in high-quality trial data on which to base their guidance. In the intervening 7 years since EPOS was published, the International Consensus Statement on Allergy and Rhinology (ICAR)9 was agreed by a multinational working group who undertook a comprehensive overview of the literature. The working group graded the available evidence and used it as the basis for recommendations; where no evidence was available, no recommendation was made. ICAR is therefore an exhaustive insight into the current state of the science in CRS and an invaluable tool for the otolaryngology community; for primary care, however, the EPOS 2012 remains perhaps the more accessible guide. In addition, there have also been several Cochrane reviews10–16 of treatments available for CRS, and these reviews along with the international consensus guidelines have been used to synthesise a National Institute for Health and Care Excellence (NICE) clinical knowledge summary, most recently updated in 2018.17 Intranasal treatment The foundation of CRS treatment is regular use of intranasal saline irrigation and corticosteroids and this strategy finds unanimous favour among the guidelines mentioned above. The evidence is weak but consistent: a Cochrane systematic review studied the effects of saline irrigation in people with chronic sinusitis.12 This identified only two studies that could robustly be included—one which compared the effect of high volume hypertonic saline irrigation to placebo in patients with CRS both with and without polyps, and another which studied only patients with polyps and compared the use of nasal saline irrigation. This Cochrane review concluded that there was weak evidence from these trials to support the use of nasal saline irrigation. In addition, it is a low-cost treatment which with low risk of adverse events. For this reason, it is recommended for virtually all patients with CRS although in practice is usually used in combination with other therapies. Intranasal corticosteroids are similarly favoured by all expert guidelines. There is a greater number of trials on which to base this opinion. A Cochrane systematic review11 identified (search date August 2015) 18 randomised controlled trials which studied the use of intranasal steroids versus placebo in CRS. The majority of these studies included patients with nasal polyps. Regular intranasal corticosteroid use was reported to be superior to placebo in all reported symptoms, although there was no evidence to support an overall improvement in QoL. A further Cochrane review of the different formulations of intranasal corticosteroids and methods of delivery13 did not identify any single agent with convincing evidence of superiority; however, there is an advantage offered by the second-generation agents (eg, mometasone furoate, fluticasone propionate, fluticasone furoate) which have favourable pharmacokinetic characteristics that minimise systemic bioavailability (<1%) compared with older intranasal corticosteroids (eg, beclomethasone diproprionate, betamethasone). Oral corticosteroids Oral corticosteroids are commonly prescribed in the treatment of CRS although there is a distinct lack of evidence for their efficacy. The NICE Clinical Knowledge Summary (CKS) makes no reference to their use. A Cochrane review in 201616 identified no studies of their use in CRS without polyps, a fact which is also reflected in the ICAR guideline.9 Their use in patients with polyps is better established, with several studies demonstrating short-term efficacy of oral corticosteroids in improving CRS-related QoL scores. Treatment courses are short—a typical regime might be 30 mg per day of prednisolone for 2–3 weeks—and thus the risk of side effects such as adrenal suppression and loss of bone mass is minimal. However, there is a risk of side effects such as gastrointestinal disturbance and insomnia even with these short courses. Patients should also be warned of the risk of osteonecrosis—a risk which may occur at doses of steroid previously thought to be safe (lowest reported associated total dose 105 mg, median associated dose 981 mg).18 The benefit of oral corticosteroids typically last 3–6 months, and so are a reasonable choice for patients who have not improved on the first line of saline irrigation and topical corticosteroids. However, an evidence‐based risk analysis of oral corticosteroid use in CRS with polyps performed by Leung et al 19 demonstrated that risk exceeded benefit if used more frequently than once every 2 years. Oral corticosteroid use is therefore restricted to short, infrequent courses, and with full disclosure of the potential serious associated side effects for patients. Antibiotics Where there is consensus recommending the use of nasal douches and corticosteroids, there is controversy regarding the use of antibiotics. Antibiotics are one of the most commonly prescribed medicines for CRS: of the 1% of UK adults with CRS who visit their GP each year, 91% of them will receive an antibiotic prescription.20 They will often receive not just one but repeated courses of antibiotics.21 There is pressure on GPs to use antibiotics as a first-line treatment, as recently some Clinical Commissioning Groups have insisted on a 3-month trial of macrolide antibiotics prior to secondary care referral.22 With the exception of acute infective exacerbations, routine use of antibiotics is controversial for three main reasons: first; the lack of high-quality evidence to support their efficacy; second, the emerging threat of antibiotic resistance and third, the side effects which may accompany some of the most commonly used agents. In 2016, the ICAR guideline noted a paucity of evidence for antibiotic use9; however, on balance it recommended that patients with polyps should not be prescribed short courses of non-macrolide antibiotics, unless in the particular circumstances of suffering an acute exacerbation. No conclusions could be drawn on longer courses, or for patients without polyps. This echoes the findings of a Cochrane review of the use of antibiotics in CRS, which found very little evidence that non-macrolide antibiotics are effective in patients with CRS although only two studies were fit for inclusion in analysis.15 These recommendations guided the NICE CKS17 to make the recommendation to seek specialist advice before initiating long-term antibiotics in primary care. It is, however, recognised that there does remain a role for appropriate use of macrolide antibiotics in specific circumstances. In particular, there is growing interest in immune-modulating and anti-inflammatory effects of macrolides in chronic airway inflammatory disease, with low-dose long-term macrolides being prescribed for its effects on the immune response and not primarily as an anti-bacterial agent.23 The Cochrane review of 2016 noted that there was a moderate quality of evidence of a modest improvement in disease‐specific QoL in patients with CRS without nasal polyps receiving 3 months of a macrolide.15 However, this improvement was short-lived, as 3 months following the cessation of the antibiotics there was no measurable effect of treatment. Resistance Antibiotic resistance is considered one of the most significant threats to patients’ safety in Europe.24 Evaluating effectiveness of antibiotics and promoting appropriate usage is integral to the UK 5-year antimicrobial resistance strategy.25 Given the high prevalence of CRS and the variability in prescribing, overuse of inappropriate antibiotics may represent a public health danger through selective pressure on bacteria and resistance. In particular, macrolide resistance has been noted to have implications in infections secondary to Streptococcus pneumoniae (upper and lower respiratory tract infections) and Mycoplasma genitalium (sexually transmitted infections), leading to longer duration of illness and requirement for multiple antibiotic courses.26 Side effects Antibiotics are commonly associate with wide range of side effects ranging from the mild (rash, nausea, diarrhoea) to the life threatening (anaphylaxis). Specific to the use of macrolides are concerns about potential cardiovascular side effects.27 There have been a number of publications raising concerns about cardiac toxicity with erythromycin in patients with a prolonged QT interval.28 29 A 2016 study which looked at adverse outcomes associated with clarithromycin use found a significant association was found between clarithromycin use and cardiovascular mortality, where longer durations of clarithromycin use were associated with more cardiovascular events.29 By contrast, this association was not found with use of β-lactam antibiotics leading the authors to hypothesise that it was an effect specific to clarithromycin. This hypothesis was unintentionally tested by the lead investigators of the CLARICOR trial (Effect of Clarithromycin on Mortality and Morbidity in Patients With Ischemic Heart Disease) who had planned to measure the efficacy of a 2-week course of 500 mg clarithromycin two times per day to improve the clinical manifestations of stable coronary heart disease.30 The study was halted prematurely due to the finding of excess deaths in the intervention group: all-cause mortality was significantly higher in the group had taken clarithromycin, an effect which persisted for 10 years post-intervention. The use of clarithromycin in patients with known cardiovascular disease is therefore only undertaken with a significant degree of caution. Surgery Patients who are referred to secondary care who are considered to have tried and failed appropriate medical therapy – which is to say, a sufficient trial of nasal douching and topical steroids—are considered candidates for endoscopic sinus surgery (ESS).31 32 ESS is a loosely defined procedure and can range from very simple balloon expansion of the sinus openings, to extensive procedures that open every bony partition within the sinuses. The risks of surgery include epistaxis, breach of the skull base with resultant CSF leak or meningitis and injury to the intraorbital structures which may result in impaired vision. Insufficient evidence to define the role and extent of surgery contributes to a fivefold variation in UK intervention rates,33 with wide variation in surgical practice and very high rates of revision surgery.34 35 Such uncertainty resulted in inclusion of ESS in the NICE Database of Treatment Uncertainties.36 However, there can be no doubt that in appropriately selected patients, surgery offers significant and durable relief from symptoms. The largest UK study of CRS and its outcomes demonstrated that not only was there a significant improvement in patient-reported symptoms following ESS, but that patients who had surgery earlier in their disease course had a greater degree of improvement that lasted longer versus those who underwent delayed surgery.37 In addition to improving nasal symptoms, a systematic review demonstrated that ESS is associated with improved asthma control with significantly fewer attacks, hospitalisations, and a reduced requirement for medication use following sinus surgery in patients with comorbid CRS and asthma.38 Each of the international consensus guidelines referenced above recommends that patients who have tried a course of appropriate medical therapy but do not have control of their symptoms should be considered as a candidate for surgery.8 9 The path forwards In the last two decades, the majority of new treatments that have become available for CRS have in the main been refinements rather than revolutions—for example, new formulations of intranasal steroids or third-generation antihistamines. However, there are some genuinely new and exciting innovations which are on the cusp of integration to clinical practice. Monoclonal antibodies that bind to targets such as IgE, interleukin-4 (IL-4) and IL-5 were developed primarily as treatments for asthma, but clinical trials have demonstrated that several of these agents may also be effective in CRS with polyps.39 At present, they remain expensive and are limited to subsets of patients with difficult to treat asthma, but as prices fall in future and evidence for their efficacy accumulates then in future they may become available for the treatment of CRS. There have also been several promising avenues of research that may unlock further therapeutic targets, such as the role of the microbiome in sinus disease. However, as alluded to in the many international guidelines, there is a paucity of evidence for many of the treatments that are currently used in CRS before even considering new innovations. This has led to a redoubling of efforts in CRS research to produce high-quality evidence for commonly available treatments. Key to these efforts is the need to accurately define the endotypes of disease which will be studied in trials, as broad clinical phenotypes such as ‘polyps’ may encompass a wide range of underlying pathophysiology. Tightly defining the endotypes of disease for trial inclusion will permit robust examination of the response to treatment in each subgroup. Meta-analyses of CRS outcomes have been hampered by the broad clinical phenotypes, and using precise endotypes will enhance our ability to pool data from multiple trials; this will also be enabled by international consensus statements that define key criteria such appropriateness for ESS40 and standardised sets of outcome measures;41 and funding has been secured for one of the largest ever trials of interventions in CRS which will specifically examine the question of the efficacy of both macrolides and ESS (the MACRO trial42) in subgroups of patients defined by precise clinical and pathological parameters. At present, treatment of CRS exists in a time of genuine clinical equipoise where treatment is empirical and even international guidelines depend more heavily on expert opinion than robust scientific statements. Ongoing research endeavours aim to transform the treatment of CRS and usher in the era of precise, personalised medicine for these patients. Main messages Chronic rhinosinusitis (CRS) is a common disease in UK adults and causes significant detriment to life. The best evidence for effective treatment is for topical intranasal corticosteroids and saline irrigation. For patients who do not respond to this first-line treatment, there are many potential avenues for further treatment but there is controversy about which strategy is the most effective Current research questions Is it possible to identify specific endotypes of CRS to replace the broad clinical phenotypes that we currently base our treatment plans on? Are macrolide antibiotics an effective treatment in CRS? Is best medical treatment superior to surgery in the treatment of CRS? Key references Fokkens WJ, et al, European Position Paper on Rhinosinusitis and Nasal Polyps 2012. Rhinolgy 2012 3 p preceding table of contents, 1–298. Orlandi RR, et al, International Consensus Statement on Allergy and Rhinology: Rhinosinusitis. Int Forum Allergy Rhinol 2016. 6 Suppl 1: p. S22-209. NICE. Sinusitis. 2018; Available from: https://cks.nice.org.uk/sinusitis%23!scenario:1 Head K, et al, Systemic and topical antibiotics for chronic rhinosinusitis. Cochrane Database Syst Rev 2016. 4: p. CD011994 Hopkins C, et al, Long-term outcomes from the English national comparative audit of surgery for nasal polyposis and chronic rhinosinusitis. Laryngoscope 2009. 119 : p. 2459–65. Self-assessment questions Which of the following are typical symptoms of chronic rhinosinusitis? (a) Bleeding and crusting (b) Unilateral blood tinged discharge (c) Blockage, discharge, loss of sense of smell, facial pressure (d) Visual disturbance The first-line treatment for chronic rhinosinusitis (CRS) is oral steroids and antibiotics. True or false? A prolonged course of antibiotics (eg, up to 3 months) may occasionally be used in specific circumstances. What group of antibiotics has the best evidence to support their use for prolonged courses in CRS? (a) Penicillins (b) Macrolides (c) Aminoglycosides (d) Fluoroquinolones And what adverse effects should the patient be advised of with these long-term antibiotics? (a) Cardiac comorbidity (b) Osteonecrosis of the femoral head (c) Epistaxis (d) Infertility There is good evidence to support the superiority of surgical treatment of CRS compared with medical treatment. True or false? Answers Answer: (c) These are typical CRS symptoms. Bleeding and crusting should raise the possibility of vasculitis, septal perforations, or recreational cocaine use. Unilateral blood tinged discharge is a red flag sign that should prompt concerns of malignancy. Visual disturbance may be caused by rare complications of CRS, but is not at all typical. Answer: False. The first-line treatment for CRS should be topical steroids and saline irrigation. Answer: Macrolides. Answer: Cardiac comorbidity, particularly in patients with known heart disease. Osteonecrosis of the femoral head is a complication of oral steroids while topical steroids may cause epistaxis. Macrolides are not recognised to cause infertility but their use should be restricted during pregnancy. The Food and Drug Administration of USA recommend that if a macrolide must be used in pregnancy then azithromycin is category B (ie, safe in animal studies) while clarithromycin is category C (ie, shown to cause harm in animal studies). Answer: False. There are very few high-quality trials that compare medical treatment to surgery, and meta-analysis is made difficult by wide variability in study protocols. References ↵ Hastan D , Fokkens WJ , Bachert C , et al . Chronic rhinosinusitis in Europe--an underestimated disease. A GA²LEN study. Allergy 2011;66:1216–23.doi:10.1111/j.1398-9995.2011.02646.x ↵ Gliklich RE , Metson R . The health impact of chronic sinusitis in patients seeking otolaryngologic care. Otolaryngol Head Neck Surg 1995;113:104–9.doi:10.1016/S0194-5998(95)70152-4 ↵ Sahlstrand-Johnson P , Ohlsson B , Von Buchwald C , et al . A multi-centre study on quality of life and absenteeism in patients with CRS referred for endoscopic surgery. Rhinology 2011;49:420–8.doi:10.4193/Rhino11.101 OpenUrlPubMed ↵ Erskine SE , Hopkins C , Clark A , et al . Chronic rhinosinusitis and mood disturbance. Rhin 2017;55:113–9.doi:10.4193/Rhin16.111 OpenUrl ↵ Lange B , Holst R , Thilsing T , et al . Quality of life and associated factors in persons with chronic rhinosinusitis in the general population: a prospective questionnaire and clinical cross-sectional study. Clin Otolaryngol 2013;38:474–80.doi:10.1111/coa.12189 OpenUrlCrossRefPubMed ↵Hospital Episode Statistics Department of Health; 2013. ↵ Vennik J , Eyles C , Thomas M , et al . Management strategies for chronic rhinosinusitis: a qualitative study of GP and ENT specialist views of current practice in the UK. BMJ Open 2018;8:e022643.doi:10.1136/bmjopen-2018-022643 ↵ Fokkens WJ , Lund VJ , Mullol J , et al . EPOS 2012: European position paper on rhinosinusitis and nasal polyps 2012. A summary for otorhinolaryngologists. Rhinology 2012;50:1–12.doi:10.4193/Rhino50E2 OpenUrlCrossRefPubMed ↵ Orlandi RR , Kingdom TT , Hwang PH , et al . International Consensus Statement on Allergy and Rhinology: Rhinosinusitis. Int Forum Allergy Rhinol 2016;6 Suppl 1:S22–S209.doi:10.1002/alr.21695 OpenUrl ↵ Head K , Sharp S , Chong L-Y , et al . Topical and systemic antifungal therapy for chronic rhinosinusitis. Cochrane Database Syst Rev 2018;16.doi:10.1002/14651858.CD012453.pub2 ↵ Chong LY , Head K , Hopkins C , et al . Intranasal steroids versus placebo or no intervention for chronic rhinosinusitis. Cochrane Database Syst Rev 2016;115.doi:10.1002/14651858.CD011996.pub2 ↵ Chong LY , Head K , Hopkins C , et al . Saline irrigation for chronic rhinosinusitis. Cochrane Database Syst Rev 2016;67.doi:10.1002/14651858.CD011995.pub2 ↵ Chong LY , Head K , Hopkins C , et al . Different types of intranasal steroids for chronic rhinosinusitis. Cochrane Database Syst Rev 2016;25(Suppl 2).doi:10.1002/14651858.CD011993.pub2 ↵ Head K , Chong LY , Hopkins C , et al . Short-course oral steroids as an adjunct therapy for chronic rhinosinusitis. Cochrane Database Syst Rev 2016;27.doi:10.1002/14651858.CD011992.pub2 ↵ Head K , Chong LY , Piromchai P , et al . Systemic and topical antibiotics for chronic rhinosinusitis. Cochrane Database Syst Rev 2016;19.doi:10.1002/14651858.CD011994.pub2 ↵ Head K , Chong LY , Hopkins C , et al . Short-course oral steroids alone for chronic rhinosinusitis. Cochrane Database Syst Rev 2016;2.doi:10.1002/14651858.CD011991.pub2 ↵NICE. Sinusitis, 2018. Available: https://cks.nice.org.uk/sinusitis#!scenario:1 ↵ Kennedy P , Bassiouni A , Psaltis A , et al . Avascular necrosis after oral corticosteroids in otolaryngology: Case report and review of the literature. Allergy Rhinol 2016;7:50–4.doi:10.2500/ar.2016.7.0142 OpenUrl ↵ Leung RM , Dinnie K , Smith TL . When do the risks of repeated courses of corticosteroids exceed the risks of surgery? Int Forum Allergy Rhinol 2014;4:871–6.doi:10.1002/alr.21377 OpenUrl ↵ Gulliford MC , Dregan A , Moore MV , et al . Continued high rates of antibiotic prescribing to adults with respiratory tract infection: survey of 568 UK general practices. BMJ Open 2014;4:e006245.doi:10.1136/bmjopen-2014-006245 ↵ Akkerman AE , Kuyvenhoven MM , van der Wouden JC , et al . Prescribing antibiotics for respiratory tract infections by GPs: management and prescriber characteristics. Br J Gen Pract 2005;55:114–8. ↵ Soni-Jaiswal A , Philpott C , Hopkins C . The impact of commissioning for rhinosinusitis in England. Clin Otolaryngol 2015;40:639–45.doi:10.1111/coa.12430 OpenUrl ↵ Cervin A , Wallwork B . Macrolide therapy of chronic rhinosinusitis. Rhinology 2007;45:259–67. ↵ Lodato EM , Kaplan W . Priority Medicines for Europe and the World "A Public Health Approach to Innovation": Background Paper 6.1 Antimicrobial resistance World Health Organisation; 2013. ↵ Davies SC , Gibbens N . UK Five Year Antimicrobial Resistance Strategy 2013 to 2018 Department of Health and Department for Environment, Food & Rural Affairs; 2013. ↵ Gaynor M , Mankin AS . Macrolide antibiotics: binding site, mechanism of action, resistance. Curr Top Med Chem 2003;3:949–60.doi:10.2174/1568026033452159 ↵ Gibbins NE , Theokli C , Hopkins C . Time to reconsider guidelines on clarithromycin in chronic rhinosinusitis? BMJ 2013;346:f2678.doi:10.1136/bmj.f2678 ↵ Wong AYS , Chan EW , Anand S , et al . Managing Cardiovascular Risk of Macrolides: Systematic Review and Meta-Analysis. Drug Saf 2017;40:663–77.doi:10.1007/s40264-017-0533-2 OpenUrlCrossRef ↵ Cheng Y-J , Nie X-Y , Chen X-M , et al . The Role of Macrolide Antibiotics in Increasing Cardiovascular Risk. J Am Coll Cardiol 2015;66:2173–84.doi:10.1016/j.jacc.2015.09.029 OpenUrlFREE Full Text ↵ Winkel P , Hilden J , Hansen JF , et al . Clarithromycin for stable coronary heart disease increases all-cause and cardiovascular mortality and cerebrovascular morbidity over 10years in the CLARICOR randomised, blinded clinical trial. Int J Cardiol 2015;182:459–65.doi:10.1016/j.ijcard.2015.01.020 OpenUrl ↵ Baguley C , Brownlow A , Yeung K , et al . The fate of chronic rhinosinusitis sufferers after maximal medical therapy. Int Forum Allergy Rhinol 2014;4:525–32.doi:10.1002/alr.21315 OpenUrl ↵ Young LC , Stow NW , Zhou L , et al . Efficacy of medical therapy in treatment of chronic rhinosinusitis. Allergy Rhinol 2012;3:8–12.doi:10.2500/ar.2012.3.0027 OpenUrl ↵ Hopkins C . Commissioing Guide: Chronic Rhinosinusitis. Royal College of Surgeons of England London; 2016. ↵ Philpott C , Hopkins C , Erskine S , et al . The burden of revision sinonasal surgery in the UK-data from the Chronic Rhinosinusitis Epidemiology Study (CRES): a cross-sectional study. BMJ Open 2015;5:e006680.doi:10.1136/bmjopen-2014-006680 ↵ Hopkins C , Slack R , Lund V , et al . Long-term outcomes from the English national comparative audit of surgery for nasal polyposis and chronic rhinosinusitis. Laryngoscope 2009;119:2459–65.doi:10.1002/lary.20653 ↵NICE. Database of Uncertainties of Treatments. ↵ Hopkins C , Rimmer J , Lund VJ . Does time to endoscopic sinus surgery impact outcomes in Chronic Rhinosinusitis? Prospective findings from the National Comparative Audit of Surgery for Nasal Polyposis and Chronic Rhinosinusitis. Rhinology 2015;53:10–17.doi:10.4193/Rhin13.217 OpenUrl ↵ Vashishta R , Soler ZM , Nguyen SA , et al . A systematic review and meta-analysis of asthma outcomes following endoscopic sinus surgery for chronic rhinosinusitis. Int Forum Allergy Rhinol 2013;3:788–94.doi:10.1002/alr.21182 OpenUrlCrossRefPubMed ↵ Pauwels B , Jonstam K , Bachert C . Emerging biologics for the treatment of chronic rhinosinusitis. Expert Rev Clin Immunol 2015;11:349–61.doi:10.1586/1744666X.2015.1010517 OpenUrlCrossRefPubMed ↵ Rudmik L , Soler ZM , Hopkins C , et al . Defining appropriateness criteria for endoscopic sinus surgery during management of uncomplicated adult chronic rhinosinusitis: a RAND/UCLA appropriateness study. Int Forum Allergy Rhinol 2016;6:557–67.doi:10.1002/alr.21769 OpenUrl ↵ Hopkins C , Hettige R , Soni-Jaiswal A , et al . CHronic Rhinosinusitis Outcome MEasures (CHROME), developing a core outcome set for trials of interventions in chronic rhinosinusitis. Rhinology 2018;56:22–32.doi:10.4193/Rhin17.247 OpenUrl ↵ Philpott C , le Conte S , Beard D , et al . Clarithromycin and endoscopic sinus surgery for adults with chronic rhinosinusitis with and without nasal polyps: study protocol for the MACRO randomised controlled trial. Trials 2019;20:246.doi:10.1186/s13063-019-3314-7

|
Suggested by
Société Francaise d'Immunologie
June 16, 2019 5:45 AM
|
Abstract The understanding of the immune mechanisms of vitiligo has profoundly improved over the past years. The recent discovery of a new population of antigen‐experienced memory T cells called resident memory T cells (TRM) has changed the concept of immune surveillance in peripheral tissue as skin, and the presence of melanocyte‐specific TRM is clearly demonstrated in vitiligo, a disease that could be now seen such as a memory skin disease. This review summarizes the recent knowledge on skin TRM and their role in vitiligo. Future management or therapies for this disease will have the goal to block their migration/differentiation, to dampen their activation and/or their accumulation in the vitiligo skin to prevent flare‐up or to promote repigmentation. 1 INTRODUCTION Vitiligo is a complex disease that combines genetic predisposition, environmental triggers (eg, friction, chemicals) together with melanocyte intrinsic abnormalities, metabolism alteration, and deregulation of the inflammatory and immune response. Epidermal cells, including melanocytes, can release danger‐associated molecular patterns (DAMPs), as HSP70 for example, that will contribute to the activation of innate and adaptive resident immune cells.1-3 A T‐cell infiltrate is consistently found in vitiligo patients skin, in vicinity to melanocytes, and the involvement of T cells as well as cytokines produced by T cells, such as interferon (IFN)‐γ, tumor necrosis factor (TNF)‐α or interleukin (IL)‐17, in vitiligo pathogenesis has been emphasized by several studies ex vivo, in vitro, and in vivo.4 Over the past decade, a new population of antigen‐experienced memory T cells called resident memory T cells (TRM) has been described in tissues and has been involved in the development, maintenance and flares of chronic inflammatory disorders, such as psoriasis.5 This review aims to depict and expend our current knowledge on the potential role of TRM in vitiligo pathogenesis and during flare‐up of the disease. 2 VITILIGO: A SKIN MEMORY DISEASE 2.1 Defining TRM Under physiological conditions, TRM reside in epithelial barrier tissues, as skin, at the interface between the environment and the host. It has now been clearly demonstrated that TRM can respond rapidly to pathogen challenge, proliferate locally and produce high amounts of pro‐inflammatory cytokines, leading to rapid protective immunity that is the hallmark of adaptive immune memory.6 However, inadvertent activation of these TRM must be tightly controlled and we have previously shown that a skin resident population of regulatory T cells can locally proliferate and dampen skin TRM response.7 In addition, in patients predisposed to develop an autoimmune disease, these TRM can dysfunction and generate a dramatic local auto‐reactive responses leading to the emergence of skin immune diseases, such as vitiligo. The lack of recirculation is a characteristic feature of TRM. This T‐cell subset displays a memory phenotype, has a distinct transcriptional programme and expresses characteristic cell surface markers, as CD69, CD103, CD49a and CD44.8, 9 CD69, known to be a T‐cell activation marker, is the hallmark to define TRM in tissues and is involved in tissue retention, through downregulation of surface expression of sphingosine 1 phosphate receptor 1 (S1PR1), required for T‐cell egress from tissues.10, 11 CD103, aka αE integrin, is another TRM marker. In the skin, expression of CD103 rather defines CD69+ TRM found within the epidermis, likely because of the expression of its ligand E‐cadherin by epidermal cells, while CD69+ TRM lacking CD103 are mainly found in the dermis. Lastly, it was recently suggested CD49a, also known as α1 integrin, could define a subset of functional TRM that produces high levels of IFNγ together with cytotoxic molecules that is mainly localized in the epidermis.11 It is now clear that the microenvironment plays a crucial role during TRM formation and regulation. Indeed, expression of CD103 depends on transforming growth factor (TGF)‐β,12-15 and an increasing number of studies are reporting the involvement of several cytokines involved in T‐cell homeostasis (IL‐15) or inflammation (IL‐12, IL‐18, IL‐33, IFN‐β, TNFα) during TRM differentiation or regulation.16-19 In addition, chemokines/chemokine receptors signalling appears important to drive TRM into the appropriate tissue environment for their formation/maintenance, as shown for the chemokine receptors CXCR3 and CXCR6.17, 20, 21 TRM in the skin emerge from T‐cell precursors that lack effector cell marker KLRG1 in response to antigen challenge, as shown in vivo in mice following HSV infection for example.17 Furthermore, these cells can be repeatedly stimulated, accumulate overtime and remain in the skin to provide protection, as shown in mouse model of skin infection with vaccinia virus,22 showing that TRM can persist for a long period of time in the skin. In addition, TRM have the propensity to release inflammatory cytokines that promote an immune defense against recurrent infections. It could then be foreseen that TRM could also be harmful to our organism and be central players during chronic inflammatory disorders, as shown in psoriasis.5 Indeed, the development of psoriasis lesions from non‐lesional psoriasis skin grafted onto immunodeficient mice 23 highlighted the pivotal role of skin T resident cells to promote inflammation and their potential involvement during flares of the disease. 2.2 Translating TRM knowledge in vitiligo pathogenesis Several studies pointed out the involvement of T cells in vitiligo pathogenesis, and a CD8 T‐cell infiltrate is consistently found in vitiligo skin.4 Furthermore, after repigmentation, vitiligo lesions often recur on similar anomic sites, suggesting the involvement of TRM. We recently identified subsets of CD69+ CD103+ and CD69+ CD103‐ TRM that accumulate both in the epidermis and the dermis of perilesional skin of vitiligo patients with stable or active disease, CD103+ TRM being more abundant within the epidermis. Melanocyte‐specific TRM are characterized by the expression of CXCR3 and mount under activation high levels of the pro‐inflammatory cytokines TNFα and interferon IFNγ.24 TRM expressing CD49a were also observed both in the dermis and epidermis of vitiligo lesional skin and were characterized by production of IFNγ, perforin and granzyme B,11 notably when TRM cells were cultured in the presence of IL‐15, a cytokine that has been shown to be involved in TRM differentiation and maintenance. In line with the involvement of TRM in vitiligo, melanoma‐associated vitiligo supports TRM that can provide anti‐tumor immunity in vivo.25 Soluble factors produced by TRM will be further involved in melanocyte loss observed in vitiligo. Indeed, TNFα or IFNγ have been previously shown to inhibit melanocyte function, among other inflammatory cytokines.4 Regulatory T cells (Treg) dysfunction has also been previously reported in vitiligo skin and their replenishment could be of interest to limit depigmentation.23, 24 Interestingly, skin resident regulatory T cells have been shown to be critical for hair follicle stem cell regeneration.26 As hair follicles could represent an important melanocyte reservoir for epidermal melanocyte replenishment of depigmented lesions, it could be hypothesized that Treg cells could support melanocyte stem cells regeneration. Therefore, inhibition of Treg cells by TRM and pro‐inflammatory cytokines produced (such as IFNγ and TNFα) could have an indirect effect on the inhibition of melanocyte regeneration. As shown in models of murine skin infections, TRM remain in skin tissue long after clearance of the pathogens. These sequences of events can play out again and again over the lifetime of a human being, and the consequence is the accumulation of diverse TRM cell populations in skin. Therefore, it could be hypothesized that similar mechanisms could be seen in the context of auto‐immunity such as vitiligo. Indeed, increased oxidative stress, characterizing the disease, could lead to apoptosis of epidermal cells (keratinocytes and/or melanocytes) and subsequently to the release of self‐antigens that could induce in a predisposed patient response of the immune system with accumulation overtime of melanocytes specific TRM cells (Figure 1). Accumulation of TRM in perilesional skin of patients with stable disease24 emphasize this concept and their involvement during reactivation of the disease. This could occur during repetitive flares up of the disease, leading to the recruitment of new populations of skin TRM not only at site of the flare‐up but all over the rest of the body. 3 LOOKING FOR EARLY INTERVENTION IN VITILIGO These recent findings regarding the role of skin TRM in the mechanism of vitiligo suggest the need to better target this memory T‐cell subset in order to prevent the depigmentation and maybe provide insights to allow regeneration of melanocytes. Different strategies could be discussed: 1/ to prevent their generation/differentiation into the skin by targeting the cytokines important for their development/survival, 2/ to prevent their accumulation overtime occurring during repetitive flare‐up of the disease and 3/ to dampen their activation through the use of immunomodulating agents. 3.1 To prevent skin TRM differentiation and maintenance in the skin in vitiligo As already discussed, despite not being completely understood, the molecular factors IL‐15, TGF‐β, TNF‐α and IL‐33 have been implicated for TRM generation/maintenance in peripheral tissues as skin.6, 9 TGF‐β, TNF‐α and IL‐33 have all been shown to have a role in the induction of CD103 expression and acquisition of a TRM cell phenotype. Factors that induce upregulation of CD69 expression include TNF‐α and type I interferons.27 As an example, strategies targeting IL‐15 could be promising to inhibit the generation of TRM; however, it is still unknown whether a targeted antibody can efficiently deplete TRM cells located into the skin, as recently shown with the use of an antibody directed against CD122, the β subunit of the IL‐15 receptor expressed on TRM cells.28 However, human data are still lacking to confirm these results obtained in a mouse model of depigmentation. Another strategy will be the use of small molecules as inhibitor of JAK3, blocking the IL‐15 signalling pathway.29 Finally, it was recently demonstrated that TRM survival is dependent on exogenous fatty acids uptake and metabolism, suggesting that modulating the lipid metabolic programme could better lead to TRM elimination from peripheral tissues to treat chronic inflammatory disorders.30, 31 3.2 To prevent skin TRM accumulation overtime in vitiligo As previously discussed, TRM could accumulate into the skin after repetitive flare‐up of the disease.22 Therefore, vitiligo could be seen as an emergency disease needing an early intervention during the initiation of the disease to prevent this inadvertent accumulation of resident T cells. This is a goal to reach in order to prevent depigmentation or to induce the capacity of melanocyte regeneration. Therefore, a maintenance therapy remains important to consider in vitiligo management to prevent new episodes of flare‐up as well as accumulation of TRM cells. In this line, it has been clearly demonstrated that the use of topical calcineurin inhibitors as a maintenance therapy twice a week, in patients with repigmented lesions, can reduce the recurrences of previously repigmented vitiligo lesions.32 These results are consistent with the potential role of the maintenance therapy to dampen the local activation/proliferation of skin resident TRM important for flare‐up of the disease. However, application of topical treatments as a maintenance therapy could be possible for patients with a limited number of lesions and low body surface area involved or for specific affected sites, as head and neck. Therefore, systemic immunomodulating agents could be another strategy for patients with higher body surface area involved for whom topical therapies remain difficult to apply or in case of very progressive disease to avoid rapid spreading of the depigmentation. To date, only mini‐pulse of systemic steroids is being used for the management of vitiligo, mainly for patients with progressive disease.33 The duration of the systemic steroids used is often limited (around 3 months) because of the potential side effects due to the long‐term use of systemic steroids. Steroid‐sparing immunomodulating agents that could be used for mid and/or long‐term period, such as methotrexate or JAK inhibitors, have to be considered in the future, to avoid steroid systemic side effects. 3.3 To dampen skin TRM activation/proliferation through the use of immunomodulating agents Removing TRM cell subsets from peripheral tissues such as skin remains to be clearly demonstrated. However, as mentioned above, immunomodulating agents could at least dampen their activation, proliferation and accumulation into the skin. Local immunomodulating agents (eg, topical steroids, topical calcineurin inhibitors or topical JAK inhibitors) should be used for patients with limited body surface area involved (as face and neck). Systemic agents would be rather efficient for patients with high body surface area involved (over 10%). In line with the discussion made before, it could be reasonable to decide starting immunomodulating agents quickly during the initiation of the disease or during disease flare‐up. Therefore, it could be important to start the treatment as early as possible during the first initiation of the disease or during a recent flare‐up in patients with active disease. Of course, compared to other chronic inflammatory skin disorders such as psoriasis or atopic dermatitis, immunomodulating agents alone might be sufficient to dampen skin inflammation but not to induce repigmentation. Indeed, UV‐light therapies inducing melanocyte activation and differentiation together with modulation of the immune response should be always considered to achieve repigmentation.34 As an example, in our department seven vitiligo patients initiated a treatment with methotrexate (15 mg/wk) that was first indicated for another chronic inflammatory condition associated with vitiligo (Table 1). UVB‐light therapy was systematically associated with methotrexate (Figure 2). As shown in Figure 2, patients with a progressive disease at time of the initiation of the combination therapy presented greater efficacy in terms of body surface area involved and spreading of the disease after 6 months of treatment compared to patients with stable disease who showed no or limited response. These results provide incentive to test the efficacy and tolerance of the association of methotrexate and phototherapy vs phototherapy in adults with progressive vitiligo during a randomized double‐blind prospective study that will start in 2019. This study will include patients with a progressive vitiligo involving more than 10% of the body surface area characterized by the presence of new patches or extension of old lesions during the last 6 months and the presence of hypochromic aspect and/or perifollicular hypopigmentation under Wood's lamp examination.35, 36 We believe that these criteria should be applied for studies evaluating the use of systemic immunomodulating agents associated with UV‐light in vitiligo in the future to maximize the chance of dampening skin inflammation and to allow rapid repigmentation. Vitiligo Stable Active (n = 3) (n = 4) Sex (n) Male 2 0 Female 1 4 Age (mean) 47.6 48 Duration of the disease (mean, y) 13 12 Type of vitiligo (n) Acrofacial 1 0 Generalized 2 4 Concomitant autoimmune disease (n) Autoimmune thyroiditis 0 1 Alopecia areata 1 0 Psoriasis 2 2 Rheumatoid arthritis 0 2 Body surface area (%, mean) 6.6 22 In conclusion, vitiligo should be viewed as a skin memory disorder with a likely prominent role of TRM during disease development and flare‐up, and targeting these cells as early as possible during disease initiation, appears an attractive therapeutic strategy for patients. CONFLICT OF INTEREST The authors have declared no conflicting interests. REFERENCES Citing Literature
|
|
Suggested by
Société Francaise d'Immunologie
May 24, 2019 3:49 AM
|
Abstract The high mortality rate of cholangiocarcinoma (CCA) is due, in part, to the lack of non‐invasive approaches able to accurately detect this silent tumour at early stages, when therapeutic options can be potentially curative or may at least increase the overall survival of patients. The fact that the majority of CCA tumours are not linked to any known aetiological factor highly compromises the monitoring of patients at risk for tumour development and also their early diagnosis. Combination of clinical/biochemical features, imaging techniques and analysis of non‐specific tumour biomarkers in serum are commonly used to help in the diagnosis of CCA, but tumour biopsy is usually required to confirm the diagnosis. Moreover, no prognostic biomarkers are currently used in the clinical setting, deserving more innovative research, and international validation and consensus. Important efforts have been made in the last few years to identify accurate non‐invasive biomarkers, by using innovative techniques and high‐throughput omics technologies. This review summarizes and discusses the advances in the investigation of novel diagnostic and prognostic biomarkers in CCA and envisions the future directions in this field of research. Abbreviations Abbreviations AUC area under the ROC curve CA19‐9 carbohydrate antigen 19‐9 CCA cholangiocarcinoma CEA carcinoembryonic antigen cfDNA cell‐free DNA cfRNA cell‐free RNA CTCs circulating tumour cells dCCA distal cholangiocarcinoma eCCA extrahepatic cholangiocarcinoma EVs extracellular vesicles HCC hepatocellular carcinoma iCCA intrahepatic cholangiocarcinoma IL‐6 interleukin 6 lncRNA long non‐coding RNAs miR microRNA pCCA perihilar cholangiocarcinoma PSC primary sclerosing cholangitis Key Points Currently available diagnostic biomarkers for CCA are inaccurate. Potential new biomarkers in liquid biopsies may include nucleic acids, proteins and metabolites, extracellular vesicles and circulating tumour cells. New omics technologies facilitate the profiling and analysis of disease‐specific signatures and are powerful sources of biomarkers. Novel promising biomarkers for the diagnosis of CCA need to be validated in large international cohorts of patients, including appropriate control groups of individuals/patients. 1 INTRODUCTION Cholangiocarcinoma (CCA) comprises a highly aggressive and heterogeneous group of biliary malignancies that can originate at any site of the biliary tree, and account for ~15% of all primary liver cancers.1 Its incidence is increasing worldwide and currently represents ~2% of all cancer‐related deaths per year. According to the anatomical localization, CCAs are classified into intrahepatic (iCCA), perihilar (pCCA) and distal (dCCA).1 The aetiology of the majority (~80%) of CCAs is unknown, but there are several risk factors that may predispose to its development, including age, obesity, diabetes, inflammatory liver diseases (primary sclerosing cholangitis [PSC], hepatolithiasis, cirrhosis), infectious agents (Opisthorchis viverrini, Clonorchis sinensis, hepatitis B [HBV], hepatitis C [HCV], human immunodeficiency virus [HIV]), drugs/toxins (alcohol, smoking, thorotrast, nitrosamines, asbestos, oral contraceptive pills, etc), and congenital disorders (choledochal cysts, Caroli disease, congenital hepatic fibrosis).1 The diagnosis of CCA is usually made throug a combination of clinical, biochemical, radiological and histological information. Different imaging techniques may be used for the diagnosis of each CCA subtype: ultrasound (US), computed tomography (CT), magnetic resonance imaging/magnetic resonance cholangiopancreatography (MRI/MRCP) and positron emission tomography (PET) for iCCA, MRCP for pCCA and dCCA, percutaneous transhepatic cholangiography for pCCA, and endoscopic retrograde cholangiopancreatography or endoscopic ultrasound for dCCA.2 Histological analysis is mandatory to confirm the diagnosis and can provide valuable information for the clinical management of patients,3 but it is not always recommended due to the location of the tumours and the risk of peritoneal seeding. Moreover, the serum levels of non‐specific tumour biomarkers, such as carbohydrate antigen 19‐9 (CA19‐9), are currently measured to help in the diagnosis of CCA, but these are unreliable due to their low sensitivity and specificity, particularly in early stages of the disease.4 As such, most patients with CCA are diagnosed late, when the disease is in an advanced stage, and when therapeutic options are reduced, resulting in dismal prognosis. However, in the small proportion of patients in which tumours are detected in early stages (~35%), surgical resection of the tumour or liver transplantation (in cirrhotic livers) can be potentially curative or, at least, significantly increase the overall survival of patients.1 Therefore, there is an urgent need to identify accurate non‐invasive biomarkers for the diagnosis of these tumours, and thus increase the number of potential resectable cases. In recent years, new innovative studies have been conducted in the quest for accurate biomarkers for the early diagnosis of CCA and also to predict prognosis, risk of relapse after surgery, and select the best therapeutic regimen(s) for patients. These strategies involve “omics” approaches in blood, bile, urine, extracellular vesicles (EVs) and tissues, and have resulted in promising candidates that can change the current paradigm. 2 Non‐INVASIVE BIOMARKERS 2.1 Circulating nucleic acids Circulating nucleic acids can be found in most biofluids and comprise fragments of genomic DNA (cell‐free DNA [cfDNA]) and RNA (cfRNA; typically microRNAs [miRs], but also long non‐coding RNAs [lncRNAs]). Whether actively exported or originated from dying cells, circulating nucleic acids embody potential diagnostic and/or prognostic tools for human disease, including CCA.4-7 2.1.1 Cell‐free DNA cfDNA was first shown to reflect changes in cancer aggressiveness and tumour size in the late 70’s,8 highlighting its potential as a diagnostic and/or prognostic biomarker. The ability to screen for mutations in cfDNA is particularly appealing when compared to the primary tumour, as it more accurately reflects the overall mutational pattern of these heterogeneous tumours. This concept was recently validated in CCA; plasma samples from CCA patients with known tumour genomic background were screened for 31 oncogenic mutations in KRAS, NRAS, BRAF and PIK3CA genes by multiplex digital PCR.9 For each patient, the exact mutations in the tumour were also found in the plasma. Of note, the cfDNA from patients with CCA tumours, but wild type for the 31 studied mutations, was used as negative control and strongly supported the data. These results suggest that the use of cfDNA screening in patients with CCA may be helpful in order to determine the mutational characteristics of the primary tumours and to guide potential mutation‐based therapeutic interventions. In this regard, an integrative genomic characterization of cfDNA, primary tumours, and metastases of iCCA patients with FGFR2 mutations and with acquired resistance to BGJ398, a pan‐FGFR inhibitor, revealed de novo point mutations in the FGFR2 kinase domain that were detected in cfDNA.10 Despite the small sample size, given that FGFR2 mutations are found exclusively in iCCA and account for ~10% of the diagnosed cases,11 screening for these alterations in cfDNA may represent an important approach to guide clinical decisions. 2.1.2 Cell‐free non‐coding RNA Throughout the last decade, cfRNAs, particularly miRs, have been envisioned as promising disease biomarkers due to their abundance and stability in biofluids. In comparison to other putative biomarkers, such as proteins or metabolites, miRs are less resistant to degradation and/or modification and can be easily detected and amplified. In the context of CCA, few studies have investigated the circulating miR profiles in patients (Figure 1), but two meta‐analyses have suggested their overall potential diagnostic value.12, 13 Data analysis on both meta‐analyses pinpointed miRs as promising tools for CCA diagnosis, with pooled sensitivities of 0.83 and 0.76, and specificities of 0.79 and 0.91 respectively. In both studies, pooled area under the ROC curve (AUC) was ~0.9. Further, bile was the biological fluid showcasing the highest diagnostic efficiency (AUC of 0.95), followed by serum (0.913), tissue (0.846) and urine (0.745).12 Circulating miR‐21 is one of the most well‐characterized miRs in terms of its potential as a biomarker for CCA. Increased serum and plasma levels of miR‐21 were already shown to allow for the differential diagnosis between patients with iCCA and healthy controls,5 with an AUC of 0.91 in serum and 0.94 in plasma.14 More recently, serum miR‐21 levels were also found to positively correlate with tumour stage (TNM criteria) and poor survival. Indeed, miR‐21 serum levels decreased after tumour resection, highlighting the value of circulating miR‐21, not only as a diagnostic tool, but also as a putative prognostic biomarker.15 However, the levels of this miR, considered an onco‐miR,16 are also found elevated in serum of patients with hepatocellular carcinoma (HCC)17-20 and other cancers,21-24 probably limiting its specificity to discriminate between tumours, particularly primary liver tumours. Serum miR‐26a levels are also increased in patients with CCA and, similarly to miR‐21, they positively correlate with clinical stage, metastasis, tumour differentiation status and poor survival. In terms of its diagnostic value, serum miR‐26a yielded an AUC value of 0.90 (sensitivity: 84.8%; specificity: 81.8%) in distinguishing CCA from healthy controls.5 Decreased serum levels of miR‐106a in CCA patients appear to also act as a predictor of poor prognosis, while signalling a higher likelihood of lymph node metastasis.25 miR‐150 represents another potential CCA diagnostic biomarker, although apparently contradictory results have been published. A microarray study using plasma from patients with CCA reported reduced miR‐150 levels in CCA compared with healthy individuals and patients with PSC.26 In contrast, a different study highlighted miR‐150 as being upregulated in iCCA compared with controls without cancer (AUC: 0.764; sensitivity: 80.6%; specificity: 58.1%).5 Of note, the above study also showed that the combination of miR‐150 with CA19‐9 improved the diagnostic accuracy of both biomarkers. Indeed, it is now apparent that merging different miRs into a panel of biomarkers can offer greater sensitivity and specificity. For instance, an miR profile of eight plasma miRs (483‐5p, 505‐3p, 874, 885‐5p, 320b, 92b‐3p, 1275, 1307‐3p) was shown to associate with iCCA, regardless of the degree of tumour differentiation.27 The levels of miR‐192 were also shown to be increased in serum from patients with O viverrini‐related CCA compared with healthy controls (AUC: 0.803; sensitivity: 74%; specificity: 71%), positively correlating with lymph node metastasis and poor survival.28 Of note, in this study, the authors also reported increased serum levels of both miR‐21 and miR‐150, further supporting their potential diagnostic value, while miR‐26a was found downregulated, conflicting with previous data and thus rising some questions regarding its diagnostic accuracy for all forms of the disease. Since PSC is a well‐established risk factor for CCA development, some studies have evaluated and compared the serum miR profile between patients with isolated PSC and those with PSC‐derived CCA. For instance, increased serum levels of miR‐222 (AUC: 0.71) and miR‐483‐5p (AUC: 0.70) were found in CCA patients compared with PSC patients. The combination of both miRs increased the AUC to 0.77, suggesting that they could help in the monitoring of PSC patients for early CCA detection.29 In another study, a panel composed of five serum miRs (26a, 30b, 122, 126 and 1281) was markedly different in patients with CCA compared with PSC patients,30 further underlining their potential diagnostic value. Nevertheless, it is worth mentioning that these studies did not specifically include CCA patients with a PSC background, which would be of great importance in order to find accurate diagnostic biomarkers for PSC patients who might be at risk for CCA development. Cholangiocytes have a pivotal role in bile formation, regulation and transport. In turn, circulating bile miRs may also embody a key diagnostic and/or prognostic value in CCA. miRs have already been profiled in bile samples from patients with CCA through high‐throughput PCR miRNA microarray, with miR‐9 being highlighted as a potential diagnostic biomarker (AUC: 0.98; sensitivity: 88.9%; specificity: 100%).31 Furthermore, the levels of miR‐150‐5p were found lower in bile from patients with CCA compared with healthy individuals.26 On the other hand, the levels of miR‐412, −640, −1537 and −3189 were found increased in bile from patients with PSC‐derived CCA compared to those with isolated PSC, allowing the differential diagnosis of these two diseases with an AUC value of ~0.8. Of note, combination of miR‐1537 with CA19‐9 provided a higher diagnostic value when compared solely with CA19‐9.30 Some studies have also explored the potential of urinary miRs as biomarkers for CCA (Figure 1). For instance, urinary levels of miR‐192 and miR‐21 have been found markedly increased in patients with O viverrini‐related CCA compared with healthy individuals, and the combination of these two miRs increased its diagnostic value, when comparing with each one used alone (AUC: 0.85; sensitivity: 81.8%; specificity: 71.4%).32 Overall, since most data on circulating nucleic acids as diagnostic and prognostic biomarkers in CCA have resulted from proof‐of‐concept studies, larger and international evaluations are eagerly awaited to validate their potential clinical value. 2.2 Cytokines/proteins CA19‐9 and carcinoembryonic antigen (CEA) are the most widely clinically used biomarkers to help in the diagnosis and/or monitoring of CCA, but there are large differences in sensitivity and specificity among the different published studies,33-35 limiting their diagnostic and prognostic value. For CA19‐9, the most recent data resulting from a large meta‐analysis described a pooled sensitivity and specificity of 72% and 84%, respectively, regarding the distinction between CCA and healthy controls or patients with benign biliary disease.36 Similarly, the diagnostic sensitivity and specificity of CEA range from 42% to 85% and 70% to 89%37-39 respectively. Increased serum levels of CEA and CA19‐9 have been proposed as an indicator of reduced overall survival in resectable or inoperable CCAs.39 However, while an important number of studies describe CEA and CA19‐9 as independent prognostic markers,39-41 prognostic cut‐off values vary significantly between reports and large meta‐analyses are still lacking. Nonetheless, when elevated in CCA, CA19‐9 was further suggested as biomarker to monitor response to chemotherapy and predict outcome in CCA patients.42 Other promising circulating diagnostic and prognostic biomarkers (Table 1) include cytokeratin‐19 fragment (CYFRA 21‐1), matrix metalloproteinase‐7 (MMP‐7) and osteopontin. CYFRA 21‐1 is elevated in patients with iCCA compared to patients with benign biliary diseases (sensitivity: 75.6%; specificity: 96.2%), presenting superior diagnostic values than CA19‐9 and CEA.43 In addition, serum levels of CYFRA 21‐1 correlate with disease stage, and represent an independent predictor of impaired relapse‐free and overall survival.43, 44 MMP‐7 serum levels are also elevated in patients with CCA compared to patients with benign biliary (sensitivity: 75%; specificity: 78%),45, 46 but its prognostic relevance is still unclear. Circulating osteopontin, a secreted glycol phosphoprotein, is also elevated in CCA patients compared to healthy controls or patients with PSC. It is important to note that high pre‐ and post‐operative osteopontin levels were associated with reduced overall survival after tumour resection.47 Protein/Cytokine Source Levels Comparison SEN (%) SPE (%) AUC Reference MMP7 Serum Up CCA (n = 44) vs benign biliary tract disease (n = 36) 75 78 0.730 46 Osteopontin Serum Up CCA (n = 80) vs healthy controls (n = 42) 88 100 0.964 47 IL‐6 Serum Up CCA (n = 26) vs healthy controls (n = 23) 73 92 0.875 49 S100A6 Serum Up CCA (n = 29) vs healthy controls (n = 22) 86 91 0.909 50 DKK1 Serum Up iCCA (n = 37) vs healthy controls (n = 50) 76 100 0.872 51 SSP411 Serum Up CCA (n = 35) vs “cholangitis (n = 13) and healthy controls (n = 23)” 90 83 0.913 53 SEN, sensitivity; SPE, specificity. Circulating cytokines have also been proposed as diagnostic and prognostic biomarkers in CCA patients. The pro‐inflammatory cytokine interleukin 6 (IL‐6), secreted by CCA cells48 is found elevated in serum of patients with CCA compared to healthy individuals (sensitivity: 73%; specificity: 92%), and was further proposed as marker for therapy monitoring.49 Other potential biomarker candidates reported to diagnose CCA are S100A6,50 DKK1,51 KL‐6‐Mucin52 and SSP411.53 However, larger studies are warranted to investigate/confirm their diagnostic and/or prognostic relevance in CCA. 2.3 Metabolites Metabolomics or metabolic profiling, defined as the analysis of low molecular weight metabolites (<1500 Da) in biological samples, is a promising approach for the identification of potential biomarkers useful in the diagnosis and prognosis of different diseases, including different types of cancers, like CCA.4 Due to the large number of molecules present in biological specimens, powerful bioinformatic tools for data mining and visualization are used to present the results in a comprehensive way (Figure 2). Cancer cells present profound alterations in their metabolism,54 which represent an opportunity for diagnosis and monitoring. The analysis of the metabolome in body fluids (blood/serum/plasma, bile or urine) is emerging as a new diagnostic strategy in cancer, since changes in metabolites may reflect, at least partly, what is happening in tumour cells. However, the identification of specific metabolites is a challenging goal due to the presence of many confounding factors, including age, gender, diet, underlying liver diseases, concomitant diseases, drugs and others. To date, only a reduced number of studies have investigated the usefulness of metabolites in body fluids in the diagnosis of CCA. In bile, the analysis of bile acid concentration and composition in patients with biliary tract cancer (iCCA, pCCA or extrahepatic CCA [eCCA]), biliary tract stones and healthy controls showed a reduction in the proportion of secondary bile acids in patients with CCA compared with those with biliary tract stones and healthy individuals.55 This finding was associated with an alteration of bile acid transport that could explain the exposure of the bile duct epithelium to cocarcinogenic bile acids.56 Another study analysed bile compounds in patients with CCA, PSC and benign biliary diseases and showed that changes in phosphatidylcholines, bile acids and lipids were able to discriminate CCA from other conditions (sensitivity: 88.9%; specificity: 78.1%).57 The analysis of metabolites in bile of patients with CCA, HCC, non‐malignant liver diseases and healthy individuals58 showed a decrease in glycine‐ and taurine‐conjugated bile acids, phospholipids and cholesterol in patients with CCA compared to control groups and, to a certain extent, also to HCC patients. In contrast, another study that analysed the metabolites in bile of patients with inoperable pCCA or dCCA and non‐malignant biliary diseases without cholestasis, including PSC, found increased levels of glycine‐conjugated bile acids and phosphatidylcholines in patients with CCA, and constructed models that were able to discriminate CCA patients from those with non‐malignant biliary diseases (sensitivity: 80%; specificity: 95%).59 From all these studies, bile acid species60 are positioned as some of the metabolites with potential as biomarkers. However, future studies should confirm in larger and international cohorts of patients the usefulness of the determination of bile acids and phospholipids in bile for the diagnosis of biliary tumours. Other studies have demonstrated that the analysis of metabolites in serum could help in the diagnosis of CCA. Serum analysis in two independent Chinese cohorts of patients with CCA identified several metabolites useful in the early diagnosis of this tumour, as well as to distinguish iCCA from eCCA. In particular, an increase in serum 21‐deoxycortisol and bilirubin levels and a decrease of lysophosphatidylcholines LPC(14:0) and LPC(15:0) levels were found in patients with CCA compared with healthy individuals.61 Moreover, the combination of the four candidate biomarkers was useful for distinguishing CCA from healthy controls with high accuracy (99%). A recent study analysing the metabolomics profile in biopsy‐proven patients with iCCA, HCC, PSC and healthy individuals has demonstrated that specific changes in serum concentrations of certain metabolites can help in the early and differential diagnosis of these diseases. Several metabolites presented higher diagnostic values for iCCA vs the other groups under study, with superior AUC than that found for CA19‐9.62 An algorithm combining six metabolites; three sphingomyelins (SMs), two phosphatidylcholines (PCs) and one ceramide (Cer) – SM(42:3), SM(43:2), PC(O‐16:0/20:3), PC(O‐18:0/18:2), SM(d18:2/16:0) and Cer(d18:1/16:0) – accurately differentiated iCCA from HCC (AUC: 0.9; sensitivity: 80%; specificity: 90%). Another algorithm that combined PC(34:3) and histidine accurately differentiated PSC from iCCA (AUC: 0.990; sensitivity: 100%; specificity: 70%). These interesting data, however, should be confirmed in patients with CCA arising from PSC. Remarkably, all of these results were successfully validated in another independent cohort of patients. An integrated analysis of the transcriptome and metabolome in surgically resected tumour tissue of patients with iCCA and HCC showed specific profiles of genes and metabolites that could be useful in the diagnosis of iCCA.63 In addition, the integration of genomics, transcriptomics and metabolomics in tumour tissue has also been proposed for the stratification of molecular subtypes of iCCA and HCC with similar prognosis.64 2.4 Extracellular vesicles In terms of minimally invasive biomarkers, EVs became of particular interest during the last few years. EVs can be found in all body fluids including blood,65 saliva,66 urine67 and bile.68 Commonly, EVs include two main subclasses that can be differentiated according to their size and biogenesis.69 According to the generally accepted nomenclature, larger EVs (also called microvesicles [MVs]) roughly range from 100 to 1000 nm in size and directly bud from the plasma membrane of their parental cell, whereas small EVs (also called exosomes) are considerably smaller (below 100 nm) and originate from accumulated intraluminal vesicles within the endomembranous system, forming so‐called multivesicular bodies (MVBs). The fusion of the MVBs with the plasma membrane results in the release of exosomes into the extracellular space.70, 71 EVs contain a variety of biomolecules including lipids, nucleic acids and proteins/antigens, and act as physiological mediators of cell communication.72 Furthermore, EVs amount and content reflect the pathobiological state of the cells they originate from.69 EVs have been shown to support the generation of tumour stroma during CCA development by inducing the differentiation of mesenchymal stem cells to fibroblasts,73 thus preparing their own tumour niche. Proteomic profiling of EVs derived from human serum has revealed promising candidate proteins (FCN2, ITIH4, FIBG) for the differential diagnosis of early‐stage CCA and PSC patients (AUC: 0.96; sensitivity: 0.88; specificity: 0.88).74 Importantly, some of the identified serum EV protein biomarkers allowed the accurate and early diagnosis of CCA (AMPN, VNN1 and PIGR; AUC: 0.88, 0.88 and 0.84 respectively) and HCC (LG3BP, PIGR and A2MG; AUC: 0.90, 0.84 and 0.80 respectively) compared to healthy individuals, as well as the differential diagnosis of iCCA and HCC (FIBG, A1AG1, VTDB; AUC: 0.89, 0.85 and 0.82 respectively), which currently comprises a major challenge nowadays. Of note, the combinations of some of these biomarkers increased their diagnostic accuracy. Moreover, the analysis of the surface antigen composition of serum EVs allowed to diagnose CCA from healthy individuals and other cancer entities with up to 90% sensitivity, but was unable to differentiate between CCA and HCC.75 Additionally, a correlation between CCA/HCC tumour burden and EV levels specific for those cancer entities was observed, highlighting the prognostic value of EVs, especially in terms of early detection of small tumours. The concentration of EVs per se in bile and serum was found increased in patients with CCA and pancreatic carcinoma, discriminating malignant from non‐malignant pancreatobiliary diseases with 100% sensitivity in bile and 47% in serum.76 Another study used a combined approach comprising EV isolation followed by microRNA content profiling. In particular, a miRNA panel (miRs 191, 486‐3p, 1274b, 16 and 484) showed good diagnostic values for CCA diagnosis compared to non‐malignant biliary diseases (sensitivity: 67%; specificity: 96%).77 An overview of the conducted studies summarizing their diagnostic capability for EV‐based CCA diagnosis can be found in Table 2. Biomarker Source Method Controls SEN SPE AUC Reference FCN2, ITIH4, FIBG Serum EVs Proteomics PSC 92‐100 81 0.88‐0.96 74 EpCAM+ ASGPR1+ CD133+ Serum EVs FACS Healthy 90 50 0.82 75 Total amount Serum EVs NTA Non‐malignant bile duct stenoses 47 80 0.81 76 Total amount Bile EVs NTA Non‐malignant bile duct stenoses 100 100 0.10 77 miR‐191 miR‐486‐3p miR‐1274b miR‐16 miR‐484 Serum EVs miR arrays Non‐malignant bile duct stenoses 67 96 — 78 AUC, area under (ROC) curve; EV, extracellular vesicles; FACS, fluorescence‐activated cell sorting; miR, microRNA; NTA, nanoparticle tracking analysis; SEN, sensitivity; SPE, specificity; PSC, primary sclerosing cholangitis. 2.5 Circulating tumour cells Due to the difficulty in obtaining a histological or cytological diagnosis in biliary‐pancreatic cancers, circulating tumour cells (CTCs) are of great interest. CTCs are released by primary tumours into the bloodstream at a concentration of about 106 CTCs/g of tumour/day78 and, although at very low concentrations, may be a route for metastasis of some solid neoplasms. Few studies have evaluated the presence of CTCs as a diagnostic tool for CCA, although there are emerging data in other cancers such as glioblastoma multiforme,79 hepatocellular carcinoma,80 and pancreatic,81 breast,82 and colorectal83 cancers. A number of technologies have been developed to isolate and identify CTCs from peripheral blood, including enzyme‐linked immunosorbent spot (ELISPOT) assay, real time PCR, flow cytometry, and immunocytochemistry, and automated or semi‐automated systems (CellSearch, CellSpotter, or iChip). To date, the only tool approved by the US Food and Drug Administration for the detection of CTCs is the CellSearch System, a semi‐automated platform for the preparation and subsequent capture of CTCs using epithelial cell‐specific EpCAM antibodies, prior to labelling with immunofluorescent markers. To further strengthen the discriminating capability of this tool, cells are also sorted for their positivity to DAPI, cytokeratins 8/18 (markers of hepatocytes), and 19 (marker of cholangiocytes in the liver) and their negativity for CD45 (marker of leukocytes).84 This system has the disadvantage that, apparently, few CCA tumours (10%‐20%) have significant elevation of EpCAM expression.85 Using this system, the prevalence of CTCs in blood from large cohorts of patients with metastatic carcinomas was 36% (≥2 CTCs per 7.5 mL of blood) compared to 0.3% in healthy and non‐malignant disease subjects.86 A different technology, based on a microfluidic platform capable of separating CTCs from peripheral whole blood samples using EpCAM‐coated microposts to differentiate between epithelial cells and blood leukocytes (the ‘CTC‐chip’), was developed and the efficiency of CTC capture determined in clinical specimens was 65%‐71% and the sensitivity and specificity were close to 100% in the wide variety of solid‐organ cancers tested.87, 88 A further refinement of this technology is the CTC‐iChip, which has been used to sort very rare CTCs from patients suffering from prostate cancer.89 To date, the number of studies suggesting that circulating CTCs are associated with poor prognosis in patients with advanced CCA are scarce.84, 90, 91 However, it remains unclear whether they have any diagnostic role in CCA. The first pioneering study on biliary‐pancreatic cancers study was conducted in patients using a reverse transcriptase‐PCR approach to detect CEA in blood samples; this study outlined a correlation between increased CEA expression and hematogenous dissemination and worst prognosis.92 In addition, it was also reported, using the CellSearch System, that only 25% of patients with biliary tract cancer had elevated CTCs (>2 per 7.5 mL of blood),84 suggesting the possibility of using CTCs as non‐invasive biomarkers to predict the outcome of patients.93 Of note, the presence of CTCs has been shown to correlate with higher tumour extent and lower overall survival in patients with CCA.90 Moreover, an elevation of CTCs count over baseline, together with other circulating markers, predicted a worse overall and disease‐free survival in patients with CCA.94 From a biological point of view, it was hypothesized that CTCs in the bloodstream could be putatively sustained by the interaction of the tumour cells with immune cells and CD105+ CD14+ myeloid fibroblasts, and be responsible for the metastatic spread of CCA.81 CTCs have also been isolated from portal venous blood in patients with hepatobiliary‐pancreatic malignancies.95 Although mainly focusing on patients with pancreatic ductal adenocarcinoma, portal vein derived CTCs were also examined in a small subgroup of CCA patients. Blood samples were obtained by direct intraoperative venipuncture during pancreaticoduodenectomy. CTCs were isolated by fluorescence‐activated cell sorting (CD44+, CD147+, EpCAM+, CD45−) and characterized for mRNA expression and acetylated chromatin encoding K‐RAS exon 12 mutation (K‐RAS mut). K‐RAS mut mRNA was detected at low levels and with high variability in CCA patients. The authors hypothesize that K‐RAS mut gene expression may be a useful indicator for aggressive adenocarcinoma CTCs. These cells might retain malignant potential in portal venous blood even after successful tumour resection with high risk for disease recurrence and metastatic progression.95 In line with this, another study was conducted to examine KRAS mutation‐positive CTCs in the portal venous blood of patients with hepatobiliary‐pancreatic malignancies, including a small subgroup of patients with dCCA.81 The CTCs isolated from the portal circulation were shown to be highly proliferative and resistant to apoptosis. CTCs recruited multiple immune cell types, including myeloid fibroblasts suggesting that CTC survival inside the portal venous circulation is supported by their interactions with immune cells within multi‐cell type clusters that could represent a source of local recurrence and metastatic progression. 3 BIOMARKERS IN TUMOUR TISSUE Biomarkers in tumour tissue may be of particular value for resected CCAs, as they could predict prognosis (ie, overall survival and tumour recurrence) (Table 3) and response to potential adjuvant therapies. In this regard, specific genomic and transcriptomic signatures have already been identified. High genomic heterogeneity was reported in CCA, with the most prevalent alterations related to DNA repair (TP53),96-100 growth pathways (KRAS, BRAF, SMAD4, FGFR2, PTPN3),96, 99-105 chromatin remodelling (KMT2C, ARID1A, PBRM1 and BAP1)97, 98 and developmental pathways that significantly impact the cancer growth, such as Notch and Wnt signalling pathways (NOTCH1, NICD, WNT7B and WNT10A).106, 107 Noteworthy, FGFR2 gene fusions, usually found in 5.5% to 13.6% patients with iCCA, deserve special attention since they are pharmacologically targetable and are specifically found in iCCA tumours, while being absent in any other liver malignancy, harbouring also a diagnostic value.11, 100, 101, 103, 109 IDH1 and IDH2 gene mutations are also frequently found in non‐infectious CCA, mainly in iCCA, accounting for 4.9% to 36% of the cases.97, 98, 100, 102, 110, 111 These alterations were also described in CCA cells and correlated with their methylation status.115 In a high‐throughput screening of several cancer cell lines, including 17 biliary tract cancer cells, IDH‐mutant iCCA cells exhibited good response to dasatinib, a multi‐tyrosine kinase inhibitor, which was also shown to increase apoptosis and tumour regression in IDH‐mutant xenografts.116 Consequently, a clinical trial is now being conducted to evaluate the therapeutic efficacy of dasatinib in IDH‐mutant advanced iCCA (NTC02428855). Other clinical trials are also evaluating the clinical efficacy of IDH inhibitors for CCA (NCT02989857; NCT02381886). Gene Description Expression (high/low) Method Overall survival Recurrence‐free survival Reference KRAS Kirsten rat sarcoma viral oncogene homolog High TES/ WES Decreased Decreased 117 TP53 Tumour protein 53 Low TES/ WES Decreased Decreased PROM 1 Prominin‐1/CD133 High IHC Decreased — 134 CTGF Connective tissue growth factor High IHC Increased — 135 VIM Vimentin High IHC Decreased — 136 DKK1 Dickkopf WNT signalling pathway inhibitor 1 High IHC/ PCR Decreased — 51 SOX 2 SRY‐box 2 High IHC Decreased — 137 SOX17 SRY‐box 17 Low PCR Decreased — 138 MUC1 Mucin 1, cell surface associated High PCR Decreased — 139 PTEN Phosphatase and tensin homologue Low ISH Decreased — 5 PTPN14 Protein tyrosine phosphatase, non‐receptor type 14 Low ISH Decreased — 5 lnc RNA AFAP1‐AS1 AFAP1 antisense RNA 1 High PCR Decreased — 140 lnc RNA PANDAR Promoter Of CDKN1A antisense DNA damage activated RNA High PCR Decreased — 141 CEACAM 6 Carcinoembryonic antigen‐related cell adhesion molecule 6 High PCR/ IHC — Decreased 142 CD151 Cluster of differentiation 151 High PCR/ IHC/ WB Decreased Decreased 143 C‐met MET proto‐oncogene, receptor tyrosine kinase Low PCR/ IHC Increased Increased 143 BECN1 Beclin 1 High PCR Increased Increased 144, 145 STAT3 Signal transducer and activator of transcription 3 High PCR/ IHC Decreased Decreased 146 CAPN4/CAPNS1 Calpain small subunit 1 High PCR/ IHC/ WB Decreased Decreased 147 SOX9 SRY‐box 9 High IHC Decreased — 148 CDH1 E‐cadherin Low IHC Decreased — 136, 149 FASCIN/FSCN1 Fascin actin‐bundling protein 1 High IHC Decreased — 136 S100A4 S100 calcium‐binding protein A4 High IHC Decreased — 150 EGFR Epidermal growth factor receptor High IHC Decreased — 151 VEGF Vascular endothelial growth factor High IHC Decreased — 152 MUC4 Mucin 4, cell surface associated High IHC Decreased — 153 MUC16/CEA 125 Mucin 16, cell surface associated High IHC Decreased — 154 CD44 Cluster of differentiation 44 High IHC Decreased — 155 FBXW7 F‐box and WD repeat domain containing 7 Low IHC Decreased Decreased 156 CDKN1B/p27 Cyclin‐dependent kinase inhibitor 1B Low IHC Decreased Decreased 157 CCND1 Cyclin D1 High IHC Decreased Decreased 158 HDGF Heparin‐binding growth factor High IHC Decreased — 152 KRT103 Keratin103 Low IHC Increased — 159 HDAC1 Histone deacetylase 1 High IHC Decreased Decreased 160 NOTCH4 Notch4 High IHC Decreased — 161 PTP4A3/PRL3 Protein tyrosine phosphatase type IVA, member 3 High IHC Decreased — 162 AKT1 AKT serine/threonine kinase 1 High IHC Increased — 163, 164 MTOR Mechanistic target of rapamycin kinase High IHC Increased — 163, 164 SMAD7 SMAD family member 7 High IHC Decreased Decreased 165 FOXC2 Forkhead box C2 High IHC Decreased Decreased 166 SKP2 S‐phase kinase‐associated protein 2 High IHC Decreased — 167 CTL4 Cytotoxic T‐lymphocyte antigen 4 High mRNA microarray — Decreased 120 IL‐33 Interleukin 33 High PCR/ ISH — Increased 121 MIR21 MicroRNA 21 High ISH/ PCR Decreased Decreased 5, 126 IHC, immunohistochemistry; ISH, in situ hybridization; PCR, polymerase chain reaction; TES, targeted exome sequencing; WB, western blot; WES, whole‐exome sequencing. Particular aetiological and/or risk factors for CCA may indeed select specific mutations that allow cancer development, progression and evolution.98, 102, 104, 106, 108 In this regard, mutations in TP53 seem to be highly frequent (58%) in CCA arising from patients with HBV.117 Therefore, the mutational genomic analysis and gene expression profiles of CCA may allow a precise stratification of patients, paving the path for personalized therapy.101 Mutations in KRAS (12%‐16%) and TP53 (13%‐20%) have been associated with worse prognosis, that is, lower overall survival and higher tumour recurrence than mutations in IDH1/2 or undetermined, in two large and independent cohorts of patients with iCCA undergoing tumour resection.103, 117 The analysis of the transcriptome of iCCA tumours revealed two distinct types of iCCA: the “inflammation type”, which is mainly characterized by the increased expression of inflammatory‐related genes and the “proliferation type”, which shows the worst outcome and is characterized by the activation of oncogenes.104 Further, a panel of 36 biomarkers that corelated with poor survival was identified in an mRNA microarray from patients with surgically resected iCCA.118 Moreover, mutations on KRAS/BRAF genes were directly linked to patients’ poor prognosis, along with an increased expression of human epidermal growth factor receptor 2 (HER2), which was completely absent in CCA with good prognosis. Furthermore, 73 studies based on immunohistochemical analysis of 4126 CCA patients were combined in a meta‐analysis that allowed the identification of 77 prognostic biomarkers in CCA patients that underwent surgical resection.119 The results from this meta‐analysis indicated that fascin, EGFR, mucin 1 (MUC1), MUC4 and p27 are independently associated with overall survival in resected CCA patients. Furthermore, the analysis of 53 patients with biliary tract cancer who underwent tumour resection revealed 39 transcriptomic prognostic biomarkers, all of them related with T‐cell activation and immune response. For instance, the expression levels of cytotoxic T‐lymphocyte antigen 4 (CTL4) and forkhead box P3 (FOXP3) correlated with recurrence‐free survival, suggesting an enrichment in T regulatory cells in the tumour microenvironment.120 Moreover, high IL‐33 tissue expression correlated with favourable prognosis in patients with iCCA or pCCA,121 but data on circulating IL‐33 levels were lacking. In parallel, individual case reports have further described Granulocyte colony‐stimulating factor (G‐CSF)‐expressing CCAs and suggested monitoring circulating G‐CSF to diagnose disease relapse after radical tumour resection.122, 123 Differential miR expression profiles were also identified in CCA tumour tissue compared to non‐tumour liver tissue. Several miRs were already shown to be deregulated in CCA6, 7 and interestingly, the oncomiR miR‐21 has arisen as a promising biomarker in tumour tissue. Remarkably, in two different studies, miR‐21 was found to be overexpressed in CCA tumour tissue, regardless of its aetiology, and provided a 95% sensitivity and 100% specificity in the differential identification of CCA and normal bile duct specimens or non‐tumour liver tissue respectively.124, 125 The expression of miR‐21 in tumour tissue positively correlated with the clinical stage at diagnosis and with the tumour differentiation status and, more importantly, increased levels of miR‐21 in iCCA were directly associated with poor overall and progression‐free survival.5, 126 High miR‐21 expression levels were also evident in CCA cell lines compared with non‐malignant cholangiocytes,127 while experimental inhibition of miR‐21 was shown to dampen CCA growth in vivo.5, 128 It is worth mentioning that miR‐21 expression is also increased in tumour tissue from patients with HCC, compared to healthy individuals.129, 130 Specific tissue miRNA expression profiles may also be used for diagnostic purposes since distinct miR signatures were associated with different subtypes and histological grade of O viverrini‐induced iCCA.132 Furthermore, a panel of seven miRs was found differentially expressed in tumour tissue of patients with CCA and pancreatic adenocarcinoma, further proposing that different miR expression tissue profiles may also allow the differential diagnosis of tumours with similar clinical presentations.133 4 SUMMARY AND FUTURE PERSPECTIVES The early and accurate non‐invasive diagnosis of CCA remains a major challenge. This is particularly important in order to increase the number of patients eligible for surgical tumour resection or liver transplantation, which are the only potential curative options nowadays. For this purpose, it is of pivotal importance to develop novel diagnostic strategies as well as to determine the unknown aetiologies of the majority of CCAs, which is key for monitoring patients at risk and early diagnose tumour development. Several novel approaches have been recently investigated in the search of non‐invasive biomarkers for CCA, including CTCs, EVs, miRNAs and metabolites, and multiple potential biomarkers have been described. However, the most promising biomarkers (single or clusters) need to be internationally validated in large biopsy‐proven cohorts of patients, with appropriate control groups. Moreover, future studies should investigate the accuracy of potential candidate biomarkers for all types of CCA, or for specific subgroups associated with known risk factors. In this regard, the European Network for the Study of Cholangiocarcinoma (ENS‐CCA: www.enscca.org / www.cholangiocarcinoma.eu), a pan‐European and multidisciplinary collaborative group, represents an ideal platform for these types of validation studies, for the generation of consensus statements, and for accelerating the translation of biomarkers into the clinics. ACKNOWLEDGEMENT The authors of this review article are members of the European Network for the Study of Cholangiocarcinoma and participate in the European Cholangiocarcinoma Network Action granted by the European Commission (Horizon 2020; CA18122). CONFLICT OF INTEREST The authors declare no competing interests. REFERENCES
|
|
Scooped by
Gilbert C FAURE
April 8, 2019 2:27 AM
|
Research ArticleGastroenterologyImmunology Free access | 10.1172/JCI98929 Intestinal development and homeostasis require activation and apoptosis of diet-reactive T cells Alexander Visekruna,1 Sabrina Hartmann,1 Yasmina Rodriguez Sillke,2 Rainer Glauben,2 Florence Fischer,1 Hartmann Raifer,3 Hans Mollenkopf,4 Wilhelm Bertrams,5 Bernd Schmeck,5 Matthias Klein,6 Axel Pagenstecher,7 Michael Lohoff,1 Ralf Jacob,8 Oliver Pabst,9 Paul William Bland,10 Maik Luu,1 Rossana Romero,1 Britta Siegmund,2 Krishnaraj Rajalingam,11 and Ulrich Steinhoff1 First published April 2, 2019 - More info Abstract The impact of food antigens on intestinal homeostasis and immune function is poorly understood. Here, we explored the impact of dietary antigens on the phenotype and fate of intestinal T cells. Physiological uptake of dietary proteins generated a highly activated CD44+Helios+CD4+ T cell population predominantly in Peyer patches. These cells are distinct from regulatory T cells and develop independently of the microbiota. Alimentation with a protein-free, elemental diet led to an atrophic small intestine with low numbers of activated T cells, including Tfh cells and decreased amounts of intestinal IgA and IL-10. Food-activated CD44+Helios+CD4+ T cells in the Peyer patches are controlled by the immune checkpoint molecule PD-1. Blocking the PD-1 pathway rescued these T cells from apoptosis and triggered proinflammatory cytokine production, which in IL-10–deficient mice was associated with intestinal inflammation. In support of these findings, our study of patients with Crohn’s disease revealed significantly reduced frequencies of apoptotic CD4+ T cells in Peyer patches as compared with healthy controls. These results suggest that apoptosis of diet-activated T cells is a hallmark of the healthy intestine. Introduction Immunological tolerance to environmental factors such as intestinal bacteria and food antigens is an active, multilayered process, and its breakdown leads to hyperactivation of mucosal T and B cells and subsequent development of intestinal pathologies (1–3). Successful dietary intervention therapies in patients suffering from celiac disease, food allergies, and inflammatory bowel disease (IBD) demonstrate that diet contains immunologically relevant antigens (4–6). Yet, our understanding of diet-specific immune reactivity is largely derived from T cell receptor (TCR) transgenic mice and model antigens where tolerance mechanisms comprising clonal anergy, deletion, and induction of regulatory T cells (Tregs) have been shown (7–9). These data reveal that the contribution of clonal anergy/deletion versus active suppression by Tregs depends on type, dose, and frequency of applied antigens. Even though the vast majority of peripheral Tregs (pTregs) in the lamina propria (LP) of the small intestine is induced by normal food, oral tolerance is still intact if functional Treg levels are strongly reduced (10, 11). Although the LP is not considered a typical site of immune induction, Peyer patches (PPs) are specialized lymphoid follicles known for effective stimulation of B and T cells by luminal antigens. Surprisingly, little attention has been paid to their role in tolerance against dietary antigens. This might be due to controversial findings showing, on the one hand, that tolerance occurs in PP-deficient mice and, on the other hand, that PPs are required for oral tolerance (12–15). Here, we investigated the occurrence of diet-activated T cells in various tissues and characterized their phenotype and fate. We observed that recognition of dietary antigens is essential for the cellular and functional maturation of the small intestine, including generation of Tfh cells and IgA production. In the healthy murine and human gut, food-activated CD4+ T cells in PPs exhibited a proapoptotic phenotype characterized by the transcription factor Helios and the programmed cell death protein 1 (PD-1). In contrast, low Helios expression and reduced apoptosis were observed in PP CD4+ T cells of patients with IBD, suggesting that activation and subsequent death of food-reactive T cells is a hallmark of intestinal homeostasis. Results PPs harbor a population of activated Helios+Foxp3–CD4+T lymphocytes. First, we addressed the question of whether normal dietary antigens leave a signature of immune activation in nontransgenic animals. To differentiate between stimulation by microbial and dietary antigens, intestinal and nonintestinal tissues of specific pathogen–free (SPF) and germ-free (GF) mice were screened for activated T cells. In contrast to spleen and mesenteric lymph nodes (mLNs), the majority of CD4+ T cells in PPs and small intestinal lamina propria (siLP) exhibited an antigen-experienced phenotype with high expression of CD44. In line with previous reports, GF mice revealed lower frequencies of activated CD44+CD62L– T cells in PPs and colonic LP (cLP), indicating that this population includes both microbiota-dependent and -independent T cells (Figure 1A) (16). Figure 1 Helios+Foxp3–CD4+ T cells accumulate in Peyer patches. (A) Percentage of CD44+CD62L–CD4+ T cells in spleen, mLNs, inguinal lymph nodes (iLNs), PPs, siLP, and cLP of SPF and GF mice (n = 6, 1 of 2 experiments is shown). (B) Representative dot plots of CD4+ T cells from SPF mice expressing Helios and Foxp3 in indicated organs (n = 6). (C) Expression of Helios and Foxp3 on gated CD4+ T cells of PPs from GF mice (n = 5). (D) Distribution of Helios+Foxp3–CD4+ T cells in indicated tissues of SPF and GF mice (n = 6, 1 of 2 experiments is shown). (E) Expression of Helios, CD62L, CD44, and CD69 in PP CD4+ T cells from SPF mice (n = 6). (F) TCR Vβ repertoire of Helios+Foxp3–CD4+ T cells (white) and Tregs (black) derived from PPs of SPF mice (n = 5, 1 of 2 experiments is shown). (G) Analysis of CD25, CTLA-4, and IL-10 in Helios+Foxp3–CD4+ T cells (red) and Tregs (black) from PPs of SPF mice (n = 3). (H) In vitro suppression assay of CD4+ T responder cells (Teff) in the presence of in vitro–generated Tregs or CD44+CD62L–Helios+Foxp3–CD4+ T cells (THel) enriched from PPs of DEREG mice. Data are representative of 2 (A–D and F) or 3 (E, G, and H) independent experiments. Error bars indicate mean ± SD. Data were analyzed using the Student’s t test; *P < 0.05, ***P < 0.001. Activated T lymphocytes, including Foxp3+ and Foxp3– T cell subsets, were shown to express the transcription factor Helios (17). Markedly increased frequencies (25%–35%) of Helios+Foxp3–CD4+ T cells were found in PPs compared with low frequencies (<10%) in other organs (Figure 1B). Microbiota-independent Helios+ CD4 T cells, as shown in GF or antibiotic-treated (ATB-treated) SPF mice, were mainly found in PPs and to a lesser extent in the siLP (Figure 1, C and D, and Supplemental Figure 1; supplemental material available online with this article; https://doi.org/10.1172/JCI98929DS1) and exhibited an antigen-experienced phenotype with high expression of CD44, CD69, and a low level of CD45RB and CD62L (Figure 1E and Supplemental Figure 2). As the role of Helios is controversial, we tested PP-derived Helios+Foxp3–CD4+ T cells for their regulatory function (18, 19). Although the usage of TCR Vβ chains was broad and similar to Tregs, these cells lacked expression of CD25, CTLA-4, and IL-10, all typically expressed by Tregs (Figure 1, F and G). Moreover, Helios+Foxp3–CD4+ PP T cells were not able to suppress proliferation of effector T cells (Figure 1H), did not secrete IL-4, IFN-γ, or IL-17 after polyclonal stimulation, and were distinct from a subgroup of latency-associated peptide–expressing (LAP-expressing) Tregs, shown to produce IL-10 and TGF-β (Supplemental Figure 3) (20). Helios+Foxp3–CD4+ T cells in PPs are activated by dietary antigens. As food is the major source of antigens in GF mice, and thus might explain the high frequency of Helios+Foxp3–CD4+ T cells, we assumed that this population should be affected if animals were kept on an antigen-free, elemental diet (ED). Low proliferation of PP CD4+ T cells in ED mice resulted in a vastly decreased frequency and number of Helios+Foxp3–CD4+ T cells as compared with animals kept on conventional diet (ConvD). Much less pronounced, but still affected by ED, was the number of Tregs in PPs despite unaltered frequencies (Figure 2, A–D). Figure 2 Helios+Foxp3–CD4+ T cells are food antigen–dependent. (A) Proliferation of PP CD4+ T cells (BrdU+) of mice kept on ConvD or ED was determined by flow cytometry (n = 3). (B) Frequency of Helios+Foxp3–CD4+ T cells in PPs of ED mice. (C) Absolute cell numbers of Helios+Foxp3–CD4+ T cells (left) and Tregs (right) in PPs of ConvD and ED mice (n = 5). (D) ConvD of SPF mice was switched to ED for 27 days and then back to ConvD. Frequencies of Tregs and Helios+Foxp3–CD4+ T cells in PPs refer to ConvD mice, set at 100% (n = 6). (E and F) SPF mice were fed ConvD or ED 27 days prior to analysis of Foxp3 and Helios (E) or total CD44+ T cell numbers within the PP CD4+ T cell population (F) (n = 6). Data are representative of 2 (D–F) or 3 (A–C) independent experiments. Error bars indicate mean ± SD. Data were analyzed using the Student’s t test; **P < 0.001, ***P < 0.001. With exception of the suckling period, the occurrence of Helios+Foxp3–CD4+ T cells in ConvD and their decline in ED mice was age independent (Supplemental Figure 4, A–C). To study kinetics of food antigen–dependent expansion of Foxp3–Helios+ and Foxp3+CD4+ T cells, ConvD was replaced by ED for 4 weeks and then switched to ConvD again. A gradual decline in the frequencies of Helios+Foxp3–CD4+ T cells in PPs was observed with the duration of antigen-free alimentation. These levels returned to normal after ED was replaced by ConvD. In contrast, frequencies of Foxp3+ Tregs were not altered by a change of diet (Figure 2D). Flow cytometric analysis of PP CD4+ T cells indicated that the frequency of activated CD44+Helios+Foxp3– T cells was affected by ED (Figure 2, E and F). The effect of dietary antigens on total PP CD4+ T cells was also seen in GF animals. GF mice fed ED showed further declined frequencies and total numbers of Helios+Foxp3–CD4+ T cells in the PPs, as compared with GF mice kept on ConvD. Of note, despite the unaltered frequency of the Foxp3+ population, the low intestinal cellularity in GF mice affected total numbers of Tregs, but not as much as the Helios+ non-Treg population (Supplemental Figure 5, A–C). We conclude that the intestinal cellularity is influenced by both microbiota and nutrition, but the expansion of Helios+Foxp3–CD4+ T cells is only dependent on dietary proteins. Dietary antigens mediate immunological maturation of the small intestine. We next investigated the long-term effects that lack of food antigens has on organ development. Macroscopic examination of animals fed ED showed a reduced diameter of the small intestinal tube with marginal PPs, whereas the spleen and colon were normal (Figure 3A). Immunohistological and FACS analysis of PPs revealed reduced numbers of CD4+ T cells in germinal centers (GCs) of ED mice, including PD-1+ Helios+ CXCR5+ Tfh cells (Figure 3, B–E and Supplemental Figure 6, A–C). Approximately one-third of Helios+ Foxp3– T cells expressed the Tfh marker CXCR5, whereas two-thirds remained CXCR5 negative (Supplemental Figure 6D). Figure 3 Food antigens are required for immunological maturation of the small intestine. (A) Macroscopic appearance of organs from animals kept on ConvD or ED for 4 generations. (B) Immunohistology of PPs from ConvD and ED mice stained for CD4 (red) and the germinal center marker GL7 (green) (n = 4). Germinal centers are outlined with dashed line. (C) Total numbers of CD4+ T and B cells in indicated organs of ConvD and ED mice (n = 6). (D) FACS analysis showing percentages of CXCR5hiPD-1hi Tfh cells within the PP CD4+ T cells of ConvD and ED mice. (E) Frequencies and total cell number of CXCR5hiPD-1hi Tfh cells in PPs of ConvD and ED mice (n = 6, 1 of 2 experiments is shown). (F) Frequencies of B220+ IgA+ cells in PPs of ConvD and ED mice (n = 4). (G) Small intestinal IgA concentrations of ConvD and ED mice were measured by ELISA (n = 4). Data are representative of 2 (A–G) independent experiments. Error bars indicate mean ± SD. Data were analyzed using the Student’s t test; *P < 0.05, **P < 0.01, ***P < 0.001. Despite unaltered frequencies of B and CD4+ T cells, lack of dietary antigens resulted in reduced absolute numbers of CD4+ T and B cells in PPs, mLNs, and siLP, but not in colon or spleen (Figure 3C and Supplemental Figure 7). In addition, PPs of ED animals contained considerably reduced numbers of activated B cells in the GC and diminished frequencies of IgA+ B lymphocytes. This explains the low amounts of secretory IgA in the small intestines of ED mice (Figure 3, F and G, Supplemental Figure 8). Importantly, normal thymic T cell development, together with unaltered T and B cell numbers in the spleen, demonstrated that food antigen deficiency does not disturb systemic lymphocyte development (Supplemental Figure 9) but specifically affects expansion and survival of lymphocytes within the small intestine. Helios induction by sustained TCR-restricted antigen stimulation. To investigate whether dietary antigens are recognized in a TCR-specific manner, we analyzed RAG-sufficient OT-II mice in which the vast majority of T cells expresses the OVA-specific Vα2+ TCR and a minor population of T cells, including diet-reactive T cells, expresses an endogenous Vα2–, polyclonal TCR that preferentially accumulated in PPs (Figure 4A). In the absence of OVA, most Vα2+ T cells were Helios–, whereas more than 10% of the Vα2– CD4+ T cells revealed a signature of food antigen activation in PPs but not in spleen or mLNs (Figure 4B). Correspondingly, OVA-supplemented drinking water triggered the expansion of Helios+ Foxp3– Vα2+ T cells in PPs (Figure 4C), but also in mLNs and spleen (data not shown). OVA-stimulated Vα2+ PP T cells differentiated into Helios+Foxp3– or Helios+Foxp3+ phenotypes, demonstrating that the majority of Vα2+ T cells expressed Helios independently of Foxp3 and only a small fraction differentiated into Helios+Foxp3+ Tregs (Figure 4D). In vitro studies further confirmed that Foxp3-independent induction of Helios expression requires recognition of cognate antigen (Supplemental Figure 10). Figure 4 Induction of Helios is TCR-specific. (A) Frequencies of Ova-specific TCR tg Vα2+ (white bars) and endogenous Vα2– (black bars) CD4+ T cells in indicated organs of naive OT-II RAG+/+ mice. (B) Frequencies of Helios+Foxp3–CD4+ T cells within the Vα2+ and Vα2– populations in indicated organs of naive OT-II RAG+/+ mice (n = 5). (C) Expression of Helios and Foxp3 in Vα2+ PP T cells without or after stimulation of OVA (1 mg/ml) for 5 days. (D) Kinetics of Helios and Foxp3 expression in Vα2+CD4 PP T cells of OT-II mice given 1 mg/ml OVA in drinking water for 5 days. Expression was analyzed by FACS at days 2, 10, and 23 after withdrawal of OVA (n = 4). Data are representative of 2 (C and D) or 3 (A and B) independent experiments. Error bars indicate mean ± SD. Data were analyzed using the Student’s t test; ***P < 0.001. These results show that induction of the Helios+Foxp3– phenotype requires TCR-mediated recognition of dietary antigens, with Vα2+ T cells being specifically activated by OVA but not by other dietary antigens, whereas Vα2– T cells react in the opposite way. Dietary antigen impact on the transcriptional profile of PP CD4+ T cells. Since stimulation with food antigens is crucial for the maturation of the intestinal immune system, we investigated the mRNA profile of PP CD4+ T cells in response to dietary antigens and their activation state. We wondered whether continuous exposure to dietary antigens leads to a phenotype of exhaustion similar to that described for chronic viral infections. In contrast to CD4+ T cells from chronic viral infection, the transcriptional signature of ConvD-activated CD4+ T cells was slightly skewed toward exhaustion. CD4+ T cells from ConvD mice expressed increased mRNA for Lag3, Icos, Pdcd1, and Tigit as compared with ED mice (Figure 5A). Figure 5 Transcriptional profiling of food antigen–dependent CD4+ T cells in PPs. (A) CD4+ T cells from PPs were sorted and analyzed by RNA sequencing. The gene expression signature of T cell exhaustion was compared between ConvD and ED mice. Each dot represents mean transcripts per million (TPM) ± SD for 6 mice per group. (B) Key gene TPM associated with Tfh function were transformed to Z scores and compared between ConvD and ED mice (6 mice per group). ASCL2 and Bcl6 target genes were investigated by Gene Set Enrichment Analysis (GSEA). (C and D) Genes identified by RNA sequencing of CD44+CD62L–Foxp3–CD4+ and CD44–CD62L+Foxp3–CD4+ T cells from PPs of ConvD mice were investigated by GSEA for enrichment of the oxidative phosphorylation pathway and apoptosis as defined in the KEGG database. NES, normalized enrichment score; FDR, false discovery rate. In accordance with our phenotypic analyses, the expression pattern of ConvD animals was markedly biased toward a Tfh cell signature, including transcripts for IL-21, Cxcr5, Bcl6, Pdcd1, and Ascl2. While Tfh cell differentiation may be controlled by a Bcl6- or Ascl2 gene-centered network, the latter network seems to apply to Tfh cell polarization by dietary antigens, as illustrated by positive gene association upon ConvD treatment (Figure 5B). Finally, we compared the transcriptional profile of activated (CD44+CD62L–Foxp3–) versus naive (CD44–CD62L+Foxp3–) CD4+ T cells in the PPs of ConvD mice. Gene enrichment analysis revealed a marked upregulation of genes that are associated with apoptosis and oxidative phosphorylation in activated CD4+ T cells as compared with their naive controls (Figure 5, C and D). In summary, these gene signatures show that not only the microbiota but also food antigens induce Tfh cells and further suggest that PP CD4+ T cells activated by dietary antigens are more prone to apoptosis than to exhaustion. Food-reactive PP T cells undergo apoptosis and trigger IL-10 production. To further examine the fate of food antigen–reactive Helios+Foxp3–CD4+ T cells, we first analyzed the expression of molecules required for cell survival. While the majority of CD4+ T cells in spleen and mLNs expressed the IL-7Rα (CD127), a substantial population of PP T cells, including most food protein–reactive T cells, downregulated this survival receptor (Figure 6, A and B). In addition, OX40 and Bcl-2, both essential for long-term survival of CD4+ T cells, were almost absent in food-reactive T cells but were strongly expressed in Tregs of PPs (Figure 6, C and D) (21). As lack of survival molecules is common in cells prone to apoptosis, we performed annexin V/PI staining for T and B cells of SPF and GF mice. Strong staining of annexin V was exclusively seen within CD4+ T but not B cells in PPs of SPF and GF mice (Figure 6E and Supplemental Figure 11, A and B). The apoptotic signature was mainly confined to food-activated CD44hiHelios+Foxp3–CD4+ T cells (Figure 6, F and G) and was significantly decreased in animals fed ED (Figure 6H). Figure 6 Food antigen–activated T cells undergo apoptosis in PPs. (A) Expression of CD127 on CD4+ T cells derived from mLNs (black) and PPs (red) of ConvD mice. (B) Flow cytometric analysis of CD127 and Helios in viable Foxp3–CD4+ T cells from PPs of ConvD mice. (C and D) Expression OX40 and Bcl-2 in Helios+Foxp3–CD4+ T cells (red) or Tregs (black) from PPs of Conv mice (n = 4). The filled area shows isotype control staining. (E) Frequencies of annexin V/PI+ CD4+ T cells in spleen, mLNs, siLP, and PPs of ConvD mice. (F) Frequencies of Helios+Foxp3– cells in annexin V+ and annexin V– CD4+ T cells sorted from PPs of ConvD mice (n = 4). (G) Annexin V staining of CD4+CD44hi and CD4+CD44lo CD4+ T cells from PPs of ConvD mice (n = 5). (H) Annexin V+ CD4+ T cells derived from PPs of ConvD and ED mice (n = 5). (I) Immunoblot analysis of sorted CD44hi and CD44lo CD4+ T cells from PPs of ConvD mice for cleavage of PARP and activation of caspases. Data are representative of 2 (F–I) or 3 (A–E) independent experiments. Results are expressed as mean ± SD. Data were analyzed using the Student’s t test; *P < 0.05; ***P < 0.001. To define the pathway of apoptosis, sorted CD44hiCD4+ and CD44loCD4+ T cells from PPs of ConvD animals were analyzed for cleavage of poly (ADP-ribose) polymerase (PARP) and caspase activation. Strong cleavage of PARP together with activation of caspase-3 and -8 but not caspase-9 were seen in CD44hi but not in CD44lo T cells (Figure 6I), suggesting that programmed cell death is the fate of diet-activated T cells in PPs of the healthy intestine. Ingestion of apoptotic cells has been shown to induce IL-10 and to inhibit proinflammatory cytokine production, thus preventing chronic inflammation or autoimmunity (22, 23). Thus, we tested whether apoptotic cells are linked with the induction of IL-10 in PPs. In contrast to spleen and mLNs, substantial amounts of IL-10 were produced by cultured cells of PPs. Importantly, IL-10 secretion by PP-derived cells was dependent on dietary antigens, as only marginal amounts of IL-10 were detectable in ED animals (Supplemental Figure 12, A and B). Further, cocultures of macrophages with lymphocytes from various organs revealed that uptake of T lymphocytes from PPs but not spleen or mLNs triggered macrophage-derived IL-10 synthesis. Secretion of IL-10 correlated with the amount of dead cells, as staurosporine pretreatment further enhanced this effect (Supplemental Figure 12C). Apoptosis of Helios+Foxp3–CD4+ T cells is controlled by PD-1. PD-1 is known to be an important regulator of T cell activation and apoptosis (24). We thus tested the expression of PD-1 on both Helios+ and Helios– T cell populations in the PPs. Flow cytometric analysis revealed selective expression of PD-1 in Helios+ but not Helios– PP T cells (Figure 7, A and B). Further, PD-1 ligands PDL-1 and PDL-2 were found to be predominantly expressed on CD11b+ and CD11c+ APCs of the PPs (Figure 7C). Figure 7 Anti–PD-1 treatment activates proinflammatory T cell responses in PPs. (A and B) Expression of PD-1 in Helios–Foxp3– and Helios+Foxp3–CD4+ PP T lymphocytes (n = 6). (C) Expression of PD-L1 and PD-L2 in Cd11b+ (green) and Cd11c+ (red) APCs as well as in CD4+ T cells (blue) was analyzed by FACS. One representative of 3 similar experiments is shown. Numbers indicate the geometric mean fluorescence intensity (MFI) of PD-L1 and PD-L2. (D and E) Impact of in vivo anti–PD-1 treatment on IFN-γ+ and annexin V+ CD4+ T cells in PPs of ConvD mice. (F) Effects of in vitro anti–PD-1 treatment on IFN-γ expression in PP CD4+ T cells. PP cell cultures were treated as described in Methods and the frequency of IFN-γ+ CD4+ T cells was analyzed by FACS. Data are representative of 3 experiments (A–F). Error bars indicate mean ± SD. Data were analyzed using the Student’s t test; ***P < 0.001. Next, we determined whether PD-1 signaling controls the response of PP CD4+ T cells. To this end, we either injected PD-1–blocking antibodies or isotype controls into normal C57BL/6 mice i.p. or added anti–PD-1 antibodies directly into PP cell cultures. Polyclonal stimulation of PP cell suspensions revealed that anti–PD-1 treatment but not isotype control rescues PP CD4+ T cells from apoptosis to become IFN-γ–secreting effector cells (Figure 7, D–F). In inflammatory bowel disease, such as Crohn’s disease (CD), a variety of models have been used, including the IL-10–KO mouse which develops inflammatory reactions closest to CD (25). We wondered whether modulation of the PD-1 pathway leads to disease progression in IL-10–deficient mice. In contrast to WT controls, IL-10–KO mice treated with anti–PD-1 mAb developed severe colitis, accompanied by enhanced cellularity of T cells and increased numbers of IFN-γ+CD4+ T cells in the PPs (Supplemental Figure 13, A–D). Although these data suggest that PD-1 immune checkpoint blockade in the absence of IL-10 favors colitis development, the precise contribution of PP Helios+CD4+ T cells remains unclear. Reduced apoptosis of PP T cells in patients with IBD. Finally, we investigated the apoptotic behavior of human PP CD4+ T cells in healthy controls and patients with CD. Biopsies from PPs of the terminal ileum were taken with written consent from persons who had undergone routine intestinal health surveillance or patients with clinically diagnosed CD. The latter group was selected for discrete inflammation of the colon and/or ileum, whereas none of the controls showed signs of inflammation (Supplemental Table 1). To assure that T cells were derived from PPs, lymphocytes were stained and gated for expression of the germinal center marker GL7 prior to further analysis. While approximately 40% of the CD4+ GL7 + PP T cells from healthy controls were annexin V+, patients with CD revealed significantly lower frequencies of apoptotic PP T cells (approximately 22%) (Figure 8, A and B). Increased survival of PP T cells in CD was reflected by enhanced expression of Bcl-2 in viable cells (Figure 8C). Consistent with the finding that Helios marks CD4+ T cells undergoing programmed cell death with subsequent downregulation of Bcl-2 (26, 27), the expression of Helios in Foxp3–CD4+ T cells from PPs of patients with CD was significantly reduced as compared with healthy controls (Figure 8D). These data suggest that high apoptosis of PP CD4+ T cells is a homeostatic mechanism of the healthy gut. Figure 8 Analysis of CD4+ T cells from human Peyer patches. (A) Representative histogram of annexin V staining for GL7+CD4+ T cells derived from PPs of patients with Crohn’s disease (CD) and healthy controls. (B) Frequencies of annexin V+/PI+GL7+ CD4+ T cells in PPs. (C) Expression of Bcl2 on PP CD4+ T cells. (D) Percentages of Helios+Foxp3–PP CD4+ T cells. Results are expressed as mean ± SEM; n = 9 per healthy group and n = 8–9 per CD group. Data were analyzed using Mann-Whitney U test; **P < 0.01, ***P < 0.001. Discussion Although the value of nutritional treatment in patients with IBD was first reported over 30 years ago, a poor understanding of immunological mechanisms hinders both acceptance and use of medical diets (28, 29). From an immunological point of view, diet contains components of potential antigenicity that the immune system should not actively challenge. Accordingly, several studies have demonstrated that exposure to dietary antigens results in the generation of Tregs. However, the phenotype and fate of food-reactive T cells in the inductive tissue sites have received little attention. Antigen sampling of the luminal content of the gut is a prerequisite for monitoring both harmless and harmful antigens, and for responding appropriately. In the small intestine, efficient encounter between APCs and antigen-specific T cells takes place in specialized secondary lymphoid organs, that is, mLNs and PPs. Particularly, M cells and the follicle-associated epithelium (FAE) of PPs have been shown to efficiently take up and transport antigens from the gut lumen to immune-inductive sites of PPs (30, 31). Our search for diet-activated T cells in gut-associated and systemic lymphoid tissues revealed an unusually high frequency of activated CD44+Helios+Foxp3–CD4+ T cells exclusively in PPs of SPF and GF mice, indicating that activation was mediated by dietary rather than microbial antigens. This finding is in accordance with a previous observation that antigen-experienced T cells naturally accumulate in PPs but not mLNs with age, suggesting that these cells received antigenic stimulation directly in PPs and not in other sites of the intestine. Only a small proportion of these PP-resident CD62L–CD4+ cells were follicular helper T cells (Tfh) or Tregs (32). In contrast, Tregs became a prominent population in the siLP after weaning of GF animals to ConvD, and alimentation with ED prevented the development of Tregs in the siLP (10). Preferential expansion of pTregs in the siLP and Helios+Foxp3–CD4+ T cells in PPs seems to reflect the distinct morphology of both tissue sites. In PPs, the majority of DCs express CCR6 and recruit antigen from the subepithelial dome (SED) region before clustering with antigen-specific CD4+ T cells in the PPs but not in LP, supporting their selective role in intestinal-inductive sites (33). In contrast, the majority of LP DCs express CX3CR1, are CD103+, and capture antigen from the intestinal lumen via transepithelial dendrites (34). In the presence of TGF-β and retinoic acid, LP-derived CD103+CD11b+ DCs have been shown to efficiently induce Foxp3+ Tregs (35, 36). Surprisingly, their role in mediating oral tolerance still remains enigmatic, as oral tolerance was intact in CD11b– DC-deficient animals with strongly reduced pTregs (11). We here describe a population of ConvD-activated CD44+Helios+Foxp3–CD4+ T cells in PPs that is distinct from pTregs, although they express Helios, a marker recently used for differentiation between natural and inducible Foxp3+ Tregs (37). Since transient expression of Foxp3 has been described (38), there is a possibility that food-reactive CD44+Helios+Foxp3–CD4+ PP T cells may have originated from an “exFoxp3” population. Such reprogramming is highly unlikely as the frequency of Foxp3+ Tregs in PPs was not affected by the type of diet, whereas the Helios+Foxp3– population expanded or shrank in the presence or absence of dietary antigens, respectively. The mechanism of Foxp3-independent Helios expression and its function in activated PP CD4+ T cells remains unresolved. Autonomous expression of Helios has been described during differentiation and activation of CD4+ T cells, for Tfh cells and autoreactive T cells undergoing apoptosis (27, 39). It is notable that oral antigen uptake preferentially induces IL-27 and IL-10 in PP DCs, both cytokines exhibiting antiinflammatory properties (40, 41). Correspondingly, we observed that lack of dietary protein vastly decreased the number of Helios+CD4+ T cells and the amount of IL-10 in PPs. Although we were unable to directly track food-reactive T cells in normal mice, analysis of OT-II animals revealed TCR-specific recognition of dietary antigens. Oral uptake of OVA induced the Helios+Foxp3– phenotype within the TCR-transgenic Vα2+ population, whereas normal chow induced Helios in the endogenous Vα2–CD4+ T cell population within PPs. An important consequence of food antigen recognition by the intestinal immune system is the cellular and functional maturation of the small intestine. In the absence of food antigens, a low amount of IgA together with reduced numbers of B and T cells, including Tfh cells, assigns a new and essential aspect to dietary proteins aside from nutrition; that is, their antigenicity is required for normal development and function of the small intestine. Because the accumulation of diet-specific T cells in PPs might cause severe immunopathology if their activity and lifespan remain uncontrolled, we investigated the fate of these cells. In accordance with the downregulation of survival molecules, an exceptionally high level of apoptotic cells was found within the PPs. This increase was confined to the activated CD44+Helios+Foxp3–CD4+ T cell population and was decreased in ED animals, suggesting that caspase-3–mediated apoptosis of diet-activated T cells is a default mechanism, which warrants intestinal homeostasis. Helios+Foxp3–CD4+ PP T cells expressed high levels of PD-1, a molecule known to fine tune the fate and the function of T cells (42). We observed that anti–PD-1 treatment of PP T cells triggered IFN-γ production and simultaneously reduced the frequencies of apoptotic CD4+ T cells, indicating that PD-1 blockade rescues dysfunctional T cells from cell death. Interestingly, in the absence of IL-10, blocking of PD-1 favored development of colitis in these mice. Numerous reports show that colitis development remains a complication after treatment of cancer patients with an anti–PD-1 checkpoint inhibitor (43–45). In line with our murine data, we found that PP CD4+ T cells from healthy donors but not patients with CD revealed a substantially increased frequency of apoptotic T cells with high expression of Helios and low expression of Bcl2. Although we have not yet identified the precise mechanisms for enhanced survival of PP CD4+ T cells in patients with IBD, disturbed apoptosis might explain food antigen–specific immune responses in patients with CD, which were ameliorated by restricting dietary antigens (3). In this context, clinical observations have suggested lymphoid follicles as the initial site of inflammation in patients with CD, and that peak frequency of CD correlates with peak number of PPs at an age between 15 and 25 years (46–48). Here, we present an approach that combines murine and human studies for characterization of intestinal immune responses against dietary antigens. Our data suggest that apoptosis of PP lymphocytes is a hallmark of the healthy intestine, which eliminates potentially harmful food-reactive T cells and triggers the production of local IL-10. Reduced apoptosis of PP T cells in patients with CD might explain the beneficial effects of ED by depriving these T cells of their antigenic stimulus. These questions underline the importance of further investigating the molecular and cellular mechanisms of increased survival of PP T cells in patients with CD. Methods Animals. C57BL/6 mice were purchased from Charles River Laboratories and kept under specific pathogen–free (SPF) conditions. DEREG mice were provided by Tim Sparwasser (Institute of Infection Immunology, Hannover, Germany). IL10–/– mice, OT-II, and GF C57BL/6 mice were bred at the animal facilities at the University of Marburg. GF mice generated via rederivation through cesarean section were a gift of Petra Kirsch (University of Ulm). GF animals were kept in plastic isolators (Metall and Plastik) with autoclaved food, bedding, and water. Sterility of animals was checked biweekly by culturing feces in thioglycollate medium under aerobic and anaerobic conditions for at least 10 days. All handling procedures for GF mice were conducted in a laminar flow hood under sterile conditions. Antibiotic sterilization of mice. To deplete the commensal gut microbiota, 6- to 8-week-old ConvD mice were transferred to sterile cages and orally treated with antibiotic cocktail (1 g/l ampicillin, 0.5 g/l vancomycin, 1 g/l metronidazole, 0.25 g/l imipenem, and 0.2 g/l ciprofloxacin) for 8 weeks according to a standard protocol (49). Bottles with antibiotic-containing drinking water were replaced once per week. The intestinal microbial status was tested weekly by culturing fecal samples under aerobic and anaerobic conditions in thioglycollate broth. Animal nutrition. C57BL/6 mice (SPF and GF) at 6–20 weeks of age were used. The ConvD group were kept on a conventional chow (LASQCdietRod16, LASvendi) and food antigen–free, ED mice were kept on an amino acid–containing diet for up to 5 generations. Pellets of ED diet (ssniff, S7242-E014/-E714) contained all essential vitamins, minerals, trace elements, fat, dextrin, sucrose, and free amino acids equimolar to the protein content of normal rodent chow. In summary, the ED pellets contained 20% corn starch, 44% sucrose, 7% cellulose, 17.5% amino acid mixture, 1% vitamin premix w/o choline, 5% mineral trace element premix, 0.2% choline Cl, 02% sodium bicarbonate, 0.02% butylated hydroxytoluene, 5% corn oil. Oral administration of OVA. The drinking water was supplemented with 1 mg/ml OVA (Sigma-Aldrich) for low-dose OVA application. OVA-supplemented water was given to OT-II animals for 5 or 7 days prior to analysis. Isolation of lamina propria mononuclear cells. Single-cell suspensions were performed from spleen, mLNs, and PPs by mechanical disruption and passage through filter (Milteny Biotec). Lamina propria mononuclear cells (LPMCs) of the colon and small intestine were isolated after enzymatic digestion of intestinal tissue pieces with collagenase D and collagenase VIII (MilliporeSigma, 0.4 mg/ml each). Cells were purified by Percoll gradient (40%/70 %). LPMCs were collected from the interphase, washed, and resuspended in complete medium. Small intestinal IgA. The complete small intestine was flushed with 5 ml PBS/2% milk powder, and the intestinal liquid was collected, homogenized, and centrifuged (850g, 30 minutes). Supernatants were used for IgA ELISA. In brief, flat-bottom 96-well plates (NUNC) were coated with rabbit–anti-mouse IgA (Rockland) overnight. After blocking with PBS/10% FCS, 50 μl intestinal liquid was incubated for 3 hours at 4°C, washed twice, and IgA was detected by adding the secondary rabbit–anti-mouse IgA HRP and TMB (R&D Systems). The enzymatic reaction was stopped by the addition of sulphuric acid and absorption was measured with an ELISA Reader (FLUOstar Omega, BMG Labtech). IL-10 ELISA. Single-cell suspensions from PPs, mLNs, and spleen of Conv and ED mice were cultured at a density of 2 × 10⁶ cells/200 μl RPMI medium in round-bottom 96-well tissue-culture plates for 24 hours. The next day, cell-culture supernatants were collected and IL-10 secretion was measured using a murine IL-10 ELISA kit (BD Bioscience) according to the manufacturer’s instructions. Antibodies, reagents, and staining methods. The following antibodies were obtained from eBioscience unless otherwise stated: anti-CD4 (RM4-5, BioLegend), anti-CD127 (A7R34), anti-CD62L (MEL-14), anti-CD44 (IM7, BD Biosciences), anti-CD25 (PC61.5), anti-Vα2 (B20.1), anti-B220 (RA3-6B2, BD Biosciences), anti-CD69 (H1.2F3), anti–CTLA-4 (UC10-4F10-11, BD Biosciences), anti-OX40 (OX-86), anti-CXCR5 (2G8, BD Biosciences), TCR Vβ screening panel (BD Biosciences), anti-Bcl2 (10C4), anti–PD-L1 (MIH7, BioLegend), and anti–PD-L2 (catalog 122). Anti-CD279 (anti–PD-1, clone J43) for in vivo application was purchased from Höltzel diagnostika. Detection of apoptotic cells was performed with annexin-V–FLUOS staining kit (Roche Applied Science). For intracellular cytokine staining, PP cells were stimulated for 4 hours with PMA (50 ng/ml) and ionomycin (750 ng/ml) in the presence of Brefeldin A (5 μg/ml, MilliporeSigma). Subsequently, cells were stained with anti-CD4, fixed, and permeabilized in 0.3 % saponine buffer before staining for cytokines. Intracellular staining was performed for anti–IL-10 (JES5-16E3). Foxp3- and Helios-expressing cells were routinely detected by Foxp3 staining kit (eBioscience), anti-Foxp3 (FJK-16s), and anti-Helios (22F6). Cells were analyzed by flow cytometry using the FlowJo software (Tree Star). RNA-Seq and bioinformatical analysis. RNA was purified from sorted PP CD4+ T cells of ConvD and ED mice with the RNeasy Plus Micro Kit according to the manufacturer’s protocol (Qiagen). RNA was quantified with a Qubit 2.0 fluorometer (Invitrogen) and the quality was assessed on a Bioanalyzer 2100 using an RNA 6000 Pico chip (both from Agilent). Samples with an RNA integrity number (RIN) of greater than 8 were used for library preparation. Barcoded mRNA-Seq cDNA libraries were prepared from 10 ng total RNA using NEBNext Poly(A) mRNA Magnetic Isolation Module and NEBNext Ultra II RNA Library Prep Kit for Illumina (New England Biolabs) according to the manual. Quantity was assessed using Invitrogen’s Qubit HS assay kit and library size was determined using Agilent’s 2100 Bioanalyzer HS DNA assay. Barcoded RNA-Seq libraries were onboard clustered using HiSeq Rapid SR Cluster Kit v2 using 8 pM, and 59 bps were sequenced on the Illumina HiSeq2500 using HiSeq Rapid SBS Kit v2 (59 cycle). The raw output data of the HiSeq were preprocessed according to the Illumina standard protocol. After initial quality assessment with the FastQC software (available online at http://www.bioinformatics.babraham.ac.uk/projects/fastqc/), raw output fastq sample files were trimmed and mapped with the Qiagen CLC Workbench v. 10.0.1, using the murine genome version GRCm38. Total read counts were further processed in R, using the DeSeq2 package to compute differential gene expression and adjusted P values. Normalized read counts were ranked and investigated for pathway-specific enrichment by GSEA (available online at http://software.broadinstitute.org/gsea/index.jsp) and were used for graphic representation of differential expression. The RNA-Seq microarray data were deposited in the NCBI’s Gene Expression Omnibus database (GEO GSE124286) and are available at https://www.ncbi.nlm.nih.gov/geo/query/acc.cgi?acc=GSE124286 Anti–PD-1 treatment of mice and cell cultures. WT and IL-10–deficient mice (C57BL/6 background) were administered 100 μg anti–PD-1 Ab (clone J43, Hölzel diagnostika) i.p. on days 0, 4, 8, and 12. As isotype control, animals were injected with 100 μg polyclonal Armenian hamster IgG (Hölzel diagnostika). On day 15, mice were analyzed for signs of inflammation and intestinal CD4+ T cells were collected and analyzed for apoptosis and cytokine expression by flow cytometry. For in vitro studies, 3 μg/ml anti–PD-1 mAb together with 2.5 μg/ml anti-CD3/CD28 were added to single-cell suspensions from PPs. After 3 days of culture, cells were stimulated for 4 hours with PMA/ionomycin in the presence of Brefeldin A and analyzed by FACS. Human Peyer patch T cells. Cells from PP biopsies were isolated by mechanical dissociation through 100-μm and 40-μm cell strainers. The strainers were washed with RPMI 1640 plus 1% Pen/Strep plus 10% FCS (Life Technologies, Gibco) and cells were centrifuged at 400g for 10 minutes at 4°C and resuspended in PBS (Life Technologies, Gibco) for flow cytometric analyses. For surface staining, fluorochrome-conjugated antibodies CD4 (RPA-T4) and GL7 were added and incubated for 15 minutes at 4°C. For the annexin V staining, cells were resuspended in binding buffer and stained with annexin V and 7-AAD (Annexin V Apoptosis Detection Kit, eBioscience). For intracellular staining of cytokines and transcription factors (Bcl2 [100/D5+124], Foxp3 [PCH101], and Helios [22F6]), cells were fixed, permeabilized, and stained using the Foxp3 staining kit (eBioscience). Flow cytometry analysis was performed on a FACS Canto II (BD Bioscience). Data were analyzed with FlowJo analysis software. Treg suppression assay. Suppressive properties of Tregs and CD4+Helios+Foxp3– cells from PPs were compared. CD4+GFP– responder T cells from spleen and enriched Helios-expressing CD4+GFP–CD44+CD62L– T cells were sorted from PPs of DEREG mice. As positive control, iTregs were generated from sorted naive CD4+ T cells of DEREG mice. In brief, cells were activated by plate-bound anti-CD3 (5 μg/ml; 145-2C11) and soluble anti-CD28 (1 μg/ml; 37.51) in the presence of IL-2 (50 U/ml, Novartis), TGF-β1 (2 ng/ml, R&D Systems), anti–IL-4 (10% culture supernatant of clone 11B11), and anti–IFN-γ (5 μg/ml, XMG1-2) for 3 days. Responder T cells were labeled with CFSE and cocultured for 3 days with Tregs or Helios-expressing T cells from PPs in the presence of 1 μg/ml soluble anti-CD3 (clone 145-2C11) and irradiated T cell–depleted splenocytes. Proliferative responses of responder cells were analyzed by FACS. BrdU incorporation assay. To label proliferating cells in vivo, 1 mg BrdU (Sigma-Aldrich) in 200 μl PB was injected i.p. and animals were subsequently supplied with BrdU (0.8 mg/ml) in drinking water for 5 days. Cell suspensions were stained with anti-CD4 and anti-BrdU (eBioscience). The percentage of BrdU+ T cells was assessed by FACS. Western blot analysis. CD44+ and CD44– T lymphocytes were sorted from PPs of C57BL/6 mice and lysed directly in 4× Laemmli sample buffer (with 5% ß-mercaptoethanol). Proteins were separated by SDS-PAGE and transferred to nitrocellulose membrane. The following antibodies were used for immunoblot analysis: anti-GAPDH as loading control, mouse anti-PARP, rabbit anti–caspase-3, mouse anti–caspase-8, and rabbit anti–caspase-9 (Cell Signaling Technology). Immunofluorescence analysis. Tissue samples were snap frozen in methylbutane cooled with liquid nitrogen. Cryosections of about 5 μm were made with a Frigocut 2800E (Leica), air-dried, and incubated for 20 minutes in ice-cold acetone and stored at –20°C or washed 3 times with PBST for immunostaining. Following incubation in antibody diluent (Dako), samples were incubated with primary antibodies for 2 hours at room temperature followed by washing 3 times in PBST. The following primary antibodies were used: anti-mouse CD4–Alexa Fluor 646 (BioLegend) and anti-mouse GL7-FITC (BD Biosciences). Confocal images of cryosections were acquired by fluorescence microscopy on a Leica TCS SP2 microscope (Leica Microsystems). Statistics. Statistical analysis was performed using Prism software (GraphPad Software). Results are generally expressed as the mean ± SEM. Data were analyzed using the Student’s t test or Mann-Whitney U test as indicated. Values with P less than or equal to 0.05 were considered statistically significant. Study approval. All patients gave written consent after approval by the Charité ethics committee (EA4/097/14). All animal experiments were conducted in accordance with German animal protection laws and were approved by the RP-Giessen (MR 20/6 1/2018 and EX7-2015). Author contributions US and AV directed and designed the experiments and analyzed the data. PWB, OP, ML, and BS gave scientific advice and critically read the manuscript. AV, SH, ML, HR, RR, and FF performed the animal experiments and in vitro studies. RJ and AP performed the histological analysis. HM, WB, and MK performed and evaluated RNA-Seq experiments. KR performed the molecular and biochemical studies. YRS, RG, and BS conducted the human studies. US and AV wrote the manuscript. Supplemental material View Supplemental data Acknowledgments We thank Anne Hellhund and Carrie Anderson for expert technical help and Guido Schemken, Hosam Shams-Eldin, and Claudia Trier for the animal care. We thank Allan Mowat and Ayse Kilic for discussion and critical reading of the manuscript. Parts of this work were funded by BMBF (Federal Ministry of Education and Research, JPI-AMR – FKZ 01Kl1702; ERACoSysMed2 – SydMed-COPD – FKZ 031L0140) and DFG (German Research Foundation, SFB/TR-84 TP C01) to BS. This study was supported by the von Behring-Röntgen-Stiftung (66-0008) and the DFG Priority Programm to US (STE 776/3-1) and BS (SI 749/9-1). Footnotes Conflict of interest: The authors have declared that no conflict of interest exists. Copyright: © 2019, American Society for Clinical Investigation. Reference information: J Clin Invest. https://doi.org/10.1172/JCI98929. References Brandtzaeg P. Food allergy: separating the science from the mythology. Nat Rev Gastroenterol Hepatol. 2010;7(7):380–400. View this article via: PubMed CrossRef Google Scholar Pabst O, Mowat AM. Oral tolerance to food protein. Mucosal Immunol. 2012;5(3):232–239. View this article via: PubMed CrossRef Google Scholar Kawaguchi T, et al. Food antigen-induced immune responses in Crohn’s disease patients and experimental colitis mice. J Gastroenterol. 2015;50(4):394–405. View this article via: PubMed CrossRef Google Scholar Nakahigashi M, Yamamoto T, Sacco R, Hanai H, Kobayashi F. Enteral nutrition for maintaining remission in patients with quiescent Crohn’s disease: current status and future perspectives. Int J Colorectal Dis. 2016;31(1):1–7. View this article via: PubMed CrossRef Google Scholar Assor E, Marcon MA, Hamilton N, Fry M, Cooper T, Mahmud FH. Design of a dietary intervention to assess the impact of a gluten-free diet in a population with type 1 Diabetes and Celiac Disease. BMC Gastroenterol. 2015;15:181. View this article via: PubMed Google Scholar Groetch M, Nowak-Wegrzyn A. Practical approach to nutrition and dietary intervention in pediatric food allergy. Pediatr Allergy Immunol. 2013;24(3):212–221. View this article via: PubMed CrossRef Google Scholar Chen Y, Kuchroo VK, Inobe J, Hafler DA, Weiner HL. Regulatory T cell clones induced by oral tolerance: suppression of autoimmune encephalomyelitis. Science. 1994;265(5176):1237–1240. View this article via: PubMed CrossRef Google Scholar Chen Y, Inobe J, Marks R, Gonnella P, Kuchroo VK, Weiner HL. Peripheral deletion of antigen-reactive T cells in oral tolerance. Nature. 1995;376(6536):177–180. View this article via: PubMed CrossRef Google Scholar Friedman A, Weiner HL. Induction of anergy or active suppression following oral tolerance is determined by antigen dosage. Proc Natl Acad Sci U S A. 1994;91(14):6688–6692. View this article via: PubMed CrossRef Google Scholar Kim KS, et al. Dietary antigens limit mucosal immunity by inducing regulatory T cells in the small intestine. Science. 2016;351(6275):858–863. View this article via: PubMed CrossRef Google Scholar Esterházy D, Loschko J, London M, Jove V, Oliveira TY, Mucida D. Classical dendritic cells are required for dietary antigen-mediated induction of peripheral T(reg) cells and tolerance. Nat Immunol. 2016;17(5):545–555. View this article via: PubMed CrossRef Google Scholar Fujihashi K, et al. Peyer’s patches are required for oral tolerance to proteins. Proc Natl Acad Sci U S A. 2001;98(6):3310–3315. View this article via: PubMed CrossRef Google Scholar Kraus TA, et al. Induction of mucosal tolerance in Peyer’s patch-deficient, ligated small bowel loops. J Clin Invest. 2005;115(8):2234–2243. View this article via: JCI PubMed CrossRef Google Scholar Mucida D, Kutchukhidze N, Erazo A, Russo M, Lafaille JJ, Curotto de Lafaille MA. Oral tolerance in the absence of naturally occurring Tregs. J Clin Invest. 2005;115(7):1923–1933. View this article via: JCI PubMed CrossRef Google Scholar Song F, et al. The Peyer’s patch is a critical immunoregulatory site for mucosal tolerance in experimental autoimmune encephalomylelitis (EAE). J Autoimmun. 2008;30(4):230–237. View this article via: PubMed CrossRef Google Scholar Chung H, et al. Gut immune maturation depends on colonization with a host-specific microbiota. Cell. 2012;149(7):1578–1593. View this article via: PubMed CrossRef Google Scholar Akimova T, Beier UH, Wang L, Levine MH, Hancock WW. Helios expression is a marker of T cell activation and proliferation. PLoS One. 2011;6(8):e24226. View this article via: PubMed CrossRef Google Scholar Bilate AM, Lafaille JJ. Induced CD4+Foxp3+ regulatory T cells in immune tolerance. Annu Rev Immunol. 2012;30:733–758. View this article via: PubMed CrossRef Google Scholar Gottschalk RA, Corse E, Allison JP. Expression of Helios in peripherally induced Foxp3+ regulatory T cells. J Immunol. 2012;188(3):976–980. View this article via: PubMed CrossRef Google Scholar Scurr M, et al. Highly prevalent colorectal cancer-infiltrating LAP+ Foxp3+ T cells exhibit more potent immunosuppressive activity than Foxp3+ regulatory T cells. Mucosal Immunol. 2014;7(2):428–439. View this article via: PubMed CrossRef Google Scholar Rogers PR, Song J, Gramaglia I, Killeen N, Croft M. OX40 promotes Bcl-xL and Bcl-2 expression and is essential for long-term survival of CD4 T cells. Immunity. 2001;15(3):445–455. View this article via: PubMed CrossRef Google Scholar Chung EY, et al. Interleukin-10 expression in macrophages during phagocytosis of apoptotic cells is mediated by homeodomain proteins Pbx1 and Prep-1. Immunity. 2007;27(6):952–964. View this article via: PubMed CrossRef Google Scholar Voll RE, Herrmann M, Roth EA, Stach C, Kalden JR, Girkontaite I. Immunosuppressive effects of apoptotic cells. Nature. 1997;390(6658):350–351. View this article via: PubMed CrossRef Google Scholar Sharpe AH, Pauken KE. The diverse functions of the PD1 inhibitory pathway. Nat Rev Immunol. 2018;18(3):153–167. View this article via: PubMed Google Scholar Scheinin T, Butler DM, Salway F, Scallon B, Feldmann M. Validation of the interleukin-10 knockout mouse model of colitis: antitumour necrosis factor-antibodies suppress the progression of colitis. Clin Exp Immunol. 2003;133(1):38–43. View this article via: PubMed CrossRef Google Scholar Rebollo A, Schmitt C. Ikaros, Aiolos and Helios: transcription regulators and lymphoid malignancies. Immunol Cell Biol. 2003;81(3):171–175. View this article via: PubMed CrossRef Google Scholar Daley SR, Hu DY, Goodnow CC. Helios marks strongly autoreactive CD4+ T cells in two major waves of thymic deletion distinguished by induction of PD-1 or NF-κB. J Exp Med. 2013;210(2):269–285. View this article via: PubMed CrossRef Google Scholar O’Moráin C, Segal AW, Levi AJ. Elemental diet as primary treatment of acute Crohn’s disease: a controlled trial. Br Med J (Clin Res Ed). 1984;288(6434):1859–1862. View this article via: CrossRef Google Scholar Hunter J. Elemental diet and the nutritional treatment of Crohn’s disease. Gastroenterol Hepatol Bed Bench. 2015;8(1):4–5. View this article via: PubMed Google Scholar Kunkel D, Kirchhoff D, Nishikawa S, Radbruch A, Scheffold A. Visualization of peptide presentation following oral application of antigen in normal and Peyer’s patches-deficient mice. Eur J Immunol. 2003;33(5):1292–1301. View this article via: PubMed CrossRef Google Scholar Nagata S, et al. Human Peyer’s patch T cells are sensitized to dietary antigen and display a Th cell type 1 cytokine profile. J Immunol. 2000;165(9):5315–5321. View this article via: PubMed CrossRef Google Scholar Ugur M, Schulz O, Menon MB, Krueger A, Pabst O. Resident CD4+ T cells accumulate in lymphoid organs after prolonged antigen exposure. Nat Commun. 2014;5:4821. View this article via: PubMed Google Scholar Salazar-Gonzalez RM, et al. CCR6-mediated dendritic cell activation of pathogen-specific T cells in Peyer’s patches. Immunity. 2006;24(5):623–632. View this article via: PubMed CrossRef Google Scholar Niess JH, et al. CX3CR1-mediated dendritic cell access to the intestinal lumen and bacterial clearance. Science. 2005;307(5707):254–258. View this article via: PubMed CrossRef Google Scholar Coombes JL, et al. A functionally specialized population of mucosal CD103+ DCs induces Foxp3+ regulatory T cells via a TGF-beta and retinoic acid-dependent mechanism. J Exp Med. 2007;204(8):1757–1764. View this article via: PubMed CrossRef Google Scholar Sun CM, et al. Small intestine lamina propria dendritic cells promote de novo generation of Foxp3 T reg cells via retinoic acid. J Exp Med. 2007;204(8):1775–1785. View this article via: PubMed CrossRef Google Scholar Thornton AM, et al. Expression of Helios, an Ikaros transcription factor family member, differentiates thymic-derived from peripherally induced Foxp3+ T regulatory cells. J Immunol. 2010;184(7):3433–3441. View this article via: PubMed CrossRef Google Scholar Miyao T, et al. Plasticity of Foxp3(+) T cells reflects promiscuous Foxp3 expression in conventional T cells but not reprogramming of regulatory T cells. Immunity. 2012;36(2):262–275. View this article via: PubMed CrossRef Google Scholar Serre K, et al. Helios is associated with CD4 T cells differentiating to T helper 2 and follicular helper T cells in vivo independently of Foxp3 expression. PLoS One. 2011;6(6):e20731. View this article via: PubMed CrossRef Google Scholar Diveu C, et al. IL-27 blocks RORc expression to inhibit lineage commitment of Th17 cells. J Immunol. 2009;182(9):5748–5756. View this article via: PubMed CrossRef Google Scholar Fitzgerald DC, et al. Suppression of autoimmune inflammation of the central nervous system by interleukin 10 secreted by interleukin 27-stimulated T cells. Nat Immunol. 2007;8(12):1372–1379. View this article via: PubMed CrossRef Google Scholar Keir ME, Butte MJ, Freeman GJ, Sharpe AH. PD-1 and its ligands in tolerance and immunity. Annu Rev Immunol. 2008;26:677–704. View this article via: PubMed CrossRef Google Scholar Bertha M, Bellaguara E, Kuzel T, Hanauer S. Checkpoint inhibitor-induced colitis: a new type of inflammatory bowel disease? ACG Case Rep J. 2017;4:e112. View this article via: PubMed Google Scholar Chen JH, Pezhouh MK, Lauwers GY, Masia R. Histopathologic features of colitis due to immunotherapy with anti-PD-1 antibodies. Am J Surg Pathol. 2017;41(5):643–654. View this article via: PubMed CrossRef Google Scholar Kim J, et al. Anti-PD-1 induced colitis: a case series of 25 patients. Gastroenterology. 2017;152(5):S811. Fujimura Y, Kamoi R, Iida M. Pathogenesis of aphthoid ulcers in Crohn’s disease: correlative findings by magnifying colonoscopy, electron microscopy, and immunohistochemistry. Gut. 1996;38(5):724–732. View this article via: PubMed CrossRef Google Scholar Fujimura Y, Hosobe M, Kihara T. Ultrastructural study of M cells from colonic lymphoid nodules obtained by colonoscopic biopsy. Dig Dis Sci. 1992;37(7):1089–1098. View this article via: PubMed CrossRef Google Scholar Van Kruiningen HJ, Ganley LM, Freda BJ. The role of Peyer’s patches in the age-related incidence of Crohn’s disease. J Clin Gastroenterol. 1997;25(2):470–475. View this article via: PubMed CrossRef Google Scholar Rakoff-Nahoum S, Paglino J, Eslami-Varzaneh F, Edberg S, Medzhitov R. Recognition of commensal microflora by toll-like receptors is required for intestinal homeostasis. Cell. 2004;118(2):229–241. View this article via: PubMed CrossRef Google Scholar Version history Version 1 (April 2, 2019): Electronic publication
|
|
Scooped by
Gilbert C FAURE
March 7, 2019 3:00 AM
|
Abstract Mucosal‐associated invariant T (MAIT) cells develop in the thymus and migrate into the periphery to become the largest antigen‐specific αβ T‐cell population in the human immune system. However, the frequency of MAIT cells varies widely between human individuals, and the basis for this is unclear. While MAIT cells are highly conserved through evolution and are phenotypically similar between humans and mice, they represent a much smaller proportion of total T cells in mice. In this review, we discuss how MAIT cells transition through a three‐stage development pathway in both mouse and human thymus, and continue to mature and expand after they leave the thymus. Moreover, we will explore and speculate on how specific factors regulate different stages of this process. Introduction Mucosal‐associated invariant T (MAIT) cells are a highly conserved population of T lymphocytes that exhibit innate‐like functions similar to those described for natural killer T (NKT) cells.1-4 MAIT cells are defined by their invariant T‐cell receptor (TCR)‐α chain, and their restriction to the nonpolymorphic major histocompatibility complex class I‐like molecule, MHC‐related protein 1 (MR1).2 In mice, MAIT cells express a TCR comprising of Vα19 joined to Jα33, which pairs with Vβ6 or Vβ8.5-7 In humans, MAIT cells predominantly express Vα7.2 joined to Jα33, Jα20 or Jα12, and these pair with Vβ2 or Vβ13.3, 5, 7 Smaller subsets of MR1‐restricted Vα7.2− T cells have been identified in humans,8-10 although this review will focus on the major population of Vα7.2+ MAIT cells, herein simply described as MAIT cells. In this issue, Lantz and Legoux11 provide a historical perspective of the MAIT cell field, including the initial identification and the description of MAIT cells as “mucosal‐associated” due to their presence within the gut lamina propria.2 It is now appreciated that MAIT cells can be found in all sites where conventional T cells are present,6, 12, 13 although functionally distinct subsets of MAIT cell exist at mucosal sites, suggesting an important role for these cells in barrier tissue immunity.12, 14 MAIT cells are abundant in humans, making up to 10% of T cells in peripheral blood and up to 50% in the liver,14, 15 yet their frequency can significantly vary between individuals.13, 15-17 In mice, the frequency of MAIT cells is much lower, and it is currently unclear what factors regulate MAIT cell numbers and cause this disparity between species.6, 7, 16 Our understanding of human MAIT cells has progressed predominantly through the study of CD3+ Vα7.2+ CD161hi T cells, which incorporates most MAIT cells in peripheral blood and organs.13, 18, 19 Conversely, because MAIT cell numbers in laboratory mice are very low, and monoclonal antibodies against the invariant mouse MAIT TCRα chain do not exist, Vα19Jα33 transgenic mice were established to investigate the biology of mouse MAIT cells.16, 20 The discovery of riboflavin derivatives as antigens (Ags) for MAIT cells21, 22 (described in this issue by Kjer‐Nielsen, Corbett and colleagues23), coupled with the production of MR1 tetramers that incorporate these Ags,5 has fueled new studies into the development and function of MAIT cells. These tetramer reagents now provide a basis for distinguishing MAIT cells from other T‐cell populations that share similar phenotypic markers.8, 9, 24, 25 MR1 is expressed at low levels in a wide range of tissues26, 27 and shows strong evolutionary conservation between species.28 This, together with the broad microbial reactivity of MAIT cells suggests that they play a key role in host immunity.29-32 The role that MAIT cells play in microbial immunity is extensively reviewed in this issue by Ussher, Willberg and Klenerman (MAIT cells and Viruses)33 and Meermeier, Harriff, Karamooz and Lewinsohn (MAIT cells and Microbial Immunity).34 Given the wide variation in MAIT cell frequency between individuals13, 16, 19, 35 and evidence that reduced MAIT cell numbers are associated with aberrant immune responses in humans and mice,29-31, 36-39 it is important to understand how MAIT cells develop and determine what factors regulate this process. In this review, we describe how MAIT cells undergo a three‐stage development pathway within the thymus and continue to mature after they enter the periphery, in both mice and humans. In addition, we examine similarities and differences with the development of NKT cells, which may compete with MAIT cells for a similar environmental niche. Thymic Selection Studies in mice revealed that MAIT cells arise intrathymically following interaction of the MAIT TCR with MR1.2, 7, 16, 40 Furthermore, analysis of Vα19‐Jα33 Cα−/− and Vβ6 transgenic mice revealed that MAIT cells are selected by MR1‐expressing DP cortical thymocytes, compared to thymic epithelial cells that select MHC/peptide reactive T cells.40 It is currently unclear whether specific Ags must be presented in association with MR1 for intrathymic selection, and if so, the nature of the selecting Ags. Selection may require agonist ligands like the MAIT activating riboflavin derivative Ags such as 5‐(2‐oxopropylideneamino)‐6‐d‐ribitylaminouracil (5‐OP‐RU) and 5‐(2‐oxoethylideneamino)‐6‐d‐ribitylaminouracil (5‐OE‐RU).22 Alternatively, MAIT cells might be selected by a weak or nonagonist Ag, such as 6‐formylpterin (6‐FP), a vitamin B9 derivative that binds to MR1 but does not activate the majority of MAIT cells.21, 41 Although these vitamin‐derivative Ags have microbial or dietary origins, it is also possible that MAIT cells are selected in the context of an endogenous self‐Ag produced in the thymus. Early evidence supported a role for microbial derived Ags for the selection of MAIT cells as these cells could not be detected in germ‐free (GF) mice using RT‐PCR.2 We recently re‐examined GF mice using MR1 tetramers and detected the presence of normal numbers of immature MAIT cells in the thymus, but these cells were unable to fully mature and expand in the periphery.24 These data suggest that microbial colonization is not required for the initial selection of MAIT cells, but is essential for their subsequent expansion.16, 24 Another important question surrounding the selection of MAIT cells is whether their TCR repertoire is shaped by negative selection. Like MAIT cells, NKT cells are selected by DP cortical thymocytes,42 and in vivo injection of the NKT cell agonist Ag α‐galactosylceramide or the addition of this lipid Ag to fetal thymic organ cultures ablated the development of mouse NKT cells, suggesting these cells had undergone negative selection.43, 44 It will be important to establish if similar selection criteria also exist for MAIT cells. For instance, would the overexpression of MR1 or the presence of a high affinity Ag lead to the deletion of MAIT cells? Accordingly, further studies are required to examine the types of Ags (if any) that govern the intrathymic selection of MAIT cells. A Three‐Stage Pathway for MAIT Cell Development in Mice and Humans Analysis of MAIT cells from the periphery of WT mice using MR1‐5‐OP‐RU tetramers revealed that they expressed high levels of CD44 and had a memory phenotype, whereas most MAIT cells from Vα19‐Jα33 Cα−/− transgenic mice lacked CD44 expression and were described as naïve.6, 16 Moreover, and in contrast to previous findings,16 MAIT cells from WT mice expressed the transcription factor, promyelocytic leukemia zinc finger (PLZF).6, 45 PLZF was previously reported to be required for the development of other innate‐like T cells such as NKT cells,46, 47 innate lymphoid cells48, 49 and some γδ T cells.50, 51 These data highlight important differences in the phenotype of MAIT cells from WT and Vα19 transgenic mice and suggest that the overexpression of the mouse MAIT TCR α‐chain likely alters the development of MAIT cells. Our studies of mouse thymus revealed three populations of MAIT cells based on their expression of CD24 and CD44, including CD24+CD44−, CD24−CD44− and CD24−CD44+ MAIT cells.24 Through a combination of phenotypic analysis, ontogeny experiments and in vitro development studies, we determined that the CD24+CD44− population were least mature, defined as stage 1 MAIT cells. These give rise to CD24−CD44− stage 2 cells and ultimately these differentiate into CD24−CD44+ stage 3 cells, which more closely resemble MAIT cells in the periphery (Figure 1). Importantly, MR1 expression appears to be required at each stage of development, as progression from stage 1 to stage 3 in vitro, is severely impaired by the addition of an anti‐MR1 blocking antibody.24 These distinct MAIT cell precursor populations were further characterized for expression of differentiation markers, cytokine receptors and transcription factors (Table 1). For example, PLZF is not expressed in stage 1 MAIT cells, while mature populations of stage 3 MAIT cells express PLZF.24 This contrasts with the development of NKT cells, as early NKT cell progenitors express high levels of PLZF, and expression levels decline to moderate levels as NKT cells become more mature, with the notable exception of NKT2 cells that express high levels of PLZF (discussed below).46 Analysis of PLZF‐null mice revealed that the development of stage 1 and 2 MAIT cells was unperturbed, while mature stage 3 cells failed to develop within the thymus and periphery. Moreover, residual MAIT cells from PLZF‐null mice were unable to produce cytokines and were hence functionally incompetent.24 Therefore, PLZF is a critical factor governing the transition from stage 2 to stage 3 MAIT cells, as well as the acquisition of MAIT cell functional potential. Stage 1 Stage 2 Stage 3 CD4 and CD8 coreceptor CD4+, CD8+ or CD4+CD8+ h: CD4+, CD8+ or CD4+CD8+ CD4+, CD8+ or m: CD4+, CD8+ or CD4−CD8− CD4−CD8− CD8αβ CD8αβ+ CD8αβ+ CD8αβ+ CD24 (m) Positive Negative Negative CD27 (h) Negative Positive Low to positive CD44 (m) Negative Negative Positive CD62L (m) Intermediate n.d. Negative CD69 (m) Positive n.d. Negative CD103 (m) Negative n.d. Low to positive CD161 (h) Negative Negative Positive (h) NK1.1 (m) Low to positive (m) CD278/ICOS (m) Negative n.d. Positive Cytokine receptors CD122/IL‐2Rβ (m) Negative n.d. Intermediate CD127/IL‐7R (m) Negative n.d. Positive CD218/IL‐18R Negative n.d. Positive Transcription factors PLZF Negative Low Positive T‐bet and RORγt Low Low T‐bet+ or RORγt+ (m) T‐bet+ RORγt+ (h) n.d. = not determined; m = mouse; h = human. Most studies on MAIT cell development in humans have utilized surrogate markers, such as Vα7.2 or co‐expression of Vα7.2 and CD161, to identify MAIT cells. Using this strategy, MAIT‐like cells could be detected within human thymus and were shown to express PLZF.16, 52, 53 Moreover, Leeansyah and colleagues examined a panel of human fetal tissues including the thymus and cord blood, and described a maturation pathway of microbial reactive Vα7.2+ CD161+ cells.52 Our laboratory examined MAIT cells from human thymus using MR1 tetramers and similar to our mouse studies, we identified three populations of MAIT precursors based on the differential expression of cell surface markers.24 Ontogeny and functional studies showed that stage 1 human MAIT cells could be defined as CD27−CD161−, followed by stage 2 CD27+CD161− and then stage 3 CD27lo/+CD161+ (Figure 1 and Table 1). Moreover, the expression of CD161 on MAIT cells from human thymus also coincided with the expression of IL‐18R, the latter expressed by stage 3 thymic MAIT cells from both humans and mice (Table 1).24 Notably, the vast majority of human thymic MAIT cells lack expression of CD161 and these cells would have been excluded from previous studies that relied on CD161 as a surrogate marker of MAIT cells.16, 24, 52 In addition, we also found many MAIT‐like Vα7.2+ CD161+ T cells in human thymus that do not bind MR1‐5‐OP‐RU tetramer, a result that was recently observed by another group with human cord blood and neonatal blood samples.25 The majority of peripheral blood MAIT cells have upregulated CD161 and IL‐18R, although residual CD161− IL‐18R− MAIT cells could still be found in cord blood and young peripheral blood.24 These data reveal that MAIT cells upregulate CD161 and IL‐18R as they exit the thymus or soon after they enter the periphery. Factors That Regulate MAIT Cell Development The identification of a three‐stage development pathway for MAIT cells now allows for a detailed assessment of factors that influence this process. In addition to PLZF, we also showed that microRNAs are critical for MAIT cell development, as mice deficient for a member of the RNase III superfamily, Drosha, have drastically reduced MAIT cells and accumulate stage 1 thymic MAIT cells.24 NKT cells were also diminished in these mice, supporting previous data that microRNAs are required for NKT cell development.54 Future studies should investigate which specific microRNAs are important for MAIT cell development and whether there is overlap with the microRNAs shown to be important for the development of NKT cells (e.g. miR150,55 miR‐181 family56 and miR17–92 family cluster57). Let‐7 microRNAs will be an important candidate to investigate, as they have been shown to directly target the Zbtb16 gene and downregulate PLZF expression in NKT cells.58 The loss of IL‐18 and commensal microbiota from GF mice impaired MAIT cell numbers and progression to stage 3 MAIT cells.24 A previous study also showed that B cells were not required for MAIT cell development, but were required for peripheral expansion.16 Given that thymic precursors for MAIT cells and NKT cells express similar (but not identical) phenotypic markers and both require PLZF and microRNAs for their development, future studies will likely assess whether other factors are common for their development. For instance, several members of the NFkB family of transcription factors have been shown to be important for NKT cell development.59 Furthermore, mice deficient for the transcription factors Rorγt, HeLa E‐box binding protein and c‐Myb, have fewer NKT cells as they are unable to rearrange the distal TCR gene segments due to reduced lifespan of DP thymocytes.59 Hence, factors that affect thymocyte survival may impact on the development of MAIT cells as the gene encoding the MAIT TCR Vα‐chain (Vα19) is located at the extreme end of the 5′ end of the TCRα locus.60 Inhibitors of DNA transcription factors (Id2 and Id3), which interact with E proteins, have also been implicated in the development and differentiation of NKT cells,61-64 and more recently, we showed that members of the linear ubiquitin chain assembly complex, Hoil and Hoip, were required for normal NKT cell development in the thymus.65 Interestingly, the SLAM/SAP/Fyn pathway does not appear to be necessary for the development of MAIT cells, whereas it is important for the development of NKT cells.16, 66-69 The use of MR1 tetramers in candidate gene knockout mice should lead to the discovery of key molecules that are important for the development of MAIT cells and these can be compared with those that regulate the development of NKT cells. MAIT Cell Heterogeneity At least two functionally distinct subsets of stage 3 MAIT cells exist in mice and these develop following the expression of PLZF.24 The major population of MAIT cells in mice expresses RORγt and secretes IL‐17 upon activation, while a smaller subset expresses T‐bet and produces IFN‐γ upon activation.6, 24 With the exception of PLZF which is high on both these populations, they are reminiscent of mouse PLZFlo T‐bethi NKT1 cells and PLZFint Rorγt+ NKT17 cells, which secrete IFN‐γ and IL‐17, respectively.70 Notably, mouse thymus contains a third population of NKT cells, termed NKT2 cells, which are PLZFhi T‐betlo cells and predominantly produce IL‐4.70 While low levels of IL‐4 production were detected upon stimulation of mouse thymic MAIT cells,6 a defined population of MAIT cells that are equivalent to NKT2 cells has yet to be identified. In human thymus and peripheral blood, stage 3 MAIT cells coexpress intermediate levels of T‐bet and RORγt and secrete predominantly IFN‐γ and TNF upon activation.12, 18, 24, 71-73 This differs to stage 3 MAIT cells from naïve mice, which are mutually exclusive for T‐bet and RORγt expression, although intranasal infection of mice with Salmonella Typhimurium causes MAIT cells to coexpress these transcription factors. Thus, previously activated MAIT cells in mice appear to more closely resemble their human counterparts.32 While very few MAIT cells from human blood appear to produce IL‐17, MAIT cells from other human tissues can secrete IL‐17. For instance, MAIT cells isolated from the female genital tract express more IL‐17 in response to microbial stimuli compared to MAIT cells from peripheral blood.12 Moreover, tissue resident MAIT cells isolated from human liver vascular beds were the dominant population of IL‐17 producing T cells from this tissue14 and several studies have reported a role for IL‐17 producing MAIT cells in various autoimmune diseases (reviewed in this issue by Rouxel and Lehuen).74 Accordingly, mice and humans contain functionally distinct populations of MAIT cells, although the precise molecular mechanisms that underpin the differentiation into each distinct population remain largely unknown. Extrathymic Development of MAIT Cells MAIT cells continue to mature after they exit the thymus. While stage 3 MAIT cells from human and mouse thymus coexpress CD8α and CD8β, many peripheral MAIT cells express CD8α with low or no CD8β.5, 24, 52 These data suggest that CD8αα+ MAIT cells are likely derived from CD8αβ+ MAIT cells.18, 52 Moreover, stage 3 MAIT cells from human thymus have a limited capacity to produce cytokines compared to stage 3 MAIT cells from human blood, suggesting they undergo further maturation in the periphery. In support of this, stage 2 MAIT cells could be detected in the cord blood and the peripheral blood from young donors and stage 2 MAIT cells could be detected in the periphery of PLZF null mice, revealing that MAIT cells can exit the thymus as stage 2 cells, prior to further maturation to stage 3 cells in the periphery.24 It is currently unclear what factors drive extrathymic development of MAIT cells, whether it is direct exposure to microbial Ags or other environmental signals such as IL‐18 and/or other cytokines.24 The variation in MAIT cell frequency between humans and mice highlights important differences in the development and expansion of MAIT cells between these species. Several factors have been proposed to explain these differences. The housing of mice in specific pathogen‐free conditions likely limits their exposure to microbial Ags and, as described above, MAIT cells are drastically reduced in GF conditions.2, 24 Interestingly, attempts to reconstitute GF mice with monomicrobial flora or human microbiota only recovered MAIT cell numbers to levels akin to mice housed in specific pathogen‐free conditions, thus levels well below those found in humans.29, 45 In contrast, intranasal inoculation of mice with Francisella tularensis or Salmonella Typhimurium leads to rapid expansion of MAIT cells within the lungs of infected mice, levels more consistent with those observed in humans.31, 32 Future studies will likely examine whether mice caught from the wild or obtained from pet shops have elevated MAIT cells due to increased microbial exposure. Homeostasis and Expansion of MAIT Cells Genetic variability may also contribute to differences in MAIT cell frequency. For example, Cui et al. showed that Castaneus mice, a strain of mice originally derived from the wild but housed in specific pathogen‐free conditions, had a 20‐fold increase in MAIT cell numbers compared to common laboratory strains.45 The higher number of MAIT cells in Castaneus mice was not due to differences in thymocyte survival but rather to an increase in Vα19‐Jα33 transcripts that was linked to a genetic factor mapped to the Castaneus TCRα locus.45 Intriguingly, we recently showed that MAIT cells are over‐represented in NKT cell deficient CD1d−/− mice, suggesting that NKT cells and MAIT cells compete for a similar environmental niche (Figure 1).24 This has important implications for the field because NKT cell deficient mice are often used to assess the role of NKT cells in disease models and it is unclear how MAIT cells contribute to these diseases.75, 76 Furthermore, the frequency of MAIT cells and NKT cells in mice is inversed in humans, such that humans have high numbers of MAIT cells and low numbers of NKT cells, while the reverse is true in mice.4 Hence, it will be interesting to determine what factors these innate‐like T cells are competing for, and if other cell types are also involved in this interplay. For example, it was recently shown in mice that innate lymphoid cells compete with T cells for a limited supply of IL‐7.77 Furthermore, IL‐7 is also required for the homeostasis and survival of mouse NKT17 cells.78 In contrast to these findings in mice, we recently demonstrated a direct correlation in the frequency of MAIT cells and NKT cells in blood from the same human donor.19 A similar correlation between MAIT cells and NKT cell frequencies was shown in neonates in a recent study by Ben Youssef and colleagues.25 Moreover, they also demonstrated a parallel relationship between Vα7.2+ and Vα7.2− subsets of CD161+ T cells and while the latter population did not bind MR1 tetramer, their data suggests that both populations undergo a similar postnatal development pathway.25 These reports collectively support the concept that MAIT cells, NKT cells and related lineages share environmental maintenance factors, such that when the factors are abundant, these cell populations are increased in blood. Clearly, more work is required to fully appreciate the interactions that maintain innate‐like T cells in the immune system. The high abundance of MAIT cells in humans is likely due to ongoing exposure to microbial stimuli, which drives oligoclonal expansion of MAIT cells that have a reduced TCR repertoire.7, 45, 79 The frequency of MAIT cells increases with age such that very few MAIT cells are observed in the cord blood, presumably due to limited microbial exposure in the womb, while the numbers of MAIT cells increase in the blood from neonates and steadily rise until young adulthood (~30 years of age) before declining over subsequent decades16, 18, 24, 25, 35, 52, 80 (Figure 2). It is currently unclear how reduced numbers of MAIT cells impacts on the immune system of older individuals, although it is well described that as humans age they become increasingly immunocompromised.81, 82 Thus, one key factor that underpins the variability of MAIT cells in humans appears to be age, with optimal MAIT cell numbers coinciding with optimal immunological fitness. Taken together, these data highlight how MAIT cells continue to develop and expand after they exit the thymus and this process is likely dependent on microbial stimuli. Concluding Remarks MAIT cells, on average, represent the most abundant αβ T‐cell population with a single specificity in the human immune system. Understanding MAIT cell development and homeostasis cells may provide important clues as to why MAIT cell numbers vary between individuals (and species). The recent mapping of a three‐stage MAIT cell development pathway in mice and humans is facilitating further studies to determine the factors that govern this process. There appears to be functional overlap of MAIT cells with other innate‐like T‐cell populations and we must carefully assess the role of these different cell types in the context of microbial immunity. It will also be interesting to address how other related T‐cell subsets develop, including atypical MR1‐restricted Vα7.2− T cells and populations of Vα7.2−CD161+ T cells, that do not bind MR1 tetramer but share similar characteristics with MAIT cells. Future studies into the development and homeostasis of MAIT cells (and related subsets thereof) may lead to the identification of novel targets to modulate the numbers of these cells which would be valuable in settings where they are depleted, potentially leading to a compromised immune system, such as in cancer and HIV patients. Acknowledgments DGP is supported by a National Health and Medical Research Council (NHMRC) Career Development Fellowship (1144308). DIG is supported by an NHMRC Senior Principal Research Fellowship (1020770 and 1117766). The authors are supported by NHMRC project grants 1145373, 1122890 and 1140126 and the Australian Research Council (ARC; CE140100011). Conflict of Interest The authors declare no conflict of interest. References Citing Literature Number of times cited according to CrossRef: 2 Hui‐Fern Koay and Dale I Godfrey, MicroRNA‐managing the development of MAIT cells, Immunology & Cell Biology, 97, 2, (121-123), (2019). Wiley Online Library Erik Seth, Christine L. Zimmer, Marcus Reuterwall‐Hansson, Ammar Barakat, Urban Arnelo, Annika Bergquist, Martin A. Ivarsson and Niklas K. Björkström, Primary sclerosing cholangitis leads to dysfunction and loss of MAIT cells, European Journal of Immunology, 48, 12, (1997-2004), (2018). Wiley Online Library
|
|
Scooped by
Gilbert C FAURE
February 10, 2019 12:45 PM
|
Abstract Objective Infection with Helicobacter pylori (H pylori), especially cytotoxin‐associated gene A‐positive (CagA+) strains, has been associated with various gastrointestinal and extragastric diseases. The aim of this study was to characterize H pylori‐induced alterations in the gastric and tongue coating microbiota and evaluate their potential impacts on human health. Design The gastric mucosa and tongue coating specimens were collected from 80 patients with chronic gastritis, and microbiota profiles were generated by 16S rRNA gene sequencing. Samples were grouped as H pylori negative (n = 32), CagA‐negative H pylori infection (n = 13), and CagA‐positive H pylori infection (n=35). The comparison of bacterial relative abundance was made using a generalized linear model. Functional profiling of microbial communities was predicted with PICRUSt and BugBase. Microbial correlation networks were produced by utilizing SparCC method. Results Significant alterations of the gastric microbiota were found in the H pylori+/CagA+ samples, represented by a decrease in bacterial diversity, a reduced abundance of Roseburia, and increased abundances of Helicobacter and Haemophilus genera. At the community level, functions involved in biofilm forming, mobile element content, and facultative anaerobiosis were significantly decreased in gastric microbiome of the H pylori+ subjects. The presence of CagA gene was linked to an increased proportion of Gram‐negative bacteria in the stomach, thereby contributing to an upregulation of lipopolysaccharide (LPS) biosynthesis. The number of bacterial interactions was greatly reduced in networks of both tongue coating and gastric microbiota of the H pylori+/CagA+ subject, and the cooperative bacterial interactions dominated the tongue coating microbiome. Conclusions Infection with H pylori strains possessing CagA may increase the risk of various diseases, by upregulating LPS biosynthesis in the stomach and weakening the defense of oral microbiota against microorganisms with pathogenic potential. 1 INTRODUCTION Highly acidic condition together with various antimicrobial chemicals and enzymes make stomach a hostile environment for most microorganisms. However, investigations of gastric fluid and biopsy samples by next‐generation sequencing (NGS) demonstrate that the human gastric microbiota is a diverse ecosystem that dominated by five phyla, including Actinobacteria, Bacteroidetes, Firmicutes, Fusobacteria, and Proteobacteria.1, 2 There is a trend of gastric microbiota alterations in people with Helicobacter pylori (H pylori) infection; however, inconsistent results have been obtained.3-6 With a small Colombian patient cohort (n = 40), Yang et al showed that the overall gastric microbiota composition was largely independent of the H pylori infection and carriage of the cag pathogenicity island.3 In contrast, another study with a small cohort (n = 30) demonstrated that the abundances of several genera in the gastric microbial community are significantly different between H pylori negative and H pylori positive individuals.4 Infection with H pylori is a leading risk factor for the development of gastric cancer, making it a type I carcinogen.7 However, only approximately 3% of H pylori‐infected patients developed gastric cancer.8 The differential host responses to H pylori colonization indicate that the pathogenicity of H pylori strains and other factors implicated in disease development. It has been suggested that the cytotoxin‐associated gene A (CagA) gene with its products is linked to increased pathogenicity of H pylori strains. As one of the most virulent pathogenicity islands genes, CagA is able to perturb multiple host signaling pathways by acting as a hub or extrinsic scaffold protein, in turn potentiating malignant transformation.9 CagA can interact with multiple cell components and activate multiple signaling molecules downstream of receptor tyrosine kinase growth factors, therefore causing a set of complex cellular alterations, for example, enhanced proliferation and attenuated apoptosis, changes in epithelial cell morphology and polarity, and prevention of the assembly of apical junctions.9 A serologic response to CagA in H pylori‐infected patients was found to be strongly associated with peptic ulceration.10 Oncogenic potential of CagA has been proved in animal experiments.11, 12 People infected by cagA ‐positive H pylori strains have a higher risk of developing gastric carcinoma compared to those infected with cagA‐negative strins.13 CagA‐positive H pylori strains also participate in the inflammatory response, through the production of certain cytokines such as IL‐1β and IL‐8, and activation of NF‐κB.14 Thus, infection of CagA+ H pylori strains can alter both the local and systematic environments, which might consequently influence the local and distant microbiota in the host. Indeed, with a mouse model, the intestinal microbiota has proven to be altered by the presence of H pylori in the stomach.15 To date, the impact of H pylori infection on local and distant microbial populations in humans remains to be explored. In particular, it is essential to illuminate the role of non‐H pylori organisms in the development of gastrointestinal diseases, so as to improve diagnosis and treatment strategies. The oral microbiome helps host against invasion of opportunistic microorganisms. The oral microbiome also impacts the microbial communities that colonize the gastrointestinal tract,16 and its imbalances contribute to not only oral diseases but also risk of gastrointestinal disorders, adverse pregnancy outcomes, cardiovascular disease, diabetes, rheumatoid arthritis, and nervous systemic diseases.17 In this study, we sought to elucidate the relationships between CagA status of H pylori infection and the compositional, functional, and ecological changes in both gastric and oral microbiome communities. 2 MATERIALS AND METHODS 2.1 Cohort Eighty Chinese participants diagnosed with chronic nonatrophic gastritis were enrolled in this study, who were diagnosed by gastroscopy referred to endoscopy center of The Traditional Chinese Medicine Hospital of Shijiazhuang, China, from June 2016 to February 2018. Indications for gastroscopy were recurrent abdominal pain, dyspepsia, and symptoms compatible with reflux esophagitis. These patients were not treated with antibiotics or proton‐pump inhibitors for at least 1 month before endoscopy. The presence of H pylori in antral gastric mucosa was determined by 16S rRNA gene sequencing, 13C‐urea breath test, and anti‐CagA immunoglobulin G (IgG) in serum. The patients were grouped accordingly as H pylori‐negative (n = 32), H pylori‐positive but CagA‐negative (n = 13), and H pylori‐positive and CagA‐positive (n = 35). The study protocol was approved by the ethics committee of The Traditional Chinese Medicine Hospital of Shijiazhuang. Demographic and diagnostic characteristics, and H pylori/CagA status of the enrolled patients are given in Table S1. 2.2 Sample collection, DNA isolation, and 16S rRNA gene sequencing Sample collections were performed in the morning, and all the volunteers had fast (no food, fluids, or water) before the procedure. In order to overcome variations potentially caused by different gastric regions, all mucosal biopsy samples were collected from the antrum region of the stomach. Tongue coating samples were collected by scraping the tongue dorsum three times with sterilized cotton swabs. All samples were enclosed in sterile plastic tubes with RNAlater (Qiagen, German) immediately after collection and transported to HRK‐biotech laboratory with dry ice. Both gastric biopsy and tongue coating samples were stored at −80°C until tested. Samples were centrifuged at 3420 X g for 10 minutes, and supernatant was removed. Homogenization was employed using 0.1 mm zirconium beads and bead beating for 5 minutes at 1500 g (Scientz‐48, High‐throughput Tissue Grinder, Scientz, China). Total DNA was isolated using QIAamp DNA Mini Kit (Qiagen, Germany), following the manufacturer's instructions. DNA was quantified using a Qubit dsDNA HS Assay Kit (Thermo Fisher Scientific, Waltham, MA, USA). PCR amplification and library preparation were accomplished using previously reported methods.18 In brief, amplification of the V3‐V4 hypervariable regions of the ribosomal 16S rRNA genes was performed using universal primers 341F (5′‐CCTACGGGAGGCAGCAG‐3′)/806R (5′‐GGACTACNNGGGTACTAAT‐3). Purified amplicon libraries were sequenced on the MiSeq platform (Illumina, Inc, San Diego, CA) using the 2 × 300 bp paired‐end protocol. 2.3 Data analysis The forward and reverse reads were merged using VSEARCH19 with a minimum overlap set to 10 bp. Sequences were quality filtered at a maximum expected error of 1% and striped 5 bp (0‐5 bp heterogeneityspacers) at both sides. The USEARCH20 cluster_otus command was employed to filter chimeric sequences and cluster operational taxonomic units (OTUs) based on 97% nucleotide similarity. Taxonomic category was assigned to all OTUs using the Ribosomal Database Project (RDP) classifier. Differential analysis was performed by SHAMAN (http://shaman.c3bi.pasteur.fr/) with a negative binomial generalized linear model (implemented in the DESeq2 R package), and the false discovery rate was adjusted by using Benjamini‐Hochberg procedure. The bacterial abundances were adjusted for potential confounding factors, including age, gender, BMI, and H pylori status. The microbiome alpha diversity was measured by the number of observed OTUs, the Shannon diversity index, the Simpson index, and the Inverse Simpson index. Overall differences in microbial community structure (ie, beta diversity) were evaluated through principal coordinate analysis (PCoA) and hierarchical clustering to Bray‐Curtis distance calculated at the OTU level. Phylogenetic Investigation of Communities by Reconstruction of Unobserved States (PICRUSt) was used to predict metabolic functions of the microbial communities based on Greengenes (V13.5) 16S rRNA database and Kyoto Encyclopedia of Genes and Genomes (KEGG) orthologs.21 The functional differences between groups were determined with Linear Discriminant Analysis Effect Size (LEfSe). Organism level microbiome phenotypes were predicted and compared with BugBase.22 The proportions of six phenotypic categories, including Gram staining, oxygen tolerance, ability to form biofilms, mobile element content, pathogenicity, and oxidative stress tolerance, were compared among different groups of patients with gastritis. 2.4 Microbial association network analysis SparCC algorithm23 was utilized to elucidate microbial interactions for each sample group. SparCC obtains the P‐value through permutation‐based approaches that iteratively correct spurious correlation coefficients, and limits false discovery rates. OTUs that occur in at least 50% of the samples within one group and with an average relative abundance of at least 1% were selected to infer the correlation network. Taxon‐taxon correlation coefficients were estimated as the average of 20 inference iterations and 200 shuffled matrices for the P‐value calculation. This set of iterative procedures was applied separately to each sample group of gastric mucosa and tongue coating ecologies. Correlation coefficients with magnitude ≥0.3 and P‐value <0.05 were selected for visualization in Cytoscape V.3.6.1. 3 RESULTS 3.1 Infection with CagA+ H pylori strains influences the gastric microbial community structure It was shown that pyrosequencing method detectedH pylori sequences in about 60% of samples that were H pylori negative by a combination of conventional testing (histology, rapid urease test, and culture),24 which emphasizes the use of NGS as a more sensitive method for determining H pylori infection. Following the proposed cutoff value of determining H pylori infection,24 we labeled samples with >1% H pylori relative abundance as H pylori positive (H pylori+). However, there is still a certain possibility to have false‐negative case due to uneven distribution of the organism through the gastric mucosa. To reduce the false‐negative rate, we also labeled samples with ≤1% H pylori relative abundance as H pylori+ if the patients were positive for both 13C‐urea breath test and serological CagA. The rest of samples were grouped as H pylori negative (H pylori−). We noticed that some low relative abundances of H pylori sequences were detected when breath test and/or serology were positive. This is likely due to the uneven distribution of H pylori in the stomach. The microbial diversity was measured and compared at the OTU level. A decreasing gastric bacterial alpha diversity from H pylori− through H pylori+/CagA− to H pylori+/CagA+ subjects was identified (Figure 1). The Shannon index, Simpson index, and Inverse Simpson index revealed a significantly lower gastric bacterial alpha diversity in the H pylori+/CagA+ compared to the other two groups. A similar pattern of decline in alpha diversity was also found in the tongue coating microbiota, but statistical significance was not obtained. Principal coordinates analysis (PCoA) of the gastric microbiota clearly separated the H pylori+/CagA+ group from the other two groups (Figure 2A), while the H pylori+/CagA− and H pylori− groups were similar to each other. The tongue coating microbiota composition was similar in all patient groups (Figure 2B). The results from PCoA are also consistent with the results of hierarchical clustering (Figure S1). 3.2 Relative microbial abundances in the human stomach are influenced by the presence of CagA+ H pylori strains Bacterial profiles in the mucosa revealed that the gastric microbiota was mainly composed of Bacteroidetes (44.08%), Proteobacteria (27.49%), Firmicutes (23.3%), and Actinobacteria (3.78%) phyla (Table S2). The gastric bacterial flora of the H pylori+/CagA+ group was dominated by Proteobacteria (H pylori belongs to this phylum), while Bacteroidetes was the highest phylum in both H pylori+/CagA− and H.p.− groups. Bacteroidetes and Firmicutes were found to be significantly depleted in H pylori+/CagA+ compared with other two groups (Figure 3A). At the genus level, the H pylori+/CagA+ group had higher Helicobacter and Haemophilus, and lower Roseburia relative abundances compared to other groups (Figure 3C). Except for Helicobacter, no other genus was found with significantly different between H pylori− and H pylori+/CagA− groups. Additionally, significant differences in the relative abundances of two phyla (Fusobacteria and Verrucomicrobia) and nine genera (Alloprevotella, Blautia, Clostridium, Lachnospiracea incertae sedis, Megamonas, Oscillibacter, Parasutterella, Porphyromonas, and Prevotella) were found only between H pylori+/CagA+ and H pylori+/CagA− groups (Figure 3A,C). As for the tongue coating microbiota, the most prevalent phyla were Bacteroidetes (30.74%), Proteobacteria (28.53%), Firmicutes (21.74%), Actinobacteria (11.12%), and Fusobacteria (6.29%) (Table S2). The proportion of Actinobacteria in the H pylori+/CagA− group was significantly lower than other groups (Figure 3B). The genera Akkermansia, Meganomas, and Ruminococcus were found to be more abundant in the H pylori+/CagA− compared with the H pylori+/CagA+ group (Figure 3D). Notably, Meganomas was found to be significantly more abundant in the H pylori+/CagA− compared with the H pylori+/CagA− group, for both gastric mucosa and tongue coating samples. Taken together, these results indicate that H pylori infection, especially by the CagA+ strains, significantly altered the diversity and composition of gastric microbiome, while moderately affected the composition tongue coating microbiome. 3.3 Changes in the functional capacity of gastric microbiota is associated with H pylori infection and CagA gene expression The functional capacities of the gastric mucosa and tongue coating microbiome were predicted based on 16S data using PICRUSt and BugBase. Statistically significant KEGG pathways for each group were determined using LEfSe. Compared to the H.p.− group, gastric microbiome of H pylori+/CagA+ patients was significantly enriched for pathways involved in bacterial motility proteins, secretion system, flagellar assembly, oxidative phosphorylation, lipopolysaccharide (LPS) biosynthesis proteins, LPS biosynthesis, and ribosome (Figure 4). In addition, the secretion system and LPS biosynthesis proteins were also upregulated in the H pylori+/CagA− group. No significant difference in functions was detected between the H pylori− and H pylori+/CagA− groups. At the organism level, gene functions related to facultative anaerobiosis, mobile element containing, and biofilm forming were depleted in the H pylori+ samples, and mainly due to some reduced taxa that belong to the genus Proteobacteria (Figure 5B‐D). Gram‐negative species were significantly enriched in H pylori+/CagA+ samples, likely owing to the increased abundance of H pylori (Figure 5E). In addition, significant reductions of anaerobic, Gram‐positive, potential pathogenic, and oxidative stress tolerant microorganisms were predicted for the H pylori+/CagA+ sample group, which were majorly attributed to the decreased abundance of Firmicutes (Figure 5A,F‐H). Significant alteration in the functions of tongue coating microbiome was not obtained. Thus, H pylori infection significantly influenced the gene functions of gastric microbiota, and the presence of CagA gene made a further contribution to this alteration. 3.4 Alterations of gastric and tongue coating microbial interactions are associated with H pylori infection and CagA gene expression The human body contains many diverse microorganisms competing and cooperating with one another, thus acting as an ecosystem supporting health or promoting disease. Most of microbial interactions are niche‐specific25; therefore, the disease‐specific microenvironment may also shape microbial interaction networks. We next inferred taxonomic correlations among the three sample groups, using the SparCC algorithm. OTUs that occur in ≥50% of the samples within one group and with a relative abundance ≥1% were selected to infer the correlation network. Among taxa colonizing the gastric mucosa, the number of interactions was highest in the H pylori− group (n = 24), which was significantly reduced in the H pylori+ subjects (H pylori+/CagA−: n = 11; H pylori+/CagA+: n = 11) (Figure 6A‐C). Co‐occurrence between OTU_9_Bacteroides dorei and OTU_14_Faecalibacterium prausnitzii, and between OTU_10_Prevotella copri and OTU_17_Propionibacterium were found to be ubiquitous in all the groups. The interactions between H pylori and other taxa were exclusively co‐excluding in the H pylori+/CagA+ samples (Figure 6C). Some interactions were shared between H.p.− and H.p.+/CagA− sample groups, such as co‐occurrence between OTU_10_Prevotella copri and OTU_68_Roseburia, and between OTU_17_Propionibacterium and OTU_68_Roseburia, which were depleted in the H.p.+/CagA+ group. The interaction pattern among OTU_6_Unclassified, OTU_9_Bacteroides dorei, OTU_14_Faecalibacterium prausnitzi, and OTU_40_Alloprevotella rava was consistent in H.p.− and H.p.+/CagA+ groups (Figure 6A,C). Co‐occurrence among OTU_19_Ruminococcus bromii, OTU_31_Bacteroides fragilis, and OTU_37_Bacteroides thetaiotaomicron were uniquely observed in the H pylori+/CagA− group (Figure 6B). The number of bacterial interactions within the tongue coating microbiota also decreased from H pylori− (n = 22) to H.p.+ samples (H.p.+/CagA−: n = 12; H.p.+/CagA+: n = 7) (Figure 6D‐F). OTU_30_ Prevotella_histicola exhibited co‐occurrence relationships with OTU_4_Veillonella dispar and OTU_28_Prevotella pallens, which were found to be ubiquitous in all sample groups. The network of H pylori+/CagA+ group was dominated by cooperation relationships, and only one negative correlation (between OTU_3_Prevotella and OTU_11_Streptococcus) was identified (Figure 6F). Interactions of OTU_7_Roseburia with OTU_28_Prevotella pallens and OTU_30_ Prevotella_histicola that found in the H pylori− and H pylori+/CagA− groups were depleted in the H pylori+/CagA+ group. Taken together, infection with H pylori, especially the CagA+ strains, was associated with a reduced complexity of bacterial interactions in both gastric and tongue coating microbial communities. As a result, the oral microbiome structure is more likely to be disturbed such as by invasion of alien microorganisms, since the community response hinged on the complex interspecific interactions. 4 DISCUSSIONS Former studies on mice gastric microbiome indicated that H pylori infection significantly affects the population structure of the gastric and intestinal microbiota, alters gastric immune and inflammatory responses, and causes distant effects via altered hormones and immunity.15 Because physiology and immunity were substantially influenced following the infection of H pylori, we asked whether the induced host response affects microbiome composition distally in the mouth. In this exploratory study, we characterized both the gastric and tongue coating microbial patterns in patients with gastritis and investigated their relations to H pylori infection with and without presence of the CagA gene. In concordance with previous descriptions, we found Actinobacteria, Bacteroidetes, Firmicutes, and Proteobacteria were the most prevalent phyla in the gastric specimens.1, 2 Multiple taxa were found to be significantly different between H pylori− and H pylori+/CagA+ (but not H.p.+/CagA−) subjects, together with a reduced microbial diversity, indicating the presence of CagA gene was strongly linked to alterations in the gastric microbiota. It was previously shown that gastric microbiome of H pylori+/CagA+ patients was not significantly different compared to H pylori+/CagA−,4 which was not in concordance with our results. It could be attributed to insufficient sample size in both studies (10 CagA− and 10 CagA+ samples in 4; 13 CagA− and 35 CagA+ samples in our study). The metabolites of gut microbiota play crucial roles in determining the biochemical profile of the diet, and thus modulating host metabolism. However, the metabolism of gastric microbiota (especially non‐H pylori species) and their interplay with host metabolism in health and disease remain poorly understood. We found that the functions involved in LPS biosynthesis were upregulated within patients infected by CagA+ strains. LPS (also termed endotoxin) is the major surface molecule of most Gram‐negative bacteria that play a key role in host‐pathogen interactions with the innate immune system. Indeed, the proportion of Gram‐negative taxa was significantly higher in the stomach of H pylori+/CagA+ patients. In the gastric mucosa, LPS is capable of suppressing the elimination of H pylori by interfering the activity of innate and adaptive immune cells, diminishing the inflammatory response, and affecting the adaptive T lymphocyte response, thus facilitating the development of chronic gastritis.26 Additionally, the exposure of LPS has been found in close associations with several diseases such as endotoxemia, autoimmune and allergic disease,27 obesity,28 and nervous systemic diseases (including autism29 and Alzheimer's disease30). It has been hypothesized that most of LPS is derived from the gut microbiota, and enters blood circulation due to an increased intestinal barrier permeability. However, it is also possible for LPS to across the gastric mucosa into blood circulation, especially for patients with gastric lesions. Thus, together with the vascular permeability in gastric mucosal, LPS overexpression in the stomach should be further investigated. As an open system, the oral cavity contains a variety of microbial habitats including teeth, tongue, gingival sulcus, cheek, and palates which contribute to a vast ecological complexity. The diversity and composition of tongue coating have been found more stable comparing to teeth and supragingival plaque which were more susceptible to oral hygiene habits.31 In addition, most of the highly abundant taxa found in saliva were derived from the tongue. Therefore, we collected tongue coating samples to access the oral microbiota in this study. Although H pylori infection had a subtle influence on the microbial diversity and structure of tongue coating microbiota, the complexity of bacterial interaction network was greatly reduced. Our data indicated that the total number of interactions were significantly declined in the oral microbiota of the H pylori+ group, especially for the CagA+ patients. Additionally, oral microbiota of CagA+ patients was dominated by co‐occurrence relationships, further indicating a low network complexity since cooperation is destabilizing for the community.32 Thus, the oral microbiota of CagA+ patients may be more tolerant to the invasion of alien species. In conclusion, our study identified the influences of H pylori infection on gastric and tongue coating microbial populations. Infection with CagA+ H pylori strains reduced the diversity of gastric microbiota and altered its composition and functions. The upregulation of LPS biosynthesis likely resulted from Gram‐negative bacteria enrichment in the stomach of CagA+ patients may increase the chance of developing various diseases that associated with LPS exposure. CagA+ H pylori infection was also associated with an unstable tongue coating bacterial community, which suggests a weak resistance to invasion by microorganisms with pathogenic potential. DISCLOSURES OF INTERESTS The authors declare no competing financial interests. AUTHORS’ CONTRIBUTIONS GX analyzed data and drafted the manuscript. GJ, XY, WH, and LY collected human samples. GJ and YD performed DNA isolation and sequencing. ZY designed the study and revised the paper. Supporting Information REFERENCES
|
|
Scooped by
Gilbert C FAURE
January 28, 2019 1:38 PM
|
Summary The immune system is essential for maintaining a delicate balance between eliminating pathogens and maintaining tolerance to self‐tissues to avoid autoimmunity. An enormous and complex community of gut microbiota provides essential health benefits to the host, particularly by regulating immune homeostasis. Many of the metabolites derived from commensals can impact host health by directly regulating the immune system. Many autoimmune diseases arise from an imbalance between pathogenic effector T cells and regulatory T (Treg) cells. Recent interest has emerged in understanding how cross‐talk between gut microbiota and the host immune system promotes autoimmune development by controlling the differentiation and plasticity of T helper and Treg cells. At the molecular level, our recent study, along with others, demonstrates that asymptomatic colonization by commensal bacteria in the gut is capable of triggering autoimmune disease by molecular mimicking self‐antigen and skewing the expression of dual T‐cell receptors on T cells. Dysbiosis, an imbalance of the gut microbiota, is involved in autoimmune development in both mice and humans. Although it is well known that dysbiosis can impact diseases occurring within the gut, growing literature suggests that dysbiosis also causes the development of gut‐distal/non‐gut autoimmunity. In this review, we discuss recent advances in understanding the potential molecular mechanisms whereby gut microbiota induces autoimmunity, and the evidence that the gut microbiota triggers gut‐distal autoimmune diseases. Introduction The mammalian gastrointestinal tract is home to an enormous and complex community of commensal bacteria.1-3 This gut microbial community (microbiota) has co‐evolved with its host over millennia, suggested by the fact that out of 52 bacterial phyla, two dominant phyla, Bacteroidetes and Firmicutes, represent 98% of the bacteria in the gut.4, 5 These gut microbes provide benefits to their host in many ways, including, but not limited to, digestion, production of nutrients, detoxification, protection against pathogens and regulation of the immune system.1-3, 6, 7 As a result of its collective metabolic activity, and necessity for human health, the gut microbiota is often referred to as the ‘forgotten’ organ.8 Interestingly, many of the metabolites derived from commensal bacteria have recently been found to directly impact the immune system. Commensal‐mediated immunomodulation includes the promotion of T helper cell subset differentiation and T helper cell plasticity, the ability of a differentiated CD4+ T cell to take on characteristics of other T‐cell subsets simultaneously or at different times.9 Plasticity is an especially important subject for mucosal immunity, as mucosal tissues are major sites where T‐cell plasticity has been observed.10-14 Therefore, the mucosa harbors the frontline immune response to commensal bacteria, and their interactions may subsequently control health versus disease status through T‐cell differentiation and plasticity. An autoimmune condition develops when the immune system mistakenly attacks our own self‐tissues. A long‐standing question in the field of microbe–host communication is how interaction of microbes with T cells promotes autoimmune development. Molecular mimicry is one prominent hypothesis, theorizing that microbes trigger autoimmunity by a shared immunogenic epitope between microbes and a self‐peptide, which leads to the activation of autoreactive T cells.15, 16 Another less well‐known theory is that expression of dual T‐cell receptors (TCRs) on T cells promotes autoimmunity by allowing autoreactive T cells to escape thymic clonal deletion.17-19 Alterations in the composition of the gut microbiome, known as dysbiosis, have been implicated in many diseases and disease models, including those that show clear association with the gut such as inflammatory bowel disease, colorectal cancer, enteric infections, and obesity.20-27 Dysbiosis has also been implicated in immune disorders that occur outside the gut, such as asthma, eczema, allergies, and gut‐distal autoimmune diseases (autoimmune arthritis, type 1 diabetes, experimental autoimmune encephalomyelitis).20, 28-37 Although it is easy to see how the gut microbiota can influence immune responses within the gut, over the last decade an appreciation for the impact of the gut microbiome on gut‐distal autoimmunity disease has developed. For example, a strong interest has emerged to characterize the impact of gut microbiota on health and disease status in the lung and brain, namely ‘gut–lung axis’ and ‘gut–brain axis’, respectively.38, 39 This article aims to review the influence of microbiota on the immune system by producing key commensal‐derived metabolites as well as controlling T‐cell subsets and plasticity. Additionally, we discuss the recent findings on how gut commensals affect autoimmunity by molecular mimicry and skewing the expression of dual TCRs. Finally, we discuss the role of dysbiosis in the pathogenesis of common autoimmune diseases. As dysbiosis in inflammatory bowel disease has been extensively reviewed elsewhere (see ref. 40-42), this review will focus on the impact of gut microbiota dysbiosis in the development of gut‐distal autoimmune diseases. Understanding the mechanisms of how gut commensals affect the immune system will be crucial for us to elucidate autoimmune pathogenesis and to generate novel therapies. This is an urgent subject, as dysbiosis‐related diseases have emerged as new epidemics in the industrialized world.43-45 Commensal bacteria‐mediated metabolites and immunity Gut commensals are well‐known for their function in digestion, a process involving extraction and synthesis of many metabolites, some of which are produced only by commensal bacteria and are crucial for host health.46 Recently, several advancements have been made determining how the metabolites generated by commensal bacteria can directly influence the development and function of the immune system, directly impacting health and diseases (Table 1). Here, we review the most recent reports in this field. Commensal Metabolite Disease phenotype Immunomodulation References Clusters IV and XIVa of Clostridium ↑ IDO, enzyme involved in tryptophan catabolism, on IEC ↓ Colitis ↑ Colon Treg ↓ Th1 63, 66 Lactobacillus reuteri ↑ Indole derivatives by metabolizing tryptophan ↑ Differentiation of DP IEL 69 Clostridium sporogenes ↑ IPA derivatives by metabolizing tryptophan, phenylalanine, and tyrosine ↓ Permeable intestines ↓ Neutrophils, monocytes, and memory T cells 72 General microbiota signal through MyD88 ↑ RALDH, enzyme able to catalyze the synthesis of RA from Vitamin A ↓ EAE ↓ Autoimmune arthritis ↑ Treg ↓ Th17 ↑ Gut‐homing integrin α4β7 ↑ Maintenance of peripheral lymph nodes 78, 79, 92 Ruminococcaceae eubacterium ↑ SCFAs signal through GPR43 ↓ EAE ↓ Type 1 diabetes ↑ Lamina propria Treg ↑ Antimicrobial peptides 57, 53, 55 Abbreviations: DP IEL, double‐positive intraepithelial T lymphocytes; EAE, experimental autoimmune encephalomyelitis; IDO, indoleamine 2,3‐dioxygenase; IEC, intestinal epithelial cells; IPA, indolepropionic acid; RA, rheumatoid arthritis; RALDH, retinal dehydrogenase; SCFA, short‐chain fatty acids; Th1, T helper type 1; Treg, regulatory T. Short‐chain fatty acids Short‐chain fatty acids (SCFAs) including butyric acid, propionic acid, and acetic acid are the main metabolic products of undigested carbohydrates by gut commensal bacteria and have broad effects on the host immune system.47 Among the fatty acid receptors, two orphan G protein‐coupled receptors, GPR41 and GPR43, are activated by SCFAs.48, 49 SCFAs are significantly reduced in the colon of germ‐free mice indicating that the gut microbiota is essential for their production.50 Recently, one group reported that long‐chain fatty acids enhanced the differentiation and proliferation of T helper type 1 (Th1) and/or Th17 cells, whereas SCFAs expanded gut regulatory T (Treg) cells.51, 52 Using experimental autoimmune encephalomyelitis (EAE) as a model for multiple sclerosis, Haghikia et al. showed that long‐chain fatty acids decreased SCFAs in the gut, leading to exacerbated EAE by expanding pathogenic Th1 and/or Th17 cells in the small intestine.51 Treatment with SCFAs ameliorated EAE by inducing lamina‐propria‐derived Treg cells. Consistent with the anti‐inflammatory properties of SCFAs, treatment of germ‐free mice with acetate, a type of SCFA, is sufficient to reduce intestinal inflammation in the dextran sulfate sodium model of colitis.53 The protective effect of acetate was lost in GPR43−/− mice, indicating that signaling of acetate through GPR43 is necessary for the anti‐inflammatory effect of SCFAs. Remarkably, administration of the SCFA butyrate ameliorates inflammation in patients with ulcerative colitis.54 SCFAs also indirectly control type 1 diabetes through the production of antimicrobial peptides. Mechanistically, SCFAs produced by the gut microbiota have been shown to stimulate the production of antimicrobial peptides by pancreatic beta cells.55 Furthermore, systemic administration of these antimicrobial peptides induce Treg cells in the pancreatic islets of pre‐diabetic mice, reducing the incidence of autoimmune diabetes. Additionally, it has been recently demonstrated that administration of the SCFA propionate significantly attenuated HLA‐B27‐associated intestinal inflammation in Fischer 344 HLA‐B27/β2m transgenic rats.56 Interestingly, this propionate‐mediated inhibition of inflammation is independent of its role in regulating the Treg cell response. Amino acids An early study gives an indication that gut bacteria may play an important role in host amino acid homeostasis and health by showing that germ‐free mice had an altered distribution of free amino acids along the gastrointestinal tract compared with conventionalized mice.58 More recent reports suggest that the most abundant amino‐acid‐fermenting bacteria in the human small intestine are bacteria belonging to the Clostridia, the Bacillus–Lactobacillus–Streptococcus groups, Proteobacteria, and Peptostreptococcus.59-61 These bacteria are therefore likely to be important for amino acid absorption in the gastrointestinal tract. Among the 20 amino acids, tryptophan belongs to one of the nine ‘essential’ amino acids that humans and higher vertebrates cannot synthesize, and that must be supplied in their diet.62 Numerous studies suggest that tryptophan metabolites generated by gut commensal bacteria serve as important signaling molecules in host–microbe cross‐talk. For example, the colonic intestinal epithelial cells from mice colonized with clusters IV, XIVa, and XVIII of Clostridium express high levels of indoleamine 2,3‐dioxygenase,63 an enzyme involved in the initial and rate‐limiting step of tryptophan catabolism, which has been implicated in Treg cell induction.64 Specifically, it has been demonstrated that kynurenine, the first product in the indoleamine 2,3‐dioxygenase‐dependent tryptophan degradation pathway, activates the aryl hydrocarbon receptor, leading to aryl hydrocarbon receptor‐dependent Treg cell generation.65 Indeed, an induction of colonic Treg cells was observed in mice colonized with Clostridium species.63 The small intestinal epithelium contains a unique population of CD4+ CD8αα+ double‐positive intraepithelial T lymphocytes (DP IELs) which exhibit anti‐inflammatory properties.67, 54 It has been shown that upon migration to the epithelium, Treg cells lose Foxp3 and convert to DP IELs in a microbiota‐dependent manner, as microbiota depletion by treating mice with broad‐spectrum antibiotics prevents Foxp3 loss.68 Whereas all Treg cells express the CD4‐lineage transcription factor T helper‐inducing POZ/Krüppel‐like factor (ThPOK), CD8αα+ CD4+ and > 50% of Foxp3– CD8α– CD4+ cells in the small intestinal epithelium lack ThPOK expression. Later, it was found that loss of ThPOK corresponds to an IEL‐like behavior in CD4+ T cells. Interestingly, supplement of TCR stimulation can overcome the microbiota requirement for the DP IEL differentiation, as demonstrated by the relatively normal DP IEL differentiation in antibiotics‐treated Rag1−/− OT‐II (ova‐specific) mice exposed to oral ovalbumin. By comparing the microbiota profile between mice housed at two vivaria, with mice at one vivarium displaying significant numbers and another displaying negligible or absent DP IELs, Cervantes‐Barragan et al. discovered that the commensal Lactobacillus reuteri was responsible for the differentiation of DP IELs.69 Lactobacillus reuteri generated indole derivatives by metabolizing tryptophan, which activated the aryl‐hydrocarbon receptor in CD4+ T cells, leading to their ThPOK down‐regulation and differentiation into DP IELs. Hence, L. reuteri together with a tryptophan‐rich diet can promote gut immune homeostasis by allowing the differentiation of intraepithelial CD4+ T cells into anti‐inflammatory DP IELs. Only a few species of gut commensals, including Clostridium sporogenes, can break down tryptophan and produce the metabolite indolepropionic acid (IPA), a deamination product of tryptophan.70 Bacterial tryptophanase catalyzes the conversion of dietary tryptophan to indole and subsequently to IPA.71 A recent study identified a total of 12 compounds that can be produced in this process, nine of which can accumulate in the blood and three of which are produced exclusively by bacteria.72 Specifically, the C. sporogenes‐expressed gene fldC is necessary for the production of IPA. In fact, fldC is essential for the reductive metabolism of all three aromatic amino acids (tryptophan, phenylalanine, and tyrosine). Germ‐free mice receiving wild‐type C. sporogenes exhibit high levels (~80 μm) of serum IPA whereas germ‐free mice receiving the mutated version of C. sporogenes lacking fldC, had undetectable serum IPA. Importantly, mice with undetectable IPA had higher levels of immune cells, including neutrophils, classical monocytes, and memory T cells. In addition, the mice with the engineered version of C. sporogenes had increased intestinal permeability, a defect that is often seen in inflammatory bowel disease. In addition to having a direct impact on the immune system, undigested amino acids have the potential to become supplemental precursors for SCFA generation by the gut microbiota, in addition to indigestible carbohydrates.73 Therefore, amino acids could have indirect impact on the immune system through SCFAs as we discussed earlier. Numerous amino acids including glycine, threonine, glutamate, and ornithine can be metabolized by anaerobic bacteria to generate acetate, whereas threonine, lysine, and glutamate can be used for butyrate synthesis.74 Moreover, at the molecular level, it has been shown that intracellular leucine concentrations can be sensed by the multiprotein complex leucyl‐tRNA synthetase,75, 76 which activates the mechanistic target of rapamycin kinase, proving to be a vital link between immune function and metabolism.77 Retinoic acid Retinoic acid, a metabolite of vitamin A, is one of the most active physiological retinoid metabolites and has a wide range of biological activity including regulating immune responses.78 A major part of retinoic acid's anti‐inflammatory effects depends on the inhibition of Th17 cells and promotion of Foxp3+ Treg cell responses.78, 79 In addition, retinoic acid has been shown to be important for the expression of the gut homing receptor integrin α4β7 on T cells.80-82 The α4β7 integrin receptors are imprinted on lymphocytes by dendritic cells (DCs) from Peyer's patches (PPs), and mesenteric lymph nodes.82, 83 In the absence of microbial toll‐like receptor signaling in Myd88−/− mice, gut DCs express low levels of retinal dehydrogenase (RALDH) required for retinoic acid biosynthesis, so these Myd88−/− mice are unable to generate gut‐homing lymphocytes.84 AM80 is a synthetic retinoic acid that is characterized by higher stability and fewer potential adverse effects compared with retinoic acid.85, 86 It has been reported that both retinoic acid and AM80 ameliorate many autoimmune responses, including experimental autoimmune myositis, experimental autoimmune encephalitis, and collagen‐induced arthritis.87-90 We recently showed that oral administration of AM80 inhibits autoimmune disease in the joints as well as in the lung.91 We elucidated a novel mechanism whereby AM80 suppresses the autoimmune pathology in both the lung and joints by inhibiting T follicular helper (Tfh) cells in addition to inhibiting Th17 responses. Specifically, AM80 increased the expression of the gut‐homing integrin α4β7 on Tfh cells, which diverted Tfh cells from systemic (non‐gut) inflamed sites such as the lung draining lymph nodes into the gut (the non‐immunopathological site) and so reduced systemic autoantibody production. Moreover, the impact of retinoic acid can go beyond the cellular level and impact the development of whole lymphoid tissues.92 It has been reported that cellular expansion in peripheral lymphoid tissues is controlled by gut microbiota in a retinoic acid‐dependent manner.93 The mucosal addressin MAdCAM‐1 is the receptor for the gut‐homing integrin α4β7, and peripheral node addressin PNAd is the receptor for CD62L.94 In neonatal mice, MAdCAM‐1 expression in lymph nodes is elevated shortly after birth,95 followed by a switch to a PNAd over a course of 2–3 weeks.93 Zhang et al. demonstrated that commensal fungi drive a wave of RALDH+ DCs to migrate to the peripheral lymph nodes after birth.92 The arrival of these cells increases the amounts of retinoic acid in situ, mediates the neonatal MAdCAM‐1 to adult PNAd addressin switch on endothelial cells, and directs the homing of lymphocytes to gut‐associated lymphoid tissues. Finally, the authors found that a diet deficient in vitamin A causes reduced homing of RALDH+ DCs into peripheral lymph nodes and a lack of maintenance of peripheral lymph node structures, suggesting a dependence on retinoic acid signaling for structural and functional maintenance of peripheral immune tissues. Microbiota and T‐cell subset determination Understanding the role of microbiota in T‐cell subset commitment and plasticity holds the key for unveiling the pathogenesis and therapeutic options for autoimmune diseases, as well as diseases associated with unbalanced immune responses such as cancers and infections. Not surprisingly, addressing this question has become a focused area of research in recent years. One study using transgenic mice expressing a limited but diverse TCR repertoire, through fixed TCR‐β expression, showed that the TCR repertoire of colonic Treg cells is unique compared with thymically derived Treg cells.96 Furthermore, these colonic Treg cells were shown to react with bacterial isolates, suggesting that encountering gut microbes in the intestines leads to peripheral Treg cell induction, and hence to tolerance to the gut microbiota.96 A more recent study, also using transgenic mice expressing a constrained TCR repertoire, through fixed TCR‐β expression and limited TCR‐α rearrangement (TCRmini mice97) showed that thymic and intestinal Treg cells expressed overlapping TCR repertoires, many of which recognize microbial antigens.98 Alteration of the gut microbiota through treatment of TCRmini mice with a cocktail of antibiotics concurrently altered the colonic and thymic Treg TCR repertoire.98 This suggests that the repertoire of thymically derived Treg cells is heavily influenced by the microbiota. Although these studies have differing results regarding the initial site of gut microbiota influence, in either case it is clear that direct recognition of microbial antigens by T cells can promote Treg cell lineage commitment. Beyond Treg cells, the gut microbiota can also influence T helper subsets. In the presence of a normal microbiota, CX3CR1+ intestinal antigen‐presenting cells act to limit Th1 cell development and expansion.99 However, antibiotic‐induced dysbiosis leads to a shift in the function of CX3CR1+ antigen‐presenting cells, allowing them to promote pathogenic Th1 cell development.99 Our laboratory and others have also demonstrated that a single type of commensal bacteria, segmented filamentous bacteria (SFB), can promote Th17 cell responses. In C57BL/6 mice, SFB specifically induce intestinal Th17 cells.25 More recent studies, however, have demonstrated that SFB can also influence T helper subsets outside the gut. In 2011, Lee et al. discovered that SFB alone was able to promote Th17 cells specifically in the spinal cord of EAE mice.33 Similarly, we have shown that in the K/BxN mouse model of autoimmune arthritis, SFB specifically promotes Th17 cell responses in the lung.100 Additionally, SFB can also drive the differentiation of Tfh cells and promote their migration to systemic sites, leading to exacerbated autoimmune arthritis in K/BxN mice.101 However, the exact molecule(s) employed by SFB to promote the differentiation of T helper cell subsets remain elusive. Although many microbiome studies focus on the microbes residing in the intestines, the entire digestive tract is colonized with bacteria. Hence, the oral microbiome has recently become an area of interest with regards to mucosal immunity. Data from Dutzan et al. showed that oral homeostatic Th17 responses, unlike gut Th17 responses, were unaffected by shifts in the oral or gut microbiomes.25, 102 This suggests that not all mucosal T cells are influenced by the microbiome, and that other environmental cues such as chewing activity in the oral cavity and chewing‐associated damage can maintain the Th17 cell population. Interestingly, a more recent study from this same group found that inflammatory Th17 cells isolated directly from periodontal lesions were in fact heavily influenced by oral microbiome dysbiosis.103 By focusing on Th17 isolated from periodontal lesions of both mice and humans, they found that increased abundance of Th17 cells and enhanced production of inflammatory cytokine IL‐17 was associated with shifts in the oral microbiome. Specific outgrowth of Enterococcus and Actinobacteria along with loss of Streptococcus was associated with periodontitis and enhanced Th17 cell responses in the ligature‐induced periodontitis mouse model. Together the studies suggest that only pathogenic but not homeostatic Th17 cell responses are influenced by dysbiosis. We recently addressed how both age and gut microbiota affect T‐cell subsets in the context of autoimmunity.104 Our results show an augmented autoimmune disease phenotype in both the joints and the lung of middle‐aged compared with young mice. Mechanistically, we saw a soaring accumulation of Tfh, but surprisingly not Th17 cells with age. Our data suggest exposure to immunomodulatory commensals such as SFB may allow the young host to develop an overactive immune system similar to that found in middle‐aged hosts. Our study also shows that age can independently increase the Tfh cell response without the help of immunomodulatory commensals. CD4 T helper cell plasticity and the microbiota The development of specific transcription factor reporter mice has proven to be an invaluable tool in dissecting the plasticity of T‐cell subsets. An early study using adoptive transfer of cells from Foxp3eGFP reporter mice showed that 80% of Treg cells lost GFP expression in the PPs compared with 50% in spleen.12 Within the GFP‐negative PP population, > 60% of the cells expressed CXCR5, consistent with a Tfh phenotype,12 suggesting that PP, but not spleen, is the preferred site for a Treg to Tfh reprogramming. Two other studies found that retinoic‐acid‐receptor‐related orphan receptor γ t (Rorγt), the hallmark Th17 transcription factor, was preferentially expressed by colonic Treg cells, and furthermore, that in the absence of gut bacteria, the Rorγt+ Treg cell population was substantially diminished.10, 14 Interestingly, several bacterial species were able to induce Rorγt+ Treg cells, which were indispensable for maintaining gut homeostasis as determined by enhanced IL‐17, interferon‐γ (IFN‐γ), and colitis in their absence.10 Another study showed that the pathogenic bacterium Helicobacter hepaticus promoted expansion of Rorγt+ Treg cells in a c‐MAF‐dependent manner, which selectively suppressed pro‐inflammatory Th17 cells in the intestines.105 However, in the absence of Treg cells (in Il10−/− mice), H. hepaticus predominantly induced Th17 cells, suggesting that pathobionts can have an impact on T‐cell plasticity by expanding potent suppressive T cells, which in turn, inhibit the inflammatory T helper cells necessary for pathogen elimination. Plasticity among T helper subsets has also been observed. Using cell fate reporter mice in which Th17 cells are permanently marked by YFP (Il17creR26eYFP), Hirota et al. found that selectively in the PP, but not spleen, Th17 cells were reprogramed to a Tfh (PD‐1hi CXCR5hi) phenotype.13 Furthermore, these ex‐Th17‐Tfh cells localized in germinal centers where they assisted in T‐cell‐dependent IgA production. In a Th17 adoptive transfer model of colitis, it was demonstrated that Th17 cell conversion to a Th1 phenotype was necessary for colitis development as Th17 cells unable to produce IFN‐γ (Ifng−/−) were incapable of inducing colitis.106 Interestingly, not only did Th17 cells convert to Th1 and contribute to colitis development directly, but also Th17 were capable of providing help to naive T cells for Th1 lineage commitment. Together these studies suggest that gut microbiota is able to influence T‐cell plasticity within the gut microenvironment and influence the development of autoimmunity and other inflammatory diseases. Gut microbiota induces autoimmunity by TCR‐mediated mechanisms Central to T‐cell function is the TCR, through which T cells recognize their cognate antigen and become activated. An important feature of the TCR is its ability to recognize multiple antigens, known as TCR cross‐reactivity. Sequencing‐based methods estimate that humans and mice express 107 and 106 productive unique αβ TCRs, respectively, yet this is insufficient to cover the possible foreign antigen repertoire.107, 108 Therefore, TCRs possess the ability to recognize multiple antigens in order to recognize the plethora of possible foreign antigens (see ref. 109). One potential mechanism through which pathogenic autoreactive T cells may become activated is through weak recognition of a microbial antigen for which their TCR is cross‐reactive. This is also known as molecular mimicry, a phenomenon in which a foreign antigen shares significant structural or sequence similarities with a self‐antigen.15, 16 Later, this now activated autoreactive T cell can home to the tissue where its cognate self‐antigen is expressed and elicit autoimmune pathology. In fact, cross‐reactive TCR recognition of microbial peptides by autoreactive T cells has been seen in several autoimmune settings (Fig. 1). In 2015, Horai et al. showed that T cells restricted to expressing only the retina‐specific TCR (R161H), became activated in the intestines in response to an unidentified microbial antigen.110 T‐cell activation was in response to TCR‐signaling to a non‐cognate microbial antigen, as T cells in the small intestines of R161H‐Tcrα−/− mice had clear co‐localization of phosphorylated Zap‐70 with CD4, known to be downstream of TCR signaling.110-112 Later, it was shown that Islet‐specific glucose‐6‐phosphate catalytic subunit‐related protein (IGRP)‐specific CD8+ T cells in non‐obese diabetic (NOD) mice were activated through recognition of a peptide from Fusobacteria and elicited autoimmune diabetes.113 Interestingly, the Fusobacteria peptide shared significant homology with the IGRP peptide targeted by the IGRP‐specific transgenic TCR,113 suggesting that molecular mimicry in microbial peptides may pose a threat because they can activate pathogenic autoreactive T cells. Most recently, it was shown that gut commensal bacteria expressing an ortholog to human Ro60, a nuclear RNA‐binding protein and primary targeted self‐antigen in lupus, were able to activate human Ro60‐specific CD4+ T cells through cross‐reactive TCR recognition.114 Furthermore, germ‐free mice monocolonized with Ro60‐ortholog‐expressing commensal bacteria spontaneously developed lupus‐like disease, as indicated by glomerular immune complex deposits. Together, these studies suggest that molecular mimicry is a mechanism through which the intestinal microbiota is able to propagate autoimmune responses leading to disease. In addition to molecular mimicry, it has long been thought that pathogenic autoreactive T cells may arise from a subset of thymocytes expressing two unique TCRs, one of which allows them to evade negative selection along with one that has a high affinity for a self‐antigen.115-117 Approaching from a different angle, outside the central immune system, we found that in peripheral tissues, SFB selectively expand dual TCR‐expressing T cells, leading to the augmentation of lung autoimmune pathology (Fig. 1).100 This is the first study to show that dual TCR T cells can be activated through the recognition of the cognate commensal‐derived antigen and migrate to elicit autoimmune pathology in the lung, a gut‐distal site. At the molecular level, we demonstrate that SFB selectively expand autoimmune T cells co‐expressing SFB‐specific TCRs in addition to their self‐reactive TCRs. This additional SFB‐specific TCR provides a proliferative advantage for autoreactive Th17 cells in SFB(+) hosts. Our data suggest that the induction of robust SFB‐specific Th17 response by transferring SFB(+) recipients with SFB‐specific 7B8 T cells could not rescue the autoimmune activity of Rag−/−.KRN T cells through bystander activation. Instead, our data suggest that the same T cells need to specifically recognize self‐ as well as SFB‐antigen to induce IL‐17‐expressing pathogenic T cells to cause autoimmunity. This is supported by previous data showing that in healthy mice, cognate TCR recognition of SFB‐antigen is crucial for SFB‐mediated Th17 induction.118, 119 Taken together, our study suggests that the same T cell needs to recognize both self‐antigen and be activated by SFB to undergo preferential Th17 cell expansion and so enhance autoimmunity in an SFB‐dependent manner. Beyond molecular mimicry, our study suggests an alternative, dual TCR‐based mechanism for commensal‐mediated autoimmunity. Role of gut microbiota in human and murine gut‐distal autoimmunity Autoimmune disorders have been sharply increasing worldwide in recent decades.26 The dramatic changes in the disease onset rate cannot be explained by genetic basis as it occurs in such a short period of time. On the contrary, these data suggest that environmental factors play a key role in the recent surge of autoimmune diseases. In recent years, we have begun to appreciate that the gut microbiota provides environmental cues controlling human health and disease, including its potential impact on autoimmune responses. Under healthy conditions, the human intestinal microbiota is composed primarily of bacteria of the phylum Firmicutes, with Bacteroidetes and Actinobacteria also represented.120 On the family and species level, the gut microbiota varies widely among individuals, although it remains largely stable within an individual over the course of several years.121 Studies using mouse models or samples from human subjects transplanted into mice have shown that age, gender, diet, smoking, autoimmunity, and other factors can alter the microbiota, and that the altered microbiota can be transferred and exert influence over the metabolism and immune system of the recipient.122 These studies demonstrate that the host–microbiota relationship is not a one‐way street, but rather a dynamic conversation that can have long‐lasting impacts. Many studies have investigated a correlation between gut microbiome composition and autoimmune disease in humans, but these studies are limited in their ability to determine causality. Exploring this field using animal models allows for perturbation of the gut microbiome to better distinguish cause from effect, permit mechanistic dissection and allow pre‐clinical evaluation of suggested therapeutic strategies. Throughout this section, we will highlight the important observations made in both human patients and mouse models. Multiple sclerosis (MS) is an autoimmune disease in which pathogenic CD4+ T cells penetrate the blood–brain barrier and cause damage to the central nervous system.123 Numerous studies have shown that patients with MS display intestinal microbiome dysbiosis.124-126 Two independent studies comparing patients with relapsing–remitting MS and healthy controls found significant alterations in the composition of the microbiome from patients with MS.124, 127 Perhaps even more intriguing, when compared with treatment‐naive patients, those receiving treatment displayed some restoration in their microbiome composition.127 Untreated MS patients displayed increased relative abundance of Methanobrevibacter and Akkermansia, which were lower in healthy controls and treated MS patients. MS patients receiving treatment had increased Sutterella, which has been previously observed to be increased in healthy controls compared with treatment‐naive patients with inflammatory bowel disease (Fig. 2).128 This suggests that although dysbiosis may contribute to a predisposition for developing MS, perhaps treatment may act to normalize pro‐inflammatory microbiota. A recent study by Cekanaviciute et al. showed that intestinal microbiome samples from MS patients displayed specific outgrowth of Acinetobacter and Akkermansia.129 Importantly, they further demonstrated that in the presence of Acinetobacter calcoaceticus, human peripheral blood mononuclear cells preferentially shifted towards an inflammatory phenotype (IFN‐γ) and away from a regulatory phenotype (Foxp3+ CD25+). This suggests that the specific dysbiosis observed in patients with MS favors an inflammatory T‐cell response. More definitive studies using the EAE mouse model of MS have shown that in germ‐free mice lacking gut microflora, EAE disease severity is reduced to an almost undetectable level, due to a more than twofold reduction in IFN‐γ and IL‐17 production from CD4+ T cells.33 Importantly, if CD4+ T cells from germ‐free mice were transferred to specific pathogen‐free mice harboring a diverse intestinal microflora, these cells gained the ability to mediate EAE disease development, suggesting that the gut microbiota is necessary to elicit the pathogenic Th1 and Th17 responses seen in EAE and perhaps MS.33 Importantly, it was recently demonstrated that colonization of germ‐free Myelin oliodendrocyte glycoprotein (MOG)‐specific TCR transgenic mice (RR mice) with gut microbiota from patients with MS resulted in increased incidence of spontaneous EAE development.130 This suggests that the microbiota of patients is sufficient to precipitate autoimmune disease. Together these studies suggest a gut–brain axis of communication that allows gut microbes to elicit autoimmune responses in the brain. Rheumatoid arthritis (RA) is an autoimmune disease that primarily affects joints but may also affect other parts of the body including the lungs and heart.131-133 Several studies have suggested that many patients with RA display antigen–antibody complexes with complement fixation in joints that can cause tissue damage and tumor necrosis factor‐α production.134-139 Recent studies also suggest that anti‐citrullinated protein antibodies are involved in RA pathogenesis.140, 141 Tfh cells are a T effector cell type specialized in helping B cells.142-144 Over‐reactive Tfh responses pose a threat of triggering excessive autoantibody production and autoimmune disease.145-149 In that regard, the presence of circulating CXCR5+ Tfh (cTfh) cells in the blood has been observed in patients with different autoimmune diseases, including RA.20 In a recent study assessing 77 treatment‐naive patients with RA, 21 treated patients with RA, and 80 healthy controls, the gut microbiome was found to be altered in patients with RA.150 In particular, Haemophilus spp. were depleted in individuals with RA and negatively correlated with serum autoantibodies titers, whereas Lactobacillus salivarius was over‐represented in individuals with RA and abundance correlated with disease severity (Fig. 2). Interestingly, similar to what has been observed in patients with MS, patients with RA undergoing treatment displayed partial normalization of their intestinal microflora compared with treatment‐naive patients. By using a photo‐labeling mouse model to track cell migration, our laboratory has demonstrated that a commensal bacterium, SFB, is able to promote the differentiation and migration Tfh cells from the PPs in the small intestine to systemic sites where they elicit autoimmune arthritis development.101 At the molecular level, SFB induce PP Tfh cell differentiation by limiting the access of IL‐2 to PP CD4+ T cells and DCs are required for SFB‐mediated IL‐2Rα suppression and up‐regulation of Bcl‐6, a master regulator of Tfh cells, in PPs. Furthermore, we have recently shown that SFB can also promote RA‐associated autoimmune lung disease through propagation and mobilization of gut‐derived Th17 cells.100 Importantly, this highlights a gut‐lung axis of communication through which specific gut commensal bacteria are able to promote pathogenic T‐cell responses leading to gut‐distal autoimmune pathology. In the collagen‐induced arthritis model of RA, dysbiosis characterized by outgrowth of Lachnospiraceae and Lactobacillaceae was detected before arthritis development.151 Furthermore, antibiotic‐induced depletion of the microbiota before induction of collagen‐induced arthritis reduced disease severity by 40% and was accompanied by reduction in the inflammatory cytokines IL‐17, IL‐22, and IL‐23 in the intestines along with reduced anti‐collagen antibodies. This suggests that the gut microbiota is necessary for autoimmune disease development and that alterations in the composition of the gut microbiota precipitate autoimmune disease. Systemic lupus erythematosus (SLE) is an autoimmune disease affecting almost all organs of the body, in which both autoreactive T cells and autoantibody‐producing B cells contribute to the pathogenesis of SLE.152 Like many gut‐distal autoimmune diseases, recent studies have linked gut microbiota dysbiosis with SLE.153 In a 2016 study from Lopez et al., it was shown that intestinal microbiota isolates from patients with SLE promoted naive T‐cell differentiation into Th17 cells.154 Furthermore, peripheral blood mononuclear cells from patients with SLE were enriched for both Th17 and Foxp3+ IL‐17+ cells compared with healthy controls. As described earlier, due to T cell plasticity, Treg cells are able to shift between regulatory and potentially pathogenic phenotypes. Hence, the presence of Foxp3+ IL‐17+ cells in the peripheral blood of patients with SLE suggests that the shift observed in the gut microbiome of these patients may promote inflammatory T‐cell responses and may negatively impact Treg cell stability. More recently, in a study by Luo et al. which assessed the intestinal microbiota dynamics of both SLE patients and the NZB/W F1 mouse model of SLE, it was shown that alteration in the gut microbiota resulted in decreased diversity with increased representation of Gram‐negative bacteria (Fig. 2).155 Interestingly, as NZB/W F1 mice progressed to overt disease, the relative abundance of Lactobacillaceae increased from 0·1% to 10%. Furthermore, there was a positive correlation between Lactobacillaceae abundance and disease severity in female NZB/W F1 mice. This suggests that reduction in α diversity, a measure of the number of different species present in a given site, and outgrowth of specific commensal microbes may promote autoreactive immune responses in susceptible individuals. Another report found a high frequency of Th17 cells in the kidneys of patients with glomerulonephritis, a form of SLE.156 By using Kaede mice to track intestinal T‐cell migration during glomerulonephritis induction, they observed that Th17 cells egress from the intestine and subsequently migrate to the kidney through CCR6 recognition of CCL20. Furthermore, depletion of gut Th17 cells in germ‐free and antibiotics‐treated mice ameliorated the autoimmune glomerulonephritis, suggesting that targeting the intestinal Th17 cells may offer a therapeutic strategy for autoimmune diseases. Hidradenitis suppurativa (HS) is a chronic inflammatory skin condition of the hair follicles thought to be mediated in large part by Th17 cells (Fig. 2).157 With respect to perturbations in the microbiota, most studies assess changes in the cutaneous microbiota as this is the site of the disease manifestation. Recently, HS has been identified to have a strong concurrence rate with inflammatory bowel disease, with over 17% of Crohn's patients also having HS.158 Hence, while there are definite changes in the cutaneous microbiome of patients with HS,159 taking a closer look at the gut microbiome may prove fruitful in the quest for identifying a causal mechanism. Type 1 diabetes (T1D) is a T‐cell‐mediated autoimmune disease characterized by the selective destruction of insulin secreting β‐cells in the pancreatic islets.160 Many patients with T1D present with increased intestinal permeability or ‘leaky gut’, which has been shown to precede the onset of clinical disease.161 In addition, patients with T1D also display an altered intestinal microbiome characterized by decreased α diversity and increased abundance of inflammatory species compared with healthy controls (Fig. 2).162 Hence, it is tempting to assume that in combination with increased intestinal permeability, dysbiosis could promote an inflammatory environment in the gut–proximal pancreatic tissue leading to activation of an autoimmune response. In a 2016 study from Costa et al., it was determined that autoimmune diabetes development in the streptozotocin‐induced model of T1D is dependent on translocation of gut microbiota to the pancreatic lymph node.163 Interestingly, islet‐infiltrating T cells seem to be of gut origin as they often express α4β7 integrin.83, 164, 165 We now know that the effect of commensal bacteria on autoimmune disease can be model dependent. For example, SFB is pathogenic in animal models of arthritis and multiple sclerosis32, 33 but protective in the NOD mouse model of type1 diabetes.166, 167 The beneficial and detrimental effects of SFB could depend on whether commensal‐mediated immunomodulation is enhancing or inhibiting the pathogenesis of each disease. For example, autoantibodies are a key pathogenic factor and diseases can be induced by passive transfer of autoantibodies in the K/BxN and EAE models.168-170 In contrast, type 1 diabetes in NOD mice is a T‐cell‐mediated autoimmune disease, and although B cells of NOD mice produce autoantibodies, these are not thought to play a diabetogenic role.171, 172 Hence, SFB, with their Tfh and autoantibody boosting effect, are more likely to play a pathogenic role in the K/BxN model and other antibody‐mediated autoimmune diseases than in T‐cell‐mediated autoimmune diseases such as in NOD mice. One feature that many of the autoimmune diseases have in common is evidence of gut‐derived T cells participating in the autoimmune response.83, 101, 156, 164, 165 This would suggest that perhaps one mechanism through which the gut microbiota modulates autoimmune responses is through mobilization of T cells from the tolerogenic environment of the gut to systemic sites where alleviated tolerogenic pressure allows these cells to become active and initiate autoimmune disease development.173-175 However, more studies are required to determine whether the altered microbiome drives changes in immunity or conversely the onset of immunological disease induces changes in the gut microflora in human patients. It is likely a combination, as changes in the gut microbiota precede onset of clinical autoimmune manifestations,162 yet some evidence suggests that perhaps T cells, Foxp3+ Treg cells in particular, regulate gut microbiota diversity.176 Conclusions and future directions There is a surge of recent studies investigating the molecular mechanisms of dysbiosis‐related autoimmune diseases. In both molecular mimicry and dual TCR theories, until recently, only infectious pathogens including viruses and bacteria have been implicated as the primary culprits,15-17 and little is known about the molecular mechanism by which asymptomatic commensal colonization could trigger autoimmunity. Our recent study along with others demonstrates a previously unknown condition that asymptomatic colonization by commensal bacteria in the gut is capable of triggering systemic autoimmune disease by molecular mimicking self‐antigen and skewing the dual TCR expression in the host. Notably, dual TCR expression is not limited to transgenic mouse models. In wild‐type mice and in humans, up to 15% and 33%, respectively, of peripheral T cells have been reported to express dual TCRs, due to incomplete allelic exclusion at the Tcra locus.177, 178 Future investigation is required to determine whether dual TCR expression is involved in dysbiosis‐related immune disorders in human patients. Another important, but poorly understood, aspect of microbiota–T‐cell interaction is how different microbial signals impact T‐cell stability and plasticity at the mucosal frontline. Understanding the plasticity and stability of T‐cell subsets in mucosal tissues is highly relevant for future therapeutic strategies as we will not be able to manipulate T cells for therapeutic purposes without understanding the mechanisms by which T cells shift between alternative programs because of exposure to gut microbes. As illustrated in this review, the use of animal models provides a powerful tool for mechanistic studies as it allows us to establish the causative effect of microbiota in disease development. By using germ‐free and specific pathogen‐free mouse models, numerous studies unravel the crucial roles of gut commensals in immune regulation in the context of health and disease. Although these studies provide promising clinical implications, various challenges need to be overcome by the field to harness these findings for future diagnostic and therapeutic approaches. One of the challenges is that the reductionist experiments in mice often do not reflect important features of the immune system in the adult human. In this regard, Beura et al. demonstrated that laboratory mice – like neonates, but not adult humans – lack effector‐differentiated and mucosal memory T cells.179 These cell populations are present in feral mice and pet store mice with constant and diverse microbial exposure. Furthermore, laboratory mice co‐housed with pet store mice display profound changes in immune systems, resulting in an immune signature that is more closely reflected by adult humans than by neonates. Hence, the ‘dirty’ mouse model may provide a unique advantage over the current reductionist mouse models and should be considered for studies with translational purposes in human disease. One of the biggest dilemmas facing the field of gut microbiota research is how to apply laboratory findings to clinical therapies. Currently, microbiota‐based therapy relies on three major strategies: complete fecal microbiota transplants (FMTs), administering one or more species of bacteria orally (probiotics), or administering substrates to favor the expansion of certain kinds of bacteria or a shift in metabolite production, a strategy known as prebiotics.180 Each of these approaches has limitations; for example, probiotics often colonize only transiently because of ineffective competition with the existing microbiota.181 Additionally, despite the focus on taxonomic composition analyzed by 16S rRNA sequencing of microbial communities in many studies, the functional relevance of microbial communities is more likely to be revealed by their metagenomic gene expression and metabolomics profiles. This is further proved by the fact that bacterial isolates of the same strain can display very different immunoregulatory capabilities.182 FMTs depend on severe depletion of the constituent microbiota through antibiotics and bowel flushing before administration of the transfer.183, 184 Other researchers are working to find alternative methods to circumvent the difficulties of FMTs, such as filtering donor material to the point of removing intact cells, leaving only bacterial byproducts such as metabolites.185 An additional approach is to identify bacterial metabolites able to modulate human immune responses and artificially administer the identified metabolites as novel therapeutics.186 This approach would be appealing from a pharmaceutical perspective, because it would allow the development of drugs that would need to be taken regularly. It would also minimize the factors that need to be controlled, since administering metabolites would not depend on the engraftment of a foreign bacterial species. However, a careful determination on how to achieve a comparable delivery of the metabolite that mimics the one produced by the intestinal microbiota will be crucial for the effectiveness of the treatment. In conclusion, the gut microbiota is a complex community that engages in significant cross‐talk with the host. A better understanding of host–microbe interaction and the underlying microbiota‐derived molecules that modulate the immune system and disease development may help to pave the way for better patient‐tailored interventions and microbial molecule‐based therapies for immune disorders. Disclosures The authors have no competing interests to declare. References
|
|
|
Scooped by
Gilbert C FAURE
December 24, 2025 8:10 AM
|
A mother's touch: microbial guardians of early immune imprinting
Trends in Immunology, Month 2025, Vol. xx, No. xx https://lnkd.in/gJuDgB4B
Group 3 Innate Lymphoid Cells (ILC3s) are a firmly established and universally accepted concept in immunology. They are considered the "innate counterparts" to T helper 17 (Th17) cells, as both share the master transcription factor, Retinoid-Related Orphan Receptor gamma t, and produce the cytokines IL-17 and IL-22.
This review:
· The Biological Paradigm: Infants are born with a pre-established "immune memory" despite developing in a relatively sterile environment. This in utero priming is driven by the maternal immune system and microbiota through a multi-modal exchange involving maternal microchimeric cells, IgG transfer, and microbiota-derived metabolites/antigens.
· Mechanisms of Action: Recent murine and human data demonstrate that maternal microbial products cross the placental barrier to actively fine-tune the fetal immune system. This results in antigen-specific immunological memory and epigenetic imprinting, effectively "programming" fetal immune cells before birth.
· Clinical Significance: This delicate priming process is highly susceptible to external stressors. Maternal dysbiosis, driven by diet, antibiotics, or infection, can disrupt these pathways, leading to aberrant immune development. Such prenatal perturbations are increasingly linked to the pathogenesis of autoimmune and immune-mediated disorders later in life.
Figure: Maternal factors that shape fetal immune priming.
During gestation, microbial and dietary antigens are trafficked across the placenta, partially via neonatal Fc receptor (FcRn)-mediated transport of immune complexes. These antigens are taken up by fetal dendritic cells (DCs) for priming of T cells, which are predisposed to differentiate into regulatory T cells (Tregs), thus establishing a level of immune tolerance toward commensals and dietary antigens before birth. Microbiota-associated metabolites, such as short-chain fatty acids (SCFAs) and tryptophan (Trp) derivatives, also cross the placenta and contribute to Treg priming, while maternal microchimeric cells take up residence in fetal tissues and promote tolerance of maternal antigens. Maternal interleukin (IL)-10 further promotes a tolerogenic immune milieu in the fetus, while, in situations of maternal immune activation (MIA), cytokines, such as IL-6 and IL-17, may skew newly activated T cells toward a more inflammatory profile, and alter the development of the intestinal epithelium and central nervous system. Dotted lines indicate pathways that are speculative.
|
|
Scooped by
Gilbert C FAURE
September 25, 2023 11:50 AM
|

|
Suggested by
LIGHTING
March 26, 2022 5:34 AM
|
Measles VirusMeasles virus (MV) binds to cell surface receptors by way of its hemagglutinin (H) protein to initiate infection.From: xPharm: The Comprehensive Pharmacology Reference, 2007Related terms:Subacute Sclerosing PanencephalitisVaccine EfficacyCD46Monospecific AntibodyParamyxoviridaeImmunityWild TypeHuman Immunodeficiency VirusView all TopicsMeasles VirusR. Cattaneo, M. McChesney, in Encyclopedia of Virology (Third Edition), 2008Measles virus (MV), one of the most contagious viruses known, was recognized clinically by the rash and other signs from early historical times. Measles still causes more than 300 000 deaths each year, mostly due to secondary infections facilitated by MV-induced immunosuppression. Therefore the World Health Organization has targeted it for eradication, an endeavor facilitated by the availability of a live attenuated vaccine with an outstanding efficacy and safety record. MV is an enveloped negative-strand RNA virus, and the study of its biology has given detailed insights about how it utilizes host cell components to promote its replication and particle assembly. Moreover, the MV interactions with the cellular receptors and the mechanisms used to invade and inactivate the host immune system are now better understood. The knowledge gained from basic research is currently used to develop multivalent MV-based vaccines, and vectors for targeting and eliminating cancer cells.View chapterPurchase bookRead full chapterURL: https://www.sciencedirect.com/science/article/pii/B978012374410400443XDevelopmental Aspects of Pagetic OsteoclastsDeborah L. Galson, ... G. David Roodman, in Advances in Pathobiology and Management of Paget's Disease of Bone, 2016MVNP Downregulation of FoxO3 and Sirt1 also Increase IL-6MVNP also was demonstrated to increase NFκB activity by downregulating expression of Sirtuin 1 (Sirt1), a class III protein deacetylase that targets acetylated NFκB and negatively regulates its activity [31]. MVNP decreases Sirt1 by triggering increased phosphorylation of Forkhead-box class O3 (FoxO3), resulting in decreased FoxO3 protein stability and decreased transcription of its target gene Sirt1 in OCL precursors and NIH3T3 cells. Several protein kinases have been reported to downregulate FoxO3 stability through phosphorylation, including AKT, ERK1/2, IKKβ, and IKKε [50–52]. It’s not yet known which, if any, of these are triggered by MVNP to phosphorylate FoxO3. However, TBK1 overexpression in TRAP-TBK1 BMM was sufficient to decrease Sirt1 mRNA (unpublished data), suggesting that activated TBK1 may phosphorylate FoxO3. Wang et al. [31] showed that NIH3T3 cells stably transduced with MVNP (MVNP-NIH3T3) demonstrated higher IL-6 promoter luciferase reporter activity than NIH3T3 cells transduced with empty vector (EV-NIH3T3), and ectopic expression of Sirt1 significantly decreased both the basal and MVNP-stimulated IL-6 promoter activity. Further, resveratrol, a Sirt1 gene activator, suppressed the high level of IL-6 mRNA in MVNP-NIH3T3 cells. Significantly, resveratrol inhibited OCL differentiation of BMM from both wild-type and MVNP mice. Strikingly, at a resveratrol dose that had little effect on wild-type OCL differentiation, the enhanced MVNP OCL differentiation was suppressed to wild-type levels. Higher resveratrol doses then suppressed wild-type and MVNP OCL differentiation to similar levels. Hence, MVNP acts via two pathways to increase IL-6 expression (Fig. 4.2).View chapterPurchase bookRead full chapterURL: https://www.sciencedirect.com/science/article/pii/B978012805083500004XNeurovirologyJane E. Libbey, Robert S. Fujinami, in Handbook of Clinical Neurology, 2014Measles virusMeasles virus (Chapter 27) is a Morbillivirus, of the family Paramyxoviridae, and is an enveloped single-stranded negative-sense RNA virus (Nathanson and Gonzalez-Scarano, 2007). Measles virus is spread by the respiratory route (Nathanson and Gonzalez-Scarano, 2007). One neurologic complication of measles virus infection, thought to be related to dysregulation of the cellular immune responses, as it can occur in the absence of viral replication in the CNS, is postinfectious encephalomyelitis, which develops within weeks of infection (Johnson et al., 1983, 1984; Hirsch et al., 1984; Johnson, 1987). However, measles virus can infect and persist in neurons (Parra et al., 1999; Ramakrishna et al., 2002). In immunocompetent individuals a CD4 + T-cell population mediates elimination of measles virus from neurons, possibly through secretion of IFN-γ (Parra et al., 1999; Schneider-Schaulies et al., 2003). Failure of the immune response to eliminate measles virus-infected cells completely from the CNS can result in viral persistence (Schneider-Schaulies et al., 1999).Measles virus is capable of persisting in neurons as a defective variant that spreads from neuron to neuron directly, without passage through the extracellular environment (Schneider-Schaulies et al., 1999, 2003; Lawrence et al., 2000; Nathanson and Gonzalez-Scarano, 2007). In this way the virus avoids detection and elimination by circulating high titers of measles virus-specific neutralizing antibody. The persistence of measles virus in the CNS can result in a progressive fatal encephalitis called SSPE developing in immunocompetent individuals several months to years after infection and recovery from acute measles virus infection (Schneider-Schaulies et al., 1999, 2003; Nathanson and Gonzalez-Scarano, 2007). As such, SSPE is primarily a disease of childhood and young adulthood (Gilden, 1983; Wolinsky, 1990).As described above, oligoclonal IgG antibody bands, with measles virus-restricted specificities, are characteristically found in the serum and CSF of patients with SSPE (Mehta et al., 1994; Burgoon et al., 2006; Tschen et al., 2006). These oligoclonal bands are a hyperimmune response to measles virus antigens, which, despite their neutralizing activity, are unable to control the viral infection (Mehta et al., 1994). This inability of measles virus-specific antibodies to control measles virus infection in SSPE patients may result from antibody-induced antigenic modulation by the virus (Fujinami and Oldstone, 1980, 1983; Fujinami et al., 1984). The expression of some measles virus antigens within and on the surface of measles virus-infected cells is altered upon binding of measles virus-specific antibodies such that the synthesis, assembly, and maturation of the virions are altered. In this way the measles virus-infected cells may avoid detection and lysis and measles virus may persist. Thus, in the case of measles virus, the antibody arm of the adaptive immune response to the virus may play a role in the initiation of viral persistence (Fujinami and Oldstone, 1980, 1983; Fujinami et al., 1984).View chapterPurchase bookRead full chapterURL: https://www.sciencedirect.com/science/article/pii/B9780444534880000109MeaslesWilliam J. Moss, in Tropical Dermatology (Second Edition), 2017Natural History, Pathogenesis, and PathologyMeasles virus is primarily transmitted by respiratory droplets over short distances and, less commonly, by small-particle aerosols that remain suspended in the air for long periods of time. The time from infection to clinical disease is approximately 10 days to the onset of fever and 14 days to the onset of rash. Persons with measles are infectious for several days before and after the onset of rash, when levels of measles virus in blood and body fluids are highest and when the symptoms of cough, coryza, and sneezing are most severe. The host immune response at sites of virus replication is responsible for the signs and symptoms of measles.Host immune responses to measles virus are essential for viral clearance, clinical recovery, and the establishment of long-term immunity.7 The protective efficacy of antibodies to measles virus is illustrated by the immunity conferred to infants from passively acquired maternal antibodies and the protection of exposed, susceptible individuals following administration of anti-measles-virus immunoglobulin. The duration of protective immunity following wild-type measles virus infection is generally lifelong.8 The immune responses to measles virus infection are associated with depressed responses to unrelated (non-measles-virus) antigens lasting for several weeks to months. This state of immune suppression enhances susceptibility to secondary bacterial and viral infections causing pneumonia and diarrhea, and is likely responsible for much of measles-associated morbidity and mortality.9 Vitamin A deficiency is a recognized risk factor for severe measles. The vitamin is essential for the maintenance of normal epithelial tissues throughout the body; measles virus itself infects and damages these tissues.View chapterPurchase bookRead full chapterURL: https://www.sciencedirect.com/science/article/pii/B9780323296342000146Measles Virus (Rubeola)Anne A. Gershon, in Mandell, Douglas, and Bennett's Principles and Practice of Infectious Diseases (Eighth Edition), 2015Growth of Measles Virus in Tissue CultureMeasles virus was first successfully isolated in the laboratory by Enders and Peebles in 1954.18 The virus was initially propagated in primary human renal cells but later was cultivated in cultured simian kidney cells. Wild-type measles virus is rather difficult to propagate in vitro because it is slow growing, and only a limited number of types of cell cultures are permissive for the virus.16 Typically, cytopathic effects produced by measles virus in tissue cultures consist of stellate cells with increased refractility and, especially on passage, multinucleated syncytial giant cells containing intranuclear inclusions. In the absence of cytopathic effects, virus replication can also be detected by hemadsorption of rhesus monkey erythrocytes. Presumptive isolates of measles virus are identified by typing with monoclonal antibodies by using immunofluorescence or plaque reduction tests.3,19 Reverse-transcriptase polymerase chain reaction (RT-PCR) assays for measles virus are also available (see later).View chapterPurchase bookRead full chapterURL: https://www.sciencedirect.com/science/article/pii/B9781455748013001624MeaslesAlpay Azap, Filiz Pehlivanoglu, in Emerging Infectious Diseases, 20142 What is the Causative Agent? (Taxonomy and Description of the Agent)Measles virus (MV) is a member of the genus Morbillivirus of the family Paramyxoviridea.4 It is an enveloped, non-segmented, single-stranded, negative-sense RNA virus. Measles virions are seen as pleomorphic spheres with a diameter of 100–250 nm on electron microscopy. Measles virus encodes at least eight structural proteins, which have letter names: F, C, H, L, M, N, P, and V. Of these proteins, H (hemagglutinin) has a role in the attachment of the virus to host cells, and F (fusion) is involved in the spread of the virus from one cell to another.4Measles virus is closely related to the viruses causing diseases in animals such as canine and phocine distemper and rinderpest viruses. It is stated that MV adapted to humans when humans first began to domesticate animals in Mesopotamia around 3000 BC.1 Today, wild MV is pathogenic only for primates.View chapterPurchase bookRead full chapterURL: https://www.sciencedirect.com/science/article/pii/B9780124169753000261Infections that cause secondary immune deficiencyVincent Robert Bonagura, David Walter Rosenthal, in Stiehm's Immune Deficiencies (Second Edition), 2020Measles virus: temporary immunosuppressionMeasles virus (MV) continues to cause child morbidity and mortality worldwide, despite the availability and use of an effective live attenuated measles vaccine.10–14 Part of the reason why control of MV continues to be elusive is that it is highly contagious for susceptible individuals and there are difficulties with vaccine delivery. MV infection begins in the respiratory tract, spreads systemically in lymphoid, epithelial and endothelial cells, and ultimately infects multiple organs,15 causing a characteristic fever, rash, and conjunctivitis 10–14 days after respiratory infection (Fig. 49.3A and B). High fever, rhinorrhea and conjunctivitis typically precede the rash and the rash migrates from the head and neck to the hands and feet over 3–4 days. Many of these manifestations are caused by the immune response made to MV, and commonly this response clears MV in infected tissues and prevents re-infection for life (Fig. 49.3C and D). However, MV infection can cause several weeks of immune suppression after resolution in select individuals. This is the primary cause of measles-associated deaths: MV-induced secondary infection.16 Although vaccination against measles is very high in the United States, 92.7% of children aged 19–35 months were vaccinated in 2017,17 there are pockets of unvaccinated people who are susceptible to local outbreaks of measles. Since “herd immunity” is primarily effective when the vaccination rate is around 96%,18 vaccination levels below this level leave children and adults at risk for primary MV infection and secondary microbial infections.Measles was the first virus clearly identified to cause increased susceptibility to other microbial secondary infections. Most often, measles-associated deaths are caused by severe, overwhelming pneumonia and diarrhea.16 Suppression of delayed hypersensitivity has been identified in tuberculin-sensitized individuals many weeks after complete resolution of MV infection (Fig. 49.3C).19 Furthermore, several weeks after successful MV recovery, increased susceptibility to other infections has been reported, and T cell function and in vitro proliferation of T cells in response to mitogens has been shown to be markedly decreased (Fig. 49.4A and B).1,20,21 Immunosuppression occurs during a period of intense immune activation that occurs during the onset of the MV rash and anti-MV immune responses (Fig. 49.3C and D). Lymphopenia, skewing of Th2-like chemokine polarized responses, and suppression of lymphocyte proliferation have also been documented (Fig. 49.3D). MV infection causes decreases in T and B cells in the blood during the MV rash period.22–25 Altered trafficking and increased apoptosis of MV-infected and uninfected lymphocytes contribute to the development of lymphopenia.22,26–30 While lymphocyte numbers rapidly return to normal in the blood after the rash resolves, immunologic abnormalities persist.21,22,31,32 Immune suppression, Th2 cytokine polarization of CD4+ T cells, and Treg induction have been associated with indirect immunosuppression caused by MV infection.33,34 MV infection is also associated with suppression of IL-12 expression, lymphocyte CD30 expression, and IL-4, IL-10, and IL-13 expression after rash resolution.35–37 Reduction of IL-12 production reduces T cell expression of type I cytokines, particularly IFN-γ10,32 (Fig. 49.3D). It is possible that MV interacts with the complement regulatory molecule CD46 in polarizing Th2-like cytokine production, causing activation of signaling cascades that modify cell function, although this interaction is not firmly established.38,39 The MV-CD46 interaction may alter innate immunity by selectively downregulating receptor expression.40–46 This would increase susceptibility to complement-mediated lysis of MV-infected cells, and decrease antigen presenting cell production of IL-1247,48 and crosslinking of CD46 on T cells, leading to the induction of regulatory CD4+ T cells and enhanced IL-10 levels.49 These interactions would induce Th2-like polarization that would favor B cell maturation, provide lifelong MV antibody memory, and protect against MV re-infection. This polarization, however, would also depress APC activation and Th1-like responses to new pathogens.MV suppresses PBMC proliferation to mitogens after MV resolution, and this continues for several weeks (Fig. 49.4B).20,31 IL-2 supplementation can improve, but not fully restore, this responsiveness. This suggests that defective IL-2 expression is in part responsible for this proliferative defect.50 Cell cycle arrest in G1 after in vitro infection with MV is a recognized cause of hyporesponsiveness to mitogens.42,51–53 MV RNA can persist in PBMCs for months after MV resolution54,55 and may reduce mitogen proliferation, although this has not been established. The receptor used by wild-type MV to infect cells, CD150, is a dual function co-receptor for lymphocyte activation, and enhances IFN-γ expression.56–58 However, MV binding to CD150 can also downregulate receptor expression.59,60 T cell signaling through the MV glycoprotein complex of H and F1-F2 in the membranes of virions or MV-infected cells61–65 may also contribute to immunosuppression. This inhibitory signal prevents T cell S-phase entry for several days, and is independent of cell death, membrane fusion, soluble inhibitor production, or T cell infection.52,61,62,65–67 Thus, there is a delay in cell cycle progression and an accumulation of T cells in the G0/G1 phase.52,66,67 The mechanism by which H/F1-F2 suppresses mitogen-induced proliferation is unknown, but it is associated with MV-induced interference of T cell activation of phosphoinositide 3-kinase (PI3K) in T cells, or IL-2 receptor ligation.68 IL-2 added to MV-treated cells activates signal transducer and activator of transcription 3 (STAT3) but fails to activate Akt kinase, which is required for cell cycle progression.69 The modulatory effects of MV with glycoprotein complexes, and the downstream consequences of this interaction, have recently been summarized.10,68–70 While the relevance of these processes to the in vivo suppression of T cell lymphoproliferation remains to be identified. The combination of the established mechanisms leading to post-MV infection immunosuppression, and those that remain to be elucidated, cause, in select individuals, severe and on occasion, fatal secondary infection with other microbes.A key epidemiologic factor in measles-related deaths is vitamin A deficiency. In the developing world, the World Health Organization recommends vitamin A supplementation. Studies have demonstrated improved outcomes and suggest an effect on the mucosal barrier and also on improved T cell function though by an undefined mechanism.Read full chapterView PDFRead full chapterURL: https://www.sciencedirect.com/science/article/pii/B9780128167687000491MeaslesWilliam J. Moss, ... W. Harry Feinstone, in Vaccines for Biodefense and Emerging and Neglected Diseases, 2009Measles VirusMeasles virus is a spherical, nonsegmented, single-stranded, negative-sense RNA virus and a member of the Morbillivirus genus in the family of Paramyxoviridae. Other members of the Morbillivirus genus are rinderpest virus and canine distemper virus. Although RNA viruses have high mutation rates, measles virus is an antigenically monotypic virus, meaning that the surface proteins responsible for inducing protective immunity have retained their antigenic structure. The public health significance is that measles vaccines developed decades ago from a single measles virus strain remain protective worldwide. Measles virus is killed by ultraviolet light and heat. Attenuated measles vaccine viruses retain these characteristics, necessitating a cold chain for transportation and storage.The measles virus RNA genome consists of approximately 16,000 nucleotides and is enclosed in a lipid-containing envelope derived from the host cell. The genome encodes eight proteins, two of which (V and C) are nonstructural proteins and are transcribed from the phosphoprotein (P) gene. Of the six structural proteins, P, large protein (L), and nucleoprotein (N) form the nucleocapsid housing the viral RNA. The hemagglutinin protein (H), fusion protein (F), and matrix protein (M), together with lipids from the host cell membrane, form the viral envelope.The H protein interacts with F to mediate fusion of the viral envelope with the host cell membrane (Malvoisin and Wild, 1993). The primary function of the H protein is to bind to the host cellular receptors for measles virus. The two identified receptors are CD46 and CD150 (SLAM). CD46 is a complement regulatory molecule expressed on all nucleated cells in humans. SLAM, an acronym for signaling lymphocyte activation molecule, is expressed on activated T and B lymphocytes and antigen-presenting cells. The binding sites on H for these receptors overlap and strains of measles virus differ in the efficiency with which each is used. Wild-type measles virus binds to cells primarily through the cellular receptor SLAM whereas most vaccine strains bind to CD46; however, most measles virus strains can use both CD46 and SLAM as receptors during acute infection (Schneider et al., 2002). Additional, as yet unidentified receptors for measles virus exist on human endothelial and epithelial cells (Andres et al., 2003).Other measles virus proteins are involved in viral replication. The P protein regulates transcription, replication, and the efficiency with which the N assembles into nucleocapsids (Spehner et al., 1997). The M protein links ribonucleoproteins with envelope proteins during virion assembly. The functions of V and C proteins have not been clearly defined, but both appear to contribute to the virulence of measles virus by regulating transcription and sensitivity to the antiviral effects of interferon (IFN) α/β (Valsamakis et al., 1998; Patterson et al., 2000).Variability within the genome is sufficient to allow for molecular epidemiologic investigation. Genetic characterization of wild-type measles viruses is based on sequence analysis of the genes encoding the N and H proteins. One of the most variable regions of the measles virus genome is the 450-nucleotide sequence at the carboxy-terminal of the N protein, with up to 12% variability between wild-type viruses. The World Health Organization (WHO) recognizes 8 clades of measles virus (designated A through H) and 23 genotypes (World Health Organization, 2006). New genotypes likely will be identified with enhanced surveillance and molecular characterization. As measles control efforts intensify, molecular surveillance of circulating measles virus strains can be used to document interruption of measles virus transmission and to identify the source and transmission pathways of measles virus outbreaks (Rota and Bellini, 2003). Molecular epidemiologic tools also would be important in documenting deliberate bioterrorist introductions of wild-type or genetically modified measles virus strains.Read full chapterView PDFRead full chapterURL: https://www.sciencedirect.com/science/article/pii/B9780123694089000305Viruses as Infectious Agents: Human and Animal VirusesRoberto Cattaneo, Michael McChesney, in Encyclopedia of Virology (Fourth Edition), 2021Life CycleMeV begins its circuit through selected organs of the human body within alveolar macrophages and dendritic cells (DC), which express the primary receptor SLAM. These cells first transfer the infection through the epithelial barrier, and then spread it into lymphoid tissues (Fig. 4, left panel). SLAM was originally identified on activated B and T lymphocytes, but it is also expressed constitutively on immature thymocytes, memory T cells, and certain B cells. Subsets of other cell types, including monocytes and DC, also express SLAM. This cellular distribution overlaps with the susceptibility of different cell types to wild-type MeV infection. Another strong argument for the central role of SLAM in MeV tropism is the fact that three morbilliviruses (MeV, canine distemper virus, and rinderpest virus) enter cells via SLAM (human, canine, or bovine, respectively). Experiments in macaques revealed that the earliest target cells after intratracheal MeV inoculation are DCs and alveolar macrophages.More recently nectin-4, also called poliovirus receptor-like-4 (PVRL4), was shown to serve as the receptor for MeV spread in the upper airway epithelium (Fig. 4, right panel). This adherens junction protein interacts with H with five times higher affinity than SLAM. Nectin-4 sustains basolateral entry of MeV, and of all animal morbilliviruses examined, into upper airway epithelial cells, including those of the trachea.Contrary to the infections with other respiratory viruses, MeV enters the airway epithelium “en masse”: several days after host-to-host transmission, highly infected immune cells synchronously deliver large amounts of virus to the upper airways, for secondary amplification. Since the upper airways are the anatomical location most useful to support particle aerosolization, this two-phase mechanism of host invasion may account for the extremely contagious nature of MeV infection.The live attenuated MeV vaccine strain, Edmonston, can also use the regulator of complement activation membrane cofactor protein (MCP; CD46) as a receptor. The primary function of CD46 is to bind and promote inactivation of the C3b and C4b complement products, a process protecting human cells from lysis by autologous complement, a function that requires ubiquitous expression. Only tissue-culture adapted MeV interact with CD46, and indiscriminate cell entry through this protein correlates with MeV attenuation. A chimeric MeV expressing a vaccine strain H protein, which binds to CD46, is attenuated in the nonhuman primate, and productive infection is still confined to SLAM-expressing cells in vivo.View chapterPurchase bookRead full chapterURL: https://www.sciencedirect.com/science/article/pii/B9780128096338215069Rubeola VirusYvonne A. Maldonado, Avinash K. Shetty, in Principles and Practice of Pediatric Infectious Diseases (Fifth Edition), 2018Description of the PathogenMeasles virus (MV) is an enveloped, nonsegmented, negative-strand RNA virus belonging to the Morbillivirus genus in the Paramyxoviridae family. MV is closely related to rinderpest virus, a cattle pathogen that was eradicated in 2011.6 MV genome consists of 15,894 nucleotides and encodes eight proteins.7 The surface envelope glycoproteins and the hemagglutinin (H) and fusion (F) proteins are the main targets for development of neutralizing antibodies.8 The matrix (M) protein is important in virus assembly. The internal proteins, nucleoprotein (NP), polymerase phosphoprotein (P), and large protein (L), form the nucleocapsid. Two nonstructural proteins (C and V) regulate the cellular response to infection.7The receptor binding H protein interacts with F protein and mediates virus attachment and host cell entry. The F protein enhances cell-to-cell spread of the virus. Neutralizing antibodies are primarily directed against the H protein and confer lifelong immunity.8 There are three identified cellular entry receptors for MV. Human signaling lymphocyte activation molecule (i.e., hSLAM or CD150) is a common immune cell receptor for all MV strains, whereas membrane cofactor protein (i.e., MCP or CD46) is a receptor for vaccine strains.9 A third receptor, poliovirus receptor–like 4 (i.e., PVRL4 or Nectin 4) is expressed on the adherens junctions of epithelial cells.10Wild-type MV infects only primates. Although MV is a monotypic virus, minor genetic and antigenic variation occurs in some virus strains.11 These antigenic variations have not compromised long-lasting immunity. MV is inactivated by lipid solvents, heat, and light.View chapterPurchase bookRead full chapterURL: https://www.sciencedirect.com/science/article/pii/B9780323401814002279
|
|
Scooped by
Gilbert C FAURE
October 8, 2020 4:10 AM
|
KEY POINTS Pre-existing BCG immunity influences T cell responses of subunit booster vaccines. M. tuberculosis–specific subunit vaccines bypass this mechanism and improve protection. Abstract Despite the fact that the majority of people in tuberculosis (TB)–endemic areas are vaccinated with the Bacillus Calmette–Guérin (BCG) vaccine, TB remains the leading infectious cause of death. Data from both animal models and humans show that BCG and subunit vaccines induce T cells of different phenotypes, and little is known about how BCG priming influences subsequent booster vaccines. To test this, we designed a novel Mycobacterium tuberculosis–specific (or “non-BCG”) subunit vaccine with protective efficacy in both mice and guinea pigs and compared it to a known BCG boosting vaccine. In naive mice, this M. tuberculosis–specific vaccine induced similar protection compared with the BCG boosting vaccine. However, in BCG-primed animals, only the M. tuberculosis–specific vaccine added significantly to the BCG-induced protection. This correlated with the priming of T cells with a lower degree of differentiation and improved lung-homing capacity. These results have implications for TB vaccine design. This article is featured in Top Reads, p.1979 Introduction Mycobacterium tuberculosis infection is the leading cause of death because of a single infectious agent and has been in the top 10 causes of death worldwide for years (1).The only vaccine currently available against tuberculosis (TB) is M. bovis Bacillus Calmette–Guérin (BCG). When administered in early life, BCG efficiently prevents severe forms of childhood TB, but the efficacy against pulmonary disease in adulthood, the most common form of TB disease, is variable (2, 3). Thus, a new vaccine that prevents active pulmonary TB is needed to reduce M. tuberculosis transmission and TB-related mortality. CD4 T cells have been shown to be critical for host resistance to M. tuberculosis infections and are therefore the most common cell type targeted in preclinical and clinical TB vaccine development (4, 5). During M. tuberculosis infection, Ag expression and presentation have a major effect on differentiation and function of CD4 T cells. Recent mouse studies have shown that TB infection drives the differentiation of M. tuberculosis–specific CD4 T cells away from central memory T cells (e.g., secreting IL-2) toward effector/effector memory T cells that predominantly secrete IFN-γ (6). This results in a loss of self-renewing T cell subsets because of an impairment in the IL-2–producing capacity and a reduced capacity to traffic into the infected lung parenchyma (7, 8). Circulating T cells’ ability to populate the lung parenchyma has been established as a necessity for T cell–mediated protection in the lung (7, 9), possibly because a direct recognition of infected cells by CD4 T cells via the TCR is required (10). Thus, the ability to resist functional differentiation and home into inflamed lung tissues are key features for long-term protective CD4 T cells (7, 9). Similar to M. tuberculosis infection, the live mycobacterial BCG vaccine has been shown to promote differentiation and functional exhaustion of CD4 T cells in parenteral BCG-vaccinated mice, resulting in a failure to efficiently maintain long-term protection against M. tuberculosis (11–13). A recent study comparing different TB vaccines in clinical testing suggests that BCG may also induce more differentiated T cells than subunit vaccines in people (14). In line with this, we have recently shown that vaccination with an adjuvanted protein subunit vaccine (H56/CAF01) elicits less differentiated CD4 T cells with the capacity to localize to the infected parenchyma (15). In naive animals, such T cells are readily induced, but it has proven difficult to substantially reprogram the immune response after M. tuberculosis exposure by subunit vaccination (16–20). Given the similarities between the immune response arising from BCG vaccination and M. tuberculosis infection, we hypothesize that pre-existing “BCG-imprinted” T cells dictate the phenotype of the immune response induced by subsequent subunit booster vaccines. To investigate this, we designed two novel vaccines, H64 and H74, that selectively incorporated M. tuberculosis–specific (or “non-BCG”) Ags and compared the protective efficacy and T cell phenotype to a known booster vaccine sharing all of its Ags with BCG (H65) (21). Thus, H65 was tested as a classical BCG booster vaccine, whereas the H64 and H74 subunit vaccines supplement BCG’s Ag repertoire with M. tuberculosis–specific Ags. For comparability, the three vaccines consisted of six Ags that were either secreted by or associated with the type VII secretion system (also called the ESX secretion systems). H64 and H74 consisted of ESX-1–associated Ags (M. tuberculosis specific), whereas H65 consisted of Ags associated to ESX-2, 3, and 5 (also present in BCG). We first confirmed that the ESX-1 Ags were protective in mice and guinea pigs and that the level of protection was similar to the BCG boosting vaccine H65. We then moved on to show that in BCG-primed mice, the CD4 T cells induced by the H65 booster vaccine were more differentiated than the CD4 T cells induced by the ESX-1–based vaccine. Importantly, the T cells specific for the ESX-1 vaccine maintained their polyfunctionality and low differentiation status during chronic M. tuberculosis infection and were superior in entering the M. tuberculosis–infected lung parenchyma. As a result, the lung bacterial burden was significantly decreased in the BCG plus ESX-1 vaccination group compared with the groups with either BCG alone or BCG boosted with the H65 vaccine. These data add to the body of evidence supporting the use of ESX-1–associated (or other M. tuberculosis–specific/non-BCG) Ags in future TB vaccines (16, 22–25) and address the potential influence of BCG priming on subsequent booster vaccines. Materials and Methods Animals Six- to ten-week-old female mice or 400–500 g outbred female Hartley guinea pigs (Charles River Laboratories) were rested for 1 wk prior to initiation of any experimental procedures. Except for the M. tuberculosis Beijing HN878 challenge study, all mouse experiments were performed with female CB6F1 mice (Envigo) at Statens Serum Institut according to the Danish Ministry of Justice and Animal Protection Committees under permit 2014-15-2934-01065 and in compliance with European Union Directive 2010/63/EU. Mice were provided with radiation-sterilized food (Harlan Scandinavia) and water ad libitum and handled in accordance with the Danish Ministry of Justice and Animal Protection Committee regulations by authorized personnel. Infected mice were housed in a biosafety level 3 facility in cages contained within laminar flow safety enclosures (Scantainer, Scanbur). In the challenge study with the hypervirulent M. tuberculosis Beijing HN878, female C57BL/6 mice were purchased from SLC (Shizuoka, Japan). All animal experiments were performed according to the Korean Food and Drug Administration regulations and guidelines. The experimental protocols were reviewed and approved by the Ethics Committee and Institutional Animal Care and Use Committee (Permit Number: 2017-0264). All in vivo experiments were carried out under barrier conditions in an animal biological safety level 3 facility at the Avison Biomedical Research Center at Yonsei College of Medicine. Guinea pigs were maintained under animal biosafety level 3 barrier conditions in isolator cages (Thoren Caging Systems, Hazleton, PA) at Colorado State University. All experimental procedures were conducted in accordance with the Public Health Service Policy on the Humane Care and Use of Laboratory Animals and approved by the Colorado State University Institutional Animal Care and Use Committee (approval no. 13-4565A). Recombinant proteins All DNA constructs used in this study were made by chemical synthesis and codon optimized for expression in Escherichia coli before insertion into the pJ 411 expression vector (ATUM, Menlo Park, CA). Hybrid H64 and H74 were protein fusions without linkers between the six open reading frames. To minimize protein aggregation, all codons encoding cysteine were replaced with serine codons, five in H74 and three in H64. In both fusions, we added a His tag at the N-terminal end (MHHHHHH-). After transformation into E. coli BL21 (DE3) (Agilent Technologies), protein expression was induced with 1 mM isopropyl β-d-1-thiogalactopyranoside in 3-l cultures, and the proteins were purified from inclusion bodies by a three-step process as previously described (26). Hybrid H56 and H65 were designed as earlier described (21, 27) and expressed and purified in the same way as H74 and H64. The products were pure full-length products (>99% purity) with a protein concentration between 0.3 and 0.7 mg/ml and a total yield between 4 and 15 mg for the protein batches produced for this work. The identity of all purified protein batches was confirmed by mass spectrometry analysis (matrix-assisted laser desorption/ionization–time-of-flight). Immunizations and infections Mice were immunized s.c. three times at 2-wk intervals at the base of the tail with the fusion protein formulated in a cationic liposome adjuvant. Cationic liposomes (CAF01, 250 μg dimethyldioctadecyl-ammonium/50 μg trehalose 6,6-dibehenate) were emulsified with 1–10 μg fusion protein in 10 mM sterile Tris buffer (pH 7.4) to a final volume of 200 μl for each injection. Negative control mice received three equivalent doses of saline, and positive control mice received a single dose of 1 × 10⁵ CFU M. bovis BCG Danish 1331 (Statens Serum Institut, Copenhagen, Denmark) given s.c. in the first round of immunization. In M. bovis BCG boost experiments, mice received one s.c. injection of 1 × 10⁵ CFU M. bovis BCG Danish 1331 and were rested 8–26 wk, depending on the experiment, before vaccination three times with fusion protein as described above. Six weeks after the third immunization, mice were challenged with 50–100 M. tuberculosis strain Erdman (American Type Culture Collection), H37Rv (American Type Culture Collection 27294), Kazakhstan (mycobacterial interspersed repetitive units [MIRU] 1270-52), Vietnam (MIRU 1393-252), Beijing (MIRU 94-32), or Beijing HN878 suspended in PBS Tween 20 (0.05%). For M. tuberculosis strain Erdman, H37Rv, Beijing, Vietnam, and Kazakhstan, performed at Statens Serum Institut, we used a Biaera exposure system controlled by the AeroMP aerosol management, and for the hypervirulent M. tuberculosis strain Beijing HN878 experiment, performed at Yonsei College of Medicine, mice were infected with 60–70 virulent mycobacteria per mouse via the respiratory route using the inhalation chamber (Glas-Col, Terre Haute, IN). Guinea pigs (10/group), housed at Colorado State University, were immunized via the i.m. route and rested for 10 wk. A saline-treated and an intradermal M. bovis BCG–vaccinated group (inoculated with 103 CFU via the intradermal route) were included as a negative and positive control, respectively. Ten weeks postvaccination, guinea pigs were infected with a low-dose aerosol delivering ∼10 viable mycobacteria of virulent M. tuberculosis strain H37Rv into the lung of each animal. The animals were euthanized when they reached the set criteria established by the Institutional Animal Care and Use Committee, such as being moribund or exceeding acceptable weight loss and/or being affected in their respiratory rate (labored/heavy breathing). The body temperature was measured to track the clinical progression of the disease. For this, guinea pigs received a s.c. microchip implant (IPT-300 Bio Medic Data Systems, Seaford, DE) that allowed for the measurement of temperature and also carried information about experiment number and animal number. The body temperatures of individual guinea pigs were assessed each day at approximately the same time in the afternoon using a DAS-6006/7 scanner transponder (Bio Medic Data Systems). Isolation of cells and CFU measurements Spleen and lymph nodes from individual animals were kept at 4°C until processed through 70-μm nylon cell strainers (BD Pharmingen) followed by two washes and resuspension of the mononuclear cells in RPMI 1640 containing 5% FBS. Isolated lungs were transferred into Miltenyi C tubes containing HEPES/RPMI 1640 supplemented with collagenase (Roche/Sigma). The lungs were subsequently homogenized and digested for 30–45 min at 37°C and passed through cell strainers (BD Biosciences). After washing, the cells were resuspended in RPMI 1640 containing 5% FBS and stored at 4°C until use. For CFU measurements, lung homogenates were prepared in PBS Tween 80 (0.05%) from individual mice and plated at 3-fold serial dilutions on Middlebrook 7H11 Bacto Agar. After 3 wk of incubation at 37°C, the CFU were enumerated. Flow cytometry Single-cell suspensions of splenocytes or lung mononuclear cells (2 × 10⁶ cells/well) were stimulated in vitro in V-bottom 96-well plates at 37°C in 200 μl complete media containing anti-CD49d (1 μg/ml) and anti-CD28 (1 μg/ml) Abs in the presence of rAg (2 μg/ml) for 1 h. Subsequently, 10 μg/ml brefeldin A (Sigma-Aldrich) was added, and the incubation continued for another 5–6 h. Following overnight storage at 4°C, cells were washed in FACS buffer (PBS containing 0.1% sodium azide and 1% FBS) and stained 30 min at 4°C for surface markers with mAbs as indicated. We used 1:400 dilutions of anti-CD4–Brilliant Violet 510 (clone RM 4.5; BioLegend), anti-CD4–Brilliant Violet 786 (clone GK1.5; BioLegend), 1:100 dilutions of anti-CD4–PerCP (clone GK1.5; BioLegend), or 1:200 dilutions of anti-CD4–FITC (clone RM4.4; BD Biosciences) and 1:600 dilutions of anti-CD44–FITC (clone IM7; eBioscience) and anti-CD8–PerCP-Cy5.5 (clone 53-6.7; eBioscience). Cells were then washed in FACS buffer, permeabilized using the Cytofix/Cytoperm kit (BD Biosciences) according to the manufacturer’s instructions, and stained intracellularly for 30 min at 4°C in dilutions of 1:200 using anti–IFN-γ–PE-Cy7 or anti–IFN-γ–PerCP-Cy5.5 (clone XMG1.2; eBioscience), anti–TNF-α–PE or anti–TNF-α–PeCy7 (clone MP6-XT22; eBioscience), anti–IL-17–allophycocyanin (clone eBio17B7; eBioscience), or dilutions of 1:100 using anti–IL-2–allophycocyanin-Cy7 (clone JES6-5H4; BD Biosciences) mAbs. Cells were subsequently washed with BD Perm/Wash Buffer (BD Biosciences) and resuspended in FACS buffer. Data were collected by running the stained cells on a FACSCanto, FACSCalibur, or FACSFortesa flow cytometer (BD Biosciences) and analyzed using FlowJo software v.10.0.7. In vivo intravascular labeling of T cells At the day of the experiment, mice were injected i.v. with 2 μg of FITC-labeled Abs against CD45.2 in a total volume of 200 μl (clone 102; BioLegend, San Diego, CA). Three minutes after Ab injection, mice were euthanized, and single-cell suspensions were prepared as described above. Adoptive transfer and lung homing For coadoptive transfer studies, donor CD4 T cells from subunit-vaccinated and M. bovis BCG plus subunit–vaccinated animals were isolated by negative selection 3 wk after the last immunization. In brief, cells were isolated from spleen, medial iliac, inguinal, and axillary lymph nodes from eight individual vaccinated donor animals, pooled within the groups and enumerated. Untouched CD4 T cell enrichment was performed from 5 × 10⁸ cells per group using the EasySep Mouse CD4 T cell Enrichment Kit following the manufacturer’s instructions (STEMCELL Technologies). After enrichment, cells were counted, and the density was adjusted to 2.5 × 10⁷ cells per ml for each group (93–95% purity). For tracking, the purified cells were differentially stained for 10 min with 10 μM Cell Proliferation Dye eFluor 450 or 5 μM Cell Proliferation Dye eFluor 670 (Thermo Fisher Scientific). The proliferation dyes were quenched with PBS containing 20% FBS followed by washing and resuspension in PBS. Stained cells were mixed in a ∼1:1 ratio and coadoptively transferred into recipient mice that were infected with M. tuberculosis strain Erdman 3 wk prior. Two hundred microliters (5 × 10⁶ CD4 T cells) was injected into the lateral tail vein of individual recipient mice (the equivalent of one donor mouse per recipient mouse). Eighteen hours after transfer, recipient mice were injected with FITC-labeled anti-CD45.2 Abs for intravascular labeling (clone 102; BD Biosciences) and single-cell suspensions from the lung prepared as described above. Statistical analysis Prism 7 software (GraphPad Prism ver. 8.2.1, San Diego, CA) was used for all statistical analyses. Mean and SEM are indicated for log-transformed CFU counts. Mean and SD are indicated for immune responses. One-way ANOVA combined with Tukey multiple comparison test was used for comparing multiple groups. Statistical significant differences are indicated by asterisks in the figures: *p < 0.05, **p < 0.01, ***p < 0.001, and ****p < 0.0001. In the guinea pig experiment, the nonparametric log-rank test was used to compare the survival distributions of two samples comparing the survival curves for the vaccinated groups against the saline group. Results ESX-1–associated Ags (M. tuberculosis–specific) provide protection in mice and guinea pigs To investigate the influence of BCG priming on subsequent subunit vaccination, we first designed protective subunit vaccines that selectively incorporated M. tuberculosis–specific Ags, which are not shared with BCG. The M. tuberculosis genome encodes ∼4000 proteins, of which many are potential vaccine targets. However, ∼3900 of these have highly similar orthologs in the BCG genome, which significantly limits the number of potential Ags for this type of vaccine (28, 29). In our selection, we exploited that all BCG substrains lack the genomic locus “region of difference 1” (23), which includes the core genes for the ESX-1 secretion system. In virulent M. tuberculosis strains, ESX-1–secreted proteins are among the most immunogenic Ags and are frequently recognized in TB patients and latently infected individuals (30, 31). However, in BCG, the region of difference 1 deletion is expected to prevent priming of T cells against ESX-1–associated Ags, and we therefore selected among this group of proteins for the first subunit vaccine, referred to as H64. We selected six ESX-1–associated Ags for which proteome studies had identified the proteins in M. tuberculosis culture filtrate or membrane fractions (Table I) and constructed the H64 subunit vaccine as a recombinant fusion protein (Fig. 1A). In H64-vaccinated CB6F1 mice, the CD4 T cells recognized the EsxA, EspD, and EspR Ags (Fig. 1B), and we found that the subunit vaccine induced protection with protein doses ranging from 0.01 to 25 μg per vaccination peaking in the range of 1–5 μg (Fig. 1C). Based on this, an intermediate dose of 2 μg was selected for future mouse studies. Because disease progression and granuloma formation in M. tuberculosis–infected guinea pigs better mimic features of human TB pathology, we also tested the H64 vaccine in Hartley guinea pigs in a long-term infection model. Guinea pigs were challenged with a low dose of virulent M. tuberculosis H37Rv after vaccination with different doses of H64. Animals that reached predefined human end points (weight loss or impact on respiratory rate) were euthanized. Twenty-two weeks after being infected, all animals in the saline control group had been euthanized with a mean survival time of 16.2 wk (SD = ±1.8) (Supplemental Fig. 1A). In comparison, the mean survival time of the M. bovis BCG-vaccinated guinea pigs was 65.1 wk (±8.9). In the four H64-vaccinated groups, the mean survival time ranged from 22.4 wk (±2.3) to 41.6 wk (±9.0) (Fig. 1C). Statistical comparison confirmed that all vaccination groups were better protected than saline-vaccinated animals (p < 0.02, log-rank test). After having confirmed that the ESX-1–associated Ag combination was protective in both mice and guinea pigs, we continued our study of the H64 vaccine by testing its protective efficacy against different challenge strains. Because M. tuberculosis strains harbor genetic diversity that translates into significant differences in Ag diversity, immunogenicity, and virulence, we selected four clinically relevant M. tuberculosis strains belonging to different lineages (2–4) to ensure that the protective signal of H64 was robust and broadly relevant (Fig. 1D, Supplemental Fig. 1B) (32). Similarly to the results with M. tuberculosis Erdman in Fig. 1C, H64 vaccination induced significant protection against all four strains (p < 0.05 or lower) and was equal to or better than the protection obtained with the H56 subunit vaccine that was included to benchmark the new vaccine. In the experiment with H37Rv, H64 was more protective than BCG, but with the other clinical strains, BCG induced similar or better protection than H64 (Fig. 1D). To test how the vaccine performed against a more “aggressive” strain, we challenged mice with M. tuberculosis HN878, which is regarded as hypervirulent because of its rapid growth and induction of severe lung inflammation in mice (33). In this model, both BCG and H64 protected efficiently at week 4 of the infection (p < 0.001), but by week 12, BCG had lost most of its protection, whereas bacterial numbers in H64-vaccinated animals remained significantly lower than BCG as well as the saline control (Fig. 1E, p < 0.005 and p < 0.0001, respectively). View inlineView popup Table I. M. tuberculosis Ags in the H64 fusion protein FIGURE 1. H64 (ESX-1–associated Ags) provide protection against M. tuberculosis in mice and guinea pigs. (A) Illustration of the subunit vaccine H64. The fusion protein is based on ESX-1–associated Ags and does not share Ags with M. bovis BCG. The figure is not drawn to scale. The m.w. of the individual Ags is given in Table I. (B) Ag recognition of splenocytes after immunizing CB6F1 mice with H64 (n = 3). Single-cell cytokine expression was measured by flow cytometry. Any CD4 cell that produced either IFN-γ, TNF-α, and/or IL-2 in response to Ag stimulation was taken as Ag specific. The spleen cells were stimulated with single Ags from H64. EsxH stimulation was included as a negative control (“Control”). Bars and lines illustrate the mean and SD for each Ag. (C) Black curve: protective efficacy studies in CB6F1 mice. Animals were immunized with different doses of H64 in CAF01 adjuvant. The bacterial load was measured in lungs from individual mice 6 wk after M. tuberculosis Erdman challenge (n = 8). The number of bacteria was logarithmic transformed and subtracted from the bacteria numbers in a nonvaccinated control group. Blue curve: protective efficacy studies in guinea pigs (performed at Colorado State University). Guinea pigs were immunized with different doses of H64 in CAF01 and euthanized when predefined humane end points were met after M. tuberculosis infection. Kaplan–Meier survival curves (Supplemental Fig. 1A) were used to estimate the mean survival time for guinea pigs in each of the vaccination groups (n = 10). SDs are shown for each data point. (D) CB6F1 mice immunized with H64, H56, or M. bovis BCG or injected with saline were infected for 6 wk with one of four clinical isolates of M. tuberculosis: H37Rv, Vietnam, Nepal, and Kazakhstan (n = 6–8 per group). MIRU typing in Supplemental Fig. 1B. CFU Log10/lung ± SEM. One-way ANOVA was used for statistical comparison with the saline group for each strain; degree of freedom = 24. (E) H64 or M. bovis BCG immunized or saline-injected C57BL/6 mice were infected 6 wk after immunization with the hypervirulent M. tuberculosis strain Beijing HN878 (performed at Yonsei College of Medicine). After 4- and 12-wk infection, the bacterial burden was measured in the lung (n = 5–8). Mean values and SEMs are illustrated. One-way ANOVA was used for statistical comparison between groups for each time point; degree of freedom = 18. *p < 0.05, **p < 0.01, ***p < 0.001, ****p < 0.0001. In parallel to working with H64, we designed an additional ESX-1 fusion protein in which EspF and PE35 (not immunogenic in H64) were replaced with the Ags EspB and EspA to potentially optimize immunogenicity and/or efficacy (Fig. 2A, Table II). In H74-vaccinated animals, there was a dominant CD4 T cell response to EspB and an increased recognition of EsxA and EspD (Fig. 2B). Similar to H64, H74 induced protective efficacy over a broad range of vaccination doses peaking between 1 and 5 μg (Supplemental Fig. 1C). Because both vaccines were designed to be used in BCG-primed animals, we did a direct head-to-head comparison in this setting. After challenge with M. tuberculosis Erdman, both vaccines induced robust protection on top of BCG at all the measured time points (Fig. 2C). However, at the late time point (20 wk postinfection), lung bacterial numbers were reduced by 1.7 log10 in the BCG control group (p < 0.0001), 1.88 log10 in the BCG-H64–vaccinated group, and 2.22 log10 in the BCG-H74–vaccinated group compared with the saline group. The bacterial burden was thus significantly lower in the H74-vaccinated animals (p < 0.01), and H74 was selected as the ESX-1 vaccine for further studies. FIGURE 2. Improved Ag recognition and protection of H74 compared with H64. (A) Illustration of the subunit vaccine H74. The fusion protein is based on ESX-1–associated Ags. Ags shared with H64 are in light green. The length in amino acids of the individual Ags is given in Table I. (B) Ag recognition of splenocytes isolated from H74-immunized CB6F1 mice (n = 4). The cells were stimulated with single Ags from H74, and EsxH stimulation was included as negative control (Control). CD4 T cells producing either IFN-γ, TNF-α, and/or IL-2 in response to Ag stimulation were taken as Ag specific. Means and SDs are shown for each Ag. (C) Six months after being M. bovis BCG–vaccinated, CB6F1 mice were divided into three groups and vaccinated with either H64 or H74 or saline injected. An age-matched control group was included that did not receive any of the vaccines. All animals were aerosol infected with M. tuberculosis Erdman, and the number of mycobacteria was measured in individual lungs from immunized and nonimmunized mice 6, 12, and 20 wk postinfection (n = 8 per time point). Vertical lines illustrate SEMs. One-way ANOVA was used for statistical comparison between groups at the late time point; degree of freedom = 28. **p < 0.01, ****p < 0.0001. View inlineView popup Table II. M. tuberculosis Ags in the H74 fusion protein In summary, we designed two novel vaccines based exclusively on ESX-1–associated Ags H64 and H74 which demonstrated robust protection in both mice and guinea pigs. H74 was selected for further studies in BCG-primed animals. In BCG-vaccinated mice, ESX-1–associated Ags induce less differentiated CD4 T cells and improve protection compared with BCG boosting It has been demonstrated that BCG vaccination induces highly differentiated T cells (34), but it has not been systematically investigated how this influences T cell quality and protection of subsequent subunit vaccine boosters. We approached this issue by first comparing the protective efficacy of the ESX-1–based H74 vaccine and a BCG booster vaccine (H65), described in a previous study (21). H65 consists of six EsxA family proteins related to ESX-2, -3, or -5 that are all present in BCG (Fig. 3A). Naive mice were immunized with either H65 or H74 as standalone vaccines. Six weeks after M. tuberculosis aerosol challenge, both vaccines reduced the bacterial load by more than 1.0 log10 relative to nonvaccinated animals (p < 0.0001) with no statistical difference between them (Fig. 3B). Having confirmed that the two vaccines induced similar levels of protection in naive mice, we continued by comparing their efficacy in mice that were BCG primed 6 mo prior to subunit vaccination. Twelve weeks after M. tuberculosis Erdman challenge, BCG vaccination reduced the lung bacterial number by 0.85 log10 (p < 0.05). In two separate experiments, H65 boosting did not add significantly to this protection (Fig. 3C, top, Supplemental Fig. 2A), whereas vaccination with the H74 vaccine enhanced the BCG-induced protection (p < 0.05), resulting in a 1.78 log10 reduction of the number of bacteria relative to the nonvaccinated group (p < 0.0001). This observation was robust as similar results were found in a second study with the clinical strain M. tuberculosis Kazakhstan (Fig. 3C, bottom), showing consistently that although the protection was equal in naive mice, the ESX-1 vaccine (M. tuberculosis–specific) induced better protection than the BCG boosting vaccine in BCG-primed animals. FIGURE 3. H74 vaccination (ESX-1–associated Ags) improve protection in BCG-primed animals and induce less differentiated CD4 T cells compared with BCG boosting (H65). (A) Illustration of the BCG booster vaccine H65. All six Ags are shared with M. bovis BCG (21). (B) Groups of naive CB6F1 mice were vaccinated with H74 or H65, and control groups received either a BCG vaccination or saline injections (n = 8). The bacterial numbers were enumerated in lungs 6 wk after an aerosol M. tuberculosis Erdman infection. Means and SEMs are shown by bars and lines. One-way ANOVA was used for statistical analysis; degree of freedom = 27. (C) CB6F1 mice were BCG vaccinated followed by a resting period of 6 mo before being vaccinated with either H74 or H65 (n = 7–8). The bacterial numbers were measured in individual animals 12 wk after they were infected with M. tuberculosis strain Erdman (top) or 25 wk after M. tuberculosis Kazakhstan infection (bottom). One-way ANOVA was used for statistical analysis; degree of freedom = 25 and 26. (D) Timeline for measuring T cell responses in vaccinated CB6F1 mice pre– and post–M. tuberculosis Erdman challenge in the BCG prime–boost model. (E) Splenocytes isolated from CB6F1 mice vaccinated with BCG alone or boosted with H65 were stimulated with the H65 fusion protein. In parallel, splenocytes from BCG-vaccinated animals complemented with H74 were stimulated with the H74 fusion protein. Single-cell expression of cytokine IFN-γ, TNF-α, and IL-2 was measured by flow cytometry, and the frequencies of activated (CD44high) CD4 T cells expressing any of the possible combinations of cytokines are shown in a bar plot for each vaccination group with mean and SD indicated (n = 3). Means (gray bars) and SDs (vertical lines) are shown. The pies are a simplified view of the data illustrating cytokine coexpression patterns of the specific CD4 T cells. The five identified subgroups of cytokine-producing CD4 T cells were as follows: light blue, TNF-α+; dark blue, TNF-α+ and IL-2+; green, TNF-α+, IL-2+, and IFN-γ+; orange, IFN-γ+ and TNF-α+; and red, IFN-γ+. The dotted arches illustrate the fraction of specific CD4 T cells that produced IFN-γ (red) or did not produce cytokine IFN-γ (blue) in response to ex vivo Ag stimulation. The FDS was calculated as the ratio of IFN-γ producers/IFN-γ nonproducers as previously described (6). (F) Cytokine expression profiles were measured in spleens before and in lungs after M. tuberculosis Erdman infection, and the associated FDS score was calculated for each time point and vaccination group (n = 3–4 per time point). Filled circles and vertical bars represents means and SDs. **p < 0.01, ***p < 0.001, ****p < 0.0001. Next, we compared the phenotype of the subunit-specific CD4 T cell response among the vaccinated groups before and after M. tuberculosis challenge (Fig. 3D). We used the individual CD4 T cell cytokine expression profile as a specific and sensitive measure to assess the degree of differentiation (35). For each group, we calculated a simple functional differentiation score (FDS) based on the ratio of IFN-γ producers and nonproducers as has previously been suggested (6). In BCG-vaccinated animals, we found the highest degree of T cell differentiation (FDS = 4.0) with the majority of responding CD4 T cells expressing IFN-γ either alone or in combination with TNF-α and/or IL-2 (Fig. 3E, top). In the H65-boosted group, there was almost a 3-fold increase in the percentage of H65-specific CD4 T cells compared with BCG alone, but H65 boosting induced only minor changes in the cytokine expression profile of the CD4 T cells (FDS = 2.8, Fig. 3E, middle). In contrast, H74 vaccination induced CD4 T cells with a lower degree of differentiation with almost half of the responding T cells expressing TNF-α alone or TNF-α and IL-2 in combination (FDS = 1.0, Fig. 3E, bottom). After M. tuberculosis Erdman infection, the CD4 T cells recruited to the lung maintained an FDS score of ∼ 4.0 in BCG-vaccinated mice during the initial phase of the infection. However, this increased to 10.7 after 6 wk and to 26.1 after 12 wk of infection, clearly showing a further differentiation of the T cell pool during TB infection (Fig. 3F, top). In the H65-boosted group, there was a delay in the differentiation of the CD4 T cells, but at the late time point, the FDS score had increased to 12.8 (Fig. 3F, middle). In contrast, the FDS score for the vaccine-specific CD4 T cells remained around ∼1.0 for all time points in the H74-vaccinated group (Fig. 3F, bottom). Thus, the pool of H74-specific CD4 T cells effectively resisted infection-driven differentiation throughout a 12-wk infection period. We further investigated this in a follow-up study, in which BCG-primed animals were immunized simultaneously with H74 and H65 so that each animal served as its own internal control. In these animals, the H65-specific CD4 T cells had a mean FDS of 3.0 compared with 0.84 for the H74-specific CD4 T cells, confirming that BCG boosting leads to higher T cell differentiation than vaccination with M. tuberculosis–specific Ags (Supplemental Fig. 2B). Finally, ESAT-6 has been shown to be essential for postexposure protection (16), and of relevance to the vaccination of M. tuberculosis–exposed individuals, H74 vaccination induced less differentiated T cells and lower bacterial burdens in the modified Cornell model of latent TB infection, supporting ESX-1–based vaccines for this application (27, 36) (Supplemental Fig. 2C). In summary, in BCG-primed mice, H65 vaccination did neither lead to substantial improvements in T cell differentiation nor did it add significantly to the protection induced by BCG. Conversely, vaccination with ESX-1–associated Ags (H74) induced CD4 T cells with a low differentiation score, which remained low during M. tuberculosis infection. This correlated with a significantly increased protective efficacy. In BCG-vaccinated mice, ESX-1–associated Ags induce CD4 T cells with superior lung-homing capacity Recent studies directly link T cell differentiation status to the ability to enter the infected lung parenchyma and restrict mycobacterial growth (7, 9, 15, 37). In H56/CAF01-vaccinated mice, we have previously shown that lung parenchymal CD4 T cells (protected from anti-CD45 i.v. stain) are less differentiated and express increased levels of the parenchymal homing marker, CXCR3 (15). For this study, to directly link FDS with lung parenchymal trafficking, we first confirmed that there was a strong correlation between FDS and i.v. CD45 labeling in vaccinated animals (Supplemental Fig. 3). Because our data this far showed that pre-existing BCG immunity had a major influence on the differentiation status of subunit-specific CD4 T cells, we next investigated the impact of BCG boosting on lung-homing capacity. For this, we performed an adoptive transfer experiment using donor cells from H74- and H65-vaccinated mice with or without BCG priming. Before cell transfer, we confirmed that all four groups had a solid vaccine-specific CD4 T cell response and used the cytokine expression profiles to determine the degree of CD4 T cell differentiation (Fig. 4A, 4B). Importantly, the T cell differentiation was similar after H74 and H65 vaccination when administered as standalone vaccines, confirming there was no inherent difference in the priming capability of these vaccines. However, in BCG-primed mice, H65 boosting led to a higher T cell differentiation than H74 vaccination, as previously observed (Fig. 4B). FIGURE 4. H74 (ESX-1–associated Ags) induces CD4 T cells with superior lung-homing capacity in BCG-vaccinated mice. (A) Eight weeks after being BCG vaccinated, CB6F1 mice were vaccinated with H65 or H74. Three weeks later, splenocytes were stimulated with H65 or H74 fusion protein, and the expression of cytokines IFN-γ, IL-2, and TNF-α was measured by flow cytometry. CD4 T cells that produced at least one of the cytokines in response to Ag stimulation was regarded as “Ag specific” (n = 4 per group). The mean (gray bar) and SD is shown for each group. (B) The FDS score was calculated as the ratio of IFN-γ+/IFN-γ− cells based on the cytokine expression profile for the individual animal and plotted for each of the four vaccination groups. Horizontal lines represent means, vertical lines, and SDs. One-way ANOVA was used for statistical comparison; degree of freedom = 12. (C) The influence of BCG priming on the lung-homing capacity of H65- and H74-induced CD4 T cells. CD4 T cells were purified from spleens and lymph nodes and pooled within the vaccination groups before labeling with tracker dyes to distinguish cells from donor animals with and without BCG priming. After labeling, cells were mixed 1:1 (e.g., naive plus H65:BCG plus H65) and adoptively transferred to M. tuberculosis Erdman–infected mice. The next day, intravascular localized cells in the recipient mice were labeled using FITC CD45.2, and purified lung cells were stimulated with fusion proteins to identify cytokine expressing (“Ag-specific”) CD4 T cells. For the entire gating strategy, see Supplemental Fig. 4. (D) For each of the four vaccination groups, the percentage of vaccine-specific donor cells entering into the lung parenchyma was calculated, and the influence of BCG priming on vaccine-specific homing was compared for the two subunit vaccines. The lines connect measurements from the same recipient mouse (n = 4). The statistical comparison was done by two-tailed t tests. *p < 0.05. To compare the ability of the vaccine-specific CD4 T cells to enter infected lung parenchyma, we transferred mixed populations of CD4 T cells into M. tuberculosis–infected recipients. Donor CD4 T cells from the four vaccination groups were isolated by negative selection from spleens and inguinal lymph nodes and stained either with Cell Proliferation Dye eFluor 450 or Cell Proliferation Dye eFluor 670 to distinguish cells from BCG-primed animals and cells from animals receiving the subunit vaccine as a standalone. Stained cells were mixed in a ∼1:1 ratio (subunit:BCG prime plus subunit) and cotransferred into M. tuberculosis Erdman–infected recipients in a total 5 × 10⁶ donor CD4 T cells per recipient. Eighteen hours after transfer, recipient mice were injected with FITC-labeled anti-CD45.2 for intravascular labeling, and lung cells were harvested for flow cytometric analysis based on CDP450/670 as well as cytokine staining following H65/H74 stimulation (Fig. 4C, Supplemental Fig. 4). In mice receiving H65-specific cells, only 39.6–72.0% (mean 64%) of the cells from the BCG-H65–boosted donor mice were located in the lung parenchyma, whereas the range was 79.3–99.4% (mean 90%) for donor cells from H65-only vaccinated mice (Fig. 4D). In contrast, we found no significant differences in the percentage of H74-specific CD4 T cells in the parenchyma regardless of whether the cells came from H74 only or BCG-H74–vaccinated animals (range 78.0–99.4 and 72.0–99.4%, respectively, with means of 85.0 and 84.2%). These results clearly demonstrate that pre-existing BCG immunity significantly impacts the functionality of the T cells induced by subunit booster vaccines and that this mechanism can be efficiently bypassed by designing vaccines that selectively incorporate BCG-complementing TB Ags. Discussion The capacity of CD4 T cells to protect against M. tuberculosis is governed by their differentiation state and ability to localize to the site of infection (37). M. bovis BCG vaccination primes a polyfunctional CD4 T cell response that differentiates over time and gradually loses the ability to produce IL-2, proliferate, and to localize to the site of infection, which results in a loss of long-term protective efficacy (11–13). Heterologous prime–boost strategies, in which BCG vaccination is followed by a subunit vaccine boost, are aiming at improving the BCG-induced adaptive immunity in terms of magnitude, durability, and quality of the CD4 T cell response (38). In this study, we tested whether pre-existing BCG immunity impacts the vaccine response of either a “traditional” BCG booster vaccine (H65) or a complementary vaccine based on ESX-1–associated Ags that are specific for M. tuberculosis (H74 and H64, referred to collectively as “ESX-1 vaccines”). In the initial characterization of the ESX-1 vaccines, we demonstrated significant long-term protection in M. tuberculosis H37Rv–challenged guinea pigs as well as M. tuberculosis Erdman–challenged mice. To extend the study beyond the conventional laboratory M. tuberculosis strains, we challenged vaccinated mice with four different strains of M. tuberculosis belonging to three phylogenetically different lineages. The ESX-1 vaccine induced significant protection against all four strains, suggesting that the vaccine will be effective against a broad range of clinical isolates. Two of the selected isolates were part of the W-Beijing family of M. tuberculosis strains, one of them being the hypervirulent M. tuberculosis Beijing HN878. The Beijing strains are particularly relevant to include in this screening as they are highly prevalent, overrepresented among drug-resistant isolates (39), and significantly associated with HIV coinfection in human cases of TB meningitis (40). In a conventional protection readout at 4 wk postinfection, both the ESX-1 vaccine and BCG were highly protective against M. tuberculosis Beijing HN878. This was also true at the later time point for the ESX-1 vaccine, but in line with earlier studies (27, 41), BCG’s protective efficacy waned at the later stage of infection. In the prime–boost model, our data indicates that BCG vaccination has a major influence on the immune responses induced by subsequent subunit vaccines, depending on whether the Ags are shared with BCG or not. Specifically, we observed that boosting BCG with H65 only marginally changed the specific CD4 T cell differentiation status with little or no improvement of the protection. In contrast, BCG priming had minimal influence on the differentiation and functionality of CD4 T cells induced by the ESX-1 vaccine (not sharing Ags with BCG). The ESX-1 vaccine–specific T cells retained their differentiation status after M. tuberculosis infection, and their ability to enter the infected lung parenchyma was increased compared with the T cells in the H65-boosted group. As a result, the ESX-1 vaccine significantly augmented an already strong BCG-induced protection, and we obtained 1.8–2.9 log10 reduction in the lung bacterial load. Importantly, the BCG-priming vaccine was administered more than 6 mo prior to subunit vaccination, suggesting that it was the BCG “T cell imprint,” rather than ongoing bacterial multiplication, that influenced the response of the subunit booster vaccine. In other words, the BCG-specific CD4 T cells appeared to be “locked” with minimal capacity for reprograming into potentially more favorable phenotypes 6 mo later. This is likely because highly differentiated Th1 cells exhibit limited functional plasticity (42, 43) and that subunit boosting merely expands the existing pool (or a subset) of BCG-imprinted CD4 T cells. In addition, BCG may also induce a specific regulatory T cell response that could influence booster vaccines, although this was not investigated in this study (44, 45). Regardless, de novo priming of CD4 T cells using ESX-1–associated (or other M. tuberculosis–specific) Ags bypass this issue, which could be a useful strategy to increase durable protection in BCG-vaccinated populations. A limitation of this study was a lack of specific homing-related makers in the analysis, and in future studies, it will be important to establish whether vaccine-induced reduction of T cell differentiation leads to increased expression of such markers and/or increased contact between Ag-specific CD4 T cells and M. tuberculosis–infected macrophages in the lung. The mouse model has been extensively used to evaluate new prime–boost strategies using M. bovis BCG and subunit vaccines. The results have varied from no additional protection to almost 2 log10 protection compared with the BCG control group (46–48). It is difficult to do a comparative evaluation of these results as the studies differ with regard to vaccine design, mouse strain, M. tuberculosis challenge strain, BCG strain, and dose as well as the interval between prime–boost, boost–challenge, and challenge–sacrifice. However, by evaluating eight different available studies with BCG booster vaccines, we observed that the added protection of BCG boosting only was significant when the BCG-induced protection in itself was low (<0.5 log10) (47, 49–55). In light of our results, one explanation for this could be that a poor BCG vaccine take (or a waning response) will open up for better priming of less differentiated T cell response by the subunit vaccine. In humans, BCG will in most cases be administered to infants, and future booster vaccines are intended to be administered 10–15 y later and preferably before the protective efficacy of BCG wanes. It is not clear how pre-existing BCG immunity will influence subunit vaccination in this setting, and exposure to M. tuberculosis is also likely to play a dominant role in high-endemic areas. In this regard, results demonstrating that subunit vaccines can build on pre-existing M. tuberculosis immunity have been obtained in the recent phase IIb trial, in which M72/AS01e induced 49.7% vaccine efficacy against pulmonary disease in quantiferon positive individuals after 3 y of follow-up (56). Encouragingly, in this study, we also demonstrate that H74 vaccination significantly reduced bacterial burden in the modified Cornell model of postexposure vaccination. Similarly, regarding BCG-vaccinated quantiferon negative individuals, a recent study showed that it is possible to boost BCG protection with a subunit vaccine in adolescents and adults to some extent (57). In this study, H4:IC31 boosting led to 30.1% vaccine efficacy against sustained quantiferon conversion, and based on our data, we speculate that subunit vaccines with ESX-1–associated Ags have the potential to further improve on this result. Additionally, in the study by Nemes et al., BCG revaccination showed a vaccine efficacy of 40.5%, which has sparked renewed interest in using BCG revaccination as a readily applicable intervention (58). In such settings, the influence of recent “BCG imprinting” is likely to be significantly higher if BCG revaccination is to be combined with future subunit vaccines. In conclusion, mycobacterial priming by BCG vaccination induces highly differentiated CD4 T cells that, for at least 6 mo in the mouse model, restrict subsequent booster vaccines in priming additional protective T cells with sufficient memory and lung-homing potential. This phenomenon can efficiently be bypassed by designing vaccines with M. tuberculosis–specific Ags, like the ESX-1–associated Ags studied in this report. We suggest that future studies explore these findings in the human setting, in which it could also be investigated whether exposure to non-tuberculousis mycobacteria play a role in maintaining BCG immunity/T cell “imprint.” Disclosures C.A., N.P.H.K., I.S., E.H.K., T.L., E.M.A., M.R., I.R., P.A., and R.M. are employed by Statens Serum Institut, a nonprofit government research facility of which H56, H64, and H74 and the CAF01 adjuvant are proprietary products. C.A., P.A., and R.M. are coinventors of patents covering ESX-1–based vaccines. Acknowledgments We thank Joshua Woodworth for input on data interpretation and gratefully acknowledge Vivi Andersen and Camilla Rasmussen at Statens Serum Institut for excellent technical assistance. Footnotes This work was supported by The Danish Research Council (DFF - 7016-00310), the National Institutes of Health/National Institute of Allergy and Infectious Diseases (Grant 1R01AI135721-01), the European Union’s Horizon 2020 Framework Programme for Research and Innovation under Grant Agreement 643381 as part of the TBVAC2020 Consortium, and the National Institutes of Health/National Institute of Allergy and Infectious Diseases program Advanced Small Animal Models for the Testing of Candidate Therapeutic and Preventative Interventions against Mycobacteria (HHSN272201000009I-003, Task Order 12) at Colorado State University. The online version of this article contains supplemental material. Abbreviations used in this article: BCG Bacillus Calmette–Guérin FDS functional differentiation score MIRU mycobacterial interspersed repetitive unit TB tuberculosis. Received May 18, 2020. Accepted August 5, 2020. Copyright © 2020 by The American Association of Immunologists, Inc. This article is distributed under The American Association of Immunologists, Inc., Reuse Terms and Conditions for Author Choice articles. References ↵WHO. 2018. Global Tuberculosis Report 2018. World Health Organization, Geneva, Switzerland. ↵Trunz, B. B., P. Fine, C. Dye. 2006. Effect of BCG vaccination on childhood tuberculous meningitis and miliary tuberculosis worldwide: a meta-analysis and assessment of cost-effectiveness. Lancet 367: 1173–1180.OpenUrlCrossRefPubMed ↵Mangtani, P., I. Abubakar, C. Ariti, R. Beynon, L. Pimpin, P. E. M. Fine, L. C. Rodrigues, P. G. Smith, M. Lipman, P. F. Whiting, J. A. Sterne. 2014. Protection by BCG vaccine against tuberculosis: a systematic review of randomized controlled trials. Clin. Infect. Dis. 58: 470–480.OpenUrlCrossRefPubMed ↵Leveton, C., S. Barnass, B. Champion, S. Lucas, B. De Souza, M. Nicol, D. Banerjee, G. Rook. 1989. T-cell-mediated protection of mice against virulent Mycobacterium tuberculosis. Infect. Immun. 57: 390–395. ↵Green, A. M., R. Difazio, J. L. Flynn. 2013. IFN-γ from CD4 T cells is essential for host survival and enhances CD8 T cell function during Mycobacterium tuberculosis infection. J. Immunol. 190: 270–277. ↵Moguche, A. O., M. Musvosvi, A. Penn-Nicholson, C. R. Plumlee, H. Mearns, H. Geldenhuys, E. Smit, D. Abrahams, V. Rozot, O. Dintwe, et al. 2017. Antigen availability shapes T cell differentiation and function during tuberculosis. Cell Host Microbe 21: 695–706.e5.OpenUrlCrossRefPubMed ↵Sallin, M. A., S. Sakai, K. D. Kauffman, H. A. Young, J. Zhu, D. L. Barber. 2017. Th1 differentiation drives the accumulation of intravascular, non-protective CD4 T cells during tuberculosis. Cell Rep. 18: 3091–3104.OpenUrlCrossRef ↵He, H., P. N. Nehete, B. Nehete, E. Wieder, G. Yang, S. Buchl, K. J. Sastry. 2011. Functional impairment of central memory CD4 T cells is a potential early prognostic marker for changing viral load in SHIV-infected rhesus macaques. PLoS One 6: e19607. ↵Sakai, S., K. D. Kauffman, J. M. Schenkel, C. C. McBerry, K. D. Mayer-Barber, D. Masopust, D. L. Barber. 2014. Cutting edge: control of Mycobacterium tuberculosis infection by a subset of lung parenchyma-homing CD4 T cells. J. Immunol. 192: 2965–2969. ↵Srivastava, S., J. D. Ernst. 2013. Cutting edge: direct recognition of infected cells by CD4 T cells is required for control of intracellular Mycobacterium tuberculosis in vivo. J. Immunol. 191: 1016–1020. ↵Lindenstrøm, T., A. Moguche, M. Damborg, E. M. Agger, K. Urdahl, P. Andersen. 2018. T cells primed by live mycobacteria versus a tuberculosis subunit vaccine exhibit distinct functional properties. EBioMedicine 27: 27–39.OpenUrl Perdomo, C., U. Zedler, A. A. Kühl, L. Lozza, P. Saikali, L. E. Sander, A. Vogelzang, S. H. E. Kaufmann, A. Kupz. 2016. Mucosal BCG vaccination induces protective lung-resident memory T cell populations against tuberculosis. mBio 7: e01686-16. ↵Orme, I. M. 2010. The Achilles heel of BCG. Tuberculosis (Edinb.) 90: 329–332.OpenUrlCrossRef ↵Rodo, M. J., V. Rozot, E. Nemes, O. Dintwe, M. Hatherill, F. Little, T. J. Scriba. 2019. A comparison of antigen-specific T cell responses induced by six novel tuberculosis vaccine candidates. PLoS Pathog. 15: e1007643. ↵Woodworth, J. S., S. B. Cohen, A. O. Moguche, C. R. Plumlee, E. M. Agger, K. B. Urdahl, P. Andersen. 2017. Subunit vaccine H56/CAF01 induces a population of circulating CD4 T cells that traffic into the Mycobacterium tuberculosis-infected lung. Mucosal Immunol. 10: 555–564.OpenUrlCrossRefPubMed ↵Hoang, T., C. Aagaard, J. Dietrich, J. P. Cassidy, G. Dolganov, G. K. Schoolnik, C. V. Lundberg, E. M. Agger, P. Andersen. 2013. ESAT-6 (EsxA) and TB10.4 (EsxH) based vaccines for pre- and post-exposure tuberculosis vaccination. PLoS One 8: e80579. Billeskov, R., T. Lindenstrøm, J. Woodworth, C. Vilaplana, P. J. Cardona, J. P. Cassidy, R. Mortensen, E. M. Agger, P. Andersen. 2018. High antigen dose is detrimental to post-exposure vaccine protection against tuberculosis. Front. Immunol. 8: 1973.OpenUrl Henao-Tamayo, M., G. S. Palaniswamy, E. E. Smith, C. A. Shanley, B. Wang, I. M. Orme, R. J. Basaraba, N. M. DuTeau, D. Ordway. 2009. Post-exposure vaccination against Mycobacterium tuberculosis. Tuberculosis (Edinb.) 89: 142–148.OpenUrl Turner, J., E. R. Rhoades, M. Keen, J. T. Belisle, A. A. Frank, I. M. Orme. 2000. Effective preexposure tuberculosis vaccines fail to protect when they are given in an immunotherapeutic mode. Infect. Immun. 68: 1706–1709. ↵Taylor, J. L., O. C. Turner, R. J. Basaraba, J. T. Belisle, K. Huygen, I. M. Orme. 2003. Pulmonary necrosis resulting from DNA vaccination against tuberculosis. Infect. Immun. 71: 2192–2198. ↵Knudsen, N. P., S. Nørskov-Lauritsen, G. M. Dolganov, G. K. Schoolnik, T. Lindenstrøm, P. Andersen, E. M. Agger, C. Aagaard. 2014. Tuberculosis vaccine with high predicted population coverage and compatibility with modern diagnostics. Proc. Natl. Acad. Sci. USA 111: 1096–1101. ↵Aguilo, N., J. Gonzalo-Asensio, S. Alvarez-Arguedas, D. Marinova, A. B. Gomez, S. Uranga, R. Spallek, M. Singh, R. Audran, F. Spertini, C. Martin. 2017. Reactogenicity to major tuberculosis antigens absent in BCG is linked to improved protection against Mycobacterium tuberculosis. Nat. Commun. 8: 16085.OpenUrlCrossRef ↵Pym, A. S., P. Brodin, L. Majlessi, R. Brosch, C. Demangel, A. Williams, K. E. Griffiths, G. Marchal, C. Leclerc, S. T. Cole. 2003. Recombinant BCG exporting ESAT-6 confers enhanced protection against tuberculosis. Nat. Med. 9: 533–539.OpenUrlCrossRefPubMed Gröschel, M. I., F. Sayes, S. J. Shin, W. Frigui, A. Pawlik, M. Orgeur, R. Canetti, N. Honoré, R. Simeone, T. S. van der Werf, et al. 2017. Recombinant BCG expressing ESX-1 of Mycobacterium marinum combines low virulence with cytosolic immune signaling and improved TB protection. Cell Rep. 18: 2752–2765.OpenUrlCrossRef ↵Bottai, D., W. Frigui, S. Clark, E. Rayner, A. Zelmer, N. Andreu, M. I. de Jonge, G. J. Bancroft, A. Williams, P. Brodin, R. Brosch. 2015. Increased protective efficacy of recombinant BCG strains expressing virulence-neutral proteins of the ESX-1 secretion system. Vaccine 33: 2710–2718.OpenUrlCrossRefPubMed ↵Aagaard, C. S., T. T. Hoang, C. Vingsbo-Lundberg, J. Dietrich, P. Andersen. 2009. Quality and vaccine efficacy of CD4+ T cell responses directed to dominant and subdominant epitopes in ESAT-6 from Mycobacterium tuberculosis. J. Immunol. 183: 2659–2668. ↵Aagaard, C., T. Hoang, J. Dietrich, P. J. Cardona, A. Izzo, G. Dolganov, G. K. Schoolnik, J. P. Cassidy, R. Billeskov, P. Andersen. 2011. A multistage tuberculosis vaccine that confers efficient protection before and after exposure. Nat. Med. 17: 189–194.OpenUrlCrossRefPubMed ↵Cole, S. T., R. Brosch, J. Parkhill, T. Garnier, C. Churcher, D. Harris, S. V. Gordon, K. Eiglmeier, S. Gas, C. E. Barry III., et al. 1998. Deciphering the biology of Mycobacterium tuberculosis from the complete genome sequence. Nature 393: 537–544.OpenUrlCrossRefPubMed ↵Behr, M. A., M. A. Wilson, W. P. Gill, H. Salamon, G. K. Schoolnik, S. Rane, P. M. Small. 1999. Comparative genomics of BCG vaccines by whole-genome DNA microarray. Science 284: 1520–1523. ↵Millington, K. A., S. M. Fortune, J. Low, A. Garces, S. M. Hingley-Wilson, M. Wickremasinghe, O. M. Kon, A. Lalvani. 2011. Rv3615c is a highly immunodominant RD1 (region of difference 1)-dependent secreted antigen specific for Mycobacterium tuberculosis infection. Proc. Natl. Acad. Sci. USA 108: 5730–5735. ↵van Pinxteren, L. A., P. Ravn, E. M. Agger, J. Pollock, P. Andersen. 2000. Diagnosis of tuberculosis based on the two specific antigens ESAT-6 and CFP10. Clin. Diagn. Lab. Immunol. 7: 155–160.OpenUrlCrossRefPubMed ↵Coscolla, M., S. Gagneux. 2010. Does M. tuberculosis genomic diversity explain disease diversity? Drug Discov. Today Dis. Mech. 7: e43–e59.OpenUrlCrossRefPubMed ↵Manca, C., L. Tsenova, S. Freeman, A. K. Barczak, M. Tovey, P. J. Murray, C. Barry, G. Kaplan. 2005. Hypervirulent M. tuberculosis W/Beijing strains upregulate type I IFNs and increase expression of negative regulators of the Jak-Stat pathway. J. Interferon Cytokine Res. 25: 694–701.OpenUrlCrossRefPubMed ↵Nandakumar, S., S. Kannanganat, J. E. Posey, R. R. Amara, S. B. Sable. 2014. Attrition of T-cell functions and simultaneous upregulation of inhibitory markers correspond with the waning of BCG-induced protection against tuberculosis in mice. PLoS One 9: e113951. ↵Seder, R. A., P. A. Darrah, M. Roederer. 2008. T-cell quality in memory and protection: implications for vaccine design. [Published erratum appears in 2008 Nat. Rev. Immunol. 8: 486.] Nat. Rev. Immunol. 8: 247–258.OpenUrlCrossRefPubMed ↵McCune, R. M. Jr.., W. McDermott, R. Tompsett. 1956. The fate of Mycobacterium tuberculosis in mouse tissues as determined by the microbial enumeration technique. II. The conversion of tuberculous infection to the latent state by the administration of pyrazinamide and a companion drug. J. Exp. Med. 104: 763–802.OpenUrlAbstract ↵Sakai, S., K. D. Mayer-Barber, D. L. Barber. 2014. Defining features of protective CD4 T cell responses to Mycobacterium tuberculosis. Curr. Opin. Immunol. 29: 137–142.OpenUrlCrossRefPubMed ↵Lewinsohn, D. A., D. M. Lewinsohn, T. J. Scriba. 2017. Polyfunctional CD4+ T cells as targets for tuberculosis vaccination. Front. Immunol. 8: 1262.OpenUrlCrossRefPubMed ↵Glynn, J. R., J. Whiteley, P. J. Bifani, K. Kremer, D. van Soolingen. 2002. Worldwide occurrence of Beijing/W strains of Mycobacterium tuberculosis: a systematic review. Emerg. Infect. Dis. 8: 843–849.OpenUrlCrossRefPubMed ↵Caws, M., G. Thwaites, K. Stepniewska, T. N. Nguyen, T. H. Nguyen, T. P. Nguyen, N. T. Mai, M. D. Phan, H. L. Tran, T. H. Tran, et al. 2006. Beijing genotype of Mycobacterium tuberculosis is significantly associated with human immunodeficiency virus infection and multidrug resistance in cases of tube
|
|
Scooped by
Gilbert C FAURE
April 24, 2020 7:42 AM
|
Fungi cover epithelial surfaces of the human body, engaging in many mutualistic interactions with the host and other microbiota such as the more prevalent bacteria. These interactions are shaped by multiple factors, including host physiology and immunity, as well as nutrient competition. The beneficial effects of fungal colonization for hosts include resistance to pathogens and tuning of the immune system. Although health benefits continue to be explored, recent studies have revealed expanded roles of fungi in human disease, including inflammatory disorders and specific cancers. The global burden of fungal infections is also expanding, with increased numbers of at-risk patients and increased resistance to limited antifungal drugs. More fungal research is needed to overcome these unmet needs. Fungi exist as single-celled yeast, multicellular molds, or dimorphic species occurring as both yeast and filamentous cells. Saccharomyces cerevisiae, Cryptococcus neoformans, and Candida and Malassezia spp. are frequently studied yeast, whereas Penicillium, Mucor, and Aspergillus are well-known molds. As with many microbiota, fungi are classically recognized for their roles as human-associated pathogens. Candidal bloodstream infections are the most common form of fungal invasive disease, affecting about 1 in 10,000 people in the United States. Globally, cryptococcal meningitis contributes to a substantial burden of disease, particularly in HIV-positive individuals. The paucity of available antifungal treatments contributes to the morbidity and mortality of fungal infections. Classes of antifungals include azoles (e.g., fluconazole), echinocandins, and amphotericin B. However, fluconazole is the only antifungal drug available in many parts of the world. Additionally, some fungal diseases can be difficult to diagnose because of nonspecific patient symptoms, invasive tissue sampling, specific culture conditions, and identification requiring sophisticated techniques. Recent studies have begun to explore how fungi are multifaceted in their potential to lead to beneficial as well as pathogenic outcomes for the host. Commensalism in the context of human fungi is exemplified by colonization resistance against pathogens. An example of a beneficial effect is the dominant human skin–associated Malassezia, which have adapted to their niche by making use of skin lipids as a nutrient, and then secreting antimicrobial products that deter bacterial pathogens (1). Another example of the importance of colonization resistance is Candida albicans commensalism in the gastrointestinal tract. In an evolutionary experiment, C. albicans strains acquired genetic mutations that enabled them to more stably colonize the mouse gastrointestinal tract. These evolved C. albicans strains provided protection against subsequent experimental challenges with different virulent fungi (C. albicans, Aspergillus fumigatus) and bacteria (Staphylococcus aureus, Pseudomonas aeruginosa) (2). However, these C. albicans strains evolved only in antibiotic-treated mice and were unable to stably colonize mice with endogenous gut bacteria, highlighting the genetic trade-offs of adaptation to the host and competition within mixed microbial communities. Complementary studies demonstrated that mutations in transcription factors that regulate morphology are key determinants of the gut commensal fitness of C. albicans (3). In addition to these direct host-microbial interactions, mouse gut colonization with C. albicans tuned host immunity, resulting in a systemic increase in fungal-specific T helper 17 (TH17) CD4+ T cells and interleukin-17 (IL-17)–responsive circulating neutrophils, which protected against more invasive bacterial and fungal, but not viral, infections (4). Ex vivo experiments showed that C. albicans elicited robust IL-17A and IL-22 responses from peripheral C. albicans– and A. fumigatus–specific TH17 CD4+ T cells from healthy human donors, demonstrating that C. albicans can modulate human immunity as well (5). Given the complexity of host-microbial interactions, any alteration in the host or microbiota can result in infections, ranging from chronic chromoblastomycosis of the skin, dermatophyte nail infections, and acute vaginal yeast infections to potentially fatal mucormycosis in diabetics, candidal sepsis, and disseminated aspergillosis. Deficiencies in human immunity provide insight into the host-microbiota interplay. For example, patients with advanced HIV infections suffer from specific opportunistic fungal infections such as cryptococcal meningitis, mucosal candidiasis, and Pneumocystis jirovecii pneumonia. In patients receiving a hematopoietic stem cell transplant, candidal bloodstream infections were preceded by blooms of intestinal Candida spp. with altered bacterial communities, which could be used as biomarkers to identify and alter medical management (6). Additionally, the specificity of host-fungal immune interactions is reflected in patients with genetically defined primary immunodeficiency syndromes such as chronic granulomatous disease, autoimmune polyendocrinopathy–candidiasis–ectodermal dystrophy (APECED), or caspase recruitment domain–containing protein 9 (CARD9) deficiency, each of which renders patients susceptible to a specific fungal infection. Other examples of host-specific fungal susceptibilities include mice deficient in the chemokine (C-X-C motif ) receptor 1 (Cxcr1) gene, which have defective neutrophil killing of Candida, decreased survival, and higher fungal burden. This phenotype is similar to that of disseminated candidiasis patients and healthy donors with the CXCR1-T276 allele who also demonstrate impaired neutrophil killing of Candida (7). Recurrent vulvovaginal candidiasis, a localized fungal infection, is estimated to affect more than 100 million women worldwide annually and has been linked with a functional variant in the SIGLEC15 (sialic acid–binding immunoglobulin-like lectin 15) gene (8). Expressed on immune cells, SIGLEC15 can bind C. albicans and induces IL-17A and interferon-γ (IFN-γ) production, suggesting a role in anti–C. albicans immune responses. Host susceptibility contributes to the development of more persistent or severe fungal infections—for example, from dermatophytes or penetrating wounds. Studies of other single-nucleotide polymorphism (SNP) variants in immune-related genes that correlate with increased susceptibility to mucosal or life-threatening fungal infections hold promise for the future development of precision medicine approaches for risk stratification and preventive treatment of patients at the highest risk for fungal disease. Inflammatory and autoimmune diseases are increasingly linked to alterations in fungal communities, particularly in genetically defined hosts. SNPs in CARD9 and CLEC7A (C-type lectin domain–containing 7A), which encodes Dectin-1, have been associated with inflammatory bowel diseases in humans. Dectin-1 is a C-type lectin receptor (CLR) that recognizes β-glucan in fungal cell walls and, through CARD9, signals to induce inflammatory mediators and TH1 and TH17 cell differentiation. Mice deficient in Dectin-1 had more severe experimentally induced colitis with increased C. tropicalis burden, and a SNP in human CLEC7A is associated with more severe ulcerative colitis (9). Similarly, Crohn's disease patients have higher relative abundances of intestinal Malassezia compared with healthy controls, and oral gavage of Malassezia demonstrated worsening of experimental colitis in mice, again through activation of CARD9 signaling and downstream TH1 and TH17 cell polarization (10). Genetic ablation of CX3CR1+ mononuclear phagocytes, which express antifungal CLRs, also exacerbated experimental colitis in mice. Furthermore, a missense mutation in CX3CR1 in Crohn's disease patients has been associated with reduced immunoglobulin G (IgG) responses to fungi (11). These and other studies suggest that inflammatory diseases may result from host-fungal imbalances. Although bacteria and viruses have been implicated in cancer, fungi typically have not been. Histologic observations revealed higher amounts of intratumoral fungi, particularly of Malassezia, infiltrating human pancreatic ductal adenocarcinomas (PDAs). Further investigation of mouse models of PDA demonstrated fungal translocation from the intestinal tract into the pancreas, increased burden of Malassezia accelerated PDA progression, and antifungal treatment slowed pancreatic cancer growth (12). The complement cascade integrates immune recognition and fungal killing with tumor development by stimulating proinflammatory pathways. Human tissue expression of mannose-binding lectin (MBL), which activates the complement cascade, was associated with worse survival in PDA patients. Similarly, PDA progression in mice depended on Malassezia stimulation of MBL, linking fungi, inflammation, and tumorigenesis. This study has prompted researchers to reconsider the potential relationships between fungi and broader human diseases. Candida auris epitomizes the gravest concerns about an emerging fungal pathogen because it has evolved resistance to all classes of antifungal drugs, particularly azoles. Numerous countries have reported active outbreaks, with increasing cases of C. auris bloodstream infections. The high prevalence of resistance renders these infections difficult to treat, with resultant high mortality. Over the past decade, four distinct strains of C. auris have emerged independently on different continents. The origin of C. auris as a human pathogen has remained a mystery since it was first identified in 2009. The propensity of C. auris to colonize human skin for a long time, which is an atypical feature for non-auris Candida species, is of substantial concern because shedding from patients into the environment facilitates transmissions within health care facilities (13). The emergence of a new human fungal pathogen points to urgent unmet medical needs for new antifungal drugs and environmental disinfectants, genomic datasets that include fungal sequences to map global fungal diversity, and a coordinated global health response. Aspergillus spores are frequently inhaled into lungs but cause disease only in some people. PHOTO: THE NATURAL HISTORY MUSEUM, LONDON/SCIENCE SOURCE Investigations into the role of fungi in human health and disease are challenging. Despite a myriad of bacteria, fungi, and viruses existing together in and on humans, researchers tend to focus on a few microbial species because they are more tractable to study. Diverse culture conditions or inclusion of metabolically distinct forms of dimorphic fungi (3) may reveal different functions and interactions. In vivo systems also have limitations. For example, conventional laboratory mice have a lower fungal burden and different immune profiles than those of wild-type mice (14). Additionally, adaptation to stress—induced by, for example, culture conditions, passaging through mammalian hosts, antifungal pressures, high temperatures, or acidic pH—can lead to alterations in morphology, fungal capsule, and cell wall components. This can result in evasion or triggering of host immunity and radically altered genomes in fungal cells. Genomic plasticity in fungi, including loss of heterozygosity, copy number variation, and aneuploidy, underscores the importance of incorporating metagenomic analyses into studies of fungal community adaptation to different niches (15). Fungal research is an area of considerable potential. This includes understanding how fungi are beneficial to human health and mining the multiple compounds produced by fungi that may benefit clinical medicine (for example, penicillin is derived from the fungal species Penicillium spp.). The emergence of multidrug-resistant C. auris has been postulated to be due in part to rising temperatures and to the widespread use of azoles in agriculture and in the clinic. Because these pressures on host-microbial homeostasis are likely to persist and evolve, the development of new antifungal drugs is critical to counteract outbreaks from existing and future pathogens. Advances in technology, such as targeted CRISPR-Cas9–mediated gene deletion for fungal mutagenesis, can provide precise tools for testing genetic hypotheses and elucidating fungal pathophysiology. Further advances will continue to improve our understanding of how fungi affect human health and disease. http://www.sciencemag.org/about/science-licenses-journal-article-reuse This is an article distributed under the terms of the Science Journals Default License. References and Notes ↵ G. Wu et al., PLOS Genet. 11, e1005614 (2015).OpenUrlCrossRefPubMed ↵ G. H. W. Tso et al., Science 362, 589 (2018). ↵ J. N. Witchley et al., Cell Host Microbe 25, 432 (2019).OpenUrl ↵ T. Y. Shao et al., Cell Host Microbe 25, 404 (2019).OpenUrl ↵ P. Bacher et al., Cell 176, 1340 (2019).OpenUrlCrossRef ↵ B. Zhai et al., Nat. Med. 26, 59 (2020).OpenUrlCrossRefPubMed ↵ M. Swamydas et al., Sci. Transl. Med. 8, 322ra10 (2016). ↵ M. Jaeger et al., Sci. Transl. Med. 11, eaar3558 (2019). ↵ I. D. Iliev et al., Science 336, 1314 (2012). ↵ J. J. Limon et al., Cell Host Microbe 25, 377 (2019).OpenUrlCrossRef ↵ I. Leonardi et al., Science 359, 232 (2018). ↵ B. Aykut et al., Nature 574, 264 (2019).OpenUrlCrossRef ↵ B. R. Jackson et al., J. Fungi 5, 58 (2019).OpenUrlCrossRef ↵ S. P. Rosshart et al., Science 365, eaaw4361 (2019). ↵ A. Forche et al., mBio 2, e00129 (2011).OpenUrlCrossRefPubMed Acknowledgments: The authors are supported by the National Institute of Arthritis and Musculoskeletal and Skin Diseases (H.H.K.) and the National Human Genome Research Institute (J.A.S.).
|
|
Scooped by
Gilbert C FAURE
March 4, 2020 2:31 PM
|
|
|
Scooped by
Gilbert C FAURE
July 11, 2019 8:24 AM
|
Abstract Breast milk is not only a completely adapted nutrition source for the newborn but also an impressive array of immune‐active molecules that afford protection against infections and shape mucosal immune responses. Decisive imprinting events might be modulated during the first months of life with potential health long‐term effects, enhancing the importance of breastfeeding as a major influence on the immune system correct development and modifying disease susceptibility. The aim of this review was to clarify the link between breastfeeding and autoimmune diseases, inquiring the related mechanisms, based on data available in the literature. Being breastfed was associated with a lower incidence of diabetes, celiac disease, multiple sclerosis and asthma, explained by the protection against early infections, anti‐inflammatory properties, antigen‐specific tolerance induction, and regulation of infant's microbiome. The protective role of human milk in idiopathic juvenile arthritis, rheumatoid arthritis, and inflammatory bowel diseases remains controversial. On the other hand, the breastfeeding mother faces a health‐challenging period in life. High levels of prolactin may lead either to the development of autoimmune diseases in susceptible mothers or exacerbations of current immune‐mediated disorders. These features raise the question if mothers with autoimmune diseases, mainly systemic lupus erythematosus, should avoid breastfeeding. 1 INTRODUCTION Breast milk is the result of 200 million years of Darwinian pressure on mammalian lactation as the source of infant's nourishment.1 Bo Vahlquist (1909‐1978), a renowned pediatrician once said “In all mammalian species the reproductive cycle comprises both pregnancy and breast‐feeding: in the absence of latter, none of these species, man included, could have survived”.2 Diet is one of the most important environmental exposures in early life.3 Currently, the World Health Organization recommends that infants should be exclusively breastfed up to 6 months of age and continue with a partial pattern until the infant is at least 2 years old.4 Breastfeeding has multifactorial determinants and needs supportive measures on many levels, which can represent a barrier for women who attempt it5; still, many are unaware of its great importance on growth and development.6 In 1932, Grulee et al7 analyzed 20 000 healthy infants during the first year of life, relating breastfeeding with a lower incidence of morbidity and mortality. Previously, in the nineteenth century, antibodies were the first immunological molecules discovered in breast milk, boosting the possibility that human milk could have an influence on the development of children immune system.8 Indeed, human milk supplies an impressive array of immune‐active molecules, metabolites, oligosaccharides, microbial content, vitamins, and other nutrients that provide protection against infections and modulates mucosal immune responses.4, 9 At this time, more than 80 different autoimmune diseases have been described in which the leading role is characterized by an inappropriate immune reaction.10 The possibility that decisive imprinting events might be modulated during the first months of life, with potential long‐term effects, sparks the importance of breastfeeding in the correct development of the immune system, altering disease susceptibility, mainly in immune‐mediated conditions.11, 12 Breast milk is not only a completely adapted nutrition source but also a personalized medicine for the infants, programming to some degree their future health.13 For breastfeeding mothers, this period may represent a great health challenge. As prolactin plays an important role on immune modulation,10 physiologic hyperprolactinemia related to continuous breast stimulation may be involved either on the onset of autoimmune diseases or on the exacerbation of current ones.14 2 HUMAN MILK AMONG THE STAGES OF LACTATION Milk is a complex fluid, the composition of which gradually changes according to the stage of lactation, infant feeding, health status (mother and newborn), maternal diet, environment, and genetics.15 Colostrum is the first milk produced and is characterized for containing over 250 potentially immunologically active proteins, including enzymes (lactoferrin, lysozyme, etc.), hormones, immunoglobulins, cytokines, signaling molecules, soluble receptors and inflammatory mediators.8, 16 The high content of bioactive proteins evidenced that colostrum's main role is immunological rather than nutritional.17 Antimicrobial factors present in human milk possess resistance to degradation by the newborn's digestive enzymes, protecting the mucosal surfaces and eliminating pathogens without initiating inflammatory reactions, while the immune system matures.18 Furthermore, the abundance and diversity of indigestible oligosaccharides promote the optimal microbiota colonization which will condition future immune homeostasis.19 A few days after delivery, tight junctions of the mammary epithelium start to close, the rate of sodium/potassium declines, and the lactose concentration rises, indicating the secretory activation and production of transitional milk. Two weeks postpartum, the milk is considered fully mature.20 It is characterized by decreasing relative concentrations of the immunologically active molecules, while the volume and nutritional requirements increase to fulfill the growing infant needs.21 3 BREAST MILK AND IMMUNE SYSTEM MODULATION The postnatal period is crucial for the newborn's immune system maturation. This process is characterized by the development of a balance between Th1/Th2 response.22 The thymus is the central immune system organ where bone marrow‐derived precursors undergo differentiation and selection before they are apt for migration to the periphery23; therefore, thymus plays a central role in the establishment of T‐cell‐mediated immunity.23, 24 Hasselbalch et al25 reported that the thymus is considerably larger in breastfed infants when compared to formula‐fed. Subsequently, Jeppese et al26 not only corroborated the previous findings but also discovered a correlation between breastfeeding and CD8+ T cells. The mechanism by which breastfeeding may influence thymus size is unclear, although pathways involving interleukin 7 (IL‐7) are considered to play a critical role in thymopoiesis, and Tgd lymphocytes output from the intestinal mucosa.27, 28 In addition, breast milk is known to modulate infant's intestinal microbiome,29 which is the main source of bacterial metabolites (Figure 1). This has been proved to play a leading role in T‐cell development and differentiation and may be the missing link between the benefits of breastfeeding in the intestinal microbiome and enhanced thymus size in breastfed infants.30, 31 3.1 Immunological components of human milk Human milk supplies an impressive array of immunologically active molecules (Table 1) involved in complex interactions and influencing infant's outcomes.9, 32 This effect is due to the amazing nature of the interaction between mother and baby. Breast milk will not only nourish the newborn, but also provide a complete arsenal of immune components that will contribute as protective factors and as development and maturation factors (Table 1). The protective factors are known to contribute against infections by providing direct immunity (passive), and immune regulatory effects based on anti‐inflammatory capabilities. They ensure the adequate environment in the infant's gastrointestinal tract by preventing microbiome dysbiosis, therefore preserving the immune barrier functions of the epithelium.33, 34 The newborn immune system can be looked at as a very complex machine with amazing capabilities, yet it does not know how to use it. The development and maturation factors will promote, as their name implies, the maturation, differentiation and development of the local immune system, known as the gut‐associated lymphoid tissue (GALT), and the systemic immune system. Furthermore, it will also promote the development of immune tolerance.22, 35 Components Role Function P D/M Proteins Lactoferrin ● Antimicrobial, iron carrier Lactadherin, lysozyme, defensins ● Antimicrobial MicroRNAs ● ● Lymphocyte development, inflammatory mediator Cells Lymphocytes ● ● (T cells > 80%); lymphocyte development, inflammatory mediator Macrophages ● ● Phagocytosis, pathogen defense, T‐cell stimulation Neutrophils ● Unknown, may play a role in maternal protection Breast milk stem cells ● Secretion of growth factors; tissue homeostasis, repair, and/or regeneration Immunoglobulins sIgA/IgA ● ● Antimicrobial, pathogen binding inhibition IgM/IgG ● ● Antimicrobial, antibody‐mediated cytotoxicity Cytokines IL‐1b ● ● Inflammatory mediator, intestinal and immune system trophic factor IL‐2 ● ● Modulate T‐cell development IL‐6 ● ● Intestinal trophic factor, inflammatory mediator, B‐cell activation IL‐8 ● ● Intestinal trophic factor, recruitment of maternal leukocytes IL‐10 ● ● Intestinal trophic factor, anti‐inflammatory cytokine, tolerance promoter IFN‐g ● ● Stimulate Th1 inflammatory response, suppress Th2 allergic response TNF‐a ● ● Proinflammatory Chemokines and other soluble factors CXCR‐1/CXCR‐2 ● ● Cytokine receptor CXCL‐9 (MIP) ● ● Antimicrobial, NK and T‐cell chemoattractant sCD14 ● Inflammatory mediator, promotor of lymphocyte differentiation and activation IP‐10 ● Antimicrobial, NK and T‐cell chemoattractant MCP‐1 ● ● T‐cell chemoattractant TNF‐RI ● Reduce TNF‐a activity, mediate inflammation G‐CSF ● Stimulate neutrophil growth and differentiation, intestinal trophic factor Growth factors TGF‐b, TGF‐a, EGF ● ● Intestinal trophic factor, promote tolerance IGF‐1 and IGF‐2 ● Development and maturation of gastrointestinal cells Oligosaccharides HMO's ● ● Promote colonization of commensal bacteria, antimicrobial effects (pathogen binding, change gut′s pH) Gangliosides ● ● Prebiotic, suppress inflammation Other immunological compounds LCPUFAs ● ● Promote tolerance, Th1 and Th2 response Nucleotides ● Intestinal trophic factor, promote differentiation and activation of lymphocytes and macrophage, NK activity Osteoprotegerin ● ● May regulate Th1/Th2 balance Food antigens ● Promote tolerance EGF, epidermal growth factor; G‐CSF, granulocyte‐macrophage colony‐stimulating factor; HMO, human milk oligosaccharides; IFN‐g, interferon gamma; Ig, immunoglobulin; IGF, insulin‐like growth factor; IL, interleukin; IP, interferon gamma (IFN)‐g‐inducible protein; LCPUFA, long‐chain polyunsaturated fatty acid; MCP, monocyte chemotactic protein 1; MIP, monokine induced by IFN‐g; TGF, transforming growth factor; TNF‐a, tumor necrosis factor‐alpha. Recent studies show that milk composition may contain different compounds according to the newborn's condition, suggesting a permanent dynamic interaction between mother and baby. Riskin et al36 found an increased number of leukocytes in breast milk when the infant has an infection. Additionally, there are significant differences between immunological factors for term and preterm breast milk.17, 37 In the last few years, analytical advancements have allowed a better characterization of the human milk composition, discovering new structures like stem cells, microbiome elements, miRNA, increasing our knowledge every day.38, 39 3.2 Breast milk and microbiome Breastfeeding influences the gut microbiome and metagenome. Recent studies revealed that the main imprinting events on the newborn immune system might be mediated through the microbiome, highlighting the early influence of the infant's diet nature.6, 40 Its capability to regulate hosts responses depends on the bacterial composition of milk. Abnormal colonization has a long‐term effect on the immune system, mainly with respect to metabolic and autoimmune diseases.41 The microbiome of breastfed infants has copious amounts of bifidobacteria and Lactobacillus species, promoted by the rich bioactive factors present in the human milk, like oligosaccharides(HMOs) that function as natural prebiotics.42 Therefore, there is indeed specificity between the infant's microbiome and breastfeeding, resulting in different bacterial‐induced effects on metabolism and immunity. Curiously, this interaction is based on the mother's enteromammary axis, with the release of dendritic cells containing live maternal gut microbiome (which select non‐pathogenic bacteria from the gut lumen and carry them to the lactating mammary gland), T cells expressing gut‐derived β7 integrins, and plasma cells producing specific immunoglobulin into the milk.43, 44 Naturally, the cytokines present in breast milk also depend on the mother's immunological experience and this heritage will be transmitted to the infant's immature immune system, encouraging tolerogenic responses.45 Studies have reported similar microbiome profiles in human milk, independently of newborns time of gestation or delivery mode.46 Bergstom et al47 reported that the major factor affecting infant microbiome up to 12 months of age was the cessation of breastfeeding. 3.3 Breast milk and immune tolerance A healthy mucosal immune system is capable of distinguishing nutritional antigens and non‐harmful microbes from pathogens, promoting adequate immunological reactions by suppression of cellular and humoral immune responses to ingested antigens. This “controlled responses” are called “oral tolerance” and are influenced by the intestinal microbiota.48 Diseases due to a defect in immune tolerance, such as celiac disease or type 1 diabetes are less common in children who were breastfed, suggesting a protective effect.49 Recent data reported that breastfeed‐induced protection may be explained by early antigen‐specific tolerance induction, both by the transfer of antigens through milk and the presence of factors that affect the newborn's immune maturation and responses,50 adjusting for the deficiency of Immunoglobulin (Ig) synthesis during the first year of life. Indeed, studies have exposed the presence of antigens involved in the pathogenesis of multiple immune‐mediated diseases, such as soluble maternal semi‐allogenic HLA molecules,51 maternal cells, gliadin, ovalbumin, intact human insulin, and food allergens, such as peanut and bovine beta‐lactoglobulin.52 Each mother will produce different milk in accordance with her previous antigen exposure,53 as well as immune responses to transferred antigens, permeability of the mammary gland epithelium,54 microbiome‐influencing factors, gut growth factors in milk, and the presence of tolerogenic molecules.11, 55 4 BREASTFEEDING AND AUTOIMMUNE DISEASES 4.1 Breastfeeding and diabetes 4.1.1 Type 1 diabetes Type 1 diabetes (T1D) is known to be an immune‐mediated disease causing destruction of pancreatic B cells eventually leading to complete and lifelong dependence on exogenous insulin.56 Although genetic susceptibility variants play a crucial role in the development of T1D, increased incidence over the past 50 years strongly suggests an important role for non‐genetic factors.57, 58 The hypothesis that breastfeeding could protect against type 1 diabetes was proposed more than 30 years ago by Borch‐Johnsen et al,59 and since then, several mechanisms have been implied. The reason why human milk might protect against T1D remains uncertain, although numerous theories have been considered for the protective effect of breastfeeding, such as lower incidence of potentially diabetogenic infections, later exposure to dietary antigens, healthier gut microbiota, and correct maturation of the newborn's gut.6, 60, 61 Several positive health outcomes have been associated with breastfeeding4, 62 so far. Cardwell et al63 reported that being breastfed for more than 3 months or exclusively breastfed for more than 2 weeks after birth was associated with 15%‐30% lower risk of T1D in childhood. This association was also found in genetically high‐risk birth controls,64 although other studies were not able to find such affiliation.65, 66 Recently, Lund‐Blix et al performed a large cohort study involving 155 392 children to clarify the relation between the duration of full or any breastfeeding and risk of type 1 diabetes. The authors concluded that children who were never breastfed had a twofold increased risk for developing type 1 diabetes. In the same cohort, authors found no association between the age of introduction of specific solid foods (vegetables, fruits, and berries), or breastfeeding while introducing solid foods, and T1D. This result might be due to cultural differences in infant feeding practices worldwide.64, 66, 67 In contrast, the Diabetes and68 Autoimmunity Study in the Young (DAISY) suggested that the introduction of any solid food before 4 months and after 6 months of age predicted the development of T1D. Likewise, Virtanen et al69 concluded from the Type 1 Diabetes Prediction and Prevention Project (DIPP) study a close link between the risk of islet autoimmunity and early introduction of root vegetables. A recent field of investigation relates microbiome and immune‐mediated diseases. Following birth, early gut microbiota undergoes several changes triggered by the environment. As dietary changes strongly shift the microbial community composition early in life, breastfeeding could play a main role preventing dysbiosis. Interestingly, recent data suggest that alterations in the proportions of short‐chain fatty acids (SCFAs), such as butyrate, might be a potential mechanism contributing to the risk of developing T1D.70, 71 Ongoing large prospective birth control studies, such as DAISY, TEDDY (The Environmental Determinants of Diabetes in the Young), DIPP, as well as the first nutritional primary prevention study of type 1 diabetes, Trial to Reduce IDDM in the Genetically at Risk (TRIGR), will help to clarify the influence of nutrition in the pathogenesis of T1D. 4.1.2 Type 2 diabetes Type 2 diabetes (T2D) is an endocrine pathological state affecting young individuals and adults, which has seen a significant increase in the last 30 years, particularly in children worldwide.72 The etiology is highly heterogeneous, including genetic and environmental factors. These environmental factors, such as diet, may be altered to prevent the onset and the development of the disease.72, 73 The absence of breastfeeding or its improper pattern is recognized as a prime contributive factor in the future development of obesity and metabolic syndrome. Indeed, previous studies related proper breastfeeding with a 24% decreased risk of T2D in childhood.74 According to earlier data, a systematic review directly correlated the duration of breastfeeding and the risk of development of childhood T2D and obesity in neonates.75 More recently, Halipchuk et al76 performed a large retrospective case‐control study to identify the factors associated with the development of childhood‐onset T2D and suggested that exclusive breastfeeding decreases the risk of development of childhood‐onset type 2 diabetes. Unless preventive and intervening efforts are successful, the T2D pandemic and its complications will continue to have an intergenerational effect, affecting many more individuals worldwide.77 4.2 Breastfeeding and idiopathic juvenile arthritis Juvenile idiopathic arthritis (JIA) is the most common chronic rheumatic disease of childhood.78 The pathogenesis and etiology of JIA are unclear, although interactions among genetic factors, immune mechanisms, and environmental exposures are thought to contribute in most cases. Studies relating breastfeeding and JIA have been controversial. Mason et al79 suggested that breastfeeding may protect against JIA, although subsequent studies did not support this theory.80, 81 A prospective cohort study reported that a longer duration of breastfeeding (both total and exclusive) may protect against development of JIA,82 finding an increased risk of JIA in children who were breastfed for less than 4 months. Recently, a cohort study associated breastfeeding with an earlier but milder presentation of JIA and with different patterns of arthritis. Authors justified the earlier onset with the differences in ILAR (International League of Associations for Rheumatology) categories observed between the groups, with a higher proportion of PsA/ERA (Psoriatic Arthritis/Enthesitis‐related arthritis) in the never‐breastfed group, which tend to present at a later age.83 The reason why human milk can influence the susceptibility to certain subtypes of JIA is unknown, although studies have related it with differences in microbiome between children with and without enthesitis‐related arthritis.83, 84 Indeed, breastfeeding could be indirectly linked to JIA by the gut microbiome, as altered microbial profiles have been identified among JIA patients.84 However, further studies are needed to clarify the role of breastfeeding in JIA disease risk.85 4.3 Breastfeeding and rheumatoid arthritis Rheumatoid arthritis (RA) is the most common autoimmune inflammatory joint disease worldwide, characterized by a distinctive pattern of bone and joint destruction.86 Several studies have investigated the influence of breastfeeding and the risk of developing RA, but the results were inconsistent.87-89 An investigation performed by Colebatch reported that in HLA‐DR4‐negative children, rheumatoid factor‐positive infants were less likely to have been breastfed for >3 months when compared with rheumatoid factor‐negative children, although this effect was not seen in HLA‐DR4‐positive infants.90 A recent meta‐analysis by Chen et al91 included 1672 patients with RA and aimed to estimate the association between breastfeeding and RA risk, and an inverse association was found in the overall study population, relating a decreased risk of RA no matter if breastfeeding was longer or shorter than 12 months. 4.4 Breastfeeding and multiple sclerosis Multiple sclerosis (MS) is the most common immune‐mediated disease of the central nervous system affecting young adults.92 Evidence suggests that environmental factors act long before MS becomes symptomatic, suggesting the existence of a prodromal phase of this disease. Conradi et al93 recently associated breastfeeding for at least 4 months as a protective factor against the risk of developing MS; however, other studies still debate the impact of breastfeeding duration in determining the risk for MS.94 Applying data from a large multinational case‐control study (EnvIMS), Ragnedda et al95 described an increased risk of MS in males who were breastfed for less than 4 months. The protective role of human milk in the pathogenesis of immune‐mediated MS could be related with its capacity of promoting the immune system development, safeguarding from toxic agents and pathogens, and modulation of immune responses,96, 97 including immunomodulatory effects by interleukin (IL)‐10 production and the anti‐inflammatory properties of transforming growth factor (TGF)‐β.98 4.5 Breastfeeding and celiac disease Celiac disease (CD) is a systemic immune‐mediated disorder caused by the ingestion of gluten‐containing grains in genetically susceptible individuals.99 Genetic background plays a crucial role in the predisposition to celiac disease,100 although better long‐term health was observed in CD patients who were breastfed.101 This fact may be due to the delayed introduction of gluten in daily diet and expanding the latency time between the introduction of gluten and the development of the disease,102 lower incidence of gastrointestinal infections in the newborn who is breastfed,103 and the prevention of gut dysbiosis.104 Meta‐analysis and systemic review, including all studies between 1966 and 2004, found that infants who were breastfed had a 52% risk reduction in developing CD when compared with those who were not breastfed at the time of gluten introduction.105 Hanson et al106 reported that CD was prevented when gluten was introduced in small doses during breastfeeding. More recently, a meta‐analysis proved that the risk of CD was significantly decreased in infants who were breastfed at the time of gluten introduction.105, 107 Actually, being breastfed at the time of gluten introduction was related with a latter onset of CD.100, 105, 107 Interestingly, intestinal dysbiosis may promote an abnormal response to gluten in predisposed individuals,108 a fact that could be due to the role of specific bacteria in the modulation of infant's immune responses.109 However, it is still not clear whether human milk truly provides permanent tolerance acquisition or just a symptomatic reduction and delayed diagnosis of CD.110 Future studies should investigate the effect of different intervention strategies in CD, including nutrition, immunomodulation, and the role of the microbiome.111 4.6 Breastfeeding and inflammatory bowel diseases Inflammatory bowel diseases (IBD) are known as a chronic inflammatory condition of the gastrointestinal tract, manifesting has 2 major disorders: ulcerative colitis and Crohn disease.112 The exact pathogenesis of IBD remains unknown, and part of the underlying mechanism is believed to be a deregulated host immune response to intestinal flora, in genetically susceptible individuals.12, 113 The major risk for developing IBD is having a family history of the disease.113 The greatest incidence of IBD is in early adulthood, bolstering the fact that early exposures might force future susceptibility. Human milk compounds not only protect against infections but also influence the immune tolerance and bacterial colonization of the infant's gut.114 Considerable investigations found that breastfeeding was protective for IBD,115-117 mainly on early onsets.118 However, other studies failed to relate breastfeeding with IBD.119, 120 This result heterogeneity might be explained by differences in definition (exclusive or nonexclusive) and duration of breastfeeding. 4.7 Breastfeeding and asthma The allergic response to common environmental allergens has been regarded as an important mechanism in the development of airway inflammation in patients with asthma.121 Antibodies directed toward β‐adrenergic receptors were found in sera of some patients with asthma supporting an autoimmune role in the impairment of β‐adrenergic responsiveness.122 Until now, many studies suggested that prolonged and exclusive breastfeeding reduces the risk of wheezing and asthma in infancy and early childhood. Human milk contains allergens, allergen‐specific immunoglobulins, immune complexes, and immunosuppressive cytokines that are transferred through the milk and might modify the immune response to allergens and decrease susceptibility to immune‐mediated disorders.123 A questionnaire‐based cross‐sectional study performed in 2016 by Huang et al concluded that exclusive breastfeeding for 3‐6 months and either partial or exclusive breastfeeding for more than 6 months were associated with significantly reduced risk of asthma. The infant gut microbiome is emerging as an important hypothesis; accordingly, Johnson et al124 recently related the abnormal gut microbiota with the risk of developing asthma and allergic diseases, suggesting the protective role of human milk in maintaining a healthy gut microbial environment. 4.8 Breastfeeding and other autoimmune diseases In 1990, Fort attempted to assess the prevalence of breastfeeding in patients with autoimmune thyroid disease (ATD), which may have a protective role in the development of this disease. Results were unable to document any relationship between the history and duration of breastfeeding and development of ATD; however, a higher prevalence of feedings with soy‐containing formulas in early infancy was found.125 Recently, Simard et al126 evaluated the link between breastfeeding and systemic lupus erythematosus (SLE) among 2 prospective cohort studies, the Nurses’ Health Study and the Nurses’ Health Study II, but found no statistically significant association between duration and SLE incidence. Further research in this field may lead to novel links and strategies of breastfeeding and immune disorders. To summarize and for better comprehension, the relation between breastfeeding and autoimmune diseases is illustrated in Figure 2. 5 BREASTFEEDING MOTHER, PROLACTIN, AND AUTOIMMUNE DISEASES A high prevalence of autoimmune diseases among females suggests a crucial role for gender and hormonal involvement in the pathogenesis of these diseases. The association between prolactin and the immune system has been extensively investigated in the last 2 decades. Prolactin is a polypeptide hormone and member of the immunoneuroendocrine network. It is synthesized not only in the hypophysis but also in other several sites such as neurons, mammary epithelium, skin, prostate, immune organs, and cells. Prolactin secreted by the hypophysis acts as a hormone while the one produced in other organs functions as a cytokine.127 Even though the main physiological role of prolactin is to regulate the mammary gland and ovaries, sustain lactation, and control maternal behavior, currently the evidence points to a correlation between prolactin and autoimmune diseases (Table 2) specially, systemic lupus erythematosus (SLE).128 Organ‐specific diseases Systemic diseases Diabetes mellitus type 1 Celiac disease Addison′s disease Grave′s disease Hashimoto′s thyroiditis Multiple sclerosis Uveitis Lymphocytic hypophysitis Rejection of heart transplant Systemic lupus erythematosus Systemic sclerosis Sjögren syndrome Rheumatoid arthritis Reactive arthritis 5.1 Prolactin and immune modulation Genes which encode prolactin are located in the short arm of chromosome 6, near to HLA‐DRB1. Polymorphisms of the human prolactin gene might have implications in the pathogenesis of autoimmune diseases.127, 129 Studies have demonstrated that hyperprolactinemia impacts B‐cell tolerance via several pathways: (1) decreasing apoptosis in transitional B cells, (2) impairing B‐cell clonal deletion, (3) deregulating receptor editing, and finally (4) decreasing activation of anergic B cells.130-132 Besides, prolactin has proved to induce the expression of IL‐2 receptor and production of interferon‐γ and IL‐1.133 It regulates the maturation of dendritic cells and thymocytes, leading to an increased interferon‐α production and an enhancement of pro‐B‐cell generation.134, 135 5.2 Prolactin and systemic lupus erythematosus Systemic lupus erythematosus is more common in women of reproductive age. Hyperprolactinemia has been described in multiple autoimmune diseases and has shown an intimate correlation with SLE.136 Recently, Song et al137 performed a meta‐analysis to evaluate the relationship between circulating prolactin level and SLE. The author succeeded to demonstrate a significantly positive correlation between prolactin levels and disease activity. A large cohort study performed by Orbach et al138 suggests a role for hyperprolactinemia in lupus and its manifestations, including serositis and anemia. In addition, bromocriptine therapy proved to be beneficial in decreasing disease activity and improving activity scores.139, 140 The discontinuation of therapy was associated with lupus flares.141, 142 Taken together, these findings raise the question whether mothers with SLE should breastfeed their infants. Current evidence points specially to the benefits of treatment with bromocriptine in non‐responsive lupus cases or in flare prevention in postpartum.10, 143 6 CONCLUSIONS The benefits of breastfeeding are well recognized worldwide. Current scientific evidence supports the beneficial role of breastfeeding in several immune‐mediated diseases, although a few exact pathways are yet to be elucidated. Recent technological progresses allowed a better characterization of the human milk composition, opening new horizons to our knowledge for a better understanding of its capabilities, and plausible mechanisms which play a protective role in a heterogeneous pool of diseases with health long‐term effects. On the other hand, the benefits of breastfeeding for mothers with autoimmune diseases are debatable. The role of prolactin in the modulation of the immune system is undeniable, and recent data showed a positive correlation between hyperprolactinemia and lupus manifestations, disease activity, and relapses. Current evidence proved that treatment with bromocriptine is beneficial to non‐responsive lupus cases or on flare prevention in the postpartum. 7 KEY NOTES According to early breastfeeding patterns, decisive imprinting events on the immune system might be modulated during the first months of life, with potential long‐term health effects. Human milk benefits may be explained by the protection against early infections, anti‐inflammatory properties, early antigen‐specific tolerance induction, and regulation of infant's microbiome. Breastfeeding was associated with a protective role in T1D and CD. Benefits in T2D were related to the prevention of obesity and metabolic syndrome. In AS, breastfeeding showed benefit by promoting healthy microbiota, which is suspected to be influenced by HLA‐B27. Infants who were breastfed for at least 4 months show a decreased incidence of MS, through the immunomodulatory effects of IL‐10 production and the anti‐inflammatory properties of TGF‐β. Breastfeeding was associated with lower incidences of asthma during childhood, mainly because of a shaped immune response to allergens. Association between breastfeeding and JIA, RA, and IBD was controversial. A positive correlation between hyperprolactinemia and SLE manifestations, disease activity, and relapses was found. Evidence proved the benefits of treatment with bromocriptine on non‐responsive lupus cases and on flare prevention in the postpartum. ACKNOWLEDGMENTS The authors would like to express sincere gratitude to Professor Eitan Israeli for his priceless contribution to this article. CONFLICT OF INTEREST The authors have no potential conflict of interests in authorship or publication. REFERENCES Citing Literature
|
|
Scooped by
Gilbert C FAURE
June 12, 2019 9:29 AM
|
Significance Functional loss of gut barrier integrity with subsequent increased antigen trafficking and occurrence of low-grade intestinal inflammation precede the onset of type 1 diabetes (T1D) in patients and preclinical models, thus suggesting that these events are mechanistically linked to the autoimmune pathogenesis of the disease. However, a causal relationship between increased intestinal permeability and autoimmune diabetes was never demonstrated. Our data show that breakage of gut barrier continuity leads to activation of islet-reactive T cells in the intestine, thus triggering autoimmune diabetes. An important implication of our findings is that restoration of a healthy gut barrier through microbiota and diet modulation in diabetes-prone individuals could reduce intestinal activation of islet-reactive T cells and prevent T1D occurrence. Abstract Low-grade intestinal inflammation and alterations of gut barrier integrity are found in patients affected by extraintestinal autoimmune diseases such as type 1 diabetes (T1D), but a direct causal link between enteropathy and triggering of autoimmunity is yet to be established. Here, we found that onset of autoimmunity in preclinical models of T1D is associated with alterations of the mucus layer structure and loss of gut barrier integrity. Importantly, we showed that breakage of the gut barrier integrity in BDC2.5XNOD mice carrying a transgenic T cell receptor (TCR) specific for a beta cell autoantigen leads to activation of islet-reactive T cells within the gut mucosa and onset of T1D. The intestinal activation of islet-reactive T cells requires the presence of gut microbiota and is abolished when mice are depleted of endogenous commensal microbiota by antibiotic treatment. Our results indicate that loss of gut barrier continuity can lead to activation of islet-specific T cells within the intestinal mucosa and to autoimmune diabetes and provide a strong rationale to design innovative therapeutic interventions in “at-risk” individuals aimed at restoring gut barrier integrity to prevent T1D occurrence. Footnotes ↵1To whom correspondence may be addressed. Email: falcone.marika{at}hsr.it. Author contributions: M.F. designed research; C.S., I.C., M.L.C., L.D.G., F.F., R.L., M.R., and R.F. performed research; C.S., R.F., F.S., F.C., and M.F. analyzed data; and C.S. and M.F. wrote the paper. The authors declare no conflict of interest. This article is a PNAS Direct Submission. This article contains supporting information online at www.pnas.org/lookup/suppl/doi:10.1073/pnas.1814558116/-/DCSupplemental. Copyright © 2019 the Author(s). Published by PNAS. This open access article is distributed under Creative Commons Attribution-NonCommercial-NoDerivatives License 4.0 (CC BY-NC-ND). References ↵ J. A. Todd, Etiology of type 1 diabetes. Immunity 32, 457–467 (2010).OpenUrlCrossRefPubMed ↵ F. Dotta et al., Coxsackie B4 virus infection of beta cells and natural killer cell insulitis in recent-onset type 1 diabetic patients. Proc. Natl. Acad. Sci. U.S.A. 104, 5115–5120 (2007). ↵ M. C. Honeyman et al., Association between rotavirus infection and pancreatic islet autoimmunity in children at risk of developing type 1 diabetes. Diabetes 49, 1319–1324 (2000).OpenUrlAbstract ↵ O. Vaarala et al., Cow’s milk formula feeding induces primary immunization to insulin in infants at genetic risk for type 1 diabetes. Diabetes 48, 1389–1394 (1999).OpenUrlAbstract ↵ J. M. Norris et al., Timing of initial cereal exposure in infancy and risk of islet autoimmunity. JAMA 290, 1713–1720 (2003).OpenUrlCrossRefPubMed ↵ L. Wen et al., Innate immunity and intestinal microbiota in the development of type 1 diabetes. Nature 455, 1109–1113 (2008).OpenUrlCrossRefPubMed ↵ A. Giongo et al., Toward defining the autoimmune microbiome for type 1 diabetes. ISME J. 5, 82–91 (2011).OpenUrlCrossRefPubMed ↵ C. T. Brown et al., Gut microbiome metagenomics analysis suggests a functional model for the development of autoimmunity for type 1 diabetes. PLoS One 6, e25792 (2011).OpenUrlCrossRefPubMed ↵DIABIMMUNE Study Group T. Vatanen et al.; DIABIMMUNE Study Group, Variation in microbiome LPS immunogenicity contributes to autoimmunity in humans. Cell 165, 842–853 (2016).OpenUrlCrossRefPubMed ↵ E. Badami et al., Defective differentiation of regulatory FoxP3+ T cells by small-intestinal dendritic cells in patients with type 1 diabetes. Diabetes 60, 2120–2124 (2011). ↵ T. Vatanen et al., The human gut microbiome in early-onset type 1 diabetes from the TEDDY study. Nature 562, 589–594 (2018).OpenUrlCrossRef ↵ J. B. Meddings, J. Jarand, S. J. Urbanski, J. Hardin, D. G. Gall, Increased gastrointestinal permeability is an early lesion in the spontaneously diabetic BB rat. Am. J. Physiol. 276, G951–G957 (1999).OpenUrlPubMed ↵ S. Graham et al., Enteropathy precedes type 1 diabetes in the BB rat. Gut 53, 1437–1444 (2004). ↵ F. Maurano et al., Small intestinal enteropathy in non-obese diabetic mice fed a diet containing wheat. Diabetologia 48, 931–937 (2005).OpenUrlCrossRefPubMed ↵ A. D. Mooradian, J. E. Morley, A. S. Levine, W. F. Prigge, R. L. Gebhard, Abnormal intestinal permeability to sugars in diabetes mellitus. Diabetologia 29, 221–224 (1986).OpenUrlCrossRefPubMed ↵ R. Carratù et al., Altered intestinal permeability to mannitol in diabetes mellitus type I. J. Pediatr. Gastroenterol. Nutr. 28, 264–269 (1999).OpenUrlCrossRefPubMed ↵ M. Westerholm-Ormio, O. Vaarala, P. Pihkala, J. Ilonen, E. Savilahti, Immunologic activity in the small intestinal mucosa of pediatric patients with type 1 diabetes. Diabetes 52, 2287–2295 (2003). ↵ M. Secondulfo et al., Ultrastructural mucosal alterations and increased intestinal permeability in non-celiac, type I diabetic patients. Dig. Liver Dis. 36, 35–45 (2004).OpenUrlCrossRefPubMed ↵ E. Bosi et al., Increased intestinal permeability precedes clinical onset of type 1 diabetes. Diabetologia 49, 2824–2827 (2006).OpenUrlCrossRefPubMed ↵ J. Neu et al., Changes in intestinal morphology and permeability in the biobreeding rat before the onset of type 1 diabetes. J. Pediatr. Gastroenterol. Nutr. 40, 589–595 (2005).OpenUrlCrossRefPubMed ↵ O. Vaarala, M. A. Atkinson, J. Neu, The “perfect storm” for type 1 diabetes: The complex interplay between intestinal microbiota, gut permeability, and mucosal immunity. Diabetes 57, 2555–2562 (2008). ↵ J. Sun et al., Pancreatic β-cells limit autoimmune diabetes via an immunoregulatory antimicrobial peptide expressed under the influence of the gut microbiota. Immunity 43, 304–317 (2015).OpenUrlCrossRefPubMed ↵ S. J. Turley, J. W. Lee, N. Dutton-Swain, D. Mathis, C. Benoist, Endocrine self and gut non-self intersect in the pancreatic lymph nodes. Proc. Natl. Acad. Sci. U.S.A. 102, 17729–17733 (2005). ↵ A. Sapone et al., Zonulin upregulation is associated with increased gut permeability in subjects with type 1 diabetes and their relatives. Diabetes 55, 1443–1449 (2006). ↵ T. Pelaseyed et al., The mucus and mucins of the goblet cells and enterocytes provide the first defense line of the gastrointestinal tract and interact with the immune system. Immunol. Rev. 260, 8–20 (2014).OpenUrlCrossRefPubMed ↵ M. E. Johansson, H. Sjövall, G. C. Hansson, The gastrointestinal mucus system in health and disease. Nat. Rev. Gastroenterol. Hepatol. 10, 352–361 (2013).OpenUrlCrossRefPubMed ↵ P. M. Smith et al., The microbial metabolites, short-chain fatty acids, regulate colonic Treg cell homeostasis. Science 341, 569–573 (2013). ↵ N. Arpaia et al., Metabolites produced by commensal bacteria promote peripheral regulatory T-cell generation. Nature 504, 451–455 (2013).OpenUrlCrossRefPubMed ↵ R. L. Gallo, L. V. Hooper, Epithelial antimicrobial defence of the skin and intestine. Nat. Rev. Immunol. 12, 503–516 (2012).OpenUrlCrossRefPubMed ↵ P. Chairatana, E. M. Nolan, Defensins, lectins, mucins, and secretory immunoglobulin A: Microbe-binding biomolecules that contribute to mucosal immunity in the human gut. Crit. Rev. Biochem. Mol. Biol. 52, 45–56 (2017).OpenUrl ↵ M. Shan et al., Mucus enhances gut homeostasis and oral tolerance by delivering immunoregulatory signals. Science 342, 447–453 (2013). ↵ Y. H. Sheng et al., MUC1 and MUC13 differentially regulate epithelial inflammation in response to inflammatory and infectious stimuli. Mucosal Immunol. 6, 557–568 (2013).OpenUrlCrossRefPubMed ↵ P. Courtois, C. Jurysta, A. Sener, F. W. Scott, W. J. Malaisse, Quantitative and qualitative alterations of intestinal mucins in BioBreeding rats. Int. J. Mol. Med. 15, 105–108 (2005).OpenUrlPubMed ↵ I. Jaakkola, S. Jalkanen, A. Hänninen, Diabetogenic T cells are primed both in pancreatic and gut-associated lymph nodes in NOD mice. Eur. J. Immunol. 33, 3255–3264 (2003).OpenUrlCrossRefPubMed ↵ J. D. Katz, B. Wang, K. Haskins, C. Benoist, D. Mathis, Following a diabetogenic T cell from genesis through pathogenesis. Cell 74, 1089–1100 (1993).OpenUrlCrossRefPubMed ↵ K. Haskins, M. Portas, B. Bradley, D. Wegmann, K. Lafferty, T-lymphocyte clone specific for pancreatic islet antigen. Diabetes 37, 1444–1448 (1988). ↵ R. Mueller, L. M. Bradley, T. Krahl, N. Sarvetnick, Mechanism underlying counterregulation of autoimmune diabetes by IL-4. Immunity 7, 411–418 (1997).OpenUrlCrossRefPubMed ↵ M. S. Horwitz et al., Diabetes induced by Coxsackie virus: Initiation by bystander damage and not molecular mimicry. Nat. Med. 4, 781–785 (1998).OpenUrlCrossRefPubMed ↵ M. E. Johansson et al., Bacteria penetrate the inner mucus layer before inflammation in the dextran sulfate colitis model. PLoS One 5, e12238 (2010).OpenUrlCrossRefPubMed ↵ C. Hernández-Chirlaque et al., Germ-free and antibiotic-treated mice are highly susceptible to epithelial injury in DSS colitis. J. Crohns Colitis 10, 1324–1335 (2016).OpenUrlCrossRefPubMed ↵ N. Tai et al., Microbial antigen mimics activate diabetogenic CD8 T cells in NOD mice. J. Exp. Med. 213, 2129–2146 (2016). ↵ F. R. Costa et al., Gut microbiota translocation to the pancreatic lymph nodes triggers NOD2 activation and contributes to T1D onset. J. Exp. Med. 213, 1223–1239 (2016). ↵ X. Li, M. A. Atkinson, The role for gut permeability in the pathogenesis of type 1 diabetes—a solid or leaky concept? Pediatr. Diabetes 16, 485–492 (2015).OpenUrlPubMed ↵ O. Vaarala, Leaking gut in type 1 diabetes. Curr. Opin. Gastroenterol. 24, 701–706 (2008).OpenUrlCrossRefPubMed ↵ O. Vaarala, Is the origin of type 1 diabetes in the gut? Immunol. Cell Biol. 90, 271–276 (2012).OpenUrlCrossRefPubMed ↵ A. Hänninen et al., Akkermansia muciniphila induces gut microbiota remodelling and controls islet autoimmunity in NOD mice. Gut 67, 1445–1453 (2018). ↵ H. Brauner et al., Markers of innate immune activity in patients with type 1 and type 2 diabetes mellitus and the effect of the anti-oxidant coenzyme Q10 on inflammatory activity. Clin. Exp. Immunol. 177, 478–482 (2014).OpenUrlCrossRefPubMed ↵ D. L. Kaufman et al., Spontaneous loss of T-cell tolerance to glutamic acid decarboxylase in murine insulin-dependent diabetes. Nature 366, 69–72 (1993).OpenUrlCrossRefPubMed ↵ K. Robinson, Z. Deng, Y. Hou, G. Zhang, Regulation of the intestinal barrier function by host defense peptides. Front. Vet. Sci. 2, 57 (2015).OpenUrl ↵ L. M. Loonen et al., REG3γ-deficient mice have altered mucus distribution and increased mucosal inflammatory responses to the microbiota and enteric pathogens in the ileum. Mucosal Immunol. 7, 939–947 (2014).OpenUrlCrossRefPubMed ↵ H. W. Koon et al., Cathelicidin signaling via the Toll-like receptor protects against colitis in mice. Gastroenterology 141, 1852–1863.e1-3 (2011).OpenUrlCrossRefPubMed ↵ A. S. Lee et al., Gut barrier disruption by an enteric bacterial pathogen accelerates insulitis in NOD mice. Diabetologia 53, 741–748 (2010).OpenUrlCrossRefPubMed ↵ K. Berer et al., Commensal microbiota and myelin autoantigen cooperate to trigger autoimmune demyelination. Nature 479, 538–541 (2011).OpenUrlCrossRefPubMed ↵ B. D. Stadinski et al., Chromogranin A is an autoantigen in type 1 diabetes. Nat. Immunol. 11, 225–231 (2010).OpenUrlCrossRefPubMed ↵ C. M. Gleeson, W. J. Curry, C. F. Johnston, K. D. Buchanan, Occurrence of WE-14 and chromogranin A-derived peptides in tissues of the human and bovine gastro-entero-pancreatic system and in human neuroendocrine neoplasia. J. Endocrinol. 151, 409–420 (1996). ↵ W. J. Curry et al., Chromogranin A and its derived peptides in the rat and porcine gastro-entero-pancreatic system. Expression, localization, and characterization. Adv. Exp. Med. Biol. 482, 205–213 (2000).OpenUrlPubMed ↵ C. Sorini, M. Falcone, Shaping the (auto)immune response in the gut: The role of intestinal immune regulation in the prevention of type 1 diabetes. Am. J. Clin. Exp. Immunol. 2, 156–171 (2013).OpenUrlPubMed ↵ M. Knip, H. Siljander, The role of the intestinal microbiota in type 1 diabetes mellitus. Nat. Rev. Endocrinol. 12, 154–167 (2016).OpenUrl ↵ J. D. Taurog et al., The germfree state prevents development of gut and joint inflammatory disease in HLA-B27 transgenic rats. J. Exp. Med. 180, 2359–2364 (1994). ↵ C. King, N. Sarvetnick, The incidence of type-1 diabetes in NOD mice is modulated by restricted flora not germ-free conditions. PLoS One 6, e17049 (2011).OpenUrlCrossRefPubMed ↵ M. W. Sadelain, H. Y. Qin, J. Lauzon, B. Singh, Prevention of type I diabetes in NOD mice by adjuvant immunotherapy. Diabetes 39, 583–589 (1990). ↵ T. C. Martins, A. P. Aguas, Changes in B and T lymphocytes associated with mycobacteria-induced protection of NOD mice from diabetes. J. Autoimmun. 9, 501–507 (1996).OpenUrlPubMed ↵ D. Elias, D. Markovits, T. Reshef, R. van der Zee, I. R. Cohen, Induction and therapy of autoimmune diabetes in the non-obese diabetic (NOD/Lt) mouse by a 65-kDa heat shock protein. Proc. Natl. Acad. Sci. U.S.A. 87, 1576–1580 (1990). ↵ P. Saï, A. S. Rivereau, Prevention of diabetes in the nonobese diabetic mouse by oral immunological treatments. Comparative efficiency of human insulin and two bacterial antigens, lipopolysacharide from Escherichia coli and glycoprotein extract from Klebsiella pneumoniae. Diabetes Metab. 22, 341–348 (1996).OpenUrlPubMed ↵ R. Horai et al., Microbiota-dependent activation of an autoreactive T cell receptor provokes autoimmunity in an immunologically privileged site. Immunity 43, 343–353 (2015).OpenUrlCrossRefPubMed ↵ T. C. Fung et al., Lymphoid-tissue-resident commensal bacteria promote members of the IL-10 cytokine family to establish mutualism. Immunity 44, 634–646 (2016).OpenUrlCrossRefPubMed ↵ D. K. Cole et al., Hotspot autoimmune T cell receptor binding underlies pathogen and insulin peptide cross-reactivity. J. Clin. Invest. 126, 3626 (2016).OpenUrl ↵ S. Wirtz, C. Neufert, B. Weigmann, M. F. Neurath, Chemically induced mouse models of intestinal inflammation. Nat. Protoc. 2, 541–546 (2007).OpenUrlCrossRefPubMed ↵ R. L. Brown, R. P. Sequeira, T. B. Clarke, The microbiota protects against respiratory infection via GM-CSF signaling. Nat. Commun. 8, 1512 (2017).OpenUrl ↵ K. Atarashi et al., Induction of colonic regulatory T cells by indigenous Clostridium species. Science 331, 337–341 (2011). ↵ B. Weigmann et al., Isolation and subsequent analysis of murine lamina propria mononuclear cells from colonic tissue. Nat. Protoc. 2, 2307–2311 (2007).OpenUrlCrossRefPubMed ↵ L. Lefrancois, N. Lycke, Isolation of mouse small intestinal intraepithelial lymphocytes, Peyer’s patch, and lamina propria cells. Curr. Protoc. Immunol. Chapter 3, Unit 3.19 (2001).OpenUrl ↵ S. Ghosh et al., Colonic microbiota alters host susceptibility to infectious colitis by modulating inflammation, redox status, and ion transporter gene expression. Am. J. Physiol. Gastrointest. Liver Physiol. 301, G39–G49 (2011).OpenUrlCrossRefPubMed
|
|
Suggested by
Société Francaise d'Immunologie
April 20, 2019 3:02 AM
|
Epithelial regeneration is essential for homeostasis and repair of the mucosal barrier.
In the context of infectious and immune-mediated intestinal disease, interleukin (IL)
22 is thought to augment these processes.
|
|
Suggested by
Société Francaise d'Immunologie
April 4, 2019 2:17 PM
|
Research ArticleGastroenterologyImmunology Free access | 10.1172/JCI121668 IL-7 receptor influences anti-TNF responsiveness and T cell gut homing in inflammatory bowel disease Lyssia Belarif,1 Richard Danger,2,3 Laetitia Kermarrec,4 Véronique Nerrière-Daguin,2,3 Sabrina Pengam,1 Tony Durand,4 Caroline Mary,1 Elise Kerdreux,5 Vanessa Gauttier,1 Aneta Kucik,6 Virginie Thepenier,1 Jerome C. Martin,7,8,9 Christie Chang,7,8,9 Adeeb Rahman,7,10,11 Nina Salabert-Le Guen,2,12,13,14 Cécile Braudeau,2,12,13 Ahmed Abidi,2,15 Grégoire David,4 Florent Malard,2 Celine Takoudju,4 Bernard Martinet,2,3 Nathalie Gérard,2,3 Isabelle Neveu,4,5 Michel Neunlist,4,5 Emmanuel Coron,4,5 Thomas T. MacDonald,6 Pierre Desreumaux,16 Hoa-Le Mai,2,3 Stephanie Le Bas-Bernardet,2,3 Jean-François Mosnier,2,17 Miriam Merad,7,8,9,11 Régis Josien,2,3,12,14 Sophie Brouard,2,3 Jean-Paul Soulillou,2 Gilles Blancho,2,3 Arnaud Bourreille,4,5 Philippe Naveilhan,4,5 Bernard Vanhove,1 and Nicolas Poirier1 First published April 2, 2019 - More info Abstract It remains unknown what causes inflammatory bowel disease (IBD), including signaling networks perpetuating chronic gastrointestinal inflammation in Crohn’s disease (CD) and ulcerative colitis (UC), in humans. According to an analysis of up to 500 patients with IBD and 100 controls, we report that key transcripts of the IL-7 receptor (IL-7R) pathway are accumulated in inflamed colon tissues of severe CD and UC patients not responding to either immunosuppressive/corticosteroid, anti-TNF, or anti-α4β7 therapies. High expression of both IL7R and IL-7R signaling signature in the colon before treatment is strongly associated with nonresponsiveness to anti-TNF therapy. While in mice IL-7 is known to play a role in systemic inflammation, we found that in humans IL-7 also controlled α4β7 integrin expression and imprinted gut-homing specificity on T cells. IL-7R blockade reduced human T cell homing to the gut and colonic inflammation in vivo in humanized mouse models, and altered effector T cells in colon explants from UC patients grown ex vivo. Our findings show that failure of current treatments for CD and UC is strongly associated with an overexpressed IL-7R signaling pathway and point to IL-7R as a relevant therapeutic target and potential biomarker to fill an unmet need in clinical IBD detection and treatment. Graphical Abstract Introduction Inflammatory bowel disease (IBD) consists of 2 major forms, ulcerative colitis (UC) and Crohn’s disease (CD), which are chronic relapsing gastrointestinal disorders characterized by chronic intestinal inflammation, dysregulated immune responses to intestinal microbiota, and dysfunction of the epithelial barrier (1, 2). The incidence and prevalence of IBD are increasing worldwide, and these diseases are associated with marked morbidity and have a major impact on quality of life and ability to work (3, 4). Current conventional treatments are aimed at dampening inflammation with the gradual use of antiinflammatory agents, steroids, immunosuppressive drugs, and biological agents targeting inflammatory cytokines (mainly TNF) for refractory and severe forms of IBD (5, 6). However, approximately one-third of patients receiving anti-TNF agents do not respond to treatment (primary failure), and a significant proportion (up to 50%) become refractory over time (secondary failure) (7). A key feature of IBD is also the rapid recruitment and prolonged persistence of leukocytes at the site of inflammation, which is facilitated by integrin interaction with cognate receptors expressed by endothelial cells allowing cell adhesion and transmigration (8, 9). Emerging therapies are targeting this entry point to the gut with antiadhesion molecules, specially targeting the gut-specific α4β7 integrin (10, 11). However, these therapies do not induce remission in more than half of patients, and relapse also occurs over time in primary responders. Thus, one major goal is to identify novel mechanisms and signaling networks that underlie the chronicity and relapse of IBD. Interleukin-7 (IL-7) is a limiting and nonredundant cytokine produced mainly by epithelial and stromal cells that regulates T lymphocyte homeostasis (12, 13). Almost all conventional mature T lymphocytes express high IL-7 receptor (IL-7R) levels, with the specific exception of naturally occurring Tregs, constituting a rare opportunity to selectively target pathogenic effectors while preserving natural regulators (14–16). IL-7 signals through the cell surface IL-7R that consists of a specific IL-7R α chain (IL-7Rα, CD127) that dimerizes with the common cytokine receptor γ chain (γc, CD132, IL2RG) (17). IL-7Rα also interacts with the thymic stromal lymphopoietin receptor (TSLPR) chain to form the heterodimeric receptor of the TSLP cytokine (18). Upon activation, IL-7R delivers proliferative and antiapoptotic signals by activating PI3K and JAK/STAT pathways as well as regulating expression of anti- and proapoptotic BCL-2 family members (19). More than 2 decades of research has reproducibly highlighted the crucial systemic influence of the IL-7 pathway and depicted IL-7 as a fuel for chronic autoimmune and inflammatory diseases as well as transplant rejection in diverse rodent models (20–22). Remarkably, the colon is the major source of IL-7 outside of the lymphoid tissues in mice, and commensal microflora promotes steady-state IL-7 production by intestinal epithelial cells (23, 24). IL-7–transgenic mice spontaneously developed chronic colitis with IL-7Rαhi T cells infiltrating the gut mucosa, which, once isolated, transferred colitis to immunodeficient recipient mice, thereby demonstrating their pathogenicity (25–29). More recently, IL-7Rαhi innate lymphoid cells (ILCs) were described as new key effectors of IBD (30–32), and IL-7Rα antagonists suppressed both adaptive and innate inflammatory responses in different experimental models of colitis (26, 27, 33, 34). In humans, however, research on IBD has mainly focused on a proinflammatory and antiinflammatory cytokine balance (35–37), while the IL-7/IL-7Rα axis remains poorly studied. IL-7 production by intestinal epithelial cells and IL7R expression by mucosal T lymphocytes were described in colon biopsies from healthy donors (38). One study reported genetic loci variation of the IL7R gene being associated with susceptibility to UC (39). Lastly, elevated IL-7 signaling pathway gene expression in blood CD8+ T cells at diagnosis was significantly associated with relapsing and a more aggressive IBD disease course (40). Whether IL-7 activities are implicated in the pathogenesis of IBD in humans and determine the fate of treatment is uncertain. Results Colon-specific increased mucosal IL7R signaling pathway signature in refractory IBD. Higher gene expression of the IL-7 signaling pathway members in peripheral blood CD8+ T cells has been previously correlated with a relapsing and aggressive disease course of IBD (40). We therefore sought to address whether the local/mucosal IL-7/IL-7R pathway could be enriched in severe IBD and associated with the failure of conventional therapies. For this purpose, we focused our hypothesis-driven analysis on only the transcriptional IL-7/IL-7R signaling signature of 20 genes (curated from BioCarta by the Molecular Signatures Database [MSigDB]; ref. 40) in colon mucosal biopsies from previously published cohorts of IBD patients with clinically active or inactive disease after immunosuppressive therapy. We examined 2 independent cohorts (UC [n = 23] compared with controls without IBD [n = 13], ref. 41; and UC [n = 97] or CD [n = 8] compared with controls without IBD [n = 11]; ref. 42). We found that this 20-mRNA expression signature was altered according to the clinical status (Figure 1, A and D), with a particularly significant accumulation of IL7R mRNA transcripts in inflamed mucosa from refractory IBD patients relative to those in uninvolved control mucosa from the same patients (P < 0.0001), mucosa from responder patients (P < 0.001), or non-IBD controls (Figure 1, C and F). Principal component analysis (PCA) of the mucosal IL-7R signaling signature after immunosuppressive therapy displayed in both cohorts a clear and distinct separation between active versus inactive disease status and the group of uninvolved mucosa that gathered from non-IBD controls (Figure 1, B and E). Figure 1 IL-7R signaling pathway expression is highly expressed in colonic mucosa of refractory IBD. (A) Heatmap of the expression of the 20 selected genes of the IL-7R signaling pathway (40) in colon biopsies from non-IBD control patients (black; n = 13), inactive UC patients (green; n = 8), and active UC patients with involved (red; n = 15) or uninvolved proximal segments (blue; n = 7) after corticosteroids and/or immunosuppression therapy (data set GSE38713; ref. 41). The heatmap represents median-centered and colorized expression values. (B) PCA of the IL-7R signaling signature and (C) relative IL7R expression (log2 data were normalized to the control median; same patient and color groups as in A). (D) Heatmap of the IL-7R signaling signature in colon biopsies from non-IBD controls (black; n = 11), inactive (green; n = 23) or active (red; n = 74) UC patients, and active CD patients (purple; n = 8) after corticosteroids and/or immunosuppression therapy. (E) PCA of the IL-7R signaling signature and (F) relative IL7R expression (log2 data were normalized to the control median; same patient and color groups as in D). (G) Heatmap of the IL-7R signaling signature in colon biopsies from UC patients at weeks 0, 8, and 30 following anti-TNF therapy (green, stable responders, n = 12–17; orange, relapsing patients, n = 3–8; red, primary nonresponders, n = 3–6). (H) PCA after 8 (top) and 30 (bottom) weeks of anti-TNF treatment of the IL-7R signaling signature and (I) IL7R expression (log2 data were normalized to the median of the stable responder group; same patient and color groups as in G). *P < 0.05; **P < 0.01; ***P < 0.001; ****P < 0.0001 between the indicated groups. #P < 0.05; ###P < 0.001 between responders and nonresponders at a single time point. §P < 0.05; §§§P < 0.001, Kruskal-Wallis with post hoc Dunn’s multiple comparisons test within a single response group across all 3 time points. Similarly, the IL-7R signaling signature after anti-TNF treatment allows distinguishing between biopsies according to disease status in a third cohort of UC patients involved in the phase III ACT-1 clinical trial of infliximab (including long-term responders [n = 17], short-term responders and then relapse [n = 8], and primary nonresponders [n = 6]; ref. 43) (Figure 1G). PCA of the mucosal IL-7R signature clearly separates responder from nonresponder patients 30 weeks after maintenance with anti-TNF treatment (Figure 1H). Furthermore, mucosal IL7R expression was significantly higher in clinically active versus inactive disease in anti-TNF–treated patients at both early (week 8, P < 0.05) and late (week 30, P < 0.001) time points (Figure 1I). IL7R expression significantly decreased after anti-TNF therapy in long-term responders compared with baseline pretreatment levels (P < 0.001); however, no significant difference was measurable before treatment between groups in this clinical trial cohort. In contrast to colon mucosa, the IL-7R signature in ileal biopsies was not associated with clinical status in a fourth cohort (44) of untreated pediatric patients with newly diagnosed ileal (iCD; n = 143) or colon-only (cCD, n = 30) CD or UC (n = 38) as compared with pediatric healthy controls (n = 42) (Supplemental Figure 1, A and B; supplemental material available online with this article; https://doi.org/10.1172/JCI121668DS1). IL7R expression was only higher in ileal biopsies with histological microinflammation versus uninflamed biopsies of cCD; however, no difference was observed in ulcerated or nonulcerated iCD relative to healthy controls (Supplemental Figure 1C). Furthermore, IL7R was not differentially expressed in colon mucosa of different non-IBD types of controls, including in inflammatory non-IBD pathology such as diverticulitis (Supplemental Figure 2). Altogether, the data indicate that mucosal expression of the IL-7R signaling pathway, and specifically IL7R, is strongly and selectively associated with colonic but not ileal IBD inflammation. Expression is related to disease activity in IBD patients (Table 1) and could be one mechanism associated with refractory and severe IBD. Table 1 IL7R expression significance in active IBD mucosa versus healthy controls after treatment with immunosuppression and/or corticosteroids, or before therapy with anti-TNF or anti-α4β7 between responders and nonresponders Colonic IL-7Rα expression predicts resistance to anti-TNF therapy. We then asked whether the mucosal IL-7R signaling signature is associated with responsiveness to anti-TNF before initiation of biologic therapy in patients refractory to corticosteroids and/or immunosuppression. We thus performed a meta-analysis of publicly available transcriptional data sets of 3 cohorts of UC patients with colon mucosa biopsies performed before anti-TNF treatment (within a week) (45–47). In these 3 cohorts, anti-TNF response was defined as histological healing analyzed 4–6 weeks after their first anti-TNF infusion (altogether: n = 18 non-IBD controls, n = 41 UC nonresponders, and n = 28 UC responders). Differential analysis of all expressed genes of the meta–data set (17,037 genes) identified only 85 genes significantly (adjusted P value < 0.05) and differentially (log2 FC > 1) expressed between responders and nonresponders, including IL7R (Supplemental Figure 3), which clustered with a large group of genes associated with adaptive immune response, T cell activation, and leukocyte migration/adhesion (Supplemental Figure 4). Analysis of the transcriptional IL-7R signaling signature (20 genes previously described) revealed that the IL-7R signaling signature, in particular IL7R, was already elevated in colon biopsies of primary UC nonresponder patients before initiation of anti-TNF therapy (Figure 2, A–C). A lasso (least absolute shrinkage and selection operator) regression analysis identified a combination of 10 genes (IL7R, IL2RG, JAK1, PIK3CA, LCK, PTK2B, EP300, NMI, CRLF2, and TSLP) within this IL-7R signaling signature able to discriminate anti-TNF nonresponders from responders. Pretreatment expression of IL7R or the 10-gene IL-7R–restricted signature strongly discriminated primary nonresponsiveness to anti-TNF therapy in this meta-analysis (IL7R receiver operating characteristic [ROC] AUC = 84%, 10-gene IL-7R signature ROC AUC = 93%) (Figure 2D). The absence of IL7R expression in the signature decreased correlation with anti-TNF response (AUC = 88%). These data suggest that the entire pathway is associated with the nonresponse to anti-TNF, from IL-7R to transcriptionally regulated proteins (i.e., ITGA4) to major key signaling components (JAK/STAT, PI3K) (Supplemental Figure 5). Intestinal oncostatin M (OSM) has been also recently reported to be associated with anti-TNF unresponsiveness in IBD (48). OSM was also identified as differentially expressed among 85 genes in our meta-analysis (Supplemental Figure 3). OSM expression correlated in these UC biopsies with IL7R expression but was not superior to IL7R in discriminating primary nonresponse to anti-TNF therapy (Supplemental Figure 6). While combining OSM or OSMR with IL7R expression slightly improved ROC analysis, the 10-gene IL-7R–restricted signature remained more potent. Finally, the abundance of immune cell populations in this meta–data set was estimated using the deconvolution CIBERSORT tool (49). IL7R expression was not correlated with relative abundance of myeloid cells, B cells, or NK cells (data not shown) or with any subsets of effector T lymphocytes (CD8+, CD4+, naive, or memory; or resting, activated, or follicular Th cells) (Figure 2E). In contrast, deconvolution of the meta–data set revealed that IL7R expression was significantly and inversely correlated with the relative fraction of Tregs (r = –0.67, P < 0.0001) in colon mucosa of UC patients before anti-TNF therapy and associated with an imbalanced local ratio of Tregs to effector T lymphocytes (Teffs) (r = –0.66, P < 0.0001) (Figure 2E). IL7R expression also correlated significantly and positively with both IFNG and Tbx21 (T-bet) gene expression, hallmarks of Th1 effector cells, and with expression of some Th17 hallmark genes (such as IL17A, IL22, and IL23, but, surprisingly, in an inverse correlation with the RORC gene), as well as the GATA3 hallmark of Th2 (though no correlation was observed with IL4, IL5, or IL13) (Supplemental Figure 7). Finally, using a recently published gene expression signature of human tonsil CD127+ ILCs characterized by single-cell RNA sequencing (50, 51), we found that signatures of all ILC subsets (ILC1, ILC2, and ILC3) were enriched in UC patients from the meta–data set as compared with non-IBD controls, and that ILC signatures were significantly overexpressed in anti-TNF nonresponder versus responder patients (Supplemental Figure 8). However, these signatures were built using isolated tonsil ILC subsets and not to estimate the relative abundance of ILCs in a bulk RNA data set. Furthermore, the low abundance of ILCs in human colon (52, 53) makes them unlikely to explain transcriptomic differences detected in bulk transcriptomic data. Figure 2 Colonic mucosal IL7R and IL-7R signaling pathway expression at baseline is associated with nonresponse to anti-TNF therapy. (A) Heatmap of the expression of the 20 selected genes previously reported as key members of the IL-7R signaling pathway (40) in colon biopsies of non-IBD controls (n = 18), responders (green; n = 28), and nonresponders (red; n = 41) before anti-TNF therapy. Meta-analysis of 3 UC cohorts with histological healing as the anti-TNF response criterion: data sets GSE16879 (46), GSE12251 (45), and GSE73661 (47). The heatmap represents median centered colorized expression values in which yellow values indicate overexpression and blue values indicate underexpression. (B) Gene set enrichment analysis from the meta–data set at week 0 of the IL-7R signaling signature (20 selected genes). ES, enrichment score. (C) Relative IL7R expression before anti-TNF treatment (log2 data normalized to the control median) in the same groups of patients and colors as in A. (D) ROC analysis of expression of IL7R, the IL7R 10-gene signature (IL7R, IL2RG, JAK1, PIK3CA, LCK, PTK2B, EP300, NMI, CRLF2, and TSLP), and the signature without IL7R (9 genes) distinguishing anti-TNF responders and nonresponders. (E) Correlation of IL7R expression with enrichment of leukocyte subsets as estimated by CIBERSORT in the same groups of patients and colors as in A. Left: Effector T lymphocytes (Teff); middle: regulatory T lymphocytes (Treg); right: Treg/Teff ratio. **P < 0.01; ***P < 0.001; ****P < 0.0001 between indicated groups, Kruskal-Wallis test with post hoc Dunn’s multiple comparisons test. Analysis within each cohort independently showed that pretreatment individual baseline IL7R expression was significantly increased in UC but also in cCD nonresponder colon mucosa and did not decrease after anti-TNF therapy (Supplemental Figure 9). Colon mucosal IL7R and the 10-gene IL-7R signature were strongly and repeatedly discriminative of primary responsiveness to anti-TNF therapy in 4 different cohorts of UC and cCD patients (10-gene IL-7R signature ROC AUC = 88.3%, 95.3%, 95.2%, 96.7%). In contrast, while the ileum was also inflamed in active iCD patients, the IL-7R signaling signature or IL7R alone in ileal mucosa was not differentially expressed before or after anti-TNF induction therapy and was not associated with anti-TNF responsiveness in iCD patients (Supplemental Figure 1, D–F). Finally, colon mucosa gene expression analysis of a single recent cohort of UC patients treated with anti-α4β7 (vedolizumab) therapy confirmed also that IL-7R signaling signature was altered and IL7R was differentially expressed between responders and nonresponders at early (week 6) or late (week 52) time points after treatment (Supplemental Figure 10). Altogether, our meta-analysis argues that the pretreatment mucosal IL-7R signaling signature and IL7R expression in the colon are strongly associated with nonresponsiveness to anti-TNF, and presumably also anti-α4β7 therapy, in UC and cCD patients (Table 1) and are associated with a local deficit in Tregs. Characterization of mucosal IL7/IL7R expression. To validate the meta-analysis results, we first performed quantitative reverse transcription PCR (RT-qPCR) on freshly isolated mucosal colon biopsy specimens from UC (n = 21) or CD (n = 24) patients with active disease (based on clinical and endoscopic findings) and treated with immunosuppressive or anti-TNF therapies (Supplemental Table 1). Paired biopsies from both uninvolved (healthy) and involved (diseased) colonic areas of IBD patients were analyzed and compared with those from non-IBD control patients (n = 20) who underwent endoscopy at Nantes University Hospital in France. This analysis confirmed significantly higher expression of IL7, IL7R, and IL2RG (γ chain) in involved colon mucosa of patients with immunosuppressive- or anti-TNF–refractory UC and CD, compared with uninvolved paired tissue from the same patients or non-IBD controls (Figure 3, A and B, and Supplemental Figure 11). The TSLPR chain, which also forms a heterodimer with IL-7Rα (18), was also elevated in the inflamed colon of IBD patients (Supplemental Figure 11). In line with a previous report (54), full-length TSLP cytokine transcripts were not significantly different, while the short-form TSLP variant, which does not signal IL-7Rα/TSLPR but has characteristics of an antimicrobial peptide (55), exhibited reduced mRNA levels in both healthy and inflamed colonic areas of UC and CD patients (Supplemental Figure 11). In parallel, we found increased mRNA expression of ITGA4 (α4 integrin) and ITGB7 (β7 integrin) as well as TNF and TNF receptors (TNFR1 and TNFR2) in involved IBD samples, confirming the inflammatory profile of these biopsies. Both IL7 and IL7R mRNA expression significantly correlated with ITGA4/ITGB7 and TNF/TNFR expression (Supplemental Figure 12) with a marked correlation for α4β7 integrin. Several IL-7 and IL-7Rα splice variants have been described (56, 57), including a functional soluble IL-7Rα isoform (58). Expression of membrane-bound IL7R and full-length IL7 strongly correlated with IL7R and all IL7 variants by RT-qPCR analysis, suggesting that alternative splicing is not modified in inflammatory settings (Supplemental Figure 13). Figure 3 Increased IL7R mRNA and IL-7Rα protein expression in UC and CD colon mucosa. (A and B) Relative IL7 and IL7R expression, as measured by RT-PCR, of colon biopsies from inflamed and healthy areas of UC (n = 21) (A) and CD (n = 24) (B) patients compared with non-IBD control patients (n = 20). Each symbol represents 1 patient, bars represent means, and error bars show SEM. *P < 0.05, **P < 0.01, and ***P < 0.001 between indicated groups. (C) Representative IL-7Rα immunohistochemical staining of colonic biopsy specimens from non-IBD control (infectious acute colitis) and inactive and active UC or CD (scale bars: top and middle, 100 μm; bottom, higher-magnification images of the panels above, 50 μm). We then confirmed increased IL-7Rα expression at the protein level first by immunohistochemistry in colon biopsy specimens of active UC and CD patients as compared with inactive IBD or non-IBD controls (Figure 3C). IL-7Rα staining was mainly present on inflammatory infiltrates in these biopsies as well as by some epithelial cells in the inflammatory microenvironment. To decipher which immune cell types express IL-7Rα in inflamed colon, mass cytometry (CyTOF) analyses, using a panel of 30 detection antibodies, were performed on human lamina propria cell suspensions prepared from the colon of UC patients (n = 3) before treatment with immunotherapy. IL-7Rα expression was observed only on mucosal CD4+ or CD8+ T lymphocytes as well as ILCs but not on other leukocyte cell types (Figure 4, A–C). Remnant epithelial (EPCAM+CD45–) or stromal cells (EPCAM–CD45–) in these lamina propria cell suspensions did not express IL-7Rα (Figure 4F). As anticipated, ILCs expressed the highest level of IL-7Rα. However, the low abundance of ILCs within mucosal leukocytes (Figure 4D) is unlikely to explain overexpression in the bulk transcriptomic data set. Phenograph analysis identified 3 clusters of IL-7Rα+ T lymphocytes, 2 of them corresponding to mucosal CD4+ or CD8+ T cells coexpressing mucosal integrins αE and β7 (Figure 4E). In contrast, the mucosal CD4+ T cell subset expressing the highest level of CD25 (IL-2R), which might be enriched in regulatory T cells, did not express a significant level of IL-7Rα, confirming that Tregs in inflamed mucosal tissues do not express IL-7R. Altogether, our biocollection transcriptomic and proteomic analyses confirmed that IL-7Rα is overexpressed in inflamed colon mucosa from IBD patients and that IL-7Rα is mainly expressed by mucosal ILCs and T lymphocytes coexpressing mucosal integrins such as β7 integrin. Figure 4 Characterization of CD127 expression among UC lamina propria cells. (A) Representative t-distributed stochastic neighbor embedding (tSNE) analysis showing single-cell intensity of CD127 among CD45+ lamina propria leukocytes from UC inflamed colon (n = 3 UC patients). (B) Left: Major immune populations were manually gated and identified on the tSNE map on the basis of canonical marker expression patterns. Right: Heatmap showing the corresponding color-coded normalized expression of canonical markers in gated immune populations. (C) Histograms showing medians of CD127 signal intensity within each of the immune populations defined in B. (D) Frequencies of CD127+ lymphocyte populations among lamina propria leukocytes. Bars correspond to the mean ± SEM (n = 3 UC patients). (E) Phenograph analysis identifies 3 clusters of CD127+ T cells in UC inflamed colon. Each column corresponds to a cluster. Rows indicate the color-coded normalized mean expression intensity of indicated markers in each cluster. CD127+ T cell clusters are indicated with arrows. (F) CD127 expression on lamina propria remnant EPCAM+ epithelial cells or EPCAM– stromal cells. IL-7 signaling controls α4β7 gut-homing integrin expression on effector human T cells. Our validation transcriptional analysis of colon biopsies and CyTOF analysis of mucosal leukocytes revealed a marked correlation between IL-7/IL-7Rα and α4β7 integrin expression in humans. Injection of recombinant IL-7 has recently been shown to provoke rapid and significant T cell accumulation in the gut of macaques and chronically HIV-infected patients (59, 60). Another study described that in vivo IL-7 treatment increased α4β7 expression on circulating T cells from HIV-infected individuals (61). Based on these findings, we aimed to further decipher the relationship between IL-7/IL-7Rα and α4β7 integrin expression in the human setting. Indeed, the link between IL-7 and α4β7 expression could not be easily deduced from previous experimental models, since we found that mouse IL-7 did not regulate mouse T lymphocyte α4 and β7 expression at the mRNA or protein level (Supplemental Figure 14). We first confirmed that human and mouse IL-7 dose-dependently and selectively induced in vitro α4, β7, and α4β7 heterodimer expression on the surface of human T lymphocytes from healthy donors (Figure 5A and Supplemental Figure 15, A and B). As expected, IL-7Rα expression was downregulated. However, no modification was observed for other major gut-homing receptors (αE, CCR6, CCR9, or GPR15), other homing receptors (CCR5, CXCR3), nor β1 integrin, which associates with α4 (Supplemental Figure 16). IL-7–induced α4β7 overexpression was long-lasting and required continuous stimulation, since removal of IL-7 after 24 hours dramatically prevented maintenance of α4β7 overexpression (Supplemental Figure 17A). Similarly, an anti–human IL-7Rα antagonist mAb dose-dependently prevented IL-7–induced α4β7 overexpression (Figure 5B). Figure 5 IL-7 controls α4β7 expression on human effector, but not regulatory, T lymphocytes. (A) Surface expression of α4, β7, and α4β7 integrin heterodimers on human T lymphocytes from the blood of healthy volunteers cultured for the indicated periods of time in medium alone (white bars) or supplemented with recombinant human IL-7 at 1 ng/ml (green), 5 ng/ml (blue), or 25 ng/ml (red). Data are expressed as median fluorescent intensity ± SEM measured by flow cytometry (n = 6). (B) Human T cells were cultured for 3 days with 5 ng/ml of recombinant human IL-7 and a blocking anti–human IL-7Rα mAb at different concentrations. ITGA4 (squares) and ITGB7 (circles) overexpression was normalized to the condition without anti–IL-7Rα mAb and expressed as mean ± SEM. Dotted line represents basal level expression at t0. (C) Surface expression of α4 and β7 integrin on human T lymphocytes cultured for 48 hours in medium alone (gray) or supplemented with recombinant human IL-7 at 1 ng/ml (green), 5 ng/ml (blue), or 25 ng/ml (red) and, when indicated, with 10 μg/ml JAK1/2 inhibitor (ruxolitinib), 5 μM JAK3 inhibitor (CAS 202475-60-3), 5 μM STAT5 inhibitor (CAS 285986-31-4), or 12.5 μM PI3K inhibitor (LY294002). Data are expressed as median fluorescent intensity ± SEM measured by flow cytometry. (D) Human effector (CD25–CD127hi) and regulatory (CD25hiCD127lo) CD4+ T cells, purified by flow cytometry using a nonantagonistic anti–human CD127 (IL-7Rα) mAb, were cultured with medium alone (gray histogram) or supplemented with 1 ng/ml (green), 5 ng/ml (blue), or 25 ng/ml (red) of human IL-7. IL-7 signaling (STAT5 phosphorylation) was measured after 15 minutes of culture, while ITGA4 and ITGB7 expression was evaluated at 48 hours. Data show 1 representative of 5 experiments. *P < 0.05; **P < 0.01 between indicated groups, Kruskal-Wallis test with post hoc Dunn’s multiple comparisons test. IL-7 induced not only upregulation but also functional activation of the human α4β7 heterodimer, since it increased the binding to mucosal vascular addressin cell adhesion molecule-1 (MADCAM1), the specific ligand of α4β7 (Supplemental Figure 18A). Expression of α4 and β7 protein levels did not differ after cell permeabilization, suggesting the absence of a preformed intracellular pool that might be mobilized by IL-7 (Supplemental Figure 18, B–D). In contrast, we found that ITGA4 mRNA expression increased in human T cells within 2 hours after IL-7 exposure while ITGB7 mRNA levels remained unmodified (Supplemental Figure 19A). Using chemical inhibitors for each step of protein synthesis, we confirmed that IL-7–induced α4 expression required DNA transcription, RNA translation, and endoplasmic reticulum and post-Golgi protein export (Supplemental Figure 19B). While IL-7 differentially regulated α4 and β7 transcription, similar results were obtained with protein synthesis inhibitors for α4 and β7 expression, suggesting that IL-7 only indirectly controlled β7 RNA translation (Supplemental Figure 19C). Because IL-7 did not regulate ITGA4 expression on mouse T cells (Supplemental Figure 14), we explored species-specific transcription factors. The transcription factor CREB is predicted to bind to the human but not the mouse ITGA4 gene promoter (Gene Transcription Regulation Database [GTRD]; http://gtrd.biouml.org). Previous genome-wide analysis of CREB occupancy and phosphorylation showed ITGA4 gene activation in human cells and tissues (62) but not in mouse (63). We found that a CREB/CBP association inhibitor prevented α4β7 overexpression in humans (Supplemental Figure 17B), while a CBP/P300 histone acetyltransferase inhibitor had no effect (Supplemental Figure 17C), implicating CREB in α4 expression. In addition, blocking the JAK/STAT pathway using JAK1/2, JAK3, or STAT5 inhibitors or the PI3K pathway with specific inhibitors prevented IL-7–induced α4β7 overexpression, demonstrating that it requires complete IL-7R signaling (Figure 5C). Finally, one potential advantage of IL-7Rα–targeted therapy is that it specifically spares Tregs over effector T cells (21), based on a high differential expression level (14, 15). We found that IL-7 was able to dose-dependently induce STAT5 phosphorylation in Tregs, in spite of the low expression level of its receptor on these cells, but did not induce α4β7 overexpression in contrast to its effect on effector T cells (Figure 5D). A pathogenic role of the IL-7Rα pathway in colon inflammation of humanized mice. Specific control of human effector T cell upregulation of α4β7 integrin expression via the IL-7/IL-7Rα axis suggests that a possible pathogenic role for the IL-7R pathway in human IBD was not previously appreciated in conventional rodent colitis models. To further explore the possible link between IL-7/IL-7Rα, α4β7 integrin expression, and IBD, we reconstituted NOD-scid IL-2Rγ–/– (NSG) immunodeficient mice with human peripheral blood mononuclear cells (PBMCs) from healthy donors. In this model, human T cells led to xenogenic graft-versus-host disease (GVHD) with significant infiltration of colon, small intestine, liver, and lung as previously described (64). We found in a suboptimal GVHD model induced by 10 × 106 human PBMCs that pretreatment of human PBMCs with human IL-7 upregulated α4β7 expression and led to a reduced colon length in recipient mice, a hallmark of colonic inflammation (Figure 6, A and B). This, however, did not accelerate the lethality of GVHD. Conversely, in accordance with the observation that mouse IL-7 could also induce α4β7 expression on human T cells (Supplemental Figure 15A) and the confirmation in the literature (65) and experimentally that human α4β7 integrin could interact with mouse MADCAM1 (Supplemental Figure 15C), in the severe GVHD model induced by 50 × 106 human PBMCs, administration of an antagonist anti–human IL-7Rα mAb significantly delayed GVHD development in NSG mice reconstituted with unmanipulated human PBMCs (Figure 6C). It also prevented colon retraction and histological lesions of colon GVHD (Figure 6D) as well as specifically reduced human T lymphocyte infiltration in the colon but not in other target tissues of GVHD (Figure 6, E and F). To determine whether anti–IL-7Rα therapy in this model also acts systemically, we performed a back-to-back comparison with the anti-α4β7 mAb vedolizumab (Entyvio, Millennium Pharmaceuticals). Surprisingly, we found that unlike the anti–IL-7Rα mAb, vedolizumab had no effect on GVHD and colon inflammation (Supplemental Figure 20), suggesting also a systemic action of IL-7 besides α4β7 upregulation in this humanized GVHD model. Figure 6 IL-7/IL-7Rα pathway controls human T cell–mediated colon inflammation. (A and B) Survival (A) and colon length (B) of immunodeficient NOD-scid IL-2Rγ–/– (NSG) mice reconstituted with 10 × 106 freshly purified human PBMCs from healthy donors (white squares; n = 11) or the same cells cultured 3 days with 5 ng/ml of recombinant human IL-7 (black circles; n = 13). Colon length was measured when mice had lost 20% of body weight. (C) Survival of NSG mice reconstituted with 50 × 106 freshly purified human PBMCs from healthy donors and treated 3 times per week for 4 weeks from day 0 with 5 mg/kg of a blocking anti–human IL-7Rα mAb (black squares; n = 19) or equivalent volume of excipient (vehicle; white circles; n = 14). (D) Colon length and colon histological GVHD score of the same NSG mice as in C that were sacrificed when they had lost 20% of their body weight or after 3 months without clinical signs of GVHD. (E) Representative images of human CD3+ T cell infiltration (green) in the colon of NSG mice treated with excipient or anti–IL-7Rα mAb. Blue staining represents nuclei. (F) Histological human T cell infiltration score in colon, intestine, liver, and lung tissues of NSG mice as in C. Each symbol represents 1 mouse; horizontal bars indicate the mean ± SEM. *P < 0.05; **P < 0.01. IL-7Rα blockade protects from colitis in humanized mice. We next sought to address whether the local and systemic effects of IL-7Rα blockade would be effective in a more relevant colitis model in humanized mice containing both innate and adaptive immune cells. We therefore used NSG mice reconstituted with hematopoietic CD34+ cord blood stem cells and induced colitis by intrarectal injection of the haptenating substance TNBS in ethanol. Ethanol is required to break the mucosal barrier, whereas TNBS is believed to haptenize colonic autologous and/or microbiota proteins, rendering them immunogenic to the host immune system (66). In this humanized mouse model, human T cell subsets (CD4+ and CD8+ naive, central memory, and effector memory T cells) as well as human ILC subsets (ILC1, ILC2, ILC3 NCR+, and ILC3 NCR–) located in the spleen expressed membrane IL-7Rα, except CD4+CD25+ T cells, since, as anticipated, this last subset is enriched in Tregs expressing low levels of IL-7Rα (Supplemental Figure 21). While ILCs were undetectable in colon mucosa from humanized mice, we found that mucosal human T cells expressed a high level of IL-7Rα as compared with peripheral human T cells from the same humanized mice (Supplemental Figure 22). While the immunodeficient NSG mice dramatically succumbed to TNBS/ethanol injection, the humanized mice were partially protected, but developed acute signs of colitis including diarrhea and delayed weight recovery (Figure 7, A and B), in accordance with a dual protective and deleterious role for immune cells in gut homeostasis and inflammation (67). Similarly to vedolizumab, administration of anti–human IL-7Rα mAbs from day 0 was already effective from day 3 after injection in this acute humanized colitis model, since mice started to recover weight and presented significantly less diarrhea (Figure 7, A and B). Although it did not reach significance because of the limited number of humanized mice analyzed and interindividual variability, we observed that intestinal epithelial barrier homeostasis returned to basal levels with either therapy, as measured by the paracellular and transcellular intestinal permeability (Figure 7C) and the significant reduction of histological inflammatory score (Figure 7D) 1 week after treatment. Figure 7 IL-7Rα blockade efficiency in vivo in humanized acute TNBS colitis. (A and B) Weight variation (mean ± SEM) (A) and colitis score (mean ± SEM) (B) of NSG mice previously reconstituted with 50 × 103 human cord blood CD34+ hematopoietic stem cells and challenged several months later with intrarectal administration of 5 mg of 2,4,6-trinitrobenzenesulfonic acid (TNBS) reconstituted in 50% ethanol. Mice were treated intraperitoneally 3 times a week from day 0 with control vehicle (white circles; n = 14), 5 mg/kg of blocking anti–human IL-7Rα mAb (black squares; n = 16), or blocking anti–human α4β7 (vedolizumab) mAb (gray triangles; n = 6). (C) Paracellular and transcellular intestinal permeability (mean ± SEM) measured in vivo in NSG mice as in A after oral administration of sulfonic acid–FITC (SAF) and horseradish peroxidase (HRP) performed at day 0 and 1 week after TNBS/ethanol injection, and measured in sera 2 hours after oral administration. Results were normalized for each mouse to day 0. (D) Left: Representative colon hematoxylin-eosin-safranin staining (top) and cyan blue coloration (bottom) for each group 1 week after TNBS injection. Right: Histological and inflammatory mucosal score quantification. Scale bar: 250 μm. *P < 0.05 between indicated groups, Kruskal-Wallis test with post hoc Dunn’s multiple comparisons test. Finally, we explored the use of blocking anti–human IL-7Rα mAbs in vivo in a treatment model using immunodeficient NSG mice previously reconstituted with a low number (2.5 × 10⁶) of human PBMCs and receiving a chronic cycle of dextran sulfate sodium (DSS; 1% in drinking water). Humanized mice received vehicle or 5 mg/kg anti–IL-7Rα mAbs at the initiation of the second cycle of DSS and until the end of the protocol. No colitis stool score difference was observed between vehicle and anti–IL-7Rα–treated mice before treatment, whereas after treatment initiation mice treated with anti–IL-7Rα mAbs displayed significantly lower signs of diarrhea and mucosal histological lesions as compared with control mice in response to the iterative chronic cycle of DSS (Supplemental Figure 23). IL-7Rα mAb alters mucosal effector T cells in UC biopsies cultured ex vivo. To evaluate the local protective effect of the anti–IL-7Rα antagonist, we used fresh mucosal biopsies from UC patients as an ex vivo inflammatory model of human IBD as previously described (68). Anti–human IL-7Rα mAb (10 μg/ml) or isotype control (10 μg/ml) was added to organ-cultured samples from 10 patients with UC (Supplemental Table 2). After 24 hours of culture, supernatants were analyzed by ELISA, and 6 pairs of biopsies were processed for NanoString transcriptional technology analysis using a panel of 255 human genes related to inflammation. Transcriptomic analysis first showed that samples clustered by donor origin and not by treatment conditions, confirming high interindividual variability in these biopsies (Supplemental Figure 24). Nevertheless, using the NanoString immune cell signature, the analysis revealed that the relative fraction of T cells tended to decrease in the anti–IL-7R condition (not significantly) without impacting Tregs (Figure 8A). Hence, the relative frequency of Tregs among total T cells or effector CD8+ T cells significantly increased in the anti–IL-7R condition. We also observed a significant increase of the exhaustion signature within CD8+ T cells, in particular due to the overexpression of PD-1 and TIM-3 as compared with isotype control (Figure 8B). Finally, in accordance with the result on effector T cell exhaustion, we found that anti–IL-7R significantly inhibited IFN-γ secretion in the supernatant (Figure 8C). Altogether, this analysis showed that anti–IL-7Rα mAb acts locally and rapidly in UC colon samples grown ex vivo and alters effector T cells while tipping the immune balance toward regulatory T cells. Figure 8 IL-7Rα blockade efficiency ex vivo in human UC organ cultures. (A) Immune cell signature enrichment scores and CD8+ T cell exhaustion signature using NanoString transcriptional analysis of inflamed colon fragments from UC patients (n = 6). Samples from each patient were cultured ex vivo at 37°C for 24 hours in medium with 10 μg/ml of control IgG mAb or blocking anti–human IL-7Rα mAb. (B) Individual expression of exhaustion molecules in anti–IL-7Rα–treated conditions normalized to isotype control. (C) IFN-γ cytokine concentration measured by ELISA in the supernatant of UC (n = 10) inflamed colon fragments in the same assay. Each pair of symbols represents samples from the same patient. *P < 0.05; **P < 0.01, Mann-Whitney U test. TILs, tumor-infiltrating lymphocytes. Discussion Since IBD is characterized by chronic inflammation, most targeted therapies are directed to dampen downstream effectors of dysregulated immune responses (i.e., inflammatory cytokines). However, these strategies are not particularly effective in a substantial proportion of patients, and significant rates of acquired resistance are observed. The identification of alternative therapeutic approaches targeting more upstream mechanisms is desired to prevent relapse and maintain patients under long-term remission. Our study elucidates a previously unknown dysregulated pathway in human IBD, whereby IL-7R signaling specifically regulates human effector but not regulatory T cell homing to the gut through a species-specific control of α4 and β7 integrin expression. Importantly, while an association of IL-7 and colitis has been consistently described in rodents, in humans this pathway has not been studied in IBD tissues, and its impact on anti-TNF responsiveness has not previously been evaluated. Excepting a meta-analysis reporting 29 additional UC risk loci including the IL7R gene (39), only one study has reported an association between the IL-7 pathway and severe IBD, whereby the transcriptional profile of circulating T cells correlated with the clinical course in UC and CD (40). Our analysis of 7 transcriptional data sets of mucosal biopsies from UC and CD patients, and validation with local cohorts by RT-qPCR quantification and protein detection by immunohistochemistry, revealed that the IL-7R signaling signature is reproducibly altered in colon mucosa of active diseases and clearly discriminates the disease status from inactive states or non-IBD controls. This is not the case for mucosal ileal biopsies, suggesting a specific association of the IL-7/IL-7R pathway with colonic IBD inflammation. Furthermore, several components of the entire pathway were found to be reproducibly associated and overexpressed, suggesting a potential biologically active pathway specifically located in diseased tissues. Our study revealed that key players of the IL-7R signaling signature and, notably, individual expression of IL7R at baseline are reproducibly and strongly associated with a considerable risk of resistance to anti-TNF in 3 different cohorts of UC and 1 cohort of CD. Association of the IL-7R pathway with resistance to anti-α4β7 therapy has also been observed, although it remains to be confirmed since only 1 cohort has been available so far. In an additional UC cohort (43), the IL-7R signature was elevated in nonresponder patients after anti-TNF therapy, and IL7R was significantly associated with nonresponse to anti-TNF treatment, but with substantially elevated IL7R seen only in primary nonresponders at baseline (Figure 1, G–I). It should be noted that for previous cohorts, an anti-TNF or anti-α4β7 response was defined by complete endoscopic and histological mucosal healing, while in this different cohort the definition of responsiveness was less robust since it was based only on reduction of the clinical Mayo score and rectal bleeding subscore (43). Our data also highlight potentially useful biomarkers of colon inflammation capable of discriminating patients who will achieve full remission from those who will be completely nonresponsive following therapy. Colon fibrosis has also been associated with stenosis and high need of surgery in CD patients treated with anti-TNF (69), and nonresponse to anti-TNF has recently been associated with higher fibronectin and collagen deposition in comparison with responder patients (70). Even if it is impossible to formally rule out the presence of significant fibrosis based on the available data concerning the patients included in the meta-analysis and the meta-cohort, the predominance of UC patients makes it unlikely since fibrosis in UC is much less common and benign stenosis is rarely detected. A recently published observation concerning the oncostatin M (OSM) pathway, where 64 candidate cytokines have been profiled, also includes IL7, which was not discriminant among the top cytokines differentially expressed in IBD biopsies (48). While we found significantly increased IL7 cytokine expression by RT-qPCR in our local cohort, IL7 cytokine expression assessed in previous studies was found to be significantly increased in only 2 of 7 data sets. In response to commensal microflora invasion, gut epithelial cells were shown to produce IL-7 (23, 71, 72) and to regulate the proliferation of intestinal mucosal lymphocytes (38) as well as production of inflammatory cytokines by human ILC3s also expressing IL-7R (73). Thus, it is conceivable that high IL7 expression in the colon is more related to bacterial tissue invasion, while our results reproducibly show an IL7R and IL-7R signaling signature accumulation that is associated with clinical IBD status and nonresponsiveness to anti-TNF therapy. Systemic IL-7 is known for its deleterious role in chronic colitis in rodents (74, 75). In this study we have unraveled an important species difference, whereby IL-7 imprints gut-homing specificity on T cells in humans by upregulating α4β7 integrin expression, a phenomenon not observed in rodents. We show that this is due to the recruitment of CREB to the ITGA4 promoter in humans but not in mice. Other major integrin or chemokine receptors implicated in T cell homing to tissues were not modified, suggesting a specific control of T cell entry in the gut in humans in response to IL-7 consumption. Confirming this IL-7 mechanism of action, human CD127+ T lymphocytes analyzed by CyTOF in the inflamed lamina propria of colon UC patients predominantly expressed also the mucosal integrin β7. Besides IL-7, to our knowledge only retinoic acid has been previously described to control α4β7 integrin expression (76). Interestingly, similar to our results for IL-7, retinoic acids control both α4 and β7 protein expression by directly controlling α4, but not β7, gene transcription (77). Retinoic acids control both effector and Treg α4β7 integrin expression (78). We found that in spite of the low expression of IL-7Rα, IL-7 still induced signaling in Tregs, however without modulating α4 and β7 expression. This suggested that IL-7 selectively imprints effector, but not regulatory, T lymphocyte migration to the gut. These results confirm data by Fischer et al., who studied integrin and chemokine receptor expression on effector and regulatory T cells from UC patients (65). In particular, this study demonstrated that an anti-α4β7 mAb (vedolizumab) impairs gut homing of both human effector and regulatory T cells in humanized mice, and confirmed recent observations that colitis is exacerbated in β7-knockout mice as a result of deletion of the colonic Treg population (79). Finally, we confirmed a deleterious role for IL-7 in gut inflammation mediated by human immune cells using different in vivo humanized mouse models and ex vivo punch colon biopsy cultures from UC patients. Human T lymphocytes overexpressing α4β7 after incubation with IL-7 induced colonic inflammation when transferred into immunodeficient mice. Blocking IL-7Rα with an antagonistic mAb delayed human T lymphocyte–mediated GVHD, with a prolonged action specifically in the colon. In contrast, blocking α4β7 using vedolizumab, which presumably acts locally but not systemically, did not protect from chronic xenogeneic GVHD. Otherwise, anti–IL-7Rα therapy demonstrated in vivo efficacy in restoring gut homeostasis in an acute and chronic colitis humanized mouse model reconstituted with hematopoietic stem cells or peripheral human leukocytes and challenged by intrarectal ethanol/TNBS to induce acute colonic inflammation or receiving a chronic cycle of DSS to induce chronic colon inflammation. Although IL-7R blockade shares some mechanism of action with anti-α4β7 on colon mucosa human T cell migration, these humanized inflammatory models also showed that anti–IL-7R has a broader impact, potentially through systemic mechanisms on chronic inflammation. While targeting a cytokine pathway known for its activity on T cell homeostasis, we were surprised by the rapid action of IL-7Rα blockade in the acute colitis humanized model. We therefore applied anti–IL-7Rα mAb on surgical specimens of mucosal intestine from UC patients cultured ex vivo. We found that anti–IL-7Rα mAb significantly inhibited IFN-γ production in the culture supernatant within 24 hours, which definitively demonstrated that the anti–IL-7Rα therapy is efficient locally and rapidly on gut mucosal inflammation. Transcriptional analysis revealed that anti–IL-7Rα mAb alters mucosal effector T lymphocytes while respecting regulatory T cells and hence tips the balance toward immune regulation. It showed also that IL-7Rα blockade seems to induce a transcriptional program of T cell exhaustion (e.g., PD-1 and TIM-3 expression), which could also explain the inhibition of IFN-γ secretion. Close linkage between IL-7 and IFN-γ secretion has been previously proposed, since IL-7 production by human intestinal epithelial cells in response to Citrobacter rodentium was described to be dependent on IFN-γ (71) and others demonstrated that IFN-γ directly enhanced IL7 mRNA expression in intestinal epithelial cells (80). Finally, Shalapour et al. (23) suggested a feedback loop in which commensal bacteria drive IFN-γ production by lymphocytes, which in turn promotes epithelial cell IL-7 production and IL-7–dependent local survival of lymphocytes. IL7R expression correlated also with OSM/OSMR gene expression in colon biopsies of UC patients before anti-TNF therapy. It remains to be explored whether blocking IL-7R or OSM pathways would be active or induce similar clinical responses in the same subgroup of patients. It was previously described that OSM and other members of the IL-6 family could induce IL-7 secretion by fibroblasts (81) and hence could increase proliferation of T lymphocytes. Altogether, local production of IL-7 by stromal, myeloid, and/or epithelial cells in response to danger or stress signals might amplify the dysregulated Teff/Treg balance by increasing the expansion of effector T lymphocytes, which in turn secrete more IFN-γ, initiating an inflammatory feedback loop. Human infants with IL-7Rα mutations have severe T cell lymphopenia necessitating bone marrow transplantation (82). In contrast to most studies performed in rodent models where IL-7R blockade also induces broad lymphodepletion (21), administration of high doses of anti–IL-7Rα antagonistic mAb in baboons (83), cynomolgus monkey (84), or marmosets (85) did not induce lymphopenia or a significant decrease in peripheral T lymphocyte numbers. Similarly, early clinical results from phase I trials with 2 different antagonist anti–IL-7Rα mAbs, in healthy volunteers (GSK2618960; NCT02293161, ClinicalTrials.gov) or in type 1 diabetic adult patients (PF-06342674; NCT02038764), did not demonstrate induction of lymphopenia (86). No information in the IBD population is available so far. Altogether these observations confirm that IL-7 biology in mice significantly differs from that in humans, but the long-term impact of IL-7R blockade on the human peripheral T cell pool will have to be closely examined. Our results indicate that the IL-7R pathway is locally dysregulated in the colon of severe IBD patients and may contribute to the maintenance of chronic inflammation. More importantly, our study identified that a high colonic IL-7R signaling gene signature, particularly IL7R, is reproducibly and strongly associated with the absence of response to anti-TNF and presumably also to anti-α4β7 therapies both in UC and CD patients before initiation of the therapy, constituting potentially a new predictive biomarker to identify these refractory patients. Finally, we have unraveled human-specific IL-7 control of gut α4β7 integrin expression and confirmed in preclinical in vivo animal and ex vivo human models the therapeutic potential of IL-7Rα blockade. Altogether, our findings suggest that anti–IL-7Rα therapy may offer a novel therapeutic opportunity to prevent relapse and reinstate immune tolerance in IBD patients. Methods Data sets and anti-TNF or anti-α4β7 response criteria. Gene expression data sets were obtained from the Gene Expression Omnibus database (http://www.ncbi.nlm.nih.gov/geo/): GSE38713 (41) and GSE59071 (42) for colon biopsies from UC patients after treatment with immunosuppressants and/or corticosteroids; GSE57945 (44) for ileal biopsies from pediatric healthy controls and patients with newly diagnosed and untreated ileal CD, colonic CD, or UC; GSE16879 (46) for colon biopsies from UC patients as well as colon and ileal biopsies from CD patients before and 4–6 weeks after treatment with anti-TNF (infliximab); GSE12251 (45) for colon biopsies of UC patients before anti-TNF (infliximab) therapy; GSE23597 (43) for colon biopsies from UC patients before and 8 weeks and 30 weeks after anti-TNF (infliximab) therapy; and GSE73661 (47) for colon biopsies from UC patients before and 4–6 weeks after treatment with anti-TNF (infliximab) as well as UC patients before and 6 weeks and 52 weeks after treatment with anti-α4β7 (vedolizumab). Patient characteristics as well as criteria and definition for determining primary responsiveness to anti-TNF or anti-α4β7 therapy are described in Supplemental Methods. Briefly, patients with active IBD refractory to corticosteroids and/or immunosuppression underwent biopsy collection within a week before anti-TNF or anti-α4β7 therapy and at early (week 4–8) or late (week 30 or 52) time points after the first infusion. In all cohorts except GSE23597 (43), anti-TNF or anti-α4β7 response was defined by complete histological and endoscopic healing. In GSE23597 (43), anti-TNF response was defined by a decrease from baseline of the total Mayo score of at least 3 points and 30% with an accompanying decrease of the bleeding subscore of at least 1 point and an absolute bleeding subscore of 0 or 1. This cohort of UC patients treated with anti-TNF was not included in our meta-analysis. Ex vivo human colon culture model. Human colon tissues were collected during endoscopy or during routine surgery. Biopsies or small mucosal fragments were cut (3-mm2 pieces) from resected intestinal tissue collected from macroscopically and microscopically inflamed areas of intestine from patients with either CD or UC. For UC patients, 6 patients gave biopsies and 4 gave resected bowel. For CD, 3 patients gave biopsies and 7 gave resected bowel. When mucosal resection tissue was used, small biopsy-size fragments were cut using scissors. Biopsies or biopsy-sized fragments were placed (1 biopsy per well) in 24-well plates in 300 μl serum-free HL-1 medium (Lonza Bioscience) supplemented with l-glutamine, 100 U/ml penicillin, 100 μg/ml streptomycin, and 50 μg/ml gentamycin (Sigma-Aldrich). Mucosal explants were incubated for 24 hours at 37°C and 5% CO2. The anti–human CD127 mAb (clone N13B2, OSE Immunotherapeutics) or IgG control was added at 10 μg/ml into the medium at the beginning of incubation time. Supernatants were collected after 24 hours of culture and stored at –70°C. Cytokine production in biopsy supernatants was measured by ELISA. Human recombinant IL-8 (DY208) DuoSet ELISA kit (R&D Systems) and human IFN-γ (31673539, ImmunoTools) were used according to the manufacturer’s instructions. Animals. NOD.Cg-Prkdcscid Il2rgtm1Wjl/SzJ (NOD-scid IL2Rγ-null [NSG]) immunodeficient mice were initially obtained from The Jackson Laboratory and then bred in the Humanized Rodent Platform of LabEx IGO (University of Nantes). All animals were housed under specific pathogen–free conditions, according to institutional guidelines. Humanized GVHD model. Seven- to ten-week old NSG mice were sublethally irradiated
|
|
Scooped by
Gilbert C FAURE
March 7, 2019 3:00 AM
|
PubMed ID: 29716793 Allaire JM, Crowley SM, Law HT, Chang SY, Ko HJ, Vallance BA Trends Immunol. Sep 2018 COMMENT: The intestinal mucosa, a single layer of cells, interacts with and, at the same time, is a barrier to luminal microbiota. The communication between microbes and intestinal epithelial cells (IECs) and how these cells interacts with the immune system is a crucial matter and the main topic of this review. This review illustrates the cellular and functional complexity of the intestinal mucosa: Various differentiated cell types are found within the gut epithelium, and each carries out unique and specialized functions. The distribution of these cell types is also different between the small and large bowel These cell types include: enterocytes, the most prominent cell type of the intestinal epithelium that is responsible for nutrient and water absorption, various secretory cells such as goblet cells that secrete mucins, enteroendocrine cells that secrete hormones, and Paneth cells that release antimicrobial factors to protect nearby stem cells at the base of small intestinal crypts. Finally, there are the chemosensory tuft cells which play a key role in defense against helminths, and M cells that are integral to the uptake and eventual presentation of luminal antigens to the immune system Regarding the well known and close relationship between microbiome and Intestinal mucosa, the authors indicate: The intestinal mucosa of germ- free mice is very thin, displaying reduced IEC proliferation as well as impaired production of mucins and other IEC-derived mediators. This thinning of the protective mucin layer makes germ-free mice highly susceptible to the direct toxic effects of the colitogenic agent dextran sodium sulfate (DSS), reinforcing the importance of gut microbes in promoting intestinal tissue protection and repair It seems that the presence of continous antigenic stimulus at the mucosa is an important factor to maintain a normal mucosa and that this depends on an intact innate MyD88 signalling pathway. Another important factor is the metabolic products of microbiota: Obligate anaerobes such as Clostridium clusters IV and IXa, Faecalibacterium prausnitzii, and Bacteroides thetaiotaomicron produce the majority of butyrate, a short-chain fatty acid (SCFA) that is found in the lumen of the colon and is mostly converted through fermentation of dietary fiber Luminal butyrate is largely consumed by differentiated colonocytes residing at the top of the crypts. The architecture of the intestinal crypt shields the stem cells located at the crypt base from this metabolite. Disruption/damage of the crypt architecture (as occurs in DSS colitis) exposes stem cells to higher butyrate levels, which in turn suppresses their proliferative capacity by inhibiting histone deacetylase (HDAC) enzymes and inducing transcription factor Forkhead box O3 (FoxO3) Other microbial metabolites have been found to modulate IEC function. Lactate is an important energy source for small intestinal stem cells to sustain their proliferation and differentiation capacity. Acetate, an SCFA produced by Bifidobacterium, has also been shown to influence goblet cell differentiation. The presence of acetate-producing microbes as well as acetate itself increased goblet cell secretion of mucin, and also promoted the terminal decoration of mucin glycans with sialic acid, whereas the presence of an acetate-consumer (Fecalibacterium) reduced these effects. Germ-free mice, which lack these bacterial metabolites, displayed shorter Muc2 O-glycans, and this correlated with a decrease in the expression of their respective glycosyltransferase enzymes by IECs In summary: Bacterial metabolites within the intestinal environment are important in maintaining normal IEC physiology in the small intestine as well as in the colon. Crosstalk between the microbiota and IECs developed as a means to prevent IEC dysfunction, and recent studies have shown that disruption of this crosstalk can also lead to aberrant changes in the resident microbial populations, termed ‘dysbiosis’. There is substantial evidence that the resident intestinal microbiota works in concert with colonocytes to prevent enteric microbial dysbiosis such as that observed in IBD patients Butyrate is an important metabolic factor modulating intestinal immune cells functions: Butyrate can also epigenetically regulate gene expression through the inhibition of histone deacetylases. This appears to be the mode of action for the modulating influence of commensal microbiota on peripheral regulatory T cell (Treg) differentiation. In butyrate-treated naïve CD4+ T cells has been reported an increased histone H3 acetylation of Foxp3 at its promoter region and at the intronic enhancer ‘intragenic enhancer elements conserved noncoding DNA sequence 1’ (CNS1) and CNS3 . This increased acetylation of Foxp3 resulted in increased gene expression. CNS1-deficient mice were unresponsive to the pres- ence of butyrate and did not induce FOXP3 expression in naïve CD4+ T cells Overall, butyrate influences the balance between intestinal pro- and anti-inflammatory mechanisms Colonization resistance is an important feature of a healthy microbiome: Invading microbes must compete for limited space and nutrients against entrenched microbiota–host symbiotic relationships as well as resist against potent antimicrobial molecules produced by some resident gut microbes. For example, Bacteroides thuringiensis, a bacterium found in human feces, produces a narrow-spectrum bacteriocin that is highly potent against the nosocomial pathogen Clostridium difficile. This bacteriocin, named thucin CD, is a two-component antimicrobial that acts synergistically to disrupt the cell membrane of its target Innate Immune System molecules and IECs: Situated at the interface between the luminal microbiota and the underlying immune system, the intestinal epithelium plays a crucial role in the detection of microbes under homeostatic as well as pathologic conditions. IECs express a variety of innate receptors that detect microbes and endogenous danger signals, including the TLRs Enterocytes are known to express TLR2, TLR3, TLR4, TLR5, and TLR9 The polarized nature of IECs facilitates the anatomical distribution of TLRs, segregating the majority to the basolateral membrane, while TLR2 and TLR9 are also expressed at the apical surface Once activated at the basolateral membrane, TLR signaling initiates a signaling cascade cumulating in the nuclear translocation of NF-kB. This leads to the expression and secretion of various cytokines and chemokines, including TNF-a, IL-6, IL-8, IL-18, and CCL20, which signal and prime underlying immune cells By contrast, apical stimulation of TLR9 results in a net immune inhibitory effect through the stabilization of IkB, demonstrating the unique ability of IECs to differentially respond to microbial signals using the same receptors but at varying spatiotemporal positions TLRs expressed by IECs play a key role in recognizing nearby microbes and their products, the responses they elicit are primarily aimed at keeping microbes at a distance (mucin secretion and antimicrobial production) or recruiting immune cells (via chemokines) to the site of infection. Upon direct invasion of IECs by intracellular pathogens, a more vigorous means of host defense is triggered, by which enterocytes can physically expel themselves from the intestinal epithelial lining while still maintaining mucosal barrier function. This process prevents intracellular pathogens from breaching the epithelial barrier, and instead they are extruded into the fecal stream, along with the sloughed enterocyte. This expulsion is independent from the homeostatic process of continuous enterocyte renewal. and instead involves activation of the inflammatory caspases (caspase-1, -4, and -11) as well as caspase-8 Not only enterocytes and colonocytes but also enterochromaffin cells make a crosstalk with microbiota: Some members of the intestinal microbiota, particularly spore-forming Clostridia spp., can stimulate colonic entero- chromaffin cells to upregulate their production of the neurotransmitter 5-HT In the context of an enteric infection, a limited number of studies suggest that production of 5-HT can aid in preventing incursion by microbial (S. Typhimurium) and helminthic (Trichuris muris) pathogens, possibly through the modulation of enterocyte function (such as antimicrobial peptide secretion and IL-13 receptor a1 signaling). Recent findings revealed that L cells, another type of enteroendocrine cell, can secrete glucagon-like peptide (GLP) 1 in a TLR4-dependent manner upon exposure to bacteria-derived LPS during gut injury or chemical-induced colitis in mice And also Paneth cells with a potential very interesting relationship with Crohn’s disease: Paneth cells, found specifically in the small intestine, have received the most attention based on their specialized role in secreting large granules filled with antimicrobial peptides and enzymes such as a-defensins, RegIIIg, sPLA2, and lysozyme. The baseline release of these antimicrobials is thought to promote normal microbial composition within the intestinal lumen. This theory is based on recent studies linking the presence of structurally and functionally abnormal Paneth cells in Crohn’s disease (CD) patients to the development of microbial dysbiosis within the ileum. Significant reductions in barrier promoting microbes such as Faecalibacterium prausnitzii were also observed, emphasizing the crucial role played by Paneth cells in regulating intestinal microbial homeostasis. In this regard, single-nucleotide polymorphisms (SNPs) in several IBD-associated genes such as NOD2, XBP1, ATG16L1, and IRGM have been linked to Paneth cell dysfunction in IBD patients. These Paneth cell abnormalities include structurally irregular granules as well as impaired autophagic secretory pathways and failure in autophagy-based removal of damaged organelles. Two different hypomorphic Atg16l mouse models suggest that ATG16L1 controls the shape and distribution of Paneth cell granules as well as their production of lysozyme. Interestingly, biopsies of CD patients possessing the relevant ATG16L1 polymorphisms, but with quiescent disease, show an increased incidence of intestinal colonization by the microbial pathobiont adherent-invasive Escherichia coli (AIEC). This suggests that defects in autophagy, presumably within Paneth cells, may increase the susceptibility of CD patients to colonization or infection by specific microbes such as AIEC, and potentially predispose the patients to disease progression that requires intestinal surgery Although innate signaling plays an important role in the function of Paneth cells, presumably there are other pathways involved in controlling their ability to release their secretory granules, such as would occur in response to an infection of the small intestine. Interestingly, both in vivo and in vitro studies have demonstrated that exposure to IFN-g causes rapid and complete degranulation of Paneth cells, accompanied by their luminal extrusion and apoptosis And Globet cells: Intestinal goblet cells are best known for their production and secretion of the glycosylated mucin protein Muc2 which forms the protective mucus barrier atop the intestinal epithelium. In its absence, Muc2�-/-� mice suffer exaggerated bacterial contact with their colonic epithelium, provoking inflammatory responses that eventually develop into spontaneous colitis. While Muc2 is normally released at a baseline level, in response to noxious luminal stimuli goblet cells undergo compound exocytosis, thereby releasing all of their mucin granules and other contents into the lumen to protect the epithelial barrier from direct contact with these threats. Intestinal goblet cells exposed to bacterial products or cytokines such IL-22 and IFN-g undergo this compound exocytosis IECs communicate with the Immune System: Early in the 1990s enterocytes were found to secrete an array of chemokines and cytokines, particularly in response to direct contact with bacteria or their products. Many of these secreted molecules are known to recruit and/or activate neutrophils, macrophages, dendritic cells, and T cells. The ability of enterocytes, and presumably other IEC types, to direct these cells and the local immune response is thought to be key to the resolution of infections that have crossed the gut barriers, as well as to the promotion mucosal repair following intestinal damage. Tuft cells: Renewed interest in tuft cells has been prompted recently owing to their newly discovered roles in detecting helminth parasites and as drivers of ILC2 expansion. Luminal helminths such as T. muris can be sensed by tuft cells through their GTP-binding protein a-gustducin that activates the non-selective cation channel transient receptor potential melastatin-like subtype 5 channel (Trpm5). Interestingly, in the oral cavity Trpm5 is responsible for the transduction of bitter, sweet, and umami tastes, and when colonic tuft cells are subjected to the bitter substrate denatonium this correlated with a sharp increase in intracellular calcium. This may denote chemosensors as a new class of pathogen recognition receptors if tuft cells are truly responding to chemicals secreted by invading parasites. Tuft cells constitutively secrete IL-25 to maintain ILC2 homeostasis, but upon recognizing helminths they increased their secretion of IL-25, which directly acts on ILC2 cells to release IL-13 This in turns feeds forward, with IL- 13 acting on epithelial progenitors in an IL-13Ra1/IL-4aR-dependent manner to promote tuft cell and goblet cell hyperplasia, cumulating in a dramatic increase in bulk mucin release that drives the expulsion of the parasite from the intestinal tract In summary, this review highlights the importance and complexity of IECs for the microbiome, defense against pathogens and local modulation of the Immune System Contributor Eduardo Pareja
|
|
Suggested by
Société Francaise d'Immunologie
January 30, 2019 1:08 PM
|
Martínez-López et al. explore host signaling pathways linking recognition of commensal
microbes and Th17 differentiation. They find that the Mincle-Syk axis in Peyer’s patch DCs detects mucosal-resident bacteria, inducing IL-6 and IL-23p19 and stimulating IL-17 and IL-22 production by intestinal...
|