Your new post is loading...

|
Suggested by
Société Francaise d'Immunologie
April 20, 2019 3:02 AM
|
Epithelial regeneration is essential for homeostasis and repair of the mucosal barrier.
In the context of infectious and immune-mediated intestinal disease, interleukin (IL)
22 is thought to augment these processes.

|
Scooped by
Gilbert C FAURE
April 18, 2019 3:02 AM
|
The National Institutes of Health (NIH) is the primary federal government agency for biomedical research in the USA. NIH provides extensive support for human microbiome research with 21 of 27 NIH Institutes and Centers (ICs) currently funding this area through their extramural research programs. This analysis of the NIH extramural portfolio in human microbiome research briefly reviews the early history of this field at NIH, summarizes the program objectives and the resources developed in the recently completed 10-year (fiscal years 2007–2016) $215 M Human Microbiome Project (HMP) program, evaluates the scope and range of the $728 M NIH investment in extramural human microbiome research activities outside of the HMP over fiscal years 2012–2016, and highlights some specific areas of research which emerged from this investment. This analysis closes with a few comments on the technical needs and knowledge gaps which remain for this field to be able to advance over the next decade and for the outcomes of this research to be able to progress to microbiome-based interventions for treating disease and supporting health.
|
|
Scooped by
Gilbert C FAURE
April 14, 2019 1:07 AM
|
Maarten Coorens, Anna Rao, Stefanie Katharina Gräfe, Daniel Unelius, Ulrik Lindforss, Birgitta Agerberth, Jenny Mjösberg, Peter Bergman...

|
Suggested by
LIGHTING
April 9, 2019 2:13 PM
|
Arch Immunol Ther Exp (Warsz). 2018 Dec;66(6):415-421. doi: 10.1007/s00005-018-0519-5. Epub 2018 Aug 29. Review
|
|
Scooped by
Gilbert C FAURE
April 8, 2019 2:28 AM
|
World J Gastroenterol. 2019 Feb 7;25(5):584-599. doi: 10.3748/wjg.v25.i5.584.
|
|
Suggested by
Société Francaise d'Immunologie
April 8, 2019 2:18 AM
|
J Biol Regul Homeost Agents. 2019 Apr 3;33(2).[Epub ahead of print] Editorial...
|
|
Scooped by
Gilbert C FAURE
April 6, 2019 3:00 PM
|
Therapeutic antibodies are increasingly being used in the clinic for the treatment of various diseases. Yet, oral to gut targeting of antibodies remains a challenge due to their incapability to survive digestion and reach gastrointestinal tissues.
|
|
Suggested by
Société Francaise d'Immunologie
April 5, 2019 2:08 PM
|
|
|
Scooped by
Gilbert C FAURE
April 4, 2019 2:58 AM
|
A microbiota- and IL-1β-dependent axis of IL-2 production by group-3 innate lymphoid cells is shown in a mouse model to be necessary to maintain immunological homeostasis and regulatory T cells in the small intestine.
|
|
Suggested by
Société Francaise d'Immunologie
April 2, 2019 1:42 PM
|
Control of macrophage activation in the lungs is essential for the prevention of tissue damage. MacDonald and colleagues show that alveolar macrophages have impaired glycolysis and are hyporesponsive during type 2 inflammation in a manner controlled by the lung environment.
|
|
Scooped by
Gilbert C FAURE
April 1, 2019 1:07 PM
|
|
|
Suggested by
Société Francaise d'Immunologie
March 30, 2019 1:18 PM
|
Cells in the gut sense commensal microbes through receptors that trigger the production of inflammatory molecules and the activation of the immune system.
|
|
Scooped by
Gilbert C FAURE
March 29, 2019 3:24 PM
|
Complex microbial communities shape the dynamics of various environments. In this Review, Knight and colleagues discuss the best practices for performing a microbiome study, including experimental design, choice of molecular analysis technology, methods for data analysis and the integration of multiple omics data sets.
|
|
|
Suggested by
Société Francaise d'Immunologie
April 20, 2019 3:01 AM
|
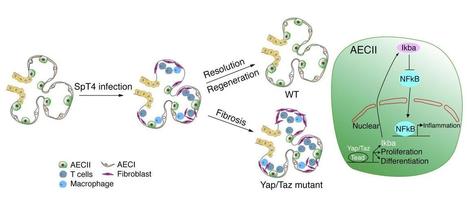
Research ArticlePulmonologyStem cells Free access | 10.1172/JCI125014 Yap/Taz regulate alveolar regeneration and resolution of lung inflammation Ryan LaCanna,1 Daniela Liccardo,1 Peggy Zhang,1 Lauren Tragesser,1 Yan Wang,2 Tongtong Cao,1 Harold A. Chapman,3 Edward E. Morrisey,4 Hao Shen,2 Walter J. Koch,1 Beata Kosmider,5 Marla R. Wolfson,5 and Ying Tian1 First published April 15, 2019 - More info Abstract Alveolar epithelium plays a pivotal role in protecting the lungs from inhaled infectious agents. Therefore, the regenerative capacity of the alveolar epithelium is critical for recovery from these insults in order to rebuild the epithelial barrier and restore pulmonary functions. Here, we show that sublethal infection of mice with Streptococcus pneumoniae, the most common pathogen of community-acquired pneumonia, led to exclusive damage in lung alveoli, followed by alveolar epithelial regeneration and resolution of lung inflammation. We show that surfactant protein C–expressing (SPC-expressing) alveolar epithelial type II cells (AECIIs) underwent proliferation and differentiation after infection, which contributed to the newly formed alveolar epithelium. This increase in AECII activities was correlated with increased nuclear expression of Yap and Taz, the mediators of the Hippo pathway. Mice that lacked Yap/Taz in AECIIs exhibited prolonged inflammatory responses in the lung and were delayed in alveolar epithelial regeneration during bacterial pneumonia. This impaired alveolar epithelial regeneration was paralleled by a failure to upregulate IκBa, the molecule that terminates NF-κB–mediated inflammatory responses. These results demonstrate that signals governing resolution of lung inflammation were altered in Yap/Taz mutant mice, which prevented the development of a proper regenerative niche, delaying repair and regeneration of alveolar epithelium during bacterial pneumonia. Graphical Abstract Introduction Bacterial pneumonia is a leading cause of mortality and morbidity worldwide. Despite effective antibiotics and vaccines, there is still substantial pulmonary morbidity in susceptible individuals (1). Infection by Streptococcus pneumoniae (the pneumococcus), the most common pathogen of community-acquired pneumonia, is characterized by acute elevation of bacterial number in the lung, diffuse alveolar epithelial damage, and a robust alveolar influx of leukocytes (2). While the virulence of the pneumococcus and host factors that contribute to bacterial pneumonia are becoming clear, up to now, little has been known about the types of damaged lung cells induced by bacterial pneumonia and the extent of lung regeneration following injury. Models of lung damage in mice have demonstrated that the regenerative processes in the lung involve local stem/progenitor cell populations (3). Alveolar epithelial type II cells (AECIIs), which express surfactant protein C (SPC), have been considered to be stem/progenitor cells for the alveolar epithelium (3). Lineage tracing of SPC+ AECIIs demonstrates their capacities of self-renewal and differentiation into AECIs during both the homeostatic state and regeneration after injury (4). Besides their stem/progenitor capacities, AECIIs have immune-modulatory functions. AECIIs release cytokines and chemokines that recruit leukocytes to the sites of injury/infection and activate these cells to mount an immune response (5, 6). Dysregulated immune responses have been implicated in a variety of inflammatory and fibrotic conditions affecting humans. In some types of pulmonary fibrosis, patients have abnormal alveolar structure with a loss of AECIs and accumulation of immune cells (7–9). The mechanisms for the failure of AECI regeneration are not clear, however. One explanation for the loss of AECIs is the loss of local stem/progenitor cells, the sources for generating new AECIs, after injury. However, this stem/progenitor cell loss cannot be the sole reason for the impaired regeneration, as lung injuries that do not cause loss of stem/progenitor cells can still lead to failed AECI regeneration in animal models and patients with pulmonary fibrosis (10). Those findings imply that non–stem/progenitor cell loss-specific mechanisms are responsible for the impaired lung regeneration that occurs in fibrotic lungs. The molecular mechanisms underlying lung regeneration have been studied in adult mice following pneumonectomy (11). Regeneration of lung alveoli depends on an increased inflammatory state in the lung, a process that requires recruitment of monocytes and macrophages into lung alveoli. It is unclear how inflammatory responses that normally lead to lung regeneration in acute injury are absent in fibrotic lungs with persistent inflammatory responses. Here, we show that mice infected with S. pneumoniae strain T4 (SpT4) have injuries exclusively in lung alveoli, with loss of AECIs and AECIIs and increased infiltration of immune cells. This is followed by rapid resolution of lung inflammation and alveolar epithelial regeneration via proliferation of preexisting SPC+ AECIIs and their differentiation into AECIs. We show that nuclear expression of Yap and Taz, the mediators of the Hippo signaling pathway, were markedly increased in AECIIs following SpT4 infection. We investigate the role of Yap and Taz in AECIIs during alveolar epithelial regeneration and resolution of lung inflammation in response to bacterial pneumonia–induced lung injury. Results Alveolar epithelial injury and recovery following S. pneumoniae–induced bacterial pneumonia in mice. We used SpT4 to infect mice by intranasal inhalation under anesthetization with a dose of approximately 5 × 10⁶ CFU. SpT4 infection causes direct infection of the lower respiratory tract and acute bacterial pneumonia in mice, as indicated in previous reports (12, 13). Lungs were harvested at 2, 4, 7, and 14 days post infection (dpi) and analyzed by histology and flow cytometry. The levels of pneumococcal bacteria and cell apoptosis were highest in the alveolar spaces within the first 2 days after infection, as indicated by immunostaining with antibody specific for SpT4 capsule and TUNEL staining, individually (Figure 1, A–C). In contrast, their levels were reduced after 2 dpi, as seen by the gradual decrease in SpT4+ and TUNEL+ numbers within the alveolar region by 14 dpi. To determine pneumococci clearance in the lung, bacterial loads were measured by plating lung homogenate. A transient increase of bacterial load was detected in mouse lung, with the highest level at 2 dpi and 4 dpi, followed by a significant drop at 7 dpi (Figure 1B). Substantial destruction of alveolar epithelial cells was observed, as evidenced by significant loss of cell type–specific markers for AECIs (T1a) and AECIIs (SPC) at 2, 4, and 7 dpi (Figure 1A). By 14 dpi, the number of those cell populations returned to the basal level (Figure 1, D and E). The damage and recovery of lung epithelium during bacterial pneumonia were specific to the alveolar region, as there were no significant changes in the expression of airway epithelial cells, including club cells (CC10), ciliated cells (bTubulin IV), and basal cells (p63) (Supplemental Figure 1A; supplemental material available online with this article; https://doi.org/10.1172/JCI125014DS1). Figure 1 Alveolar epithelial injury and recovery in SpT4-infected mice. Lung tissues were collected at 0, 2, 4, 7, and 14 dpi with SpT4. (A) Immunostaining on lung sections with antibodies to the type 4 capsule of SpT4, T1a, and pro-SPC (SPC). Cell apoptosis was measured by TUNEL staining. Cell nuclei were stained with DAPI (blue). Scale bars: 50 μm. (B) Mouse lungs were homogenized, and lung lysates were plated for quantitative culture of colonizing pneumococci. (C) Quantification of cell apoptosis by counting TUNEL+ cells on lung sections. (D) Lung cells were dissociated, and T1a+ cells were quantified as percentage of total CD45– cells by flow cytometry. (E) Quantification of the number of SPC+ cells on lung sections. n ≥ 10 randomly selected fields per animal (C and E); n = 3–9 per group (B–E). **P < 0.01; ***P < 0.001; ****P < 0.0001, 1-way ANOVA. Alveolar epithelial regeneration and inflammatory resolution during bacterial pneumonia. We first examined AECII proliferation after SpT4-induced lung injury. To determine DNA synthesis in AECIIs, mice received a single i.p. injection of EdU and were sacrificed after a 3-hour labeling period. The frequency of EdU incorporation was determined on sectioned lungs by colabeling with antibody against AECII (SPC) (Figure 2A). A transient increase of DNA synthesis was observed in AECIIs, with a peak labeling index of 7% ± 0.3% occurring at 4 dpi (Figure 2B). Figure 2 Alveolar epithelial regeneration and Yap/Taz expression in mouse lungs during bacterial pneumonia. (A) Schematic of experimental design (left) and confocal images of lung sections at 0 dpi and 4 dpi. AECIIs in DNA synthesis phase were detected using Click-iT EdU Alexa Fluor (green) and coimmunostaining with antibody against pro-SPC (SPC) (red). Cell nuclei were stained with DAPI (blue). (B) Quantification of EdU+SPC+ cells as percentage of total SPC+ cells analyzed (~2200 SPC+ cells per animal). (C) Confocal images of lung sections of SPC-CreERT2, Rosa26-mTmG mice at 0, 7, and 14 dpi. Mice were administrated with 3 doses of tamoxifen to label SPC+ AECIIs. Fourteen days after the last tamoxifen treatment, mice were infected with SpT4. AECII-to-AECI differentiation was visualized by coimmunostaining with antibodies against GFP (lineage-labeled AECIIs) and T1a (AECIs). Arrowheads point to regions double-positive for GFP and T1a. (D) Quantification of percentage of GFP+T1a+ area of total GFP+ area per field using ImageJ. (E) Flow cytometry analysis of dissociated lung cells showing the percentage of GFP+T1a+ cells of total T1a+ cells at indicated time points. (F) Confocal images of lung sections of SPC-CreERT2, Rosa26-mTmG mice. Immunostaining with antibodies against GFP (lineage-labeled AECIIs) and Yap and Taz. Cell nuclei were stained with DAPI (blue). (G) Western blot using lung tissue lysates at 0 dpi or purified AECIIs at 0 and 7 dpi, blotted with anti-YAP, anti-pYAP (Ser127), anti-Taz, anti-pTaz (S89), and anti–β-actin. Histograms showed average of total YAP or TAZ normalized to β-actin (loading control), together with average ratio of pYAP/YAP and pTAZ/TAZ. n ≥ 4 per group (B, D, E); n = 3 per group (G). *P < 0.05; **P < 0.01; ****P < 0.0001, 1-way ANOVA (B, D, E) and Student’s t test (G). Scale bars: 10 μm. We next performed genetic lineage tracing of adult SPC+ AECIIs using the SPC-CreERT2, Rosa26-mTmG mouse line. Mice were administrated with 3 i.p. injections of tamoxifen at 0.2 mg/g per dose to induce GFP expression in SPC+ AECIIs. Mice were then infected with SpT4 at 14 days after the last tamoxifen treatment. Lungs were analyzed by immunohistochemistry and flow cytometry. Differentiation of AECIIs to AECIs was measured by coimmunostaining for lineage-labeled AECII marker (GFP) and AECI marker (T1a) (Figure 2C). We examined AECII-to-AECI differentiation by quantifying the percentage of GFP+ alveolar surface area covered by AECII-derived AECIs (GFP+T1a+) on sectioned lungs. There were no significant changes between noninfected and SpT4-infected lungs within 6 dpi. However, we observed significant increases in the levels of AECII-to-AECI differentiation (GFP+T1a+) at 7 dpi and onwards (Figure 2D and Supplemental Figure 1B). Consistent with this finding, FACS analysis showed the significant increase in the percentage of AECIs derived from preexisting AECIIs (GFP+T1a+) at 7 dpi compared with that in noninfected lungs. At 14 dpi, the level of GFP+T1a+ was elevated by 4.7 ± 0.4-fold compared with that at 7 dpi (Figure 2E). It has been postulated that inflammatory cells are important drivers of tissue repair and regeneration (14, 15). However, correlations between persistent lung inflammation and decreased lung regeneration have been observed in both various animal injury models and human patients (8, 10). To assess the lung inflammatory responses and their association with alveolar epithelial regeneration, we characterized the immune phenotypes in mouse lungs during bacterial pneumonia. Consistent with previous reports (12, 13), high levels of inflammatory responses were observed in the lung, as evidenced by the significant increases in the number of immune cells (CD45+) within 7 dpi, including lymphocytes (CD3+), macrophages (CD11c+CD64+), and neutrophils (Ly6G+) (Supplemental Figure 2, A–E). Yet the accumulation of inflammatory cells in the lung waned over time, as seen by the decrease in the number of those cell populations by 14 dpi. Mouse lungs exhibited profibrotic lesions at 7 dpi, but recovered from SpT4 infection without the acquisition of lung fibrosis at 14 dpi, as evidenced by Masson’s trichrome staining and hydroxyproline assay on lung tissue lysates (Supplemental Figure 2, F and G). The transient accumulation of lung inflammatory cells was accompanied by the loss of AECIs and the increase of profibrotic lesions, while the resolution of inflammatory cells coincided with the time frame of AECI recovery, AECII-to-AECI differentiation, and regression of profibrotic lesions in the lung (Supplemental Figure 2, H–J), implying that resolution of lung inflammation was closely associated with alveolar epithelial regeneration. Yap and Taz expression in AECIIs during bacterial pneumonia. To understand the mechanisms underlying alveolar epithelial regeneration following SpT4-induced lung injury, we performed microarray analysis on lineage-labeled AECIIs (GFP+) isolated from SPC-CreERT2, Rosa26-mTmG mouse lungs before SpT4 infection and at 8 dpi with SpT4. After normalization of data sets, we used ToppGene to identify pathways that were induced (FDR, <5% and >1.5-fold expression) in GFP+ AECIIs of SpT4-infected mice. Pathways associated with Hippo signaling, T cell receptor signaling, JAK/STAT, and p38 signaling were all induced in SpT4-infected mice (Supplemental Table 1). Quantitative reverse transcriptase PCR (qRT-PCR) analysis confirmed increased expression of Yap and Taz, the 2 paralogous transcriptional coactivators of the Hippo pathway (16, 17), as well as their target genes including Ctgf, Cyr61, and Birc5 in GFP+ AECIIs of SpT4-infected mice at 7 dpi compared with those of mice without infection (0 dpi) (Supplemental Figure 3A). Inhibition of Hippo signaling leads to nuclear Yap/Taz localization and activity (16, 17). Nuclear Yap/Taz expression was not detected in AECIIs of noninfected lungs (Figure 2F). However, we observed increases in nuclear Yap/Taz protein levels in AECIIs before (4 dpi) and during (7 dpi) differentiation toward AECIs (Figure 2F). Western blot confirmed higher levels of Yap/Taz protein in AECIIs purified from lungs at 7 dpi compared with those from noninfected lungs (Figure 2G). Moreover, nuclear locations of Yap/Taz proteins were also elevated in AECIIs at 7 dpi compared with noninfected AECIIs, as quantification of relative expression of phosphorylated Yap (p-Yap, Ser127) versus total Yap and p-Taz (Ser89) versus total Taz revealed lower levels of p-Yap/Yap and p-Taz/Taz in AECIIs at 7dpi than in noninfected AECIIs (Figure 2G). Yap/Taz deletion in AECIIs impairs alveolar epithelial regeneration and causes prolonged fibrotic lesions during bacterial pneumonia. The nuclear localization of Yap and Taz in AECIIs in response to SpT4-induced lung injury could potentially augment alveolar regeneration by enhancing their targeting of regeneration-related genes. We tested this in the adult mouse lung with tamoxifen-inducible Yap/Taz gene deletion in SPC+ AECIIs. SPC-CreERT2, Yapfl/fl, Tazfl/fl, Rosa26-mTmG mice were administrated with tamoxifen i.p. to delete Yap and Taz in SPC+ AECIIs (referred as Yap/Taz mutant mice). Yap/Taz deletion and reduced expression of their target genes were verified by qRT-PCR analysis performed on purified AECIIs 14 days after tamoxifen administration (Supplemental Figure 3B). To gain insight into the role of Yap/Taz in AECIIs in the steady-state adult lung, we quantified the survival, self-renewal, and differentiation of lineage-labeled SPC+ AECIIs at 9 days and 12 weeks after tamoxifen administration. We lineage labeled AECIIs by generating SPC-CreERT2, floxed Yap/Taz, Rosa26-mTmG mice so that a GFP reporter could be used to label and trace AECIIs in which Yap/Taz had been deleted. We found no detectable changes in GFP+ cell apoptosis, as assessed by TUNEL staining at 9 days and 12 weeks after tamoxifen administration (Supplemental Figure 3, C and D). A transient decrease of DNA synthesis was observed in the lineage-labeled AECIIs from Yap/Taz mutant mice compared with SPC-CreERT2, Rosa26-mTmG control mice at 9 days after tamoxifen administration (0.49% ± 0.10% vs. 1.45% ± 0.10%; P < 0.001; Supplemental Figure 3E). The decreased AECII cell-cycle progression in Yap/Taz mutant mice was also observed by immunostaining of sectioned lungs for the cell cycle marker Ki67 (0.30% ± 0.09% vs. 1.80% ± 0.09%; Yap/Taz mutant vs. SPC-CreERT2, Rosa26-mTmG control, respectively; P < 0.001; Supplemental Figure 3F). By 12 weeks after tamoxifen administration, there were no significant differences in the percentage of lineage-labeled AECIIs that were EdU+ (EdU+GFP+) between Yap/Taz mutant and control mice (0.16% ± 0.02%. vs 0.18 % ± 0.08%; Supplemental Figure 3E). However, the level of Ki67+GFP+ was still lower in Yap/Taz mutant mice than that in control mice (0.76% ± 0.09% vs.1.44% ± 0.4%, P < 0.01; Supplemental Figure 3F). Quantification of AECII-to-AECI differentiation by immunostaining and flow cytometry showed that Yap/Taz mutant mice exhibited reduced percentages of lineage-labeled AECIIs that had differentiated into AECIs (GFP+T1a+) at 12 weeks after tamoxifen administration compared with control mice (1.68% ± 0.25% vs. 2.70% ± 0.10%; P < 0.05; Supplemental Figure 3G). Histological analysis showed Yap/Taz mutant mice had normal alveolar structures at 4 weeks after tamoxifen administration, but exhibited patchy distribution of subtle interstitial infiltrates in the alveolar septa at 12 weeks after tamoxifen administration (Supplemental Figure 3H). FACS analysis revealed that Yap/Taz mutant lungs at 12 weeks after tamoxifen administration had increased numbers of inflammatory cells (CD45+) compared with SPC-CreERT2 control lungs (Supplemental Figure 3I). These data indicated that deletion of Yap/Taz in adult SPC+ AECIIs led to decreased AECII proliferation and AECII-to-AECI differentiation during steady-state tissue maintenance. Long-term deletion of Yap/Taz in SPC+ AECIIs caused increased accumulation of inflammatory cells in the lung. To determine whether Yap/Taz contributed to alveolar epithelial regeneration in vivo, Yap/Taz mutant mice were exposed to SpT4-induced lung injury. Yap/Taz mutant mice showed delayed recovery from bacterial pneumonia, as they regained body weight more slowly compared with the SPC-CreERT2 control mice (Supplemental Figure 4A). Yap/Taz mutant mice had higher levels of total protein in their bronchoalveolar lavage fluid (BALF) at 7 dpi and 14 dpi compared with the control mice (Supplemental Figure 4B), indicating more damage to lung tissue integrity in Yap/Taz mutant mice. SPC-CreERT2 control mice started to regenerate AECIs (T1a+) and AECIIs (SPC+) within a week after SpT4 infection and had full recovery of those cell populations by 14 dpi (Figure 1, D and E and Figure 3, A and B). In contrast, Yap/Taz mutant mice showed persistently low levels of AECIs and AECIIs for more than 2 weeks and only started to regenerate those cell populations by 21 dpi, indicating delayed alveolar epithelial regeneration following SpT4 infection (Figure 3, A and B). Yap/Taz mutant mice developed severe fibrotic lesions within the alveolar region at 14 dpi, as evidenced by increased Ashcroft scores in Trichrome-stained lung sections and collagen burden using hydroxyproline assay on lung tissue lysates compared with SPC-CreERT2 control mice (Figure 3, C–E). Fibrotic lesions regressed over time, as seen by the gradual decreases in Ashcroft score and collagen burden by 56 dpi in Yap/Taz mutant lungs (Figure 3, D and E, and Supplemental Figure 4C). Lungs of single Yap mutant mice developed minor fibrotic lesions at 14 dpi, while lungs of single Taz mutant mice recovered from bacterial pneumonia without acquisition of fibrotic lesions at 14 dpi (Supplemental Figure 4D). We focused on Yap/Taz mutant mice in this study, since single mutant mice had minor or no phenotypes in response to SpT4 infection. Figure 3 Phenotypes of Yap/Taz mutant lungs during bacterial pneumonia. (A) Immunostaining on lung sections with nuclei labeled by DAPI (blue) and antibodies to T1a (red) or pro-SPC (SPC) (green). (B) Lung cells were dissociated and T1a+ cells were quantified as percentage of total CD45– cells by flow cytometry. SPC+ cells were quantified by counting the number of SPC+ cells per field (≥10 randomly selected fields per animal) (n = 3–8 per group). (C) Lung tissue sections were stained with Alcian blue and Nuclear Fast Red. Lung fibrotic lesions were quantified by measuring (D) Aschcroft score and (E) hydroxyproline assay (n = 3–4 per group). *P < 0.05; **P < 0.01; ***P < 0.001; ****P < 0.0001, 2-way ANOVA. Scale bars: 50 μm (A, C [bottom panel]); 500 μm (C [top panel]). To determine the causes of impaired alveolar epithelial regeneration observed in Yap/Taz mutant mice, we profiled lung bacterial loads by measuring CFU and found no differences in bacteria number in lung homogenates and blood serum from Yap/Taz mutant mice compared with SPC-CreERT2 controls after SpT4 infection (Supplemental Figure 4, E and F). We next evaluated the effects of the Yap/Taz deletion on the process of alveolar epithelial damage. TUNEL staining of lung sections showed no differences in the number of apoptotic cells between Yap/Taz mutant and control lungs (Supplemental Figure 4, G–H). These results indicated that bacterial load and cell apoptosis were unlikely to explain the effects of the Yap/Taz deletion on alveolar epithelial regeneration and the development of lung fibrotic lesions during bacterial pneumonia. To determine how Yap/Taz might contribute to alveolar epithelial regeneration, we examined their effects on AECII proliferation and AECII-to-AECI differentiation (Figure 4A). The proliferation index of AECIIs in Yap/Taz mutant mice at 7 dpi was significantly lower than that in SPC-CreERT2, Rosa26-mTmG control mice, as shown by the percentage of lineage-labeled AECIIs (GFP+) that were either EdU+ or Ki67+ (Figure 4, B and C). At 14 dpi, 24.1% ± 2.1% of total lineage-labeled GFP+ cells in control lungs were T1a+ (GFP+T1a+). In contrast, GFP+T1a+ cells were reduced by 72.6% (6.6% ± 2.1%) in Yap/Taz mutant lungs (Figure 4, D–F), indicating decreased AECII-to-AECI differentiation in Yap/Taz mutant lungs. The AECII-to-AECI differentiation defect was persistent in Yap/Taz mutant lungs, as the levels of AECIs derived from lineage-labeled AECIIs (GFP+T1a+) were still significantly lower in Yap/Taz mutant lungs at 56 dpi than in SPC-CreERT2, Rosa26-mTmG control lungs (Figure 4F). Collectively, these data indicated that loss of Yap/Taz in AECIIs diminished alveolar epithelial regeneration derived from preexisting SPC-expressing AECIIs and led to prolonged fibrotic lesions in the lung during bacterial pneumonia. Figure 4 AECII proliferation and differentiation in Yap/Taz mutant lungs during bacterial pneumonia. (A) Schematic of experimental design for studies shown in B–F. (B) Lung tissue sections from SPC-CreERT2, Rosa26-mTmG mouse were immunostained with DAPI (blue) and antibody against GFP (lineage-labeled AECIIs) (green), and colabeling with Click-iT EdU Alexa Fluor (red) and confocal images were taken. The percentages of GFP+EdU+ cells of total GFP+ cells per field were graphed (bottom panel). (C) Confocal image of lung section from SPC-CreERT2, Rosa26-mTmG mouse at 7 dpi with nuclei labeled by DAPI (blue) and antibodies against GFP (green) and Ki67 (red). Percentages of GFP+Ki67+ cells of total GFP+ cells per field were graphed (bottom panel). (D) Confocal images of lung section at 14 dpi with nuclei labeled by DAPI (blue) and antibodies against GFP (green) and T1a (red). Asterisks indicate regions double-positive for GFP and T1a. (E) Lung cells were dissociated and flow cytometry was performed by gating on GFP+T1a+. The numbers in the top left gates represent all GFP+ cells of total live CD45– cells. The numbers in the top right gates represent GFP+T1a+ cells of total T1a+ cells. The numbers in the bottom right gates represent all T1a+ cells of total live CD45– cells. (F) Quantification of GFP+T1a+ cells as the percentage of GFP+T1a+ of total T1a+ cells by flow cytometry. n = 4–5 per group (B and C); n = 4–8 per group (F). **P < 0.01; ***P < 0.001; ****P < 0.0001, 2-way ANOVA. Scale bars: 25 μm (B and C); 20 μm (D). Yap/Taz regulate AECII inflammatory responses through targeting IκBa. To understand the underlying mechanisms for these observations, we performed microarray analysis on lineage-labeled AECIIs (GFP+) isolated from Yap/Taz mutant and SPC-CreERT2 control lungs at 8 dpi. After normalization of data sets, we used ToppGene to identify pathways that were induced or repressed (FDR, <5% and >2-fold expression) in GFP+ AECIIs of Yap/Taz mutant mice. While gene ontologies associated with negative regulation of the apoptotic process, positive regulation of cell proliferation, and differentiation were repressed in Yap/Taz mutant mice, gene ontologies associated with negative regulation of cell differentiation, inflammation response, leukocyte chemotaxis, and lipid metabolic process were all induced in Yap/Taz mutant mice (Supplemental Figure 5A and Supplemental Tables 1 and 2). qRT-PCR confirmed decreased expression of Yap, Taz, tand Yap/Taz-dependent target genes, including Ctgf, Cyr61, Birc5, and Birc2, in GFP+ AECIIs of Yap/Taz mutant mice at 7 dpi compared with those of SPC-CreERT2 control mice (Figure 5A). The expression of several markers associated with positive regulation of cell proliferation and differentiation, including Fgf1, Fgfr3, Tgfb2, Wnt3a, Bmp4, and Egfr, was significantly reduced in GFP+ AECIIs of Yap/Taz mutant mice (Figure 5A). These data suggested that loss of Yap/Taz in AECIIs led to decreased proliferation and differentiation of AECIIs in response to SpT4-induced lung injury. Notably, while expression of Nfkb1 itself was unchanged, expression of Nfkb1 repressor genes Ikba (Nfkbia) and Ikbb (Nfkbib) was significantly decreased in Yap/Taz mutant GFP+ AECIIs (Figure 5A). In contrast, the expression of NF-kB–dependent target genes, including Cxcl3 and Ccl21a, was significantly increased in Yap/Taz mutant GFP+ AECIIs (Figure 5A). We detected a significant increase in IL-1b protein, a cytokine known to expand differentiated T cells (18), in BALF from Yap/Taz mutant mice at both 7 dpi and 14 dpi compared with that from SPC-CreERT2 control mice (Figure 5B). Cytokine array on lung tissue lysates showed the higher levels of cytokines, including IL-1b as well as CXCL9, a T cell chemotactic cytokine (19), in Yap/Taz mutant mice at 7 dpi and 14 dpi compared with SPC-CreERT2 control lungs (Figure 5C and Supplemental Figure 5, B and C). Consistent with the elevated expression of genes and cytokines associated with T cell inflammatory responses in Yap/Taz mutant AECIIs, we observed a significant increase in the number of CD3+ T cells in Yap/Taz mutant lungs at 7 dpi and 14 dpi (Figure 5D). Immunostaining on sectioned lung tissues confirmed the increased number of CD3+ T cells located in lung alveoli of Yap/Taz mutant mice at 14 dpi (Figure 5, E and F). Interestingly, CD3+ T cells were enriched in areas where AECIIs failed to differentiate into AECIs in Yap/Taz mutant lungs (Figure 5F). In addition, the number of macrophages (CD11c+CD64+) in Yap/Taz mutant lungs was lower at 7 dpi, but higher at 14 dpi, than those in SPC-CreERT2 control lungs (Supplemental Figure 5D). In contrast, the number of neutrophils (Ly6G+) was not significantly changed in Yap/Taz mutant lungs compared with control lungs (Supplemental Figure 5D). The effect of Yap/Taz mutant AECIIs on lung inflammation waned over time, as seen by the equivalent levels of T cells (CD3+) and macrophages (CD11c+CD64+) at 56 dpi between Yap/Taz mutant and SPC-CreERT2 controls (Figure 5D and Supplemental Figure 5D). These results indicated that loss of Yap/Taz in AECIIs led to prolonged inflammatory responses in lung alveoli during bacterial pneumonia. Figure 5 Inflammatory responses in Yap/Taz mutant lungs. (A) GFP+ AECIIs at 7 dpi were sorted by FACS and analyzed by qRT-PCR (n = 4 per group). (B) BALF was analyzed for IL-1b by ELISA assay (n = 4–6 per group). (C) Cytokine assay showed protein levels of IL-1b and CXCL9 in mouse lung lysates (n = 1 per group). (D) Flow cytometry of dissociated lung cells was performed by gating on CD3+CD45+ cells, and quantification of total number of CD3+CD45+ cells in the lung was graphed (n = 3–10 per group). (E) Confocal images of lung sections at 14 dpi with nuclei labeled by DAPI (blue) and antibodies to GFP (green) and CD3 (red). Scale bars: 20 μm. (F) Quantification of the number of CD3+ cells as the ratio of CD3+ cell number versus GFP+ area per field using ImageJ (n = 3–5 per group). *P < 0.05; **P < 0.01; ***P < 0.001; ****P < 0.0001, Student’s t test (A) and 2-way ANOVA (B, D, F). Because Yap/Taz mutant AECIIs had reduced expression of Ikba and Ikbb, we hypothesized that an IκB/NF-κB pathway drives the inflammatory responses in Yap/Taz mutant lungs during bacterial pneumonia. Given recent identification of the Yap/IκB signaling axis as a potential means of generating inflammatory response in Drosophila post-Gram+ bacterial infection (20), we investigated whether Yap/Taz controls IκB levels in the mouse lung. Examination of the Ikba genomic locus revealed 5 potential Tead-binding motifs (TBM) within a 10 kb region upstream of the transcriptional start site (Figure 6A), while there was no potential TBM in the 10 kb region upstream of the Ikbb genomic locus. For the subsequent experiments, we focused on IκBa because it was shown to be the most efficient IκB molecule to control NF-κB transcriptional activity in previous studies (21–23). We first performed ChIP assays on chromatin obtained from the murine lung epithelial cell line MLE-15 using either an anti-Tead or anti-Yap antibody to determine whether Tead and Yap were associated with any of the 5 TBMs. ChIP analysis showed that Yap and Tead were associated with the TBM1 site of Ikba (Figure 6B). To determine whether the TBM1 site was responsive to Tead transactivation, MLE-15 cells were transfected with the pGL3 luciferase reporter containing TBM1–3 region along with an expression plasmid encoding murine Tead2 (Figure 6C). This study showed that expression of Tead2 transactivated the pGL3-IκBa-TBM1–3.luc reporter. Coexpression of Tead2 with Yap or Taz further enhanced the transactivation of the pGL3-IκBa-TBM1-3.luc reporter (Figure 6C). In contrast, expression of Tead2 did not activate the pGL3-IκBa-TBM1-3 mutant.luc reporter in which TBM1 was mutated (Figure 6C). Figure 6 Regulation of Yap/Taz on IκBa expression and NF-κB transcriptional activity in AECIIs. (A) Schematic of IκBa genomic locus showing potential Tead binding sites (TBM) in the 10 kb upstream of the IκBa transcription start site. (B) Chromatin from MLE-15 cells was immunoprecipitated with either Tead or Yap antibody, and qRT-PCR results were graphed (n = 3). (C) MLE-15 cells were transfected with pGL3 vector containing a IκBa-TBM1-3 or a IκBa-TBM1-3 mutation, in which TBM1 was mutated, along with the expression plasmid encoding either murine Tead2 or Yap or Taz. Twenty-four hours after transfection, cells were processed for luciferase activity measurement (n = 3–6 per group). (D) Adult WT mouse AECIIs were purified, cultured, and infected with either Yap shRNA lentivirus or scramble shRNA lentivirus or were given no treatment. Forty-eight hours after lentiviral infection, cells were processed for NF-κB transcription activity measurement. (E) AECIIs were purified from mouse lungs at 0 dpi and 7 dpi, and their NF-κB transcriptional activity was graphed. (F) MLE-15 cells were infected with either Yap shRNA lentivirus or scramble shRNA lentivirus or were given no treatment. Forty-eight hours after lentiviral infection, cells were transfected with NF-κB luciferase vector containing NF-κB response elements, along with an expression plasmid encoding either murine Yap or Taz. Twenty-four hours after transfection, cells were processed for luciferase activity measurement (n = 3). (G) Schematic model of interaction of Yap/Taz and IκBa/NF-κB in AECIIs. *P < 0.05; **P < 0.01; ***P < 0.001; ****P < 0.0001, 1-way ANOVA (B, C, D, F) and 2-way ANOVA (E). IκBa has previously been shown to be required for inhibiting NF-κB–mediated inflammatory response in the lung (24), raising the possibility that the regulation of IκBa expression by Yap/Taz may affect NF-κB transcriptional activity. To test this hypothesis, AECIIs from adult mouse lungs were cultured for 48 hours in the presence of a Yap shRNA lentivirus that inhibited Yap expression (25). Gene expression analysis showed that expression of Yap shRNA reduced the expression of Ikba in AECIIs compared with scrambled shRNA lentivirus–treated AECIIs (Supplemental Figure 5E). Analysis of NF-κB transcriptional activity showed that Yap shRNA–treated AECIIs had higher levels of NF-κB transcriptional activity compared with scrambled shRNA-treated or nontreated control AECIIs (Figure 6D). Moreover, AECIIs purified from Yap/Taz mutant mice at 7 dpi showed higher levels of NF-κB transcriptional activities than those from SPC-CreERT2 control mice (Figure 6E). In contrast, overexpression of Yap or Taz in AECIIs using YAP-5SA or TAZ-S89A adeno-associated virus type 6 (AAV6) led to increased Ikba expression and decreased NF-κB transcriptional activity compared with AAV6 GFP–treated AECIIs (Supplemental Figure 5, E and F). To determine whether Yap/Taz-induced IκBa expression affected NF-κB signaling, MLE-15 cells were transfected with the NF-κB response luciferase reporter. This study showed that expression of Yap shRNA led to increased transactivation of the NF-κB response luciferase reporter. In contrast, overexpression of Yap or Taz reduced the transactivation of the NF-κB response luciferase reporter (Figure 6F). These results indicated that Yap/Taz regulated NF-κB response through targeting IκBa in AECIIs (Figure 6G). IκBa overexpression promotes inflammatory resolution and alveolar epithelial regeneration in Yap/Taz mutant lung. To determine whether loss of IκBa expression was responsible for the prolonged inflammatory response and delayed alveolar epithelial regeneration observed in Yap/Taz mutant mice, we restored IκBa expression in Yap/Taz mutant lungs using the AAV6 vector for the expression of murine IκBa. We first evaluated whether intratracheal instillation of AAV6 led to efficient gene transfer and expression in AECIIs. Mouse lungs treated with AAV6-GFP at a dose of 2.5 × 10¹⁰ vp/animal exhibited abundant GFP staining in the lung alveolar region and much lower staining in the airway epithelium at 48 hours after instillation (Supplemental Figure 6A). In lung alveoli, 97.3% ± 1.1% of GFP+ cells were SPC+ and less than 2.5% of GFP+ cells were CD3+ (Supplemental Figure 6B). These results indicated that intratracheal instillation of AAV6 resulted in preferential transduction of SPC+ AECIIs in mouse lungs. Next, Yap/Taz mutant mice were administrated with AAV6-IκBa at a dose of 2.5 × 10¹⁰ vp/animal through intratracheal instillation at 7 dpi. Twenty-four hours later, AECIIs were purified and performed for gene expression analysis by qRT-PCR. IκBa overexpression in Yap/Taz mutant lungs restored IkBa transcription, while IkBa expression in inflammatory cells (CD45+) was unchanged (Supplemental Figure 6C). Restoration of IkBa expression in Yap/Taz mutant lungs was sufficient to inhibit NF-κB–mediated gene expression in AECIIs, since AAV6-IκBa–treated AECIIs exhibited decreased expression of NF-κB–dependent genes (Cxcl3, Ccl21a) compared with PBS treatment (Supplemental Figure 6C). We observed a significant decrease in IL-1b protein in BALF from AAV6-IκBa–treated Yap/Taz mutant mice at 14 dpi (Figure 7, A and B). Cytokine array showed that AAV6-IκBa–treated Yap/Taz mutant lungs at 14 dpi produced lower levels of cytokines, including cytokines associated with T cell accumulation (IL-1b, CXCL9) and antiinflammatory resolution responses (TIMP-1, TREM-1) (Figure 7C and Supplemental Figure 7, A and B). PBS-treated Yap/Taz mutant lungs showed results similar to those of AAV6-null–treated Yap/Taz mutant lungs and were used as the controls in this study (Supplemental Figure 7, A–C). The impairment in inflammatory resolution in Yap/Taz mutant lung was partially recovered by ectopic IκBa overexpression, as AAV6-IκBa treatment on Yap/Taz mutant mice led to a significant reduction in the number of CD3+ T cells in the lung at 14 dpi (Figure 7D). Inflammatory responses were not completely absent in AAV6-IκBa–treated Yap/Taz mutant lungs, however, as the numbers of neutrophils (Ly6G+) and macrophages (CD11c+CD64+) were equivalent between AAV6-IκBa–, PBS-, and AAV6-null–treated Yap/Taz mutant lungs (Supplemental Figure 7, D and E). Figure 7 Inflammatory resolution and alveolar epithelial recovery in Yap/Taz mutant lungs with AAV6-IκBa treatment. (A) Schematic of experimental design for B–K. (B) BALF was analyzed for IL-1b by ELISA assay (n = 4–5 per group). (C) Cytokine assay showed protein levels of IL-1b and CXCL9 in mouse lung lysates (n = 1 per group). (D) Flow cytometry of dissociated lung cells was performed by gating on CD3+CD45+ cells, and quantification of total number of CD3+CD45+ cells in the lung at 14 dpi were graphed (n = 5–6 per group). (E) Immunostaining on lung sections at 14 dpi with nuclei labeled by DAPI (blue) and antibody to T1a (red). White dashed lines indicate T1a– region in the lung. (F) Flow cytometry of dissociated lung cells was performed by gating on T1a+CD45– cells. (G) Quantification of the percentage of T1a+CD45– cells of total CD45– cells in the lung at 14 dpi (n = 4–5 per group). (H) Quantification of total protein in BALF at 14 dpi (n = 5–6 per group). (I) Lung sections at 14 dpi were stained with Alcian blue and nuclear fast red. (J) Quantification of lung fibrotic regions at 14 dpi using Ashcroft scoring method (n = 4–6 per group). (K) Quantification of collagen level on lung tissue lysates at 14 dpi using hydroxyproline assay (n = 4 per group). *P < 0.05; **P < 0.01; ***P < 0.001; ****P < 0.0001, 1-way ANOVA. Scale bars: 50 μm. We next assessed whether partial inflammatory resolution was sufficient to accelerate alveolar epithelial regeneration and regression of fibrotic lesions in Yap/Taz mutants. Analyses of lung sections by immunostaining and flow cytometry showed AAV6-IκBa–treated Yap/Taz mutant lungs exhibited significant improvement in the recovery of AECIs at 14 dpi compared with PBS- or AAV6-null–treated Yap/Taz mutant lungs (Figure 7, E–G, and Supplemental Figure 7C). Moreover, AAV6-IκBa treatment led to improved lung tissue integrity in Yap/Taz mutant mice, as gauged by the total protein measurement in their BALF (Figure 7H and Supplemental Figure 7C). The regenerated AECIs in AAV6-IκBa–treated Yap/Taz mutant lungs were not associated with the differentiation of preexisting SPC+ AECIIs into AECIs, since AECII-to-AECI differentiation (GFP+T1a+) in AAV6-IκBa–treated Yap/Taz mutant lungs was equivalent to that in PBS-treated Yap/Taz mutant lungs (Supplemental Figure 8, A–C), suggesting the recovered AECIs were contributed by non–lineage-labeled AECIIs. We measured Ashcroft scores in Trichrome-stained lung sections and collagen burden in lung tissue lysates at 14 dpi and found a significant decrease in lung fibrotic lesions in AAV6-IκBa–treated Yap/Taz mutant mice compared with PBS- or AAV6-null–treated mice (Figure 7, I–K, and Supplemental Figure 7C). Together, these findings indicated that restoration of IκBa expression in Yap/Taz mutant lung promoted inflammatory resolution and accelerated alveolar epithelial regeneration and regression of lung fibrotic lesions during bacterial pneumonia. Discussion Bacterial pneumonia has long been associated with lung damage, but how the host recovers from lung damage and the potential role of lung regeneration versus fibrosis have not been fully understood. Here, we investigated the recovery from bacterial pneumonia in mice infected by S. pneumoniae. We found that mice had massive tissue damage exclusively in lung alveoli during bacterial pneumonia. Mice recovering from pneumococcal infection lacked detectable lung fibrosis, suggesting that considerable regeneration of lung tissue must be acting during this recovery. Numerous studies have demonstrated alveolar epithelial regeneration after injury involving SPC+ AECIIs (3). We showed that SPC+ AECIIs increased proliferation within 7 dpi. We also showed that lineage-labeled SPC+ AECIIs differentiated to AECIs at sites of damaged lung alveoli during 7–14 dpi, coinciding with the time frame when inflammation was resolved in the lung. AECIIs synthesize and secrete surfactant and proliferate and differentiate into AECIs after injury in order to maintain the integrity of the alveolar wall. AECIIs also secrete cytokines and chemokines under appropriate stimulation, showing their role in modulating immunologic activity in the alveolar space. Given the important contributions of AECIIs in lung repair and regeneration, it is critical to determine the molecular mechanisms underlying AECII activities in intact tissues. We showed in this study that Yap and Taz expression and nuclear activity increased in AECIIs upon pneumococcal infection. Yap and Taz regulated AECII activities, including their proliferation, differentiation into AECIs, and inflammatory responses during both homeostasis and lung regeneration following bacterial pneumonia–induced lung injury. Yap and its closely related paralogue Taz are the transcriptional coactivators that are the main downstream mediators of the Hippo pathway. When Hippo signaling is inhibited, Yap and Taz (Yap/Taz) can accumulate in the nucleus where they interact with transcription factors such as the TEA domain family members (TEAD) and activate gene expression associated with cell survival, proliferation, and differentiation (16). Recent studies have shown the important role of the Hippo/Yap pathway in controlling lung epithelial progenitor cell differentiation during embryogenesis and basal stem cell maintenance in the upper airway of adult lung (26–28). Furthermore, studies of pneumonectomy-induced alveolar regeneration show that Yap is essential for AECII proliferation and differentiation in response to mechanical tension in the lung (29). We measured both AECII proliferation and AECII-to-AECI differentiation in the bacterial pneumonia mouse model. Our data are consistent with previous studies demonstrating the importance of Yap/Taz for the proliferation and differentiation of lung epithelial progenitor cells. This study demonstrates what we believe is a previously unknown function for Yap/Taz in negative regulation of AECII-derived inflammation. We found that Gram-positive pathogen Streptococcus stimulation of AECIIs to effect inflammatory cytokine/chemokine production required the activation of Yap/Taz-IκBa, a process that had been previously reported in Drosophila fat cells, both in vitro and in vivo (20). A potential mechanism for Gram-positive pathogen-dependent activation of Yap/Taz-IκB may be the TLR-mediated antimicrobial response (20). The inhibitory IκB proteins have been discovered as fundamental regulators of the inducible transcription factor NF-κB (30). IκBa preferentially binds to heterodimers containing p50, p65, and c-Rel (31–34). Several comparative studies have demonstrated that IκBa is the most efficient IκB molecule to remove NF-κB from target gene promoters and to terminate NF-κB–mediated gene induction (35–38). Generally, various stimuli such as TLR ligands triggers rapid IκBa degradation, resulting in the release of NF-κB dimers and subsequent transcriptional activation (30, 39, 40). We found IκBa was transcriptionally regulated by Yap/Taz-Tead in AECIIs. Thus, Yap/Taz-dependent functions are associated with the termination of NF-κB–dependent transcription of inflammatory genes through the induction of IκBa expression. Loss of Yap/Taz removed a “brake” on AECII activation and increased expression of inflammatory genes, leading to elevated local inflammation and enhanced accumulation and persistence of inflammatory cells in the lung (Supplemental Figure 9). Higher inflammatory responses in pneumococci-infected lungs have been previously reported (12, 13, 41), but prior work did not examine immune responses in vivo that could affect lung regeneration. Another study found increased AECII proliferation in mice following pneumonectomy, which was correlated with increased monocyte and macrophage recruitment and an increased inflammatory state in the lung (11). They further showed that loss of recruited monocytes/macrophages impaired lung regeneration (11). However, the impact of prolonged inflammation on lung regeneration has not been clear. There is a growing understanding that overly exuberant or persistent inflammatory responses can be found in fibrotic lungs (42–44). Our observations of increased IL-1b, Cxcl3, and Ccl21a expression in the fibrotic lungs of Yap/Taz mutants are consistent with a more inflammatory milieu during bacterial pneumonia. We found that SPC+ AECIIs required Yap/Taz to active IκBa, which inhibited NF-κB–mediated inflammation. Loss of Yap/Taz in SPC+ AECIIs led to persistent lung inflammation and fibrotic lesions in lung alveoli during bacterial pneumonia, indicative of impaired alveolar regeneration. We found no Yap/Taz-dependent defects in clearing pneumococcal load in vivo, leading us to the conclusion that it is a role for Yap/Taz in the resolution of lung inflammation through regulation of NF-κB nuclear activity that underlies alveolar regeneration. During development, epithelial NF-κB signaling is known to regulate lung inflammation and alveolar development in both humans and mice (45–47). In adulthood, correlations between persistent lung inflammation and decreased lung regeneration have been observed in both various animal injury models and human patients (8, 10), but it has not been clear whether higher inflammatory burdens in the lung precede loss of lung regeneration or are an effect of respiratory disease. In this work, we found that loss of Yap/Taz expression in SPC+ AECIIs, by promoting constitutive nuclear activity of NF-κB, led to persistent inflammatory responses in lung alveoli. We also found that restoration of the Yap/Taz target IκBa, the inhibitor of NF-κB, promoted resolution of lung inflammation and alveolar epithelial recovery from bacterial pneumonia in Yap/Taz mutant mice. Recent studies have reported alveolar regenerative capacity following injury, which is mediated by several stem/progenitor cell populations, including basal cells, club cells, AECIIs and lineage-negative progenitors or distal airway stem cells, and AECIs (10, 48–54). Our work showed that IκBa treatment did not improve AECII-to-AECI differentiation in Yap/Taz mutant lungs, suggesting that regenerated AECIs were contributed by non-SPC+AECIIs. These results emphasize the importance of cellular niche in considering how inflammatory signaling influences adult lung regeneration. The resolution of inflammation in the lung is a highly controlled and coordinated process that involves the suppression of inflammatory gene expression and inflammatory cell clearance. We highlight the role of the endogenous antiinflammatory mechanism of Yap/Taz that limits the excessive and prolonged production of inflammatory mediators in AECIIs. In general, the onset of inflammation is associated with secretion of cytokines/chemokines to attract circulating immune cells to the site of injury to counteract the infected agent in the affected lung tissue. The activated AECIIs directed the inflammatory processes toward resolution after the tasks of immune cells are successfully accomplished. However, in pathologic chronic inflammation, the inflammatory processes are not resolved, and active inflammation continues in a dysregulated fashion. The persistent lung inflammatory processes in Yap/Taz mutants suggest that inappropriate Yap/Taz and IκBa/NF-κB signaling pathways may also be the major contributors that cause failed regeneration in pathologic chronic lung disease. Methods Mice. All mice were bred and raised in the pathogen-free mouse facility at Temple University. C57BL/6 mice (Jackson Laboratories) and SPC-CreERT2 mice (52) and Yapfl, Tazfl (55), and Rosa26-mTmG mice (Jackson Laboratories) were used. Generation and genotyping of the SPC-CreERT2, Rosa26-mTmG, Yapfl, and Tazfl lines have been previously described (52, 55). SPC-CreERT2 mice, Yapfl/fl mice, Tazfl/fl mice and Rosa26-mTmG mice were kept on a mixed C57BL/6:129SVJ background. All experiments used 6- to 10-week-old male mice. Bacterial infection. The pneumococcal strain used was the clinical isolated strain SpT4 (56). SpT4 was stored at –80°C and grown in tryptic soy agar plus catalase (57 μgP/ml) under microaerophilic conditions for 14–16 hours at 37°C with 5% CO2, then subcultured and grown to an optical density of 0.5. The broth was centrifuged, and the bacteria were washed in sterile PBS and resuspended in 4 ml of sterile PBS immediately prior to infection. Mice were anesthetized using ketamine/xylazine mixture and infected i.n. with a dose of approximately 5 × 10⁶ CFU in 30 μl of sterile PBS. Bacterial loads. Pneumococcal loads were determined by homogenization of lung tissue in sterile PBS and blood serum at 1, 4, 7, and 14 days after infection of the animals. Tissue homogenate (100 μl) or blood serum (50 μl) and further dilutions were plated on tryptic soy agar plates plus catalase (57 μgP/ml) for culture overnight at 37°C with 5% CO2, and the number of CFU was counted. Quantification of lung damage. Lung damage was assessed in BALF. Lungs were lavaged with 1 ml of PBS. BALF was recovered and centrifuged at 1,650 g for 3 minutes at 4°C and supernatant collected. Protein levels were quantified by Pierce BCA protein assay (Thermo Scientific) per the manufacturer’s instructions. All plates were read on a Safire II plate reader (Tecan). Tissue harvest and immunostaining for histology. Mice were euthanized by overdose of tribromoethanol (Avertin, 300 mg/kg) followed by cervical dislocation. After exposing the heart and lungs, the descending aorta was cut and a 25-gauge needle was inserted into the right ventricle to flush at least 10 ml of PBS until the color of lungs changed to pink/white. A tracheostomy was performed on the exposed trachea and a 23-gauge stub needle tip was placed into the trachea. The lungs were inflated with 4% paraformaldehyde (PFA) at a pressure of 20 cm H2O. The trachea was then tied off, and intact lungs were immersed in 4% PFA for 4 hours at 4°C. Lung lobes were separated and washed with cold PBS overnight. After ethanol dehydration, lungs were embedded in paraffin and sectioned at 6 μm. To perform immunohistochemical staining, slides were deparaffinized and rehydrated. Tissue sections were then incubated in citrate buffer (pH 6.0) for 20 minutes at 95–100°C, followed by permeabilization and blocking with 0.3% Triton X-100 and 5% goat serum or horse serum (for goat primary antibodies) in PBS for 1 hour at room temperature (r.t.). Primary antibodies were diluted in PBS and incubated overnight at 4°C. Secondary antibodies were diluted in PBS and incubated for 1 hour at r.t. Immunostainings for Yap and Taz protein were performed using a TSA Fluorescein Tyramide Amplification System. EdU staining, TUNEL staining, and DAPI nuclear staining were performed according to the manufacturers’ recommendations. Tissue sections were washed 3× with PBS between antibody incubations for 15 minutes each. Slides were mounted with Aqua-Poly/Mount (Polysciences Inc.), and images were captured on a Zeiss LSM 710 confocal microscope and a Nikon eclipse fluorescence microscope. Images were processed with ImageJ/FIJI (NIH). Quantitation of cell numbers was completed using at least 10 randomly selected images per animal. Reagents used in this study are provided in Supplemental Table 3. Lung dissociation for flow cytometry. Alveolar epithelial cells were isolated using previously described protocols (57). Briefly, after lungs were cleared of blood by perfusion with PBS, as described for the tissue harvest procedure above, 3 ml of dispase (25 U/ml, 37°C) was instilled into the lungs through the trachea followed with instillation of 0.5 ml of 1% low melting agarose into the lungs. Agarose was hardened by adding ice on top of the lungs for 2 minutes. Lung lobes were then separated and incubated in 1 ml of dispase for 6 minutes at 37°C. Each lung lobe was minced in DMEM containing penicillin G, streptomycin, l-glutamine, HEPES, and DNase I (120 U/ml), followed by a rotating incubation for 10 minutes at r.t. The cells were then filtered sequentially through 100 and 40 μm strainers and centrifuged. The cells were incubated with red blood cell lysis buffer for 1 minute on ice and washed with PBS containing 5% BSA and 0.5 M EDTA. For immune cell flow cytometry, lungs were dissociated with a collagenase/DNase I solution, as previously described (11, 12). Lung lobes were cut into small pieces by scalpel blade and then incubated in 5 ml of digestion solution containing collagenase type I (3 mg/ml), DNase I (80 U/ml), 10% FBS, and 2-ME (0, 055 mM) for 45 minutes at 37°C. Flow cytometry was performed on a BD LSR II and sorting was performed on a BD INFLUX. Immunostaining for flow cytometry. Dissociated cells were blocked with CD16/CD32 Fc receptor block at 1:100 for 20 minutes. After washing with PBS, cells were incubated with fluorophore-conjugated antibodies for 1 hour. For live cell staining, LIVE/DEAD Fixable Aqua Dead Cell Stain Kit was added along with fluorophore-conjugated antibody mix at a 1:1000 dilution. Cells were washed twice with PBS, placed in FACS buffer containing 1% BSA and 0.05% sodium azide in PBS, and then assessed using a LSR II (BD). Analysis was performed using FlowJo (10.4.2). Gene expression and microarray analysis. qPCR analysis was performed using TRIzol-isolated RNA, which was used to generate cDNA using random hexamer primers and SuperScript III RT. Primer sequences are listed in Supplemental Table 4. For microarray analysis, total RNA was extracted from 6- to 8-week-old SPC-CreERT2, Rosa26-mTmG GFP+ cells at 0 and 8 dpi, and SPC-CreERT2, Yapfl/fl, Tazfl/fl, Rosa26-mTmG GFP+ cells at 8 dpi, converted to cDNA and used on Affymetrix Mouse Gene 1.0 ST arrays. Data were analyzed using Affymetrix Microarray Suite 5.0, Significance Analysis of Microarray (SAM), and the Empirical Bayes Analyses of Microarrays (EBAM). Genes with 1.5-fold or greater changes over that of the experimental mean at P < 0.01 (ANOVA) were considered significant. All original microarray data were deposited in the NCBI’s Gene Expression Omnibus database (GEO GSE86027). Hierarchical clustering was performed using Gene Cluster 3.0. Gene Ontology (GO) associations and related P values were determined using the ToppGene Suite (58). (https://toppgene.cchmc.org) Western blot. For extraction of proteins from AECIIs, lungs were dissociated with a dispase solution, as described in the procedure of lung dissociation for flow cytometry above. AECIIs were further purified using magnetic beads and column isolation, as previously described (58). Briefly, cells were incubated with CD45 Microbeads for 15 minutes at 4°C and washed with cold column buffer (PBS containing 5% BSA and 0.5M EDTA). Cells were resuspended in cold column buffer and applied to MACS LS columns on a MACS separator (Miltenyi Biotec). The flow-through cells were blocked with FcR blocking reagent for 10 minutes at 4°C, followed by an incubation with binotinylated EpCAM antibody for 30 minutes at 4°C. Cells were washed and incubated with Streptavidin Microbeads for 20 minutes at 4°C. Cells were resuspended in cold column buffer and applied to MACS LS columns. The columns were then removed from the magnetic separator. The magnetically labeled AECIIs were collected by forcing 5 ml of cold column buffer into the column. After centrifugation, AECIIs were lysed using RIPA buffer containing protease and phosphatase inhibitors. For extraction of proteins from tissues, lungs were homogenized in RIPA buffer using a tissue grinder. Protein concentrations were determined using the BCA Protein Assay Reagent Kit (Bio-Rad). Protein extracts were analyzed on polyacrylamide gels (10% NuPAGE Bis-Tris Gel; Invitrogen) and transferred to nitrocellulose membrane (Bio-Rad). The blots were blocked in 5% BSA in TBS for 1 hour at r.t., followed by incubation with primary antibody diluted in block overnight at 4°C. The blots were washed 3× with TBS containing 0.1% Tween 20 (TBST) for 15 minutes and incubated with near-infrared fluorophore-conjugated secondary antibodies diluted in TBST for 1 hour at r.t. Signals were detected using the Odyssey imaging system (LI-COR Biosciences). Cell lines, transfections, and treatments. Mouse MLE-15 cells (abm Inc., catalog T0495) were grown in DMEM/F12 containing 2% FBS, 10 mM HEPES, and 10 nM hydrocortisone. HEK293T cells were purchased from ATCC and grown in DMEM containing 10% FBS. DNA transfections were done with X-tremeGENE HP DNA Transfection Reagent (Roche) in antibiotic-free medium according to the manufacturer’s instructions. Yap shRNA and scrambled shRNA were used as previously described (25). Lentiviral particles were prepared by transiently transfecting HEK293T cells with lentiviral vectors together with packaging vectors (pMD2-VSVG and psPAX2). Plasmids. Murine Yap was described previously (59) and subcloned into the pCMV-Tag3B vector. Murine Taz was expressed in the pCMV-Sport6 vector (Addgene plasmid 27318). YAP-5SA and TAZ-S89A plasmids were purchased from Addgene (plasmid 27371 and 32840). Murine Tead2 cDNA was purchased from OriGene (catalog MR223302) and subcloned into the pcDNA3.1(+) vector. NF-κB response luciferase reporter was purchased from Promega (catalog E8491). A 1900 bp region of the murine IκBa, gene enhancer (–8600 to approximately –6700 kb relative to the ATG site) was cloned into a pGL3 luciferase reporter vector (Promega, GenBank, catalog U47298). Point mutations within the IκBa, enhancer–luciferase reporter plasmid were generated using the QuikChange Site-Directed Mutagenesis Kit (Stratagene). Sequences of cloning primers are p
|
|
Scooped by
Gilbert C FAURE
April 14, 2019 5:13 AM
|
Aim: We aimed to study biological properties of human endometrial stromal cells in vitro.Materials and Methods: The endometrium samples (n = 5) were obtained...
|
|
Scooped by
Gilbert C FAURE
April 13, 2019 8:10 AM
|
The soon-to-be trend is being driven by a boom in studies showing human milk oligosaccharide, a property in breast milk, boosts good bacteria in the gut.
|
|
Suggested by
Société Francaise d'Immunologie
April 9, 2019 2:11 PM
|
J Cell Physiol. 2019 Apr 5. doi: 10.1002/jcp.28613.[Epub ahead of print]...
|
|
Scooped by
Gilbert C FAURE
April 8, 2019 2:27 AM
|
Research ArticleGastroenterologyImmunology Free access | 10.1172/JCI98929 Intestinal development and homeostasis require activation and apoptosis of diet-reactive T cells Alexander Visekruna,1 Sabrina Hartmann,1 Yasmina Rodriguez Sillke,2 Rainer Glauben,2 Florence Fischer,1 Hartmann Raifer,3 Hans Mollenkopf,4 Wilhelm Bertrams,5 Bernd Schmeck,5 Matthias Klein,6 Axel Pagenstecher,7 Michael Lohoff,1 Ralf Jacob,8 Oliver Pabst,9 Paul William Bland,10 Maik Luu,1 Rossana Romero,1 Britta Siegmund,2 Krishnaraj Rajalingam,11 and Ulrich Steinhoff1 First published April 2, 2019 - More info Abstract The impact of food antigens on intestinal homeostasis and immune function is poorly understood. Here, we explored the impact of dietary antigens on the phenotype and fate of intestinal T cells. Physiological uptake of dietary proteins generated a highly activated CD44+Helios+CD4+ T cell population predominantly in Peyer patches. These cells are distinct from regulatory T cells and develop independently of the microbiota. Alimentation with a protein-free, elemental diet led to an atrophic small intestine with low numbers of activated T cells, including Tfh cells and decreased amounts of intestinal IgA and IL-10. Food-activated CD44+Helios+CD4+ T cells in the Peyer patches are controlled by the immune checkpoint molecule PD-1. Blocking the PD-1 pathway rescued these T cells from apoptosis and triggered proinflammatory cytokine production, which in IL-10–deficient mice was associated with intestinal inflammation. In support of these findings, our study of patients with Crohn’s disease revealed significantly reduced frequencies of apoptotic CD4+ T cells in Peyer patches as compared with healthy controls. These results suggest that apoptosis of diet-activated T cells is a hallmark of the healthy intestine. Introduction Immunological tolerance to environmental factors such as intestinal bacteria and food antigens is an active, multilayered process, and its breakdown leads to hyperactivation of mucosal T and B cells and subsequent development of intestinal pathologies (1–3). Successful dietary intervention therapies in patients suffering from celiac disease, food allergies, and inflammatory bowel disease (IBD) demonstrate that diet contains immunologically relevant antigens (4–6). Yet, our understanding of diet-specific immune reactivity is largely derived from T cell receptor (TCR) transgenic mice and model antigens where tolerance mechanisms comprising clonal anergy, deletion, and induction of regulatory T cells (Tregs) have been shown (7–9). These data reveal that the contribution of clonal anergy/deletion versus active suppression by Tregs depends on type, dose, and frequency of applied antigens. Even though the vast majority of peripheral Tregs (pTregs) in the lamina propria (LP) of the small intestine is induced by normal food, oral tolerance is still intact if functional Treg levels are strongly reduced (10, 11). Although the LP is not considered a typical site of immune induction, Peyer patches (PPs) are specialized lymphoid follicles known for effective stimulation of B and T cells by luminal antigens. Surprisingly, little attention has been paid to their role in tolerance against dietary antigens. This might be due to controversial findings showing, on the one hand, that tolerance occurs in PP-deficient mice and, on the other hand, that PPs are required for oral tolerance (12–15). Here, we investigated the occurrence of diet-activated T cells in various tissues and characterized their phenotype and fate. We observed that recognition of dietary antigens is essential for the cellular and functional maturation of the small intestine, including generation of Tfh cells and IgA production. In the healthy murine and human gut, food-activated CD4+ T cells in PPs exhibited a proapoptotic phenotype characterized by the transcription factor Helios and the programmed cell death protein 1 (PD-1). In contrast, low Helios expression and reduced apoptosis were observed in PP CD4+ T cells of patients with IBD, suggesting that activation and subsequent death of food-reactive T cells is a hallmark of intestinal homeostasis. Results PPs harbor a population of activated Helios+Foxp3–CD4+T lymphocytes. First, we addressed the question of whether normal dietary antigens leave a signature of immune activation in nontransgenic animals. To differentiate between stimulation by microbial and dietary antigens, intestinal and nonintestinal tissues of specific pathogen–free (SPF) and germ-free (GF) mice were screened for activated T cells. In contrast to spleen and mesenteric lymph nodes (mLNs), the majority of CD4+ T cells in PPs and small intestinal lamina propria (siLP) exhibited an antigen-experienced phenotype with high expression of CD44. In line with previous reports, GF mice revealed lower frequencies of activated CD44+CD62L– T cells in PPs and colonic LP (cLP), indicating that this population includes both microbiota-dependent and -independent T cells (Figure 1A) (16). Figure 1 Helios+Foxp3–CD4+ T cells accumulate in Peyer patches. (A) Percentage of CD44+CD62L–CD4+ T cells in spleen, mLNs, inguinal lymph nodes (iLNs), PPs, siLP, and cLP of SPF and GF mice (n = 6, 1 of 2 experiments is shown). (B) Representative dot plots of CD4+ T cells from SPF mice expressing Helios and Foxp3 in indicated organs (n = 6). (C) Expression of Helios and Foxp3 on gated CD4+ T cells of PPs from GF mice (n = 5). (D) Distribution of Helios+Foxp3–CD4+ T cells in indicated tissues of SPF and GF mice (n = 6, 1 of 2 experiments is shown). (E) Expression of Helios, CD62L, CD44, and CD69 in PP CD4+ T cells from SPF mice (n = 6). (F) TCR Vβ repertoire of Helios+Foxp3–CD4+ T cells (white) and Tregs (black) derived from PPs of SPF mice (n = 5, 1 of 2 experiments is shown). (G) Analysis of CD25, CTLA-4, and IL-10 in Helios+Foxp3–CD4+ T cells (red) and Tregs (black) from PPs of SPF mice (n = 3). (H) In vitro suppression assay of CD4+ T responder cells (Teff) in the presence of in vitro–generated Tregs or CD44+CD62L–Helios+Foxp3–CD4+ T cells (THel) enriched from PPs of DEREG mice. Data are representative of 2 (A–D and F) or 3 (E, G, and H) independent experiments. Error bars indicate mean ± SD. Data were analyzed using the Student’s t test; *P < 0.05, ***P < 0.001. Activated T lymphocytes, including Foxp3+ and Foxp3– T cell subsets, were shown to express the transcription factor Helios (17). Markedly increased frequencies (25%–35%) of Helios+Foxp3–CD4+ T cells were found in PPs compared with low frequencies (<10%) in other organs (Figure 1B). Microbiota-independent Helios+ CD4 T cells, as shown in GF or antibiotic-treated (ATB-treated) SPF mice, were mainly found in PPs and to a lesser extent in the siLP (Figure 1, C and D, and Supplemental Figure 1; supplemental material available online with this article; https://doi.org/10.1172/JCI98929DS1) and exhibited an antigen-experienced phenotype with high expression of CD44, CD69, and a low level of CD45RB and CD62L (Figure 1E and Supplemental Figure 2). As the role of Helios is controversial, we tested PP-derived Helios+Foxp3–CD4+ T cells for their regulatory function (18, 19). Although the usage of TCR Vβ chains was broad and similar to Tregs, these cells lacked expression of CD25, CTLA-4, and IL-10, all typically expressed by Tregs (Figure 1, F and G). Moreover, Helios+Foxp3–CD4+ PP T cells were not able to suppress proliferation of effector T cells (Figure 1H), did not secrete IL-4, IFN-γ, or IL-17 after polyclonal stimulation, and were distinct from a subgroup of latency-associated peptide–expressing (LAP-expressing) Tregs, shown to produce IL-10 and TGF-β (Supplemental Figure 3) (20). Helios+Foxp3–CD4+ T cells in PPs are activated by dietary antigens. As food is the major source of antigens in GF mice, and thus might explain the high frequency of Helios+Foxp3–CD4+ T cells, we assumed that this population should be affected if animals were kept on an antigen-free, elemental diet (ED). Low proliferation of PP CD4+ T cells in ED mice resulted in a vastly decreased frequency and number of Helios+Foxp3–CD4+ T cells as compared with animals kept on conventional diet (ConvD). Much less pronounced, but still affected by ED, was the number of Tregs in PPs despite unaltered frequencies (Figure 2, A–D). Figure 2 Helios+Foxp3–CD4+ T cells are food antigen–dependent. (A) Proliferation of PP CD4+ T cells (BrdU+) of mice kept on ConvD or ED was determined by flow cytometry (n = 3). (B) Frequency of Helios+Foxp3–CD4+ T cells in PPs of ED mice. (C) Absolute cell numbers of Helios+Foxp3–CD4+ T cells (left) and Tregs (right) in PPs of ConvD and ED mice (n = 5). (D) ConvD of SPF mice was switched to ED for 27 days and then back to ConvD. Frequencies of Tregs and Helios+Foxp3–CD4+ T cells in PPs refer to ConvD mice, set at 100% (n = 6). (E and F) SPF mice were fed ConvD or ED 27 days prior to analysis of Foxp3 and Helios (E) or total CD44+ T cell numbers within the PP CD4+ T cell population (F) (n = 6). Data are representative of 2 (D–F) or 3 (A–C) independent experiments. Error bars indicate mean ± SD. Data were analyzed using the Student’s t test; **P < 0.001, ***P < 0.001. With exception of the suckling period, the occurrence of Helios+Foxp3–CD4+ T cells in ConvD and their decline in ED mice was age independent (Supplemental Figure 4, A–C). To study kinetics of food antigen–dependent expansion of Foxp3–Helios+ and Foxp3+CD4+ T cells, ConvD was replaced by ED for 4 weeks and then switched to ConvD again. A gradual decline in the frequencies of Helios+Foxp3–CD4+ T cells in PPs was observed with the duration of antigen-free alimentation. These levels returned to normal after ED was replaced by ConvD. In contrast, frequencies of Foxp3+ Tregs were not altered by a change of diet (Figure 2D). Flow cytometric analysis of PP CD4+ T cells indicated that the frequency of activated CD44+Helios+Foxp3– T cells was affected by ED (Figure 2, E and F). The effect of dietary antigens on total PP CD4+ T cells was also seen in GF animals. GF mice fed ED showed further declined frequencies and total numbers of Helios+Foxp3–CD4+ T cells in the PPs, as compared with GF mice kept on ConvD. Of note, despite the unaltered frequency of the Foxp3+ population, the low intestinal cellularity in GF mice affected total numbers of Tregs, but not as much as the Helios+ non-Treg population (Supplemental Figure 5, A–C). We conclude that the intestinal cellularity is influenced by both microbiota and nutrition, but the expansion of Helios+Foxp3–CD4+ T cells is only dependent on dietary proteins. Dietary antigens mediate immunological maturation of the small intestine. We next investigated the long-term effects that lack of food antigens has on organ development. Macroscopic examination of animals fed ED showed a reduced diameter of the small intestinal tube with marginal PPs, whereas the spleen and colon were normal (Figure 3A). Immunohistological and FACS analysis of PPs revealed reduced numbers of CD4+ T cells in germinal centers (GCs) of ED mice, including PD-1+ Helios+ CXCR5+ Tfh cells (Figure 3, B–E and Supplemental Figure 6, A–C). Approximately one-third of Helios+ Foxp3– T cells expressed the Tfh marker CXCR5, whereas two-thirds remained CXCR5 negative (Supplemental Figure 6D). Figure 3 Food antigens are required for immunological maturation of the small intestine. (A) Macroscopic appearance of organs from animals kept on ConvD or ED for 4 generations. (B) Immunohistology of PPs from ConvD and ED mice stained for CD4 (red) and the germinal center marker GL7 (green) (n = 4). Germinal centers are outlined with dashed line. (C) Total numbers of CD4+ T and B cells in indicated organs of ConvD and ED mice (n = 6). (D) FACS analysis showing percentages of CXCR5hiPD-1hi Tfh cells within the PP CD4+ T cells of ConvD and ED mice. (E) Frequencies and total cell number of CXCR5hiPD-1hi Tfh cells in PPs of ConvD and ED mice (n = 6, 1 of 2 experiments is shown). (F) Frequencies of B220+ IgA+ cells in PPs of ConvD and ED mice (n = 4). (G) Small intestinal IgA concentrations of ConvD and ED mice were measured by ELISA (n = 4). Data are representative of 2 (A–G) independent experiments. Error bars indicate mean ± SD. Data were analyzed using the Student’s t test; *P < 0.05, **P < 0.01, ***P < 0.001. Despite unaltered frequencies of B and CD4+ T cells, lack of dietary antigens resulted in reduced absolute numbers of CD4+ T and B cells in PPs, mLNs, and siLP, but not in colon or spleen (Figure 3C and Supplemental Figure 7). In addition, PPs of ED animals contained considerably reduced numbers of activated B cells in the GC and diminished frequencies of IgA+ B lymphocytes. This explains the low amounts of secretory IgA in the small intestines of ED mice (Figure 3, F and G, Supplemental Figure 8). Importantly, normal thymic T cell development, together with unaltered T and B cell numbers in the spleen, demonstrated that food antigen deficiency does not disturb systemic lymphocyte development (Supplemental Figure 9) but specifically affects expansion and survival of lymphocytes within the small intestine. Helios induction by sustained TCR-restricted antigen stimulation. To investigate whether dietary antigens are recognized in a TCR-specific manner, we analyzed RAG-sufficient OT-II mice in which the vast majority of T cells expresses the OVA-specific Vα2+ TCR and a minor population of T cells, including diet-reactive T cells, expresses an endogenous Vα2–, polyclonal TCR that preferentially accumulated in PPs (Figure 4A). In the absence of OVA, most Vα2+ T cells were Helios–, whereas more than 10% of the Vα2– CD4+ T cells revealed a signature of food antigen activation in PPs but not in spleen or mLNs (Figure 4B). Correspondingly, OVA-supplemented drinking water triggered the expansion of Helios+ Foxp3– Vα2+ T cells in PPs (Figure 4C), but also in mLNs and spleen (data not shown). OVA-stimulated Vα2+ PP T cells differentiated into Helios+Foxp3– or Helios+Foxp3+ phenotypes, demonstrating that the majority of Vα2+ T cells expressed Helios independently of Foxp3 and only a small fraction differentiated into Helios+Foxp3+ Tregs (Figure 4D). In vitro studies further confirmed that Foxp3-independent induction of Helios expression requires recognition of cognate antigen (Supplemental Figure 10). Figure 4 Induction of Helios is TCR-specific. (A) Frequencies of Ova-specific TCR tg Vα2+ (white bars) and endogenous Vα2– (black bars) CD4+ T cells in indicated organs of naive OT-II RAG+/+ mice. (B) Frequencies of Helios+Foxp3–CD4+ T cells within the Vα2+ and Vα2– populations in indicated organs of naive OT-II RAG+/+ mice (n = 5). (C) Expression of Helios and Foxp3 in Vα2+ PP T cells without or after stimulation of OVA (1 mg/ml) for 5 days. (D) Kinetics of Helios and Foxp3 expression in Vα2+CD4 PP T cells of OT-II mice given 1 mg/ml OVA in drinking water for 5 days. Expression was analyzed by FACS at days 2, 10, and 23 after withdrawal of OVA (n = 4). Data are representative of 2 (C and D) or 3 (A and B) independent experiments. Error bars indicate mean ± SD. Data were analyzed using the Student’s t test; ***P < 0.001. These results show that induction of the Helios+Foxp3– phenotype requires TCR-mediated recognition of dietary antigens, with Vα2+ T cells being specifically activated by OVA but not by other dietary antigens, whereas Vα2– T cells react in the opposite way. Dietary antigen impact on the transcriptional profile of PP CD4+ T cells. Since stimulation with food antigens is crucial for the maturation of the intestinal immune system, we investigated the mRNA profile of PP CD4+ T cells in response to dietary antigens and their activation state. We wondered whether continuous exposure to dietary antigens leads to a phenotype of exhaustion similar to that described for chronic viral infections. In contrast to CD4+ T cells from chronic viral infection, the transcriptional signature of ConvD-activated CD4+ T cells was slightly skewed toward exhaustion. CD4+ T cells from ConvD mice expressed increased mRNA for Lag3, Icos, Pdcd1, and Tigit as compared with ED mice (Figure 5A). Figure 5 Transcriptional profiling of food antigen–dependent CD4+ T cells in PPs. (A) CD4+ T cells from PPs were sorted and analyzed by RNA sequencing. The gene expression signature of T cell exhaustion was compared between ConvD and ED mice. Each dot represents mean transcripts per million (TPM) ± SD for 6 mice per group. (B) Key gene TPM associated with Tfh function were transformed to Z scores and compared between ConvD and ED mice (6 mice per group). ASCL2 and Bcl6 target genes were investigated by Gene Set Enrichment Analysis (GSEA). (C and D) Genes identified by RNA sequencing of CD44+CD62L–Foxp3–CD4+ and CD44–CD62L+Foxp3–CD4+ T cells from PPs of ConvD mice were investigated by GSEA for enrichment of the oxidative phosphorylation pathway and apoptosis as defined in the KEGG database. NES, normalized enrichment score; FDR, false discovery rate. In accordance with our phenotypic analyses, the expression pattern of ConvD animals was markedly biased toward a Tfh cell signature, including transcripts for IL-21, Cxcr5, Bcl6, Pdcd1, and Ascl2. While Tfh cell differentiation may be controlled by a Bcl6- or Ascl2 gene-centered network, the latter network seems to apply to Tfh cell polarization by dietary antigens, as illustrated by positive gene association upon ConvD treatment (Figure 5B). Finally, we compared the transcriptional profile of activated (CD44+CD62L–Foxp3–) versus naive (CD44–CD62L+Foxp3–) CD4+ T cells in the PPs of ConvD mice. Gene enrichment analysis revealed a marked upregulation of genes that are associated with apoptosis and oxidative phosphorylation in activated CD4+ T cells as compared with their naive controls (Figure 5, C and D). In summary, these gene signatures show that not only the microbiota but also food antigens induce Tfh cells and further suggest that PP CD4+ T cells activated by dietary antigens are more prone to apoptosis than to exhaustion. Food-reactive PP T cells undergo apoptosis and trigger IL-10 production. To further examine the fate of food antigen–reactive Helios+Foxp3–CD4+ T cells, we first analyzed the expression of molecules required for cell survival. While the majority of CD4+ T cells in spleen and mLNs expressed the IL-7Rα (CD127), a substantial population of PP T cells, including most food protein–reactive T cells, downregulated this survival receptor (Figure 6, A and B). In addition, OX40 and Bcl-2, both essential for long-term survival of CD4+ T cells, were almost absent in food-reactive T cells but were strongly expressed in Tregs of PPs (Figure 6, C and D) (21). As lack of survival molecules is common in cells prone to apoptosis, we performed annexin V/PI staining for T and B cells of SPF and GF mice. Strong staining of annexin V was exclusively seen within CD4+ T but not B cells in PPs of SPF and GF mice (Figure 6E and Supplemental Figure 11, A and B). The apoptotic signature was mainly confined to food-activated CD44hiHelios+Foxp3–CD4+ T cells (Figure 6, F and G) and was significantly decreased in animals fed ED (Figure 6H). Figure 6 Food antigen–activated T cells undergo apoptosis in PPs. (A) Expression of CD127 on CD4+ T cells derived from mLNs (black) and PPs (red) of ConvD mice. (B) Flow cytometric analysis of CD127 and Helios in viable Foxp3–CD4+ T cells from PPs of ConvD mice. (C and D) Expression OX40 and Bcl-2 in Helios+Foxp3–CD4+ T cells (red) or Tregs (black) from PPs of Conv mice (n = 4). The filled area shows isotype control staining. (E) Frequencies of annexin V/PI+ CD4+ T cells in spleen, mLNs, siLP, and PPs of ConvD mice. (F) Frequencies of Helios+Foxp3– cells in annexin V+ and annexin V– CD4+ T cells sorted from PPs of ConvD mice (n = 4). (G) Annexin V staining of CD4+CD44hi and CD4+CD44lo CD4+ T cells from PPs of ConvD mice (n = 5). (H) Annexin V+ CD4+ T cells derived from PPs of ConvD and ED mice (n = 5). (I) Immunoblot analysis of sorted CD44hi and CD44lo CD4+ T cells from PPs of ConvD mice for cleavage of PARP and activation of caspases. Data are representative of 2 (F–I) or 3 (A–E) independent experiments. Results are expressed as mean ± SD. Data were analyzed using the Student’s t test; *P < 0.05; ***P < 0.001. To define the pathway of apoptosis, sorted CD44hiCD4+ and CD44loCD4+ T cells from PPs of ConvD animals were analyzed for cleavage of poly (ADP-ribose) polymerase (PARP) and caspase activation. Strong cleavage of PARP together with activation of caspase-3 and -8 but not caspase-9 were seen in CD44hi but not in CD44lo T cells (Figure 6I), suggesting that programmed cell death is the fate of diet-activated T cells in PPs of the healthy intestine. Ingestion of apoptotic cells has been shown to induce IL-10 and to inhibit proinflammatory cytokine production, thus preventing chronic inflammation or autoimmunity (22, 23). Thus, we tested whether apoptotic cells are linked with the induction of IL-10 in PPs. In contrast to spleen and mLNs, substantial amounts of IL-10 were produced by cultured cells of PPs. Importantly, IL-10 secretion by PP-derived cells was dependent on dietary antigens, as only marginal amounts of IL-10 were detectable in ED animals (Supplemental Figure 12, A and B). Further, cocultures of macrophages with lymphocytes from various organs revealed that uptake of T lymphocytes from PPs but not spleen or mLNs triggered macrophage-derived IL-10 synthesis. Secretion of IL-10 correlated with the amount of dead cells, as staurosporine pretreatment further enhanced this effect (Supplemental Figure 12C). Apoptosis of Helios+Foxp3–CD4+ T cells is controlled by PD-1. PD-1 is known to be an important regulator of T cell activation and apoptosis (24). We thus tested the expression of PD-1 on both Helios+ and Helios– T cell populations in the PPs. Flow cytometric analysis revealed selective expression of PD-1 in Helios+ but not Helios– PP T cells (Figure 7, A and B). Further, PD-1 ligands PDL-1 and PDL-2 were found to be predominantly expressed on CD11b+ and CD11c+ APCs of the PPs (Figure 7C). Figure 7 Anti–PD-1 treatment activates proinflammatory T cell responses in PPs. (A and B) Expression of PD-1 in Helios–Foxp3– and Helios+Foxp3–CD4+ PP T lymphocytes (n = 6). (C) Expression of PD-L1 and PD-L2 in Cd11b+ (green) and Cd11c+ (red) APCs as well as in CD4+ T cells (blue) was analyzed by FACS. One representative of 3 similar experiments is shown. Numbers indicate the geometric mean fluorescence intensity (MFI) of PD-L1 and PD-L2. (D and E) Impact of in vivo anti–PD-1 treatment on IFN-γ+ and annexin V+ CD4+ T cells in PPs of ConvD mice. (F) Effects of in vitro anti–PD-1 treatment on IFN-γ expression in PP CD4+ T cells. PP cell cultures were treated as described in Methods and the frequency of IFN-γ+ CD4+ T cells was analyzed by FACS. Data are representative of 3 experiments (A–F). Error bars indicate mean ± SD. Data were analyzed using the Student’s t test; ***P < 0.001. Next, we determined whether PD-1 signaling controls the response of PP CD4+ T cells. To this end, we either injected PD-1–blocking antibodies or isotype controls into normal C57BL/6 mice i.p. or added anti–PD-1 antibodies directly into PP cell cultures. Polyclonal stimulation of PP cell suspensions revealed that anti–PD-1 treatment but not isotype control rescues PP CD4+ T cells from apoptosis to become IFN-γ–secreting effector cells (Figure 7, D–F). In inflammatory bowel disease, such as Crohn’s disease (CD), a variety of models have been used, including the IL-10–KO mouse which develops inflammatory reactions closest to CD (25). We wondered whether modulation of the PD-1 pathway leads to disease progression in IL-10–deficient mice. In contrast to WT controls, IL-10–KO mice treated with anti–PD-1 mAb developed severe colitis, accompanied by enhanced cellularity of T cells and increased numbers of IFN-γ+CD4+ T cells in the PPs (Supplemental Figure 13, A–D). Although these data suggest that PD-1 immune checkpoint blockade in the absence of IL-10 favors colitis development, the precise contribution of PP Helios+CD4+ T cells remains unclear. Reduced apoptosis of PP T cells in patients with IBD. Finally, we investigated the apoptotic behavior of human PP CD4+ T cells in healthy controls and patients with CD. Biopsies from PPs of the terminal ileum were taken with written consent from persons who had undergone routine intestinal health surveillance or patients with clinically diagnosed CD. The latter group was selected for discrete inflammation of the colon and/or ileum, whereas none of the controls showed signs of inflammation (Supplemental Table 1). To assure that T cells were derived from PPs, lymphocytes were stained and gated for expression of the germinal center marker GL7 prior to further analysis. While approximately 40% of the CD4+ GL7 + PP T cells from healthy controls were annexin V+, patients with CD revealed significantly lower frequencies of apoptotic PP T cells (approximately 22%) (Figure 8, A and B). Increased survival of PP T cells in CD was reflected by enhanced expression of Bcl-2 in viable cells (Figure 8C). Consistent with the finding that Helios marks CD4+ T cells undergoing programmed cell death with subsequent downregulation of Bcl-2 (26, 27), the expression of Helios in Foxp3–CD4+ T cells from PPs of patients with CD was significantly reduced as compared with healthy controls (Figure 8D). These data suggest that high apoptosis of PP CD4+ T cells is a homeostatic mechanism of the healthy gut. Figure 8 Analysis of CD4+ T cells from human Peyer patches. (A) Representative histogram of annexin V staining for GL7+CD4+ T cells derived from PPs of patients with Crohn’s disease (CD) and healthy controls. (B) Frequencies of annexin V+/PI+GL7+ CD4+ T cells in PPs. (C) Expression of Bcl2 on PP CD4+ T cells. (D) Percentages of Helios+Foxp3–PP CD4+ T cells. Results are expressed as mean ± SEM; n = 9 per healthy group and n = 8–9 per CD group. Data were analyzed using Mann-Whitney U test; **P < 0.01, ***P < 0.001. Discussion Although the value of nutritional treatment in patients with IBD was first reported over 30 years ago, a poor understanding of immunological mechanisms hinders both acceptance and use of medical diets (28, 29). From an immunological point of view, diet contains components of potential antigenicity that the immune system should not actively challenge. Accordingly, several studies have demonstrated that exposure to dietary antigens results in the generation of Tregs. However, the phenotype and fate of food-reactive T cells in the inductive tissue sites have received little attention. Antigen sampling of the luminal content of the gut is a prerequisite for monitoring both harmless and harmful antigens, and for responding appropriately. In the small intestine, efficient encounter between APCs and antigen-specific T cells takes place in specialized secondary lymphoid organs, that is, mLNs and PPs. Particularly, M cells and the follicle-associated epithelium (FAE) of PPs have been shown to efficiently take up and transport antigens from the gut lumen to immune-inductive sites of PPs (30, 31). Our search for diet-activated T cells in gut-associated and systemic lymphoid tissues revealed an unusually high frequency of activated CD44+Helios+Foxp3–CD4+ T cells exclusively in PPs of SPF and GF mice, indicating that activation was mediated by dietary rather than microbial antigens. This finding is in accordance with a previous observation that antigen-experienced T cells naturally accumulate in PPs but not mLNs with age, suggesting that these cells received antigenic stimulation directly in PPs and not in other sites of the intestine. Only a small proportion of these PP-resident CD62L–CD4+ cells were follicular helper T cells (Tfh) or Tregs (32). In contrast, Tregs became a prominent population in the siLP after weaning of GF animals to ConvD, and alimentation with ED prevented the development of Tregs in the siLP (10). Preferential expansion of pTregs in the siLP and Helios+Foxp3–CD4+ T cells in PPs seems to reflect the distinct morphology of both tissue sites. In PPs, the majority of DCs express CCR6 and recruit antigen from the subepithelial dome (SED) region before clustering with antigen-specific CD4+ T cells in the PPs but not in LP, supporting their selective role in intestinal-inductive sites (33). In contrast, the majority of LP DCs express CX3CR1, are CD103+, and capture antigen from the intestinal lumen via transepithelial dendrites (34). In the presence of TGF-β and retinoic acid, LP-derived CD103+CD11b+ DCs have been shown to efficiently induce Foxp3+ Tregs (35, 36). Surprisingly, their role in mediating oral tolerance still remains enigmatic, as oral tolerance was intact in CD11b– DC-deficient animals with strongly reduced pTregs (11). We here describe a population of ConvD-activated CD44+Helios+Foxp3–CD4+ T cells in PPs that is distinct from pTregs, although they express Helios, a marker recently used for differentiation between natural and inducible Foxp3+ Tregs (37). Since transient expression of Foxp3 has been described (38), there is a possibility that food-reactive CD44+Helios+Foxp3–CD4+ PP T cells may have originated from an “exFoxp3” population. Such reprogramming is highly unlikely as the frequency of Foxp3+ Tregs in PPs was not affected by the type of diet, whereas the Helios+Foxp3– population expanded or shrank in the presence or absence of dietary antigens, respectively. The mechanism of Foxp3-independent Helios expression and its function in activated PP CD4+ T cells remains unresolved. Autonomous expression of Helios has been described during differentiation and activation of CD4+ T cells, for Tfh cells and autoreactive T cells undergoing apoptosis (27, 39). It is notable that oral antigen uptake preferentially induces IL-27 and IL-10 in PP DCs, both cytokines exhibiting antiinflammatory properties (40, 41). Correspondingly, we observed that lack of dietary protein vastly decreased the number of Helios+CD4+ T cells and the amount of IL-10 in PPs. Although we were unable to directly track food-reactive T cells in normal mice, analysis of OT-II animals revealed TCR-specific recognition of dietary antigens. Oral uptake of OVA induced the Helios+Foxp3– phenotype within the TCR-transgenic Vα2+ population, whereas normal chow induced Helios in the endogenous Vα2–CD4+ T cell population within PPs. An important consequence of food antigen recognition by the intestinal immune system is the cellular and functional maturation of the small intestine. In the absence of food antigens, a low amount of IgA together with reduced numbers of B and T cells, including Tfh cells, assigns a new and essential aspect to dietary proteins aside from nutrition; that is, their antigenicity is required for normal development and function of the small intestine. Because the accumulation of diet-specific T cells in PPs might cause severe immunopathology if their activity and lifespan remain uncontrolled, we investigated the fate of these cells. In accordance with the downregulation of survival molecules, an exceptionally high level of apoptotic cells was found within the PPs. This increase was confined to the activated CD44+Helios+Foxp3–CD4+ T cell population and was decreased in ED animals, suggesting that caspase-3–mediated apoptosis of diet-activated T cells is a default mechanism, which warrants intestinal homeostasis. Helios+Foxp3–CD4+ PP T cells expressed high levels of PD-1, a molecule known to fine tune the fate and the function of T cells (42). We observed that anti–PD-1 treatment of PP T cells triggered IFN-γ production and simultaneously reduced the frequencies of apoptotic CD4+ T cells, indicating that PD-1 blockade rescues dysfunctional T cells from cell death. Interestingly, in the absence of IL-10, blocking of PD-1 favored development of colitis in these mice. Numerous reports show that colitis development remains a complication after treatment of cancer patients with an anti–PD-1 checkpoint inhibitor (43–45). In line with our murine data, we found that PP CD4+ T cells from healthy donors but not patients with CD revealed a substantially increased frequency of apoptotic T cells with high expression of Helios and low expression of Bcl2. Although we have not yet identified the precise mechanisms for enhanced survival of PP CD4+ T cells in patients with IBD, disturbed apoptosis might explain food antigen–specific immune responses in patients with CD, which were ameliorated by restricting dietary antigens (3). In this context, clinical observations have suggested lymphoid follicles as the initial site of inflammation in patients with CD, and that peak frequency of CD correlates with peak number of PPs at an age between 15 and 25 years (46–48). Here, we present an approach that combines murine and human studies for characterization of intestinal immune responses against dietary antigens. Our data suggest that apoptosis of PP lymphocytes is a hallmark of the healthy intestine, which eliminates potentially harmful food-reactive T cells and triggers the production of local IL-10. Reduced apoptosis of PP T cells in patients with CD might explain the beneficial effects of ED by depriving these T cells of their antigenic stimulus. These questions underline the importance of further investigating the molecular and cellular mechanisms of increased survival of PP T cells in patients with CD. Methods Animals. C57BL/6 mice were purchased from Charles River Laboratories and kept under specific pathogen–free (SPF) conditions. DEREG mice were provided by Tim Sparwasser (Institute of Infection Immunology, Hannover, Germany). IL10–/– mice, OT-II, and GF C57BL/6 mice were bred at the animal facilities at the University of Marburg. GF mice generated via rederivation through cesarean section were a gift of Petra Kirsch (University of Ulm). GF animals were kept in plastic isolators (Metall and Plastik) with autoclaved food, bedding, and water. Sterility of animals was checked biweekly by culturing feces in thioglycollate medium under aerobic and anaerobic conditions for at least 10 days. All handling procedures for GF mice were conducted in a laminar flow hood under sterile conditions. Antibiotic sterilization of mice. To deplete the commensal gut microbiota, 6- to 8-week-old ConvD mice were transferred to sterile cages and orally treated with antibiotic cocktail (1 g/l ampicillin, 0.5 g/l vancomycin, 1 g/l metronidazole, 0.25 g/l imipenem, and 0.2 g/l ciprofloxacin) for 8 weeks according to a standard protocol (49). Bottles with antibiotic-containing drinking water were replaced once per week. The intestinal microbial status was tested weekly by culturing fecal samples under aerobic and anaerobic conditions in thioglycollate broth. Animal nutrition. C57BL/6 mice (SPF and GF) at 6–20 weeks of age were used. The ConvD group were kept on a conventional chow (LASQCdietRod16, LASvendi) and food antigen–free, ED mice were kept on an amino acid–containing diet for up to 5 generations. Pellets of ED diet (ssniff, S7242-E014/-E714) contained all essential vitamins, minerals, trace elements, fat, dextrin, sucrose, and free amino acids equimolar to the protein content of normal rodent chow. In summary, the ED pellets contained 20% corn starch, 44% sucrose, 7% cellulose, 17.5% amino acid mixture, 1% vitamin premix w/o choline, 5% mineral trace element premix, 0.2% choline Cl, 02% sodium bicarbonate, 0.02% butylated hydroxytoluene, 5% corn oil. Oral administration of OVA. The drinking water was supplemented with 1 mg/ml OVA (Sigma-Aldrich) for low-dose OVA application. OVA-supplemented water was given to OT-II animals for 5 or 7 days prior to analysis. Isolation of lamina propria mononuclear cells. Single-cell suspensions were performed from spleen, mLNs, and PPs by mechanical disruption and passage through filter (Milteny Biotec). Lamina propria mononuclear cells (LPMCs) of the colon and small intestine were isolated after enzymatic digestion of intestinal tissue pieces with collagenase D and collagenase VIII (MilliporeSigma, 0.4 mg/ml each). Cells were purified by Percoll gradient (40%/70 %). LPMCs were collected from the interphase, washed, and resuspended in complete medium. Small intestinal IgA. The complete small intestine was flushed with 5 ml PBS/2% milk powder, and the intestinal liquid was collected, homogenized, and centrifuged (850g, 30 minutes). Supernatants were used for IgA ELISA. In brief, flat-bottom 96-well plates (NUNC) were coated with rabbit–anti-mouse IgA (Rockland) overnight. After blocking with PBS/10% FCS, 50 μl intestinal liquid was incubated for 3 hours at 4°C, washed twice, and IgA was detected by adding the secondary rabbit–anti-mouse IgA HRP and TMB (R&D Systems). The enzymatic reaction was stopped by the addition of sulphuric acid and absorption was measured with an ELISA Reader (FLUOstar Omega, BMG Labtech). IL-10 ELISA. Single-cell suspensions from PPs, mLNs, and spleen of Conv and ED mice were cultured at a density of 2 × 10⁶ cells/200 μl RPMI medium in round-bottom 96-well tissue-culture plates for 24 hours. The next day, cell-culture supernatants were collected and IL-10 secretion was measured using a murine IL-10 ELISA kit (BD Bioscience) according to the manufacturer’s instructions. Antibodies, reagents, and staining methods. The following antibodies were obtained from eBioscience unless otherwise stated: anti-CD4 (RM4-5, BioLegend), anti-CD127 (A7R34), anti-CD62L (MEL-14), anti-CD44 (IM7, BD Biosciences), anti-CD25 (PC61.5), anti-Vα2 (B20.1), anti-B220 (RA3-6B2, BD Biosciences), anti-CD69 (H1.2F3), anti–CTLA-4 (UC10-4F10-11, BD Biosciences), anti-OX40 (OX-86), anti-CXCR5 (2G8, BD Biosciences), TCR Vβ screening panel (BD Biosciences), anti-Bcl2 (10C4), anti–PD-L1 (MIH7, BioLegend), and anti–PD-L2 (catalog 122). Anti-CD279 (anti–PD-1, clone J43) for in vivo application was purchased from Höltzel diagnostika. Detection of apoptotic cells was performed with annexin-V–FLUOS staining kit (Roche Applied Science). For intracellular cytokine staining, PP cells were stimulated for 4 hours with PMA (50 ng/ml) and ionomycin (750 ng/ml) in the presence of Brefeldin A (5 μg/ml, MilliporeSigma). Subsequently, cells were stained with anti-CD4, fixed, and permeabilized in 0.3 % saponine buffer before staining for cytokines. Intracellular staining was performed for anti–IL-10 (JES5-16E3). Foxp3- and Helios-expressing cells were routinely detected by Foxp3 staining kit (eBioscience), anti-Foxp3 (FJK-16s), and anti-Helios (22F6). Cells were analyzed by flow cytometry using the FlowJo software (Tree Star). RNA-Seq and bioinformatical analysis. RNA was purified from sorted PP CD4+ T cells of ConvD and ED mice with the RNeasy Plus Micro Kit according to the manufacturer’s protocol (Qiagen). RNA was quantified with a Qubit 2.0 fluorometer (Invitrogen) and the quality was assessed on a Bioanalyzer 2100 using an RNA 6000 Pico chip (both from Agilent). Samples with an RNA integrity number (RIN) of greater than 8 were used for library preparation. Barcoded mRNA-Seq cDNA libraries were prepared from 10 ng total RNA using NEBNext Poly(A) mRNA Magnetic Isolation Module and NEBNext Ultra II RNA Library Prep Kit for Illumina (New England Biolabs) according to the manual. Quantity was assessed using Invitrogen’s Qubit HS assay kit and library size was determined using Agilent’s 2100 Bioanalyzer HS DNA assay. Barcoded RNA-Seq libraries were onboard clustered using HiSeq Rapid SR Cluster Kit v2 using 8 pM, and 59 bps were sequenced on the Illumina HiSeq2500 using HiSeq Rapid SBS Kit v2 (59 cycle). The raw output data of the HiSeq were preprocessed according to the Illumina standard protocol. After initial quality assessment with the FastQC software (available online at http://www.bioinformatics.babraham.ac.uk/projects/fastqc/), raw output fastq sample files were trimmed and mapped with the Qiagen CLC Workbench v. 10.0.1, using the murine genome version GRCm38. Total read counts were further processed in R, using the DeSeq2 package to compute differential gene expression and adjusted P values. Normalized read counts were ranked and investigated for pathway-specific enrichment by GSEA (available online at http://software.broadinstitute.org/gsea/index.jsp) and were used for graphic representation of differential expression. The RNA-Seq microarray data were deposited in the NCBI’s Gene Expression Omnibus database (GEO GSE124286) and are available at https://www.ncbi.nlm.nih.gov/geo/query/acc.cgi?acc=GSE124286 Anti–PD-1 treatment of mice and cell cultures. WT and IL-10–deficient mice (C57BL/6 background) were administered 100 μg anti–PD-1 Ab (clone J43, Hölzel diagnostika) i.p. on days 0, 4, 8, and 12. As isotype control, animals were injected with 100 μg polyclonal Armenian hamster IgG (Hölzel diagnostika). On day 15, mice were analyzed for signs of inflammation and intestinal CD4+ T cells were collected and analyzed for apoptosis and cytokine expression by flow cytometry. For in vitro studies, 3 μg/ml anti–PD-1 mAb together with 2.5 μg/ml anti-CD3/CD28 were added to single-cell suspensions from PPs. After 3 days of culture, cells were stimulated for 4 hours with PMA/ionomycin in the presence of Brefeldin A and analyzed by FACS. Human Peyer patch T cells. Cells from PP biopsies were isolated by mechanical dissociation through 100-μm and 40-μm cell strainers. The strainers were washed with RPMI 1640 plus 1% Pen/Strep plus 10% FCS (Life Technologies, Gibco) and cells were centrifuged at 400g for 10 minutes at 4°C and resuspended in PBS (Life Technologies, Gibco) for flow cytometric analyses. For surface staining, fluorochrome-conjugated antibodies CD4 (RPA-T4) and GL7 were added and incubated for 15 minutes at 4°C. For the annexin V staining, cells were resuspended in binding buffer and stained with annexin V and 7-AAD (Annexin V Apoptosis Detection Kit, eBioscience). For intracellular staining of cytokines and transcription factors (Bcl2 [100/D5+124], Foxp3 [PCH101], and Helios [22F6]), cells were fixed, permeabilized, and stained using the Foxp3 staining kit (eBioscience). Flow cytometry analysis was performed on a FACS Canto II (BD Bioscience). Data were analyzed with FlowJo analysis software. Treg suppression assay. Suppressive properties of Tregs and CD4+Helios+Foxp3– cells from PPs were compared. CD4+GFP– responder T cells from spleen and enriched Helios-expressing CD4+GFP–CD44+CD62L– T cells were sorted from PPs of DEREG mice. As positive control, iTregs were generated from sorted naive CD4+ T cells of DEREG mice. In brief, cells were activated by plate-bound anti-CD3 (5 μg/ml; 145-2C11) and soluble anti-CD28 (1 μg/ml; 37.51) in the presence of IL-2 (50 U/ml, Novartis), TGF-β1 (2 ng/ml, R&D Systems), anti–IL-4 (10% culture supernatant of clone 11B11), and anti–IFN-γ (5 μg/ml, XMG1-2) for 3 days. Responder T cells were labeled with CFSE and cocultured for 3 days with Tregs or Helios-expressing T cells from PPs in the presence of 1 μg/ml soluble anti-CD3 (clone 145-2C11) and irradiated T cell–depleted splenocytes. Proliferative responses of responder cells were analyzed by FACS. BrdU incorporation assay. To label proliferating cells in vivo, 1 mg BrdU (Sigma-Aldrich) in 200 μl PB was injected i.p. and animals were subsequently supplied with BrdU (0.8 mg/ml) in drinking water for 5 days. Cell suspensions were stained with anti-CD4 and anti-BrdU (eBioscience). The percentage of BrdU+ T cells was assessed by FACS. Western blot analysis. CD44+ and CD44– T lymphocytes were sorted from PPs of C57BL/6 mice and lysed directly in 4× Laemmli sample buffer (with 5% ß-mercaptoethanol). Proteins were separated by SDS-PAGE and transferred to nitrocellulose membrane. The following antibodies were used for immunoblot analysis: anti-GAPDH as loading control, mouse anti-PARP, rabbit anti–caspase-3, mouse anti–caspase-8, and rabbit anti–caspase-9 (Cell Signaling Technology). Immunofluorescence analysis. Tissue samples were snap frozen in methylbutane cooled with liquid nitrogen. Cryosections of about 5 μm were made with a Frigocut 2800E (Leica), air-dried, and incubated for 20 minutes in ice-cold acetone and stored at –20°C or washed 3 times with PBST for immunostaining. Following incubation in antibody diluent (Dako), samples were incubated with primary antibodies for 2 hours at room temperature followed by washing 3 times in PBST. The following primary antibodies were used: anti-mouse CD4–Alexa Fluor 646 (BioLegend) and anti-mouse GL7-FITC (BD Biosciences). Confocal images of cryosections were acquired by fluorescence microscopy on a Leica TCS SP2 microscope (Leica Microsystems). Statistics. Statistical analysis was performed using Prism software (GraphPad Software). Results are generally expressed as the mean ± SEM. Data were analyzed using the Student’s t test or Mann-Whitney U test as indicated. Values with P less than or equal to 0.05 were considered statistically significant. Study approval. All patients gave written consent after approval by the Charité ethics committee (EA4/097/14). All animal experiments were conducted in accordance with German animal protection laws and were approved by the RP-Giessen (MR 20/6 1/2018 and EX7-2015). Author contributions US and AV directed and designed the experiments and analyzed the data. PWB, OP, ML, and BS gave scientific advice and critically read the manuscript. AV, SH, ML, HR, RR, and FF performed the animal experiments and in vitro studies. RJ and AP performed the histological analysis. HM, WB, and MK performed and evaluated RNA-Seq experiments. KR performed the molecular and biochemical studies. YRS, RG, and BS conducted the human studies. US and AV wrote the manuscript. Supplemental material View Supplemental data Acknowledgments We thank Anne Hellhund and Carrie Anderson for expert technical help and Guido Schemken, Hosam Shams-Eldin, and Claudia Trier for the animal care. We thank Allan Mowat and Ayse Kilic for discussion and critical reading of the manuscript. Parts of this work were funded by BMBF (Federal Ministry of Education and Research, JPI-AMR – FKZ 01Kl1702; ERACoSysMed2 – SydMed-COPD – FKZ 031L0140) and DFG (German Research Foundation, SFB/TR-84 TP C01) to BS. This study was supported by the von Behring-Röntgen-Stiftung (66-0008) and the DFG Priority Programm to US (STE 776/3-1) and BS (SI 749/9-1). Footnotes Conflict of interest: The authors have declared that no conflict of interest exists. Copyright: © 2019, American Society for Clinical Investigation. Reference information: J Clin Invest. https://doi.org/10.1172/JCI98929. References Brandtzaeg P. Food allergy: separating the science from the mythology. Nat Rev Gastroenterol Hepatol. 2010;7(7):380–400. View this article via: PubMed CrossRef Google Scholar Pabst O, Mowat AM. Oral tolerance to food protein. Mucosal Immunol. 2012;5(3):232–239. View this article via: PubMed CrossRef Google Scholar Kawaguchi T, et al. Food antigen-induced immune responses in Crohn’s disease patients and experimental colitis mice. J Gastroenterol. 2015;50(4):394–405. View this article via: PubMed CrossRef Google Scholar Nakahigashi M, Yamamoto T, Sacco R, Hanai H, Kobayashi F. Enteral nutrition for maintaining remission in patients with quiescent Crohn’s disease: current status and future perspectives. Int J Colorectal Dis. 2016;31(1):1–7. View this article via: PubMed CrossRef Google Scholar Assor E, Marcon MA, Hamilton N, Fry M, Cooper T, Mahmud FH. Design of a dietary intervention to assess the impact of a gluten-free diet in a population with type 1 Diabetes and Celiac Disease. BMC Gastroenterol. 2015;15:181. View this article via: PubMed Google Scholar Groetch M, Nowak-Wegrzyn A. Practical approach to nutrition and dietary intervention in pediatric food allergy. Pediatr Allergy Immunol. 2013;24(3):212–221. View this article via: PubMed CrossRef Google Scholar Chen Y, Kuchroo VK, Inobe J, Hafler DA, Weiner HL. Regulatory T cell clones induced by oral tolerance: suppression of autoimmune encephalomyelitis. Science. 1994;265(5176):1237–1240. View this article via: PubMed CrossRef Google Scholar Chen Y, Inobe J, Marks R, Gonnella P, Kuchroo VK, Weiner HL. Peripheral deletion of antigen-reactive T cells in oral tolerance. Nature. 1995;376(6536):177–180. View this article via: PubMed CrossRef Google Scholar Friedman A, Weiner HL. Induction of anergy or active suppression following oral tolerance is determined by antigen dosage. Proc Natl Acad Sci U S A. 1994;91(14):6688–6692. View this article via: PubMed CrossRef Google Scholar Kim KS, et al. Dietary antigens limit mucosal immunity by inducing regulatory T cells in the small intestine. Science. 2016;351(6275):858–863. View this article via: PubMed CrossRef Google Scholar Esterházy D, Loschko J, London M, Jove V, Oliveira TY, Mucida D. Classical dendritic cells are required for dietary antigen-mediated induction of peripheral T(reg) cells and tolerance. Nat Immunol. 2016;17(5):545–555. View this article via: PubMed CrossRef Google Scholar Fujihashi K, et al. Peyer’s patches are required for oral tolerance to proteins. Proc Natl Acad Sci U S A. 2001;98(6):3310–3315. View this article via: PubMed CrossRef Google Scholar Kraus TA, et al. Induction of mucosal tolerance in Peyer’s patch-deficient, ligated small bowel loops. J Clin Invest. 2005;115(8):2234–2243. View this article via: JCI PubMed CrossRef Google Scholar Mucida D, Kutchukhidze N, Erazo A, Russo M, Lafaille JJ, Curotto de Lafaille MA. Oral tolerance in the absence of naturally occurring Tregs. J Clin Invest. 2005;115(7):1923–1933. View this article via: JCI PubMed CrossRef Google Scholar Song F, et al. The Peyer’s patch is a critical immunoregulatory site for mucosal tolerance in experimental autoimmune encephalomylelitis (EAE). J Autoimmun. 2008;30(4):230–237. View this article via: PubMed CrossRef Google Scholar Chung H, et al. Gut immune maturation depends on colonization with a host-specific microbiota. Cell. 2012;149(7):1578–1593. View this article via: PubMed CrossRef Google Scholar Akimova T, Beier UH, Wang L, Levine MH, Hancock WW. Helios expression is a marker of T cell activation and proliferation. PLoS One. 2011;6(8):e24226. View this article via: PubMed CrossRef Google Scholar Bilate AM, Lafaille JJ. Induced CD4+Foxp3+ regulatory T cells in immune tolerance. Annu Rev Immunol. 2012;30:733–758. View this article via: PubMed CrossRef Google Scholar Gottschalk RA, Corse E, Allison JP. Expression of Helios in peripherally induced Foxp3+ regulatory T cells. J Immunol. 2012;188(3):976–980. View this article via: PubMed CrossRef Google Scholar Scurr M, et al. Highly prevalent colorectal cancer-infiltrating LAP+ Foxp3+ T cells exhibit more potent immunosuppressive activity than Foxp3+ regulatory T cells. Mucosal Immunol. 2014;7(2):428–439. View this article via: PubMed CrossRef Google Scholar Rogers PR, Song J, Gramaglia I, Killeen N, Croft M. OX40 promotes Bcl-xL and Bcl-2 expression and is essential for long-term survival of CD4 T cells. Immunity. 2001;15(3):445–455. View this article via: PubMed CrossRef Google Scholar Chung EY, et al. Interleukin-10 expression in macrophages during phagocytosis of apoptotic cells is mediated by homeodomain proteins Pbx1 and Prep-1. Immunity. 2007;27(6):952–964. View this article via: PubMed CrossRef Google Scholar Voll RE, Herrmann M, Roth EA, Stach C, Kalden JR, Girkontaite I. Immunosuppressive effects of apoptotic cells. Nature. 1997;390(6658):350–351. View this article via: PubMed CrossRef Google Scholar Sharpe AH, Pauken KE. The diverse functions of the PD1 inhibitory pathway. Nat Rev Immunol. 2018;18(3):153–167. View this article via: PubMed Google Scholar Scheinin T, Butler DM, Salway F, Scallon B, Feldmann M. Validation of the interleukin-10 knockout mouse model of colitis: antitumour necrosis factor-antibodies suppress the progression of colitis. Clin Exp Immunol. 2003;133(1):38–43. View this article via: PubMed CrossRef Google Scholar Rebollo A, Schmitt C. Ikaros, Aiolos and Helios: transcription regulators and lymphoid malignancies. Immunol Cell Biol. 2003;81(3):171–175. View this article via: PubMed CrossRef Google Scholar Daley SR, Hu DY, Goodnow CC. Helios marks strongly autoreactive CD4+ T cells in two major waves of thymic deletion distinguished by induction of PD-1 or NF-κB. J Exp Med. 2013;210(2):269–285. View this article via: PubMed CrossRef Google Scholar O’Moráin C, Segal AW, Levi AJ. Elemental diet as primary treatment of acute Crohn’s disease: a controlled trial. Br Med J (Clin Res Ed). 1984;288(6434):1859–1862. View this article via: CrossRef Google Scholar Hunter J. Elemental diet and the nutritional treatment of Crohn’s disease. Gastroenterol Hepatol Bed Bench. 2015;8(1):4–5. View this article via: PubMed Google Scholar Kunkel D, Kirchhoff D, Nishikawa S, Radbruch A, Scheffold A. Visualization of peptide presentation following oral application of antigen in normal and Peyer’s patches-deficient mice. Eur J Immunol. 2003;33(5):1292–1301. View this article via: PubMed CrossRef Google Scholar Nagata S, et al. Human Peyer’s patch T cells are sensitized to dietary antigen and display a Th cell type 1 cytokine profile. J Immunol. 2000;165(9):5315–5321. View this article via: PubMed CrossRef Google Scholar Ugur M, Schulz O, Menon MB, Krueger A, Pabst O. Resident CD4+ T cells accumulate in lymphoid organs after prolonged antigen exposure. Nat Commun. 2014;5:4821. View this article via: PubMed Google Scholar Salazar-Gonzalez RM, et al. CCR6-mediated dendritic cell activation of pathogen-specific T cells in Peyer’s patches. Immunity. 2006;24(5):623–632. View this article via: PubMed CrossRef Google Scholar Niess JH, et al. CX3CR1-mediated dendritic cell access to the intestinal lumen and bacterial clearance. Science. 2005;307(5707):254–258. View this article via: PubMed CrossRef Google Scholar Coombes JL, et al. A functionally specialized population of mucosal CD103+ DCs induces Foxp3+ regulatory T cells via a TGF-beta and retinoic acid-dependent mechanism. J Exp Med. 2007;204(8):1757–1764. View this article via: PubMed CrossRef Google Scholar Sun CM, et al. Small intestine lamina propria dendritic cells promote de novo generation of Foxp3 T reg cells via retinoic acid. J Exp Med. 2007;204(8):1775–1785. View this article via: PubMed CrossRef Google Scholar Thornton AM, et al. Expression of Helios, an Ikaros transcription factor family member, differentiates thymic-derived from peripherally induced Foxp3+ T regulatory cells. J Immunol. 2010;184(7):3433–3441. View this article via: PubMed CrossRef Google Scholar Miyao T, et al. Plasticity of Foxp3(+) T cells reflects promiscuous Foxp3 expression in conventional T cells but not reprogramming of regulatory T cells. Immunity. 2012;36(2):262–275. View this article via: PubMed CrossRef Google Scholar Serre K, et al. Helios is associated with CD4 T cells differentiating to T helper 2 and follicular helper T cells in vivo independently of Foxp3 expression. PLoS One. 2011;6(6):e20731. View this article via: PubMed CrossRef Google Scholar Diveu C, et al. IL-27 blocks RORc expression to inhibit lineage commitment of Th17 cells. J Immunol. 2009;182(9):5748–5756. View this article via: PubMed CrossRef Google Scholar Fitzgerald DC, et al. Suppression of autoimmune inflammation of the central nervous system by interleukin 10 secreted by interleukin 27-stimulated T cells. Nat Immunol. 2007;8(12):1372–1379. View this article via: PubMed CrossRef Google Scholar Keir ME, Butte MJ, Freeman GJ, Sharpe AH. PD-1 and its ligands in tolerance and immunity. Annu Rev Immunol. 2008;26:677–704. View this article via: PubMed CrossRef Google Scholar Bertha M, Bellaguara E, Kuzel T, Hanauer S. Checkpoint inhibitor-induced colitis: a new type of inflammatory bowel disease? ACG Case Rep J. 2017;4:e112. View this article via: PubMed Google Scholar Chen JH, Pezhouh MK, Lauwers GY, Masia R. Histopathologic features of colitis due to immunotherapy with anti-PD-1 antibodies. Am J Surg Pathol. 2017;41(5):643–654. View this article via: PubMed CrossRef Google Scholar Kim J, et al. Anti-PD-1 induced colitis: a case series of 25 patients. Gastroenterology. 2017;152(5):S811. Fujimura Y, Kamoi R, Iida M. Pathogenesis of aphthoid ulcers in Crohn’s disease: correlative findings by magnifying colonoscopy, electron microscopy, and immunohistochemistry. Gut. 1996;38(5):724–732. View this article via: PubMed CrossRef Google Scholar Fujimura Y, Hosobe M, Kihara T. Ultrastructural study of M cells from colonic lymphoid nodules obtained by colonoscopic biopsy. Dig Dis Sci. 1992;37(7):1089–1098. View this article via: PubMed CrossRef Google Scholar Van Kruiningen HJ, Ganley LM, Freda BJ. The role of Peyer’s patches in the age-related incidence of Crohn’s disease. J Clin Gastroenterol. 1997;25(2):470–475. View this article via: PubMed CrossRef Google Scholar Rakoff-Nahoum S, Paglino J, Eslami-Varzaneh F, Edberg S, Medzhitov R. Recognition of commensal microflora by toll-like receptors is required for intestinal homeostasis. Cell. 2004;118(2):229–241. View this article via: PubMed CrossRef Google Scholar Version history Version 1 (April 2, 2019): Electronic publication
|
|
Scooped by
Gilbert C FAURE
April 6, 2019 3:01 PM
|
|
|
Suggested by
Société Francaise d'Immunologie
April 5, 2019 2:08 PM
|
Nature. 2019 Apr 3. doi: 10.1038/s41586-019-1082-x.[Epub ahead of print]...
|
|
Suggested by
Société Francaise d'Immunologie
April 4, 2019 2:17 PM
|
Research ArticleGastroenterologyImmunology Free access | 10.1172/JCI121668 IL-7 receptor influences anti-TNF responsiveness and T cell gut homing in inflammatory bowel disease Lyssia Belarif,1 Richard Danger,2,3 Laetitia Kermarrec,4 Véronique Nerrière-Daguin,2,3 Sabrina Pengam,1 Tony Durand,4 Caroline Mary,1 Elise Kerdreux,5 Vanessa Gauttier,1 Aneta Kucik,6 Virginie Thepenier,1 Jerome C. Martin,7,8,9 Christie Chang,7,8,9 Adeeb Rahman,7,10,11 Nina Salabert-Le Guen,2,12,13,14 Cécile Braudeau,2,12,13 Ahmed Abidi,2,15 Grégoire David,4 Florent Malard,2 Celine Takoudju,4 Bernard Martinet,2,3 Nathalie Gérard,2,3 Isabelle Neveu,4,5 Michel Neunlist,4,5 Emmanuel Coron,4,5 Thomas T. MacDonald,6 Pierre Desreumaux,16 Hoa-Le Mai,2,3 Stephanie Le Bas-Bernardet,2,3 Jean-François Mosnier,2,17 Miriam Merad,7,8,9,11 Régis Josien,2,3,12,14 Sophie Brouard,2,3 Jean-Paul Soulillou,2 Gilles Blancho,2,3 Arnaud Bourreille,4,5 Philippe Naveilhan,4,5 Bernard Vanhove,1 and Nicolas Poirier1 First published April 2, 2019 - More info Abstract It remains unknown what causes inflammatory bowel disease (IBD), including signaling networks perpetuating chronic gastrointestinal inflammation in Crohn’s disease (CD) and ulcerative colitis (UC), in humans. According to an analysis of up to 500 patients with IBD and 100 controls, we report that key transcripts of the IL-7 receptor (IL-7R) pathway are accumulated in inflamed colon tissues of severe CD and UC patients not responding to either immunosuppressive/corticosteroid, anti-TNF, or anti-α4β7 therapies. High expression of both IL7R and IL-7R signaling signature in the colon before treatment is strongly associated with nonresponsiveness to anti-TNF therapy. While in mice IL-7 is known to play a role in systemic inflammation, we found that in humans IL-7 also controlled α4β7 integrin expression and imprinted gut-homing specificity on T cells. IL-7R blockade reduced human T cell homing to the gut and colonic inflammation in vivo in humanized mouse models, and altered effector T cells in colon explants from UC patients grown ex vivo. Our findings show that failure of current treatments for CD and UC is strongly associated with an overexpressed IL-7R signaling pathway and point to IL-7R as a relevant therapeutic target and potential biomarker to fill an unmet need in clinical IBD detection and treatment. Graphical Abstract Introduction Inflammatory bowel disease (IBD) consists of 2 major forms, ulcerative colitis (UC) and Crohn’s disease (CD), which are chronic relapsing gastrointestinal disorders characterized by chronic intestinal inflammation, dysregulated immune responses to intestinal microbiota, and dysfunction of the epithelial barrier (1, 2). The incidence and prevalence of IBD are increasing worldwide, and these diseases are associated with marked morbidity and have a major impact on quality of life and ability to work (3, 4). Current conventional treatments are aimed at dampening inflammation with the gradual use of antiinflammatory agents, steroids, immunosuppressive drugs, and biological agents targeting inflammatory cytokines (mainly TNF) for refractory and severe forms of IBD (5, 6). However, approximately one-third of patients receiving anti-TNF agents do not respond to treatment (primary failure), and a significant proportion (up to 50%) become refractory over time (secondary failure) (7). A key feature of IBD is also the rapid recruitment and prolonged persistence of leukocytes at the site of inflammation, which is facilitated by integrin interaction with cognate receptors expressed by endothelial cells allowing cell adhesion and transmigration (8, 9). Emerging therapies are targeting this entry point to the gut with antiadhesion molecules, specially targeting the gut-specific α4β7 integrin (10, 11). However, these therapies do not induce remission in more than half of patients, and relapse also occurs over time in primary responders. Thus, one major goal is to identify novel mechanisms and signaling networks that underlie the chronicity and relapse of IBD. Interleukin-7 (IL-7) is a limiting and nonredundant cytokine produced mainly by epithelial and stromal cells that regulates T lymphocyte homeostasis (12, 13). Almost all conventional mature T lymphocytes express high IL-7 receptor (IL-7R) levels, with the specific exception of naturally occurring Tregs, constituting a rare opportunity to selectively target pathogenic effectors while preserving natural regulators (14–16). IL-7 signals through the cell surface IL-7R that consists of a specific IL-7R α chain (IL-7Rα, CD127) that dimerizes with the common cytokine receptor γ chain (γc, CD132, IL2RG) (17). IL-7Rα also interacts with the thymic stromal lymphopoietin receptor (TSLPR) chain to form the heterodimeric receptor of the TSLP cytokine (18). Upon activation, IL-7R delivers proliferative and antiapoptotic signals by activating PI3K and JAK/STAT pathways as well as regulating expression of anti- and proapoptotic BCL-2 family members (19). More than 2 decades of research has reproducibly highlighted the crucial systemic influence of the IL-7 pathway and depicted IL-7 as a fuel for chronic autoimmune and inflammatory diseases as well as transplant rejection in diverse rodent models (20–22). Remarkably, the colon is the major source of IL-7 outside of the lymphoid tissues in mice, and commensal microflora promotes steady-state IL-7 production by intestinal epithelial cells (23, 24). IL-7–transgenic mice spontaneously developed chronic colitis with IL-7Rαhi T cells infiltrating the gut mucosa, which, once isolated, transferred colitis to immunodeficient recipient mice, thereby demonstrating their pathogenicity (25–29). More recently, IL-7Rαhi innate lymphoid cells (ILCs) were described as new key effectors of IBD (30–32), and IL-7Rα antagonists suppressed both adaptive and innate inflammatory responses in different experimental models of colitis (26, 27, 33, 34). In humans, however, research on IBD has mainly focused on a proinflammatory and antiinflammatory cytokine balance (35–37), while the IL-7/IL-7Rα axis remains poorly studied. IL-7 production by intestinal epithelial cells and IL7R expression by mucosal T lymphocytes were described in colon biopsies from healthy donors (38). One study reported genetic loci variation of the IL7R gene being associated with susceptibility to UC (39). Lastly, elevated IL-7 signaling pathway gene expression in blood CD8+ T cells at diagnosis was significantly associated with relapsing and a more aggressive IBD disease course (40). Whether IL-7 activities are implicated in the pathogenesis of IBD in humans and determine the fate of treatment is uncertain. Results Colon-specific increased mucosal IL7R signaling pathway signature in refractory IBD. Higher gene expression of the IL-7 signaling pathway members in peripheral blood CD8+ T cells has been previously correlated with a relapsing and aggressive disease course of IBD (40). We therefore sought to address whether the local/mucosal IL-7/IL-7R pathway could be enriched in severe IBD and associated with the failure of conventional therapies. For this purpose, we focused our hypothesis-driven analysis on only the transcriptional IL-7/IL-7R signaling signature of 20 genes (curated from BioCarta by the Molecular Signatures Database [MSigDB]; ref. 40) in colon mucosal biopsies from previously published cohorts of IBD patients with clinically active or inactive disease after immunosuppressive therapy. We examined 2 independent cohorts (UC [n = 23] compared with controls without IBD [n = 13], ref. 41; and UC [n = 97] or CD [n = 8] compared with controls without IBD [n = 11]; ref. 42). We found that this 20-mRNA expression signature was altered according to the clinical status (Figure 1, A and D), with a particularly significant accumulation of IL7R mRNA transcripts in inflamed mucosa from refractory IBD patients relative to those in uninvolved control mucosa from the same patients (P < 0.0001), mucosa from responder patients (P < 0.001), or non-IBD controls (Figure 1, C and F). Principal component analysis (PCA) of the mucosal IL-7R signaling signature after immunosuppressive therapy displayed in both cohorts a clear and distinct separation between active versus inactive disease status and the group of uninvolved mucosa that gathered from non-IBD controls (Figure 1, B and E). Figure 1 IL-7R signaling pathway expression is highly expressed in colonic mucosa of refractory IBD. (A) Heatmap of the expression of the 20 selected genes of the IL-7R signaling pathway (40) in colon biopsies from non-IBD control patients (black; n = 13), inactive UC patients (green; n = 8), and active UC patients with involved (red; n = 15) or uninvolved proximal segments (blue; n = 7) after corticosteroids and/or immunosuppression therapy (data set GSE38713; ref. 41). The heatmap represents median-centered and colorized expression values. (B) PCA of the IL-7R signaling signature and (C) relative IL7R expression (log2 data were normalized to the control median; same patient and color groups as in A). (D) Heatmap of the IL-7R signaling signature in colon biopsies from non-IBD controls (black; n = 11), inactive (green; n = 23) or active (red; n = 74) UC patients, and active CD patients (purple; n = 8) after corticosteroids and/or immunosuppression therapy. (E) PCA of the IL-7R signaling signature and (F) relative IL7R expression (log2 data were normalized to the control median; same patient and color groups as in D). (G) Heatmap of the IL-7R signaling signature in colon biopsies from UC patients at weeks 0, 8, and 30 following anti-TNF therapy (green, stable responders, n = 12–17; orange, relapsing patients, n = 3–8; red, primary nonresponders, n = 3–6). (H) PCA after 8 (top) and 30 (bottom) weeks of anti-TNF treatment of the IL-7R signaling signature and (I) IL7R expression (log2 data were normalized to the median of the stable responder group; same patient and color groups as in G). *P < 0.05; **P < 0.01; ***P < 0.001; ****P < 0.0001 between the indicated groups. #P < 0.05; ###P < 0.001 between responders and nonresponders at a single time point. §P < 0.05; §§§P < 0.001, Kruskal-Wallis with post hoc Dunn’s multiple comparisons test within a single response group across all 3 time points. Similarly, the IL-7R signaling signature after anti-TNF treatment allows distinguishing between biopsies according to disease status in a third cohort of UC patients involved in the phase III ACT-1 clinical trial of infliximab (including long-term responders [n = 17], short-term responders and then relapse [n = 8], and primary nonresponders [n = 6]; ref. 43) (Figure 1G). PCA of the mucosal IL-7R signature clearly separates responder from nonresponder patients 30 weeks after maintenance with anti-TNF treatment (Figure 1H). Furthermore, mucosal IL7R expression was significantly higher in clinically active versus inactive disease in anti-TNF–treated patients at both early (week 8, P < 0.05) and late (week 30, P < 0.001) time points (Figure 1I). IL7R expression significantly decreased after anti-TNF therapy in long-term responders compared with baseline pretreatment levels (P < 0.001); however, no significant difference was measurable before treatment between groups in this clinical trial cohort. In contrast to colon mucosa, the IL-7R signature in ileal biopsies was not associated with clinical status in a fourth cohort (44) of untreated pediatric patients with newly diagnosed ileal (iCD; n = 143) or colon-only (cCD, n = 30) CD or UC (n = 38) as compared with pediatric healthy controls (n = 42) (Supplemental Figure 1, A and B; supplemental material available online with this article; https://doi.org/10.1172/JCI121668DS1). IL7R expression was only higher in ileal biopsies with histological microinflammation versus uninflamed biopsies of cCD; however, no difference was observed in ulcerated or nonulcerated iCD relative to healthy controls (Supplemental Figure 1C). Furthermore, IL7R was not differentially expressed in colon mucosa of different non-IBD types of controls, including in inflammatory non-IBD pathology such as diverticulitis (Supplemental Figure 2). Altogether, the data indicate that mucosal expression of the IL-7R signaling pathway, and specifically IL7R, is strongly and selectively associated with colonic but not ileal IBD inflammation. Expression is related to disease activity in IBD patients (Table 1) and could be one mechanism associated with refractory and severe IBD. Table 1 IL7R expression significance in active IBD mucosa versus healthy controls after treatment with immunosuppression and/or corticosteroids, or before therapy with anti-TNF or anti-α4β7 between responders and nonresponders Colonic IL-7Rα expression predicts resistance to anti-TNF therapy. We then asked whether the mucosal IL-7R signaling signature is associated with responsiveness to anti-TNF before initiation of biologic therapy in patients refractory to corticosteroids and/or immunosuppression. We thus performed a meta-analysis of publicly available transcriptional data sets of 3 cohorts of UC patients with colon mucosa biopsies performed before anti-TNF treatment (within a week) (45–47). In these 3 cohorts, anti-TNF response was defined as histological healing analyzed 4–6 weeks after their first anti-TNF infusion (altogether: n = 18 non-IBD controls, n = 41 UC nonresponders, and n = 28 UC responders). Differential analysis of all expressed genes of the meta–data set (17,037 genes) identified only 85 genes significantly (adjusted P value < 0.05) and differentially (log2 FC > 1) expressed between responders and nonresponders, including IL7R (Supplemental Figure 3), which clustered with a large group of genes associated with adaptive immune response, T cell activation, and leukocyte migration/adhesion (Supplemental Figure 4). Analysis of the transcriptional IL-7R signaling signature (20 genes previously described) revealed that the IL-7R signaling signature, in particular IL7R, was already elevated in colon biopsies of primary UC nonresponder patients before initiation of anti-TNF therapy (Figure 2, A–C). A lasso (least absolute shrinkage and selection operator) regression analysis identified a combination of 10 genes (IL7R, IL2RG, JAK1, PIK3CA, LCK, PTK2B, EP300, NMI, CRLF2, and TSLP) within this IL-7R signaling signature able to discriminate anti-TNF nonresponders from responders. Pretreatment expression of IL7R or the 10-gene IL-7R–restricted signature strongly discriminated primary nonresponsiveness to anti-TNF therapy in this meta-analysis (IL7R receiver operating characteristic [ROC] AUC = 84%, 10-gene IL-7R signature ROC AUC = 93%) (Figure 2D). The absence of IL7R expression in the signature decreased correlation with anti-TNF response (AUC = 88%). These data suggest that the entire pathway is associated with the nonresponse to anti-TNF, from IL-7R to transcriptionally regulated proteins (i.e., ITGA4) to major key signaling components (JAK/STAT, PI3K) (Supplemental Figure 5). Intestinal oncostatin M (OSM) has been also recently reported to be associated with anti-TNF unresponsiveness in IBD (48). OSM was also identified as differentially expressed among 85 genes in our meta-analysis (Supplemental Figure 3). OSM expression correlated in these UC biopsies with IL7R expression but was not superior to IL7R in discriminating primary nonresponse to anti-TNF therapy (Supplemental Figure 6). While combining OSM or OSMR with IL7R expression slightly improved ROC analysis, the 10-gene IL-7R–restricted signature remained more potent. Finally, the abundance of immune cell populations in this meta–data set was estimated using the deconvolution CIBERSORT tool (49). IL7R expression was not correlated with relative abundance of myeloid cells, B cells, or NK cells (data not shown) or with any subsets of effector T lymphocytes (CD8+, CD4+, naive, or memory; or resting, activated, or follicular Th cells) (Figure 2E). In contrast, deconvolution of the meta–data set revealed that IL7R expression was significantly and inversely correlated with the relative fraction of Tregs (r = –0.67, P < 0.0001) in colon mucosa of UC patients before anti-TNF therapy and associated with an imbalanced local ratio of Tregs to effector T lymphocytes (Teffs) (r = –0.66, P < 0.0001) (Figure 2E). IL7R expression also correlated significantly and positively with both IFNG and Tbx21 (T-bet) gene expression, hallmarks of Th1 effector cells, and with expression of some Th17 hallmark genes (such as IL17A, IL22, and IL23, but, surprisingly, in an inverse correlation with the RORC gene), as well as the GATA3 hallmark of Th2 (though no correlation was observed with IL4, IL5, or IL13) (Supplemental Figure 7). Finally, using a recently published gene expression signature of human tonsil CD127+ ILCs characterized by single-cell RNA sequencing (50, 51), we found that signatures of all ILC subsets (ILC1, ILC2, and ILC3) were enriched in UC patients from the meta–data set as compared with non-IBD controls, and that ILC signatures were significantly overexpressed in anti-TNF nonresponder versus responder patients (Supplemental Figure 8). However, these signatures were built using isolated tonsil ILC subsets and not to estimate the relative abundance of ILCs in a bulk RNA data set. Furthermore, the low abundance of ILCs in human colon (52, 53) makes them unlikely to explain transcriptomic differences detected in bulk transcriptomic data. Figure 2 Colonic mucosal IL7R and IL-7R signaling pathway expression at baseline is associated with nonresponse to anti-TNF therapy. (A) Heatmap of the expression of the 20 selected genes previously reported as key members of the IL-7R signaling pathway (40) in colon biopsies of non-IBD controls (n = 18), responders (green; n = 28), and nonresponders (red; n = 41) before anti-TNF therapy. Meta-analysis of 3 UC cohorts with histological healing as the anti-TNF response criterion: data sets GSE16879 (46), GSE12251 (45), and GSE73661 (47). The heatmap represents median centered colorized expression values in which yellow values indicate overexpression and blue values indicate underexpression. (B) Gene set enrichment analysis from the meta–data set at week 0 of the IL-7R signaling signature (20 selected genes). ES, enrichment score. (C) Relative IL7R expression before anti-TNF treatment (log2 data normalized to the control median) in the same groups of patients and colors as in A. (D) ROC analysis of expression of IL7R, the IL7R 10-gene signature (IL7R, IL2RG, JAK1, PIK3CA, LCK, PTK2B, EP300, NMI, CRLF2, and TSLP), and the signature without IL7R (9 genes) distinguishing anti-TNF responders and nonresponders. (E) Correlation of IL7R expression with enrichment of leukocyte subsets as estimated by CIBERSORT in the same groups of patients and colors as in A. Left: Effector T lymphocytes (Teff); middle: regulatory T lymphocytes (Treg); right: Treg/Teff ratio. **P < 0.01; ***P < 0.001; ****P < 0.0001 between indicated groups, Kruskal-Wallis test with post hoc Dunn’s multiple comparisons test. Analysis within each cohort independently showed that pretreatment individual baseline IL7R expression was significantly increased in UC but also in cCD nonresponder colon mucosa and did not decrease after anti-TNF therapy (Supplemental Figure 9). Colon mucosal IL7R and the 10-gene IL-7R signature were strongly and repeatedly discriminative of primary responsiveness to anti-TNF therapy in 4 different cohorts of UC and cCD patients (10-gene IL-7R signature ROC AUC = 88.3%, 95.3%, 95.2%, 96.7%). In contrast, while the ileum was also inflamed in active iCD patients, the IL-7R signaling signature or IL7R alone in ileal mucosa was not differentially expressed before or after anti-TNF induction therapy and was not associated with anti-TNF responsiveness in iCD patients (Supplemental Figure 1, D–F). Finally, colon mucosa gene expression analysis of a single recent cohort of UC patients treated with anti-α4β7 (vedolizumab) therapy confirmed also that IL-7R signaling signature was altered and IL7R was differentially expressed between responders and nonresponders at early (week 6) or late (week 52) time points after treatment (Supplemental Figure 10). Altogether, our meta-analysis argues that the pretreatment mucosal IL-7R signaling signature and IL7R expression in the colon are strongly associated with nonresponsiveness to anti-TNF, and presumably also anti-α4β7 therapy, in UC and cCD patients (Table 1) and are associated with a local deficit in Tregs. Characterization of mucosal IL7/IL7R expression. To validate the meta-analysis results, we first performed quantitative reverse transcription PCR (RT-qPCR) on freshly isolated mucosal colon biopsy specimens from UC (n = 21) or CD (n = 24) patients with active disease (based on clinical and endoscopic findings) and treated with immunosuppressive or anti-TNF therapies (Supplemental Table 1). Paired biopsies from both uninvolved (healthy) and involved (diseased) colonic areas of IBD patients were analyzed and compared with those from non-IBD control patients (n = 20) who underwent endoscopy at Nantes University Hospital in France. This analysis confirmed significantly higher expression of IL7, IL7R, and IL2RG (γ chain) in involved colon mucosa of patients with immunosuppressive- or anti-TNF–refractory UC and CD, compared with uninvolved paired tissue from the same patients or non-IBD controls (Figure 3, A and B, and Supplemental Figure 11). The TSLPR chain, which also forms a heterodimer with IL-7Rα (18), was also elevated in the inflamed colon of IBD patients (Supplemental Figure 11). In line with a previous report (54), full-length TSLP cytokine transcripts were not significantly different, while the short-form TSLP variant, which does not signal IL-7Rα/TSLPR but has characteristics of an antimicrobial peptide (55), exhibited reduced mRNA levels in both healthy and inflamed colonic areas of UC and CD patients (Supplemental Figure 11). In parallel, we found increased mRNA expression of ITGA4 (α4 integrin) and ITGB7 (β7 integrin) as well as TNF and TNF receptors (TNFR1 and TNFR2) in involved IBD samples, confirming the inflammatory profile of these biopsies. Both IL7 and IL7R mRNA expression significantly correlated with ITGA4/ITGB7 and TNF/TNFR expression (Supplemental Figure 12) with a marked correlation for α4β7 integrin. Several IL-7 and IL-7Rα splice variants have been described (56, 57), including a functional soluble IL-7Rα isoform (58). Expression of membrane-bound IL7R and full-length IL7 strongly correlated with IL7R and all IL7 variants by RT-qPCR analysis, suggesting that alternative splicing is not modified in inflammatory settings (Supplemental Figure 13). Figure 3 Increased IL7R mRNA and IL-7Rα protein expression in UC and CD colon mucosa. (A and B) Relative IL7 and IL7R expression, as measured by RT-PCR, of colon biopsies from inflamed and healthy areas of UC (n = 21) (A) and CD (n = 24) (B) patients compared with non-IBD control patients (n = 20). Each symbol represents 1 patient, bars represent means, and error bars show SEM. *P < 0.05, **P < 0.01, and ***P < 0.001 between indicated groups. (C) Representative IL-7Rα immunohistochemical staining of colonic biopsy specimens from non-IBD control (infectious acute colitis) and inactive and active UC or CD (scale bars: top and middle, 100 μm; bottom, higher-magnification images of the panels above, 50 μm). We then confirmed increased IL-7Rα expression at the protein level first by immunohistochemistry in colon biopsy specimens of active UC and CD patients as compared with inactive IBD or non-IBD controls (Figure 3C). IL-7Rα staining was mainly present on inflammatory infiltrates in these biopsies as well as by some epithelial cells in the inflammatory microenvironment. To decipher which immune cell types express IL-7Rα in inflamed colon, mass cytometry (CyTOF) analyses, using a panel of 30 detection antibodies, were performed on human lamina propria cell suspensions prepared from the colon of UC patients (n = 3) before treatment with immunotherapy. IL-7Rα expression was observed only on mucosal CD4+ or CD8+ T lymphocytes as well as ILCs but not on other leukocyte cell types (Figure 4, A–C). Remnant epithelial (EPCAM+CD45–) or stromal cells (EPCAM–CD45–) in these lamina propria cell suspensions did not express IL-7Rα (Figure 4F). As anticipated, ILCs expressed the highest level of IL-7Rα. However, the low abundance of ILCs within mucosal leukocytes (Figure 4D) is unlikely to explain overexpression in the bulk transcriptomic data set. Phenograph analysis identified 3 clusters of IL-7Rα+ T lymphocytes, 2 of them corresponding to mucosal CD4+ or CD8+ T cells coexpressing mucosal integrins αE and β7 (Figure 4E). In contrast, the mucosal CD4+ T cell subset expressing the highest level of CD25 (IL-2R), which might be enriched in regulatory T cells, did not express a significant level of IL-7Rα, confirming that Tregs in inflamed mucosal tissues do not express IL-7R. Altogether, our biocollection transcriptomic and proteomic analyses confirmed that IL-7Rα is overexpressed in inflamed colon mucosa from IBD patients and that IL-7Rα is mainly expressed by mucosal ILCs and T lymphocytes coexpressing mucosal integrins such as β7 integrin. Figure 4 Characterization of CD127 expression among UC lamina propria cells. (A) Representative t-distributed stochastic neighbor embedding (tSNE) analysis showing single-cell intensity of CD127 among CD45+ lamina propria leukocytes from UC inflamed colon (n = 3 UC patients). (B) Left: Major immune populations were manually gated and identified on the tSNE map on the basis of canonical marker expression patterns. Right: Heatmap showing the corresponding color-coded normalized expression of canonical markers in gated immune populations. (C) Histograms showing medians of CD127 signal intensity within each of the immune populations defined in B. (D) Frequencies of CD127+ lymphocyte populations among lamina propria leukocytes. Bars correspond to the mean ± SEM (n = 3 UC patients). (E) Phenograph analysis identifies 3 clusters of CD127+ T cells in UC inflamed colon. Each column corresponds to a cluster. Rows indicate the color-coded normalized mean expression intensity of indicated markers in each cluster. CD127+ T cell clusters are indicated with arrows. (F) CD127 expression on lamina propria remnant EPCAM+ epithelial cells or EPCAM– stromal cells. IL-7 signaling controls α4β7 gut-homing integrin expression on effector human T cells. Our validation transcriptional analysis of colon biopsies and CyTOF analysis of mucosal leukocytes revealed a marked correlation between IL-7/IL-7Rα and α4β7 integrin expression in humans. Injection of recombinant IL-7 has recently been shown to provoke rapid and significant T cell accumulation in the gut of macaques and chronically HIV-infected patients (59, 60). Another study described that in vivo IL-7 treatment increased α4β7 expression on circulating T cells from HIV-infected individuals (61). Based on these findings, we aimed to further decipher the relationship between IL-7/IL-7Rα and α4β7 integrin expression in the human setting. Indeed, the link between IL-7 and α4β7 expression could not be easily deduced from previous experimental models, since we found that mouse IL-7 did not regulate mouse T lymphocyte α4 and β7 expression at the mRNA or protein level (Supplemental Figure 14). We first confirmed that human and mouse IL-7 dose-dependently and selectively induced in vitro α4, β7, and α4β7 heterodimer expression on the surface of human T lymphocytes from healthy donors (Figure 5A and Supplemental Figure 15, A and B). As expected, IL-7Rα expression was downregulated. However, no modification was observed for other major gut-homing receptors (αE, CCR6, CCR9, or GPR15), other homing receptors (CCR5, CXCR3), nor β1 integrin, which associates with α4 (Supplemental Figure 16). IL-7–induced α4β7 overexpression was long-lasting and required continuous stimulation, since removal of IL-7 after 24 hours dramatically prevented maintenance of α4β7 overexpression (Supplemental Figure 17A). Similarly, an anti–human IL-7Rα antagonist mAb dose-dependently prevented IL-7–induced α4β7 overexpression (Figure 5B). Figure 5 IL-7 controls α4β7 expression on human effector, but not regulatory, T lymphocytes. (A) Surface expression of α4, β7, and α4β7 integrin heterodimers on human T lymphocytes from the blood of healthy volunteers cultured for the indicated periods of time in medium alone (white bars) or supplemented with recombinant human IL-7 at 1 ng/ml (green), 5 ng/ml (blue), or 25 ng/ml (red). Data are expressed as median fluorescent intensity ± SEM measured by flow cytometry (n = 6). (B) Human T cells were cultured for 3 days with 5 ng/ml of recombinant human IL-7 and a blocking anti–human IL-7Rα mAb at different concentrations. ITGA4 (squares) and ITGB7 (circles) overexpression was normalized to the condition without anti–IL-7Rα mAb and expressed as mean ± SEM. Dotted line represents basal level expression at t0. (C) Surface expression of α4 and β7 integrin on human T lymphocytes cultured for 48 hours in medium alone (gray) or supplemented with recombinant human IL-7 at 1 ng/ml (green), 5 ng/ml (blue), or 25 ng/ml (red) and, when indicated, with 10 μg/ml JAK1/2 inhibitor (ruxolitinib), 5 μM JAK3 inhibitor (CAS 202475-60-3), 5 μM STAT5 inhibitor (CAS 285986-31-4), or 12.5 μM PI3K inhibitor (LY294002). Data are expressed as median fluorescent intensity ± SEM measured by flow cytometry. (D) Human effector (CD25–CD127hi) and regulatory (CD25hiCD127lo) CD4+ T cells, purified by flow cytometry using a nonantagonistic anti–human CD127 (IL-7Rα) mAb, were cultured with medium alone (gray histogram) or supplemented with 1 ng/ml (green), 5 ng/ml (blue), or 25 ng/ml (red) of human IL-7. IL-7 signaling (STAT5 phosphorylation) was measured after 15 minutes of culture, while ITGA4 and ITGB7 expression was evaluated at 48 hours. Data show 1 representative of 5 experiments. *P < 0.05; **P < 0.01 between indicated groups, Kruskal-Wallis test with post hoc Dunn’s multiple comparisons test. IL-7 induced not only upregulation but also functional activation of the human α4β7 heterodimer, since it increased the binding to mucosal vascular addressin cell adhesion molecule-1 (MADCAM1), the specific ligand of α4β7 (Supplemental Figure 18A). Expression of α4 and β7 protein levels did not differ after cell permeabilization, suggesting the absence of a preformed intracellular pool that might be mobilized by IL-7 (Supplemental Figure 18, B–D). In contrast, we found that ITGA4 mRNA expression increased in human T cells within 2 hours after IL-7 exposure while ITGB7 mRNA levels remained unmodified (Supplemental Figure 19A). Using chemical inhibitors for each step of protein synthesis, we confirmed that IL-7–induced α4 expression required DNA transcription, RNA translation, and endoplasmic reticulum and post-Golgi protein export (Supplemental Figure 19B). While IL-7 differentially regulated α4 and β7 transcription, similar results were obtained with protein synthesis inhibitors for α4 and β7 expression, suggesting that IL-7 only indirectly controlled β7 RNA translation (Supplemental Figure 19C). Because IL-7 did not regulate ITGA4 expression on mouse T cells (Supplemental Figure 14), we explored species-specific transcription factors. The transcription factor CREB is predicted to bind to the human but not the mouse ITGA4 gene promoter (Gene Transcription Regulation Database [GTRD]; http://gtrd.biouml.org). Previous genome-wide analysis of CREB occupancy and phosphorylation showed ITGA4 gene activation in human cells and tissues (62) but not in mouse (63). We found that a CREB/CBP association inhibitor prevented α4β7 overexpression in humans (Supplemental Figure 17B), while a CBP/P300 histone acetyltransferase inhibitor had no effect (Supplemental Figure 17C), implicating CREB in α4 expression. In addition, blocking the JAK/STAT pathway using JAK1/2, JAK3, or STAT5 inhibitors or the PI3K pathway with specific inhibitors prevented IL-7–induced α4β7 overexpression, demonstrating that it requires complete IL-7R signaling (Figure 5C). Finally, one potential advantage of IL-7Rα–targeted therapy is that it specifically spares Tregs over effector T cells (21), based on a high differential expression level (14, 15). We found that IL-7 was able to dose-dependently induce STAT5 phosphorylation in Tregs, in spite of the low expression level of its receptor on these cells, but did not induce α4β7 overexpression in contrast to its effect on effector T cells (Figure 5D). A pathogenic role of the IL-7Rα pathway in colon inflammation of humanized mice. Specific control of human effector T cell upregulation of α4β7 integrin expression via the IL-7/IL-7Rα axis suggests that a possible pathogenic role for the IL-7R pathway in human IBD was not previously appreciated in conventional rodent colitis models. To further explore the possible link between IL-7/IL-7Rα, α4β7 integrin expression, and IBD, we reconstituted NOD-scid IL-2Rγ–/– (NSG) immunodeficient mice with human peripheral blood mononuclear cells (PBMCs) from healthy donors. In this model, human T cells led to xenogenic graft-versus-host disease (GVHD) with significant infiltration of colon, small intestine, liver, and lung as previously described (64). We found in a suboptimal GVHD model induced by 10 × 106 human PBMCs that pretreatment of human PBMCs with human IL-7 upregulated α4β7 expression and led to a reduced colon length in recipient mice, a hallmark of colonic inflammation (Figure 6, A and B). This, however, did not accelerate the lethality of GVHD. Conversely, in accordance with the observation that mouse IL-7 could also induce α4β7 expression on human T cells (Supplemental Figure 15A) and the confirmation in the literature (65) and experimentally that human α4β7 integrin could interact with mouse MADCAM1 (Supplemental Figure 15C), in the severe GVHD model induced by 50 × 106 human PBMCs, administration of an antagonist anti–human IL-7Rα mAb significantly delayed GVHD development in NSG mice reconstituted with unmanipulated human PBMCs (Figure 6C). It also prevented colon retraction and histological lesions of colon GVHD (Figure 6D) as well as specifically reduced human T lymphocyte infiltration in the colon but not in other target tissues of GVHD (Figure 6, E and F). To determine whether anti–IL-7Rα therapy in this model also acts systemically, we performed a back-to-back comparison with the anti-α4β7 mAb vedolizumab (Entyvio, Millennium Pharmaceuticals). Surprisingly, we found that unlike the anti–IL-7Rα mAb, vedolizumab had no effect on GVHD and colon inflammation (Supplemental Figure 20), suggesting also a systemic action of IL-7 besides α4β7 upregulation in this humanized GVHD model. Figure 6 IL-7/IL-7Rα pathway controls human T cell–mediated colon inflammation. (A and B) Survival (A) and colon length (B) of immunodeficient NOD-scid IL-2Rγ–/– (NSG) mice reconstituted with 10 × 106 freshly purified human PBMCs from healthy donors (white squares; n = 11) or the same cells cultured 3 days with 5 ng/ml of recombinant human IL-7 (black circles; n = 13). Colon length was measured when mice had lost 20% of body weight. (C) Survival of NSG mice reconstituted with 50 × 106 freshly purified human PBMCs from healthy donors and treated 3 times per week for 4 weeks from day 0 with 5 mg/kg of a blocking anti–human IL-7Rα mAb (black squares; n = 19) or equivalent volume of excipient (vehicle; white circles; n = 14). (D) Colon length and colon histological GVHD score of the same NSG mice as in C that were sacrificed when they had lost 20% of their body weight or after 3 months without clinical signs of GVHD. (E) Representative images of human CD3+ T cell infiltration (green) in the colon of NSG mice treated with excipient or anti–IL-7Rα mAb. Blue staining represents nuclei. (F) Histological human T cell infiltration score in colon, intestine, liver, and lung tissues of NSG mice as in C. Each symbol represents 1 mouse; horizontal bars indicate the mean ± SEM. *P < 0.05; **P < 0.01. IL-7Rα blockade protects from colitis in humanized mice. We next sought to address whether the local and systemic effects of IL-7Rα blockade would be effective in a more relevant colitis model in humanized mice containing both innate and adaptive immune cells. We therefore used NSG mice reconstituted with hematopoietic CD34+ cord blood stem cells and induced colitis by intrarectal injection of the haptenating substance TNBS in ethanol. Ethanol is required to break the mucosal barrier, whereas TNBS is believed to haptenize colonic autologous and/or microbiota proteins, rendering them immunogenic to the host immune system (66). In this humanized mouse model, human T cell subsets (CD4+ and CD8+ naive, central memory, and effector memory T cells) as well as human ILC subsets (ILC1, ILC2, ILC3 NCR+, and ILC3 NCR–) located in the spleen expressed membrane IL-7Rα, except CD4+CD25+ T cells, since, as anticipated, this last subset is enriched in Tregs expressing low levels of IL-7Rα (Supplemental Figure 21). While ILCs were undetectable in colon mucosa from humanized mice, we found that mucosal human T cells expressed a high level of IL-7Rα as compared with peripheral human T cells from the same humanized mice (Supplemental Figure 22). While the immunodeficient NSG mice dramatically succumbed to TNBS/ethanol injection, the humanized mice were partially protected, but developed acute signs of colitis including diarrhea and delayed weight recovery (Figure 7, A and B), in accordance with a dual protective and deleterious role for immune cells in gut homeostasis and inflammation (67). Similarly to vedolizumab, administration of anti–human IL-7Rα mAbs from day 0 was already effective from day 3 after injection in this acute humanized colitis model, since mice started to recover weight and presented significantly less diarrhea (Figure 7, A and B). Although it did not reach significance because of the limited number of humanized mice analyzed and interindividual variability, we observed that intestinal epithelial barrier homeostasis returned to basal levels with either therapy, as measured by the paracellular and transcellular intestinal permeability (Figure 7C) and the significant reduction of histological inflammatory score (Figure 7D) 1 week after treatment. Figure 7 IL-7Rα blockade efficiency in vivo in humanized acute TNBS colitis. (A and B) Weight variation (mean ± SEM) (A) and colitis score (mean ± SEM) (B) of NSG mice previously reconstituted with 50 × 103 human cord blood CD34+ hematopoietic stem cells and challenged several months later with intrarectal administration of 5 mg of 2,4,6-trinitrobenzenesulfonic acid (TNBS) reconstituted in 50% ethanol. Mice were treated intraperitoneally 3 times a week from day 0 with control vehicle (white circles; n = 14), 5 mg/kg of blocking anti–human IL-7Rα mAb (black squares; n = 16), or blocking anti–human α4β7 (vedolizumab) mAb (gray triangles; n = 6). (C) Paracellular and transcellular intestinal permeability (mean ± SEM) measured in vivo in NSG mice as in A after oral administration of sulfonic acid–FITC (SAF) and horseradish peroxidase (HRP) performed at day 0 and 1 week after TNBS/ethanol injection, and measured in sera 2 hours after oral administration. Results were normalized for each mouse to day 0. (D) Left: Representative colon hematoxylin-eosin-safranin staining (top) and cyan blue coloration (bottom) for each group 1 week after TNBS injection. Right: Histological and inflammatory mucosal score quantification. Scale bar: 250 μm. *P < 0.05 between indicated groups, Kruskal-Wallis test with post hoc Dunn’s multiple comparisons test. Finally, we explored the use of blocking anti–human IL-7Rα mAbs in vivo in a treatment model using immunodeficient NSG mice previously reconstituted with a low number (2.5 × 10⁶) of human PBMCs and receiving a chronic cycle of dextran sulfate sodium (DSS; 1% in drinking water). Humanized mice received vehicle or 5 mg/kg anti–IL-7Rα mAbs at the initiation of the second cycle of DSS and until the end of the protocol. No colitis stool score difference was observed between vehicle and anti–IL-7Rα–treated mice before treatment, whereas after treatment initiation mice treated with anti–IL-7Rα mAbs displayed significantly lower signs of diarrhea and mucosal histological lesions as compared with control mice in response to the iterative chronic cycle of DSS (Supplemental Figure 23). IL-7Rα mAb alters mucosal effector T cells in UC biopsies cultured ex vivo. To evaluate the local protective effect of the anti–IL-7Rα antagonist, we used fresh mucosal biopsies from UC patients as an ex vivo inflammatory model of human IBD as previously described (68). Anti–human IL-7Rα mAb (10 μg/ml) or isotype control (10 μg/ml) was added to organ-cultured samples from 10 patients with UC (Supplemental Table 2). After 24 hours of culture, supernatants were analyzed by ELISA, and 6 pairs of biopsies were processed for NanoString transcriptional technology analysis using a panel of 255 human genes related to inflammation. Transcriptomic analysis first showed that samples clustered by donor origin and not by treatment conditions, confirming high interindividual variability in these biopsies (Supplemental Figure 24). Nevertheless, using the NanoString immune cell signature, the analysis revealed that the relative fraction of T cells tended to decrease in the anti–IL-7R condition (not significantly) without impacting Tregs (Figure 8A). Hence, the relative frequency of Tregs among total T cells or effector CD8+ T cells significantly increased in the anti–IL-7R condition. We also observed a significant increase of the exhaustion signature within CD8+ T cells, in particular due to the overexpression of PD-1 and TIM-3 as compared with isotype control (Figure 8B). Finally, in accordance with the result on effector T cell exhaustion, we found that anti–IL-7R significantly inhibited IFN-γ secretion in the supernatant (Figure 8C). Altogether, this analysis showed that anti–IL-7Rα mAb acts locally and rapidly in UC colon samples grown ex vivo and alters effector T cells while tipping the immune balance toward regulatory T cells. Figure 8 IL-7Rα blockade efficiency ex vivo in human UC organ cultures. (A) Immune cell signature enrichment scores and CD8+ T cell exhaustion signature using NanoString transcriptional analysis of inflamed colon fragments from UC patients (n = 6). Samples from each patient were cultured ex vivo at 37°C for 24 hours in medium with 10 μg/ml of control IgG mAb or blocking anti–human IL-7Rα mAb. (B) Individual expression of exhaustion molecules in anti–IL-7Rα–treated conditions normalized to isotype control. (C) IFN-γ cytokine concentration measured by ELISA in the supernatant of UC (n = 10) inflamed colon fragments in the same assay. Each pair of symbols represents samples from the same patient. *P < 0.05; **P < 0.01, Mann-Whitney U test. TILs, tumor-infiltrating lymphocytes. Discussion Since IBD is characterized by chronic inflammation, most targeted therapies are directed to dampen downstream effectors of dysregulated immune responses (i.e., inflammatory cytokines). However, these strategies are not particularly effective in a substantial proportion of patients, and significant rates of acquired resistance are observed. The identification of alternative therapeutic approaches targeting more upstream mechanisms is desired to prevent relapse and maintain patients under long-term remission. Our study elucidates a previously unknown dysregulated pathway in human IBD, whereby IL-7R signaling specifically regulates human effector but not regulatory T cell homing to the gut through a species-specific control of α4 and β7 integrin expression. Importantly, while an association of IL-7 and colitis has been consistently described in rodents, in humans this pathway has not been studied in IBD tissues, and its impact on anti-TNF responsiveness has not previously been evaluated. Excepting a meta-analysis reporting 29 additional UC risk loci including the IL7R gene (39), only one study has reported an association between the IL-7 pathway and severe IBD, whereby the transcriptional profile of circulating T cells correlated with the clinical course in UC and CD (40). Our analysis of 7 transcriptional data sets of mucosal biopsies from UC and CD patients, and validation with local cohorts by RT-qPCR quantification and protein detection by immunohistochemistry, revealed that the IL-7R signaling signature is reproducibly altered in colon mucosa of active diseases and clearly discriminates the disease status from inactive states or non-IBD controls. This is not the case for mucosal ileal biopsies, suggesting a specific association of the IL-7/IL-7R pathway with colonic IBD inflammation. Furthermore, several components of the entire pathway were found to be reproducibly associated and overexpressed, suggesting a potential biologically active pathway specifically located in diseased tissues. Our study revealed that key players of the IL-7R signaling signature and, notably, individual expression of IL7R at baseline are reproducibly and strongly associated with a considerable risk of resistance to anti-TNF in 3 different cohorts of UC and 1 cohort of CD. Association of the IL-7R pathway with resistance to anti-α4β7 therapy has also been observed, although it remains to be confirmed since only 1 cohort has been available so far. In an additional UC cohort (43), the IL-7R signature was elevated in nonresponder patients after anti-TNF therapy, and IL7R was significantly associated with nonresponse to anti-TNF treatment, but with substantially elevated IL7R seen only in primary nonresponders at baseline (Figure 1, G–I). It should be noted that for previous cohorts, an anti-TNF or anti-α4β7 response was defined by complete endoscopic and histological mucosal healing, while in this different cohort the definition of responsiveness was less robust since it was based only on reduction of the clinical Mayo score and rectal bleeding subscore (43). Our data also highlight potentially useful biomarkers of colon inflammation capable of discriminating patients who will achieve full remission from those who will be completely nonresponsive following therapy. Colon fibrosis has also been associated with stenosis and high need of surgery in CD patients treated with anti-TNF (69), and nonresponse to anti-TNF has recently been associated with higher fibronectin and collagen deposition in comparison with responder patients (70). Even if it is impossible to formally rule out the presence of significant fibrosis based on the available data concerning the patients included in the meta-analysis and the meta-cohort, the predominance of UC patients makes it unlikely since fibrosis in UC is much less common and benign stenosis is rarely detected. A recently published observation concerning the oncostatin M (OSM) pathway, where 64 candidate cytokines have been profiled, also includes IL7, which was not discriminant among the top cytokines differentially expressed in IBD biopsies (48). While we found significantly increased IL7 cytokine expression by RT-qPCR in our local cohort, IL7 cytokine expression assessed in previous studies was found to be significantly increased in only 2 of 7 data sets. In response to commensal microflora invasion, gut epithelial cells were shown to produce IL-7 (23, 71, 72) and to regulate the proliferation of intestinal mucosal lymphocytes (38) as well as production of inflammatory cytokines by human ILC3s also expressing IL-7R (73). Thus, it is conceivable that high IL7 expression in the colon is more related to bacterial tissue invasion, while our results reproducibly show an IL7R and IL-7R signaling signature accumulation that is associated with clinical IBD status and nonresponsiveness to anti-TNF therapy. Systemic IL-7 is known for its deleterious role in chronic colitis in rodents (74, 75). In this study we have unraveled an important species difference, whereby IL-7 imprints gut-homing specificity on T cells in humans by upregulating α4β7 integrin expression, a phenomenon not observed in rodents. We show that this is due to the recruitment of CREB to the ITGA4 promoter in humans but not in mice. Other major integrin or chemokine receptors implicated in T cell homing to tissues were not modified, suggesting a specific control of T cell entry in the gut in humans in response to IL-7 consumption. Confirming this IL-7 mechanism of action, human CD127+ T lymphocytes analyzed by CyTOF in the inflamed lamina propria of colon UC patients predominantly expressed also the mucosal integrin β7. Besides IL-7, to our knowledge only retinoic acid has been previously described to control α4β7 integrin expression (76). Interestingly, similar to our results for IL-7, retinoic acids control both α4 and β7 protein expression by directly controlling α4, but not β7, gene transcription (77). Retinoic acids control both effector and Treg α4β7 integrin expression (78). We found that in spite of the low expression of IL-7Rα, IL-7 still induced signaling in Tregs, however without modulating α4 and β7 expression. This suggested that IL-7 selectively imprints effector, but not regulatory, T lymphocyte migration to the gut. These results confirm data by Fischer et al., who studied integrin and chemokine receptor expression on effector and regulatory T cells from UC patients (65). In particular, this study demonstrated that an anti-α4β7 mAb (vedolizumab) impairs gut homing of both human effector and regulatory T cells in humanized mice, and confirmed recent observations that colitis is exacerbated in β7-knockout mice as a result of deletion of the colonic Treg population (79). Finally, we confirmed a deleterious role for IL-7 in gut inflammation mediated by human immune cells using different in vivo humanized mouse models and ex vivo punch colon biopsy cultures from UC patients. Human T lymphocytes overexpressing α4β7 after incubation with IL-7 induced colonic inflammation when transferred into immunodeficient mice. Blocking IL-7Rα with an antagonistic mAb delayed human T lymphocyte–mediated GVHD, with a prolonged action specifically in the colon. In contrast, blocking α4β7 using vedolizumab, which presumably acts locally but not systemically, did not protect from chronic xenogeneic GVHD. Otherwise, anti–IL-7Rα therapy demonstrated in vivo efficacy in restoring gut homeostasis in an acute and chronic colitis humanized mouse model reconstituted with hematopoietic stem cells or peripheral human leukocytes and challenged by intrarectal ethanol/TNBS to induce acute colonic inflammation or receiving a chronic cycle of DSS to induce chronic colon inflammation. Although IL-7R blockade shares some mechanism of action with anti-α4β7 on colon mucosa human T cell migration, these humanized inflammatory models also showed that anti–IL-7R has a broader impact, potentially through systemic mechanisms on chronic inflammation. While targeting a cytokine pathway known for its activity on T cell homeostasis, we were surprised by the rapid action of IL-7Rα blockade in the acute colitis humanized model. We therefore applied anti–IL-7Rα mAb on surgical specimens of mucosal intestine from UC patients cultured ex vivo. We found that anti–IL-7Rα mAb significantly inhibited IFN-γ production in the culture supernatant within 24 hours, which definitively demonstrated that the anti–IL-7Rα therapy is efficient locally and rapidly on gut mucosal inflammation. Transcriptional analysis revealed that anti–IL-7Rα mAb alters mucosal effector T lymphocytes while respecting regulatory T cells and hence tips the balance toward immune regulation. It showed also that IL-7Rα blockade seems to induce a transcriptional program of T cell exhaustion (e.g., PD-1 and TIM-3 expression), which could also explain the inhibition of IFN-γ secretion. Close linkage between IL-7 and IFN-γ secretion has been previously proposed, since IL-7 production by human intestinal epithelial cells in response to Citrobacter rodentium was described to be dependent on IFN-γ (71) and others demonstrated that IFN-γ directly enhanced IL7 mRNA expression in intestinal epithelial cells (80). Finally, Shalapour et al. (23) suggested a feedback loop in which commensal bacteria drive IFN-γ production by lymphocytes, which in turn promotes epithelial cell IL-7 production and IL-7–dependent local survival of lymphocytes. IL7R expression correlated also with OSM/OSMR gene expression in colon biopsies of UC patients before anti-TNF therapy. It remains to be explored whether blocking IL-7R or OSM pathways would be active or induce similar clinical responses in the same subgroup of patients. It was previously described that OSM and other members of the IL-6 family could induce IL-7 secretion by fibroblasts (81) and hence could increase proliferation of T lymphocytes. Altogether, local production of IL-7 by stromal, myeloid, and/or epithelial cells in response to danger or stress signals might amplify the dysregulated Teff/Treg balance by increasing the expansion of effector T lymphocytes, which in turn secrete more IFN-γ, initiating an inflammatory feedback loop. Human infants with IL-7Rα mutations have severe T cell lymphopenia necessitating bone marrow transplantation (82). In contrast to most studies performed in rodent models where IL-7R blockade also induces broad lymphodepletion (21), administration of high doses of anti–IL-7Rα antagonistic mAb in baboons (83), cynomolgus monkey (84), or marmosets (85) did not induce lymphopenia or a significant decrease in peripheral T lymphocyte numbers. Similarly, early clinical results from phase I trials with 2 different antagonist anti–IL-7Rα mAbs, in healthy volunteers (GSK2618960; NCT02293161, ClinicalTrials.gov) or in type 1 diabetic adult patients (PF-06342674; NCT02038764), did not demonstrate induction of lymphopenia (86). No information in the IBD population is available so far. Altogether these observations confirm that IL-7 biology in mice significantly differs from that in humans, but the long-term impact of IL-7R blockade on the human peripheral T cell pool will have to be closely examined. Our results indicate that the IL-7R pathway is locally dysregulated in the colon of severe IBD patients and may contribute to the maintenance of chronic inflammation. More importantly, our study identified that a high colonic IL-7R signaling gene signature, particularly IL7R, is reproducibly and strongly associated with the absence of response to anti-TNF and presumably also to anti-α4β7 therapies both in UC and CD patients before initiation of the therapy, constituting potentially a new predictive biomarker to identify these refractory patients. Finally, we have unraveled human-specific IL-7 control of gut α4β7 integrin expression and confirmed in preclinical in vivo animal and ex vivo human models the therapeutic potential of IL-7Rα blockade. Altogether, our findings suggest that anti–IL-7Rα therapy may offer a novel therapeutic opportunity to prevent relapse and reinstate immune tolerance in IBD patients. Methods Data sets and anti-TNF or anti-α4β7 response criteria. Gene expression data sets were obtained from the Gene Expression Omnibus database (http://www.ncbi.nlm.nih.gov/geo/): GSE38713 (41) and GSE59071 (42) for colon biopsies from UC patients after treatment with immunosuppressants and/or corticosteroids; GSE57945 (44) for ileal biopsies from pediatric healthy controls and patients with newly diagnosed and untreated ileal CD, colonic CD, or UC; GSE16879 (46) for colon biopsies from UC patients as well as colon and ileal biopsies from CD patients before and 4–6 weeks after treatment with anti-TNF (infliximab); GSE12251 (45) for colon biopsies of UC patients before anti-TNF (infliximab) therapy; GSE23597 (43) for colon biopsies from UC patients before and 8 weeks and 30 weeks after anti-TNF (infliximab) therapy; and GSE73661 (47) for colon biopsies from UC patients before and 4–6 weeks after treatment with anti-TNF (infliximab) as well as UC patients before and 6 weeks and 52 weeks after treatment with anti-α4β7 (vedolizumab). Patient characteristics as well as criteria and definition for determining primary responsiveness to anti-TNF or anti-α4β7 therapy are described in Supplemental Methods. Briefly, patients with active IBD refractory to corticosteroids and/or immunosuppression underwent biopsy collection within a week before anti-TNF or anti-α4β7 therapy and at early (week 4–8) or late (week 30 or 52) time points after the first infusion. In all cohorts except GSE23597 (43), anti-TNF or anti-α4β7 response was defined by complete histological and endoscopic healing. In GSE23597 (43), anti-TNF response was defined by a decrease from baseline of the total Mayo score of at least 3 points and 30% with an accompanying decrease of the bleeding subscore of at least 1 point and an absolute bleeding subscore of 0 or 1. This cohort of UC patients treated with anti-TNF was not included in our meta-analysis. Ex vivo human colon culture model. Human colon tissues were collected during endoscopy or during routine surgery. Biopsies or small mucosal fragments were cut (3-mm2 pieces) from resected intestinal tissue collected from macroscopically and microscopically inflamed areas of intestine from patients with either CD or UC. For UC patients, 6 patients gave biopsies and 4 gave resected bowel. For CD, 3 patients gave biopsies and 7 gave resected bowel. When mucosal resection tissue was used, small biopsy-size fragments were cut using scissors. Biopsies or biopsy-sized fragments were placed (1 biopsy per well) in 24-well plates in 300 μl serum-free HL-1 medium (Lonza Bioscience) supplemented with l-glutamine, 100 U/ml penicillin, 100 μg/ml streptomycin, and 50 μg/ml gentamycin (Sigma-Aldrich). Mucosal explants were incubated for 24 hours at 37°C and 5% CO2. The anti–human CD127 mAb (clone N13B2, OSE Immunotherapeutics) or IgG control was added at 10 μg/ml into the medium at the beginning of incubation time. Supernatants were collected after 24 hours of culture and stored at –70°C. Cytokine production in biopsy supernatants was measured by ELISA. Human recombinant IL-8 (DY208) DuoSet ELISA kit (R&D Systems) and human IFN-γ (31673539, ImmunoTools) were used according to the manufacturer’s instructions. Animals. NOD.Cg-Prkdcscid Il2rgtm1Wjl/SzJ (NOD-scid IL2Rγ-null [NSG]) immunodeficient mice were initially obtained from The Jackson Laboratory and then bred in the Humanized Rodent Platform of LabEx IGO (University of Nantes). All animals were housed under specific pathogen–free conditions, according to institutional guidelines. Humanized GVHD model. Seven- to ten-week old NSG mice were sublethally irradiated
|
|
Scooped by
Gilbert C FAURE
April 3, 2019 3:27 PM
|
J Cutan Med Surg. 2019 Apr 2:1203475419839939. doi: 10.1177/1203475419839939.[Epub ahead of print]...
|
|
Suggested by
Société Francaise d'Immunologie
April 2, 2019 1:42 PM
|
The epithelial cell–derived cytokines thymic stromal lymphopoietin (TSLP), IL-33, and IL-25 are central regulators of type 2 immunity, which drives a broad array of allergic responses. Often characterized as “alarmins” that are released by the barrier epithelium in response to external insults, these epithelial cell–derived cytokines were initially thought to act only early in allergic inflammation. Indeed, TSLP can condition dendritic cells to initiate type 2 responses, and IL-33 may influence susceptibility to asthma through its role in establishing the immune environment in the perinatal lungs. However, TSLP, IL-33, and IL-25 all regulate a broad spectrum of innate immune cell populations and are particularly potent in eliciting and activating type 2 innate lymphoid cells (ILC2s) that may act throughout allergic inflammation. Recent data suggest that a TSLP/ILC axis may mediate steroid resistance in asthma. Recent identification of memory Th2 cell subsets that are characterized by high receptor expression for TSLP, IL-33, and IL-25 further supports a role for these cytokines in allergic exacerbations. There is therefore growing interest in developing biologics that target TSLP, IL-33, and IL-25. This Review provides an overview of TSLP, IL-33, and IL-25 and the development of blocking antibodies that target these epithelial cell–derived cytokines.
|
|
Scooped by
Gilbert C FAURE
April 1, 2019 1:07 PM
|
Therapeutic antibodies are increasingly being used in the clinic for the treatment of diseases. Yet, oral to gut targeting of antibodies remains a challenge due to their inability to survive digestion and reach gastrointestinal ...
|
|
Suggested by
Société Francaise d'Immunologie
March 30, 2019 1:18 PM
|
Journal of Leukocyte Biology considers manuscripts of original investigations focusing on the origins, developmental biology, biochemistry and functions of granulocytes, lymphocytes, mononuclear phagocytes, and other cells involved in host defense.
|


 Scoop.it!