Research and publish the best content.
Get Started for FREE
Sign up with Facebook Sign up with X
I don't have a Facebook or a X account
Already have an account: Login

Into the Driver's Seat
453.6K views |
+8 today
Building learners' independence through thoughtful technology use
Curated by
Jim Lerman
 Your new post is loading...
 Your new post is loading...
Your new post is loading...
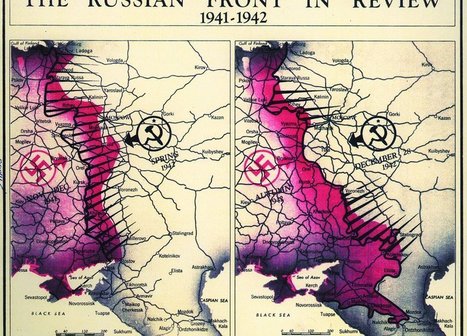
"As much as James Bond is defined by his outlandish gadgets, one of the most important tools for real-life spies is actually much less flashy: maps. Whether used to gather information or plan an attack, good maps are an integral part of the tradecraft of espionage. Now, to celebrate 75 years of serious cartography, the Central Intelligence Agency has declassified and put decades of once-secret maps online. These days, the C.I.A. and other intelligence agencies rely more on digital mapping technologies and satellite images to make its maps, but for decades it relied on geographers and cartographers for planning and executing operations around the world. Because these maps could literally mean the difference between life and death for spies and soldiers alike, making them as accurate as possible was paramount, Greg Miller reports for National Geographic."
Tags: mapping, geopolitics, map, historical, map archives. 
"Colored printed sections showing the map of the world are cut to shape then pasted onto the surface of the globes and a protective coat of varnish is added. Narrator recounts the fact that lots of the workers have been there for over 30 years and quips: 'While the rest of the mankind does its best to blow the world up, they like building a new one.'"
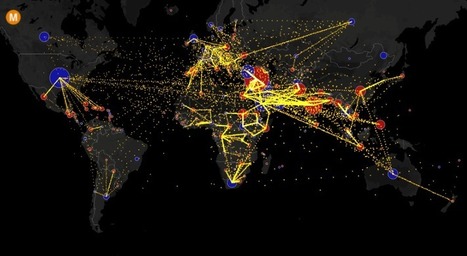
Visualizing the flow of the world's migrants from country to country.
Based on data from the U.N. Population Division, this map shows the estimated net migration (inflows minus outflows) by origin and destination country between 2010 and 2015. Blue circles = positive net migration (more inflows). Red circles = negative net migration (more outflows). Each yellow dot represents 1,000 people. Hover over a circle to see that country’s total net migration between 2010 and 2015. Click a circle to view only the migration flows in and out of that country. For more info about this map, read the article, All the World’s Immigration Visualized in 1 Map.
Tags: migration, USA, mapping, population, unit 2 population.

GTANSW & ACT's curator insight,
December 17, 2016 11:46 PM
Migration at a global scale changes places
Syllabus Students investigate reasons for and effects of internal migration in Australia and another country, for example:
Students investigate the reasons for and effects of international migration to Australia, for example:
Geoworld 9 NSW 8.1 Migration: people own the move 8.2 Australia: destination nation 8.3 Where do immigrants settle 8.4 Culturally diverse australia: trends in migration
8.8 Australians are mobile people 8.9 Mobile indigenous populations 8.19 Lifestyle migration 8.11 The power of resources: the Pilbara 8.12 Migration changes the USA Geothink
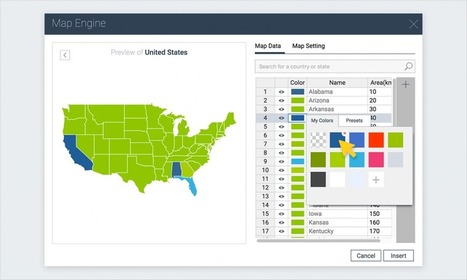
A step-by-step tutorial on how to create an interactive map with Visme, a free online infographic and presentation tool.

António Leça Domingues's curator insight,
December 19, 2016 6:44 AM
Criar um mapa interativo com Visme.

Bart van Maanen's curator insight,
December 19, 2016 10:02 AM
Mooie tool om een kaart van data te voorzien.

"GeoInquiries are designed to be fast and easy-to-use instructional resources that incorporate advanced web mapping technology. Each 15-minute activity in a collection is intended to be presented by the instructor from a single computer/projector classroom arrangement. No installation, fees, or logins are necessary to use these materials and software. The Elementary, Grade 4 GeoInquiry collection is under-development."

Ruth Reynolds's curator insight,
June 13, 2016 2:39 AM
Chase these resources geography and environmental education
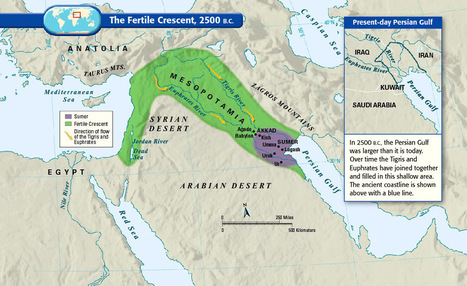
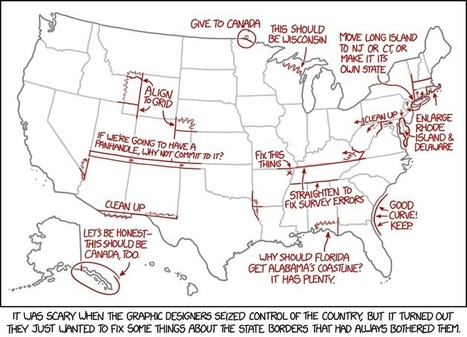
These maps are crucial for understanding the region's history, its present, and some of the most important stories there today.

Alex Vielman's curator insight,
November 23, 2015 3:17 PM
Maps like the ones posted in this article, really helps people to understand and break down deeply of understanding the entire region as a whole. Visualization is very important in geography when trying to understand the region people are talking about. this region as goes down to the Mesopotamia Era. It is important to know, how the culture was in this area to how it differentiated during the Ottoman Empire. During the first couple of maps, we can begin to see the division of the entire region. As you go on, we begin to notice the divisions between people, religion, language between states and in-states. There is so much information to know about the Middle East region and it may be even harder to understand due to the tons of changes and separations, but it is important to understand these divisions like the Sunni's and the Shi'ites in order to fully explain the development and the current situations that are occurring in this region as we speak. 
Matt Ramsdell's curator insight,
December 7, 2015 5:18 PM
These 40 maps are a very interesting way of showing how people have traveled around and moved about the Earth from the time of the fertile crescent era to the people of today. It shows us the paths that people have taken to move to a new location. How they used the Meditteranean Sea to move from one side to the other. It also shows how the Tigris and Euphrates came together to form a smaller area of the Persian gulf. This led to smalled economic growth because now there is less land for imports and exports. 
Kelvis Hernandez's curator insight,
December 12, 2018 10:49 PM
Being able to explain any region in just 40 maps is a very bold claim. While no one would be able to do this Vox was able to make a very interesting set of historically, culturally, and politically themed visualizations of this continuously changing part of the world. Some maps show the borders of an empire past, others discuss the many ethnic groups that call the region their home, and yet another discusses the importance of oil and who has it. |
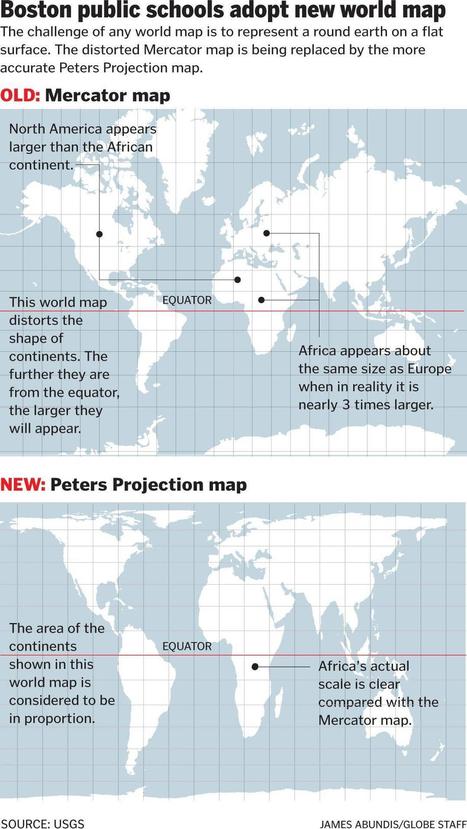
Social studies classrooms throughout the Boston public school system are getting an upgrade some 448 years in the making.

Today, to the southeast of Block Island, there are five new structures rising from the ocean. These are the towers of the Block Island Wind Farm (BIWF), the first offshore wind energy installation in the United States. The turbines will generate 30 megawatts of energy; providing electricity to 17,000 households on Block Island and coastal Rhode Island (McCann, 2016), and replacing the diesel generators that previously powered New Shoreham. The turbines are on schedule to begin turning in November 2016 once commissioning is complete.
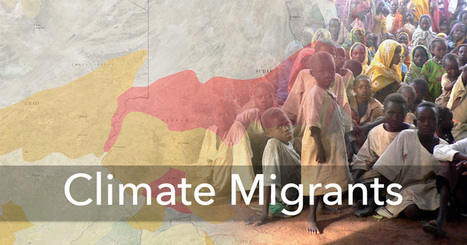
Climate change has already displaced tens of thousands of people. If it continues unabated, it could lead to one of the largest mass human migrations in history.
"GPS Essentials is the most complete GPS tool on Android Market: Navigate, manage waypoints, tracks, routes, build your own dashboard from 45 widgets."
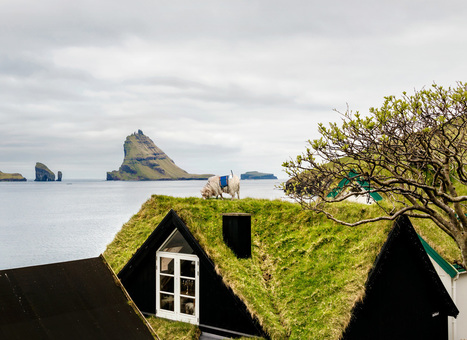
"How do you get Google to visit your small, remote island group with its Street View vehicles, and digitize your roads for the benefit of locals and tourists alike? If you are the Faroe Islands, then you exploit your local resources to roll your own Street View, in the hopes of attracting Google's attention. Behold: Sheep View 360, a solar-powered 360-degree camera, mounted on a sheep's back. Sheep View takes advantage of one great Street View feature: You can upload your own images to Google's service. So Durita Dahl Andreassen, working for the tourist site Visit Faroe Islands, decided to kick-start the Faroe Islands' entry by putting the camera on a sheep and letting it wander free, then uploading the photos."
Jim Lerman's insight:
This is such a rich story; using technology in a pre-industrial way to exploit the attractions of an isolated set of islands. This could make a marvelous multi-disciplinary inquiry and I can just imagine students mounting cameras on their pets to tell the stories of their neighborhoods.
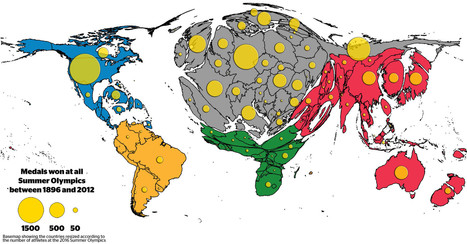
The distribution of medals shows the existing Olympic inequalities: The overall patterns are a reflection of wealth distribution in the world, raising the question whether money can buy sporting success. Besides investment in sports by those countries who can afford it, the medal tables also reflect a battle for global supremacy in political terms.
Tags: sport, popular culture, mapping, historical, cartography.

PIRatE Lab's curator insight,
August 15, 2016 8:32 PM
Another very interesting way to present geographic data.
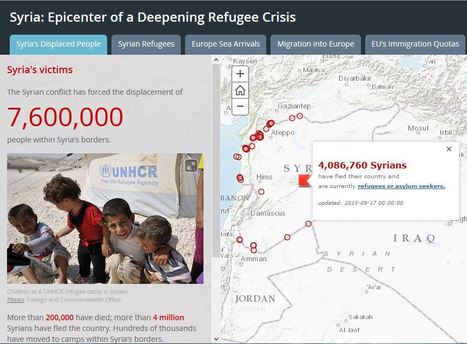
Thousands of refugees, many of them fleeing the brutal conflict in Syria, are streaming across Europe in search of safety and security.

Tanya Townsend's curator insight,
November 23, 2015 11:42 AM
This story map is a great visual of the current refugee crisis. This would be a helpful aid in describing the geographical barriers refugees face and how it affects them. For example the map shows where highest concentrations of deaths occur, naturally it is in the ocean. The ocean is a barrier for fleeing refugees. Think about how different landscapes and land forms can affect refugees available paths to flee |