
Curated by Beth Kanter
This post is to promote the new Boston Indicators web site, a site that offers "big data" for nonprofits to use to promote civic participation.
The Boston Foundation launched a new resource for community organizations and media on November 27 – the Boston Indicators Project website. (http://www.bostonindicators.org/)
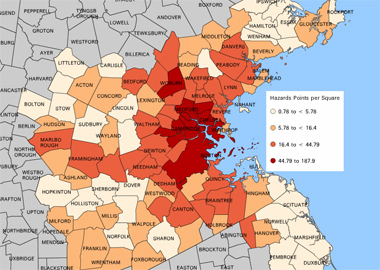
The site now contains data visualization tools, thanks to a collaboration with the Institute for Visualization and Perception Research at UMass Lowell. http://oicweave.org/ and http://www.uml.edu/centers/ivpr/
Two bit that caught my eye:
- “Data is the new sexy,” said John Davidow, Executive Editor at WBUR. Davidow participated in a panel of journalists who described the ways they wanted to use community data to tell stories about poverty, unemployment and crime.
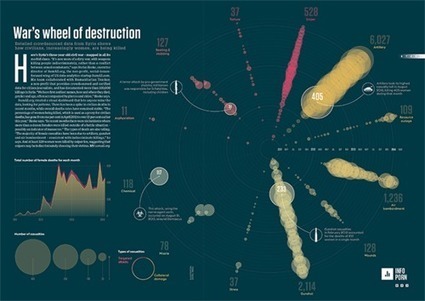
- There are many ways to present the data you want – once you have found them. Rahul Bhargava, a research specialist from the MIT Center for Civic Media, spoke about visualization techniques during one of the PechaKucha talks at the launch. He described using evocative images, annotated graphs, physical models, and community-created art. He also mentioned software such as Wordle, Taxego, Prezi and Omnigraphsketcher..
Need to track down his presentation


 Your new post is loading...