Your new post is loading...

|
Scooped by
Gilbert C FAURE
July 30, 4:29 AM
|
In IgA nephropathy (IgAN), elevated levels of the circulating autoantigen galactose-deficient IgA1 are critical to disease pathogenesis. Genetic as well as in vitro, in vivo, and human immunologic studies have identified APRIL (a proliferation-inducing ligand) and BAFF (B-cell activating factor)...
|
|
Scooped by
Gilbert C FAURE
June 3, 5:08 AM
|
What if the immune system could change antibody behavior without changing the antibody itself?
This discovery could redefine IgA Therapeutics, Mucosal Immunity, and Next-Generation Antibody Engineering.For decades, immunology held the view that there were basically two distinct systems of IgA production, monomeric and dimeric, by different populations of plasma cells.
In human circulation, the SAME IgA1 clone can be found in both monomeric IgA and dimer form, bound to J-chain.
• monomeric IgA
• J-chain coupled dimeric IgA
But even more astounding: These “structurally promiscuous” clones make up the circulating IgA repertoire.
These different structures of IgAs have various distinct characteristics on:
•tissue distribution,
•receptor activation,
•serumclearance,
•neutralization potency and
•mucosal transport capacity.
This suggests that it is possible to dynamically adjust antibody function (without altering antigen specificity) by changing assembly state of the immune system.
In other words:
One antibody sequence may generate multiple functional immune states.
The potential implications for this are:
• Next generation mucosal vaccines
• Improved antiviral neutralization
• Antibody design using AI platforms
• Precision IgA therapeutics
• Autoimmune disease targeting, and
• IgA nephropathy biology.
The exciting thing is the era of “static antibodies” might come to an end.
https://lnkd.in/e59xzg4D
|
|
Scooped by
Gilbert C FAURE
January 20, 2025 5:00 AM
|
Research and understanding of IgA nephropathy has increased dramatically in recent years; are you up to speed on optimal management of IgA nephropathy?
|
|
Scooped by
Gilbert C FAURE
July 6, 2024 3:52 AM
|
Patients with chronic tonsillitis had greater IgAN event rates than those without, and further analysis revealed chronic tonsillitis was linked to a greater risk of developing IgAN.
|
|
Scooped by
Gilbert C FAURE
December 3, 2023 1:33 PM
|
IgA nephropathy (IgAN), the most prevalent primary glomerulonephritis worldwide, carries a considerable lifetime risk of kidney failure. Clinical manifestations of IgAN vary from asymptomatic with microscopic or intermittent macroscopic haematuria and stable kidney function to rapidly progressive glomerulonephritis. IgAN has been proposed to develop through a ‘four-hit’ process, commencing with overproduction and increased systemic presence of poorly O-glycosylated galactose-deficient IgA1 (Gd-IgA1), followed by recognition of Gd-IgA1 by antiglycan autoantibodies, aggregation of Gd-IgA1 and formation of polymeric IgA1 immune complexes and, lastly, deposition of these immune complexes in the glomerular mesangium, leading to kidney inflammation and scarring. IgAN can only be diagnosed by kidney biopsy. Extensive, optimized supportive care is the mainstay of therapy for patients with IgAN. For those at high risk of disease progression, the 2021 KDIGO Clinical Practice Guideline suggests considering a 6-month course of systemic corticosteroid therapy; however, the efficacy of systemic steroid treatment is under debate and serious adverse effects are common. Advances in understanding the pathophysiology of IgAN have led to clinical trials of novel targeted therapies with acceptable safety profiles, including SGLT2 inhibitors, endothelin receptor blockers, targeted-release budesonide, B cell proliferation and differentiation inhibitors, as well as blockade of complement components. IgA nephropathy (IgAN) is an inflammatory disease of the glomerulus that can lead to kidney failure. In this Primer, Stamellou et al. discuss the prevalence and pathophysiological mechanisms of IgAN, summarize diagnosis and management of the disease, and provide an outlook on required future research.
|
|
Scooped by
Gilbert C FAURE
March 23, 2023 3:37 PM
|
Researchers have found that IgA autoantibodies that bind to a specific antigen on the mesangial cells are the trigger fo...
|
|
Scooped by
Gilbert C FAURE
July 26, 2022 6:22 AM
|
A Science & Innovation webinar, sponsored by Calliditas...
|
|
Scooped by
Gilbert C FAURE
December 28, 2020 12:32 PM
|
Zheng et al. produce in-depth, single-cell transcriptome data to demonstrate cell-type-specific
gene expression of IgAN. They provide insights into the potential mechanism of IgAN in which aberrant IgA deposition-related gene expression in mesangial cells trigger IgAN, inducing tubulointerstitial...
|
|
Scooped by
Gilbert C FAURE
December 9, 2020 9:09 AM
|
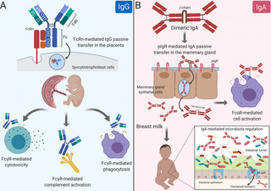
Citation: Langel SN, Otero CE, Martinez DR, Permar SR (2020) Maternal gatekeepers: How maternal antibody Fc characteristics influence passive transfer and infant protection. PLoS Pathog 16(3): e1008303. https://doi.org/10.1371/journal.ppat.1008303 Editor: Matthew J. Evans, Mount Sinai School of Medicine, UNITED STATES Published: March 26, 2020 Copyright: © 2020 Langel et al. This is an open access article distributed under the terms of the Creative Commons Attribution License, which permits unrestricted use, distribution, and reproduction in any medium, provided the original author and source are credited. Funding: SNL is supported by an NIH National Institute of Allergy and Infectious Diseases (NIAID: https://www.niaid.nih.gov) Ruth L. Kirschstein National Research Service Award T32 AI007392. CEO is supported by an NIH NIAID Ruth L. Kirschstein National Research Service Award T32 CA009111. DRM is supported by an NIH NIAID Ruth L. Kirschstein National Research Service Award T32 AI007151 and a Burroughs Wellcome Postdoctoral Enrichment Award (www.bwfund.org). SRP is supported by NIH NIAID R01 AI122909, P01 AI129859, and P01 AI117915. The funders had no role in study design, data collection, analysis, decision to publish, or preparation of the manuscript. The content is solely the view of the authors and does not necessarily represent the official views of the National Institutes of Health. Competing interests: I have read the journal's policy and have the following conflicts: SRP serves as a consultant for Pfizer, Sanofi, Moderna, and Merck vaccines and has a sponsored program on preclinical cytomegalovirus vaccine development with Merck and Moderna. All other authors declare no competing interests. Introduction Maternal antibodies (MatAbs) passively transferred across the placenta and into breast milk are critical for protection against infectious disease and immune development during the first year of life [1]. Passive transfer in the placenta and mammary gland (MG) is dependent on MatAbs binding to crystallizable fragment (Fc) receptors (FcRs) on polarized epithelial cells. For example, immunoglobulin G (IgG) transfers through the placenta by Fc domain binding to the Fc receptor neonatal (FcRn) on syncytiotrophoblasts [2], providing the fetus with a systemic source of protective IgG antibodies [3]. Additionally, maternal dimeric immunoglobulin A (dIgA) antibodies transfer into breast milk by binding to the polymeric immunoglobulin receptor (pIgR) on MG epithelial cells through the antibody joining chain (J-chain) [4] and provide immune protection in the gut while shaping microbiota colonization [4,5]. Yet MatAbs can interfere with the neonatal immune response, particularly after vaccination [6]. This Pearl explores the role of monomeric IgG, the only antibody isotype to cross the placenta, and polymeric IgA, the major antibody species in breast milk, and their Fc domain characteristics on passive transfer to and functional activity in the newborn. The IgG Fc domain and its effector functions in the context of MatAb passive transfer Antibodies contain 2 domains that exert a wide range of effector functions. The antigen-binding fragment (Fab) domain binds foreign antigens and drives antibody diversity [7], whereas the Fc is responsible for initiating innate immune cell activation and passive antibody transfer [8]. The classical FcRn-driven IgG transport mechanism is responsible for shuttling IgG within acidified endosomes across the syncytiotrophoblast cell barrier from maternal to fetal circulation (Fig 1A) [2]. Once in the neonate, the IgG Fc domain can engage classical type I Fc gamma (Fcγ) receptors (activating [FcγRI, FcγRIIa, FcγRIIc, FcγRIIIa, FcγRIIIb]; inhibitory [FcγRIIb]) or complement to mediate nonneutralizing functions like antibody-dependent cell-mediated cytotoxicity (ADCC) and antibody-dependent cellular phagocytosis (ADCP), or complement-dependent cytotoxicity (CDC), respectively (Fig 1A) [9]. Nonclassical type II FcRs are C-type lectin receptors, including CD209 (DC-SIGN) and CD23, which bind IgG to facilitate immune complex formation [9]. Considering each family of Fc receptors initiates distinct effector functions, the diversity of the Fc domain allows tailoring of nonneutralizing Fc-mediated activity to protect against viruses like HIV, influenza, and cytomegalovirus [10–12]. Alternatively, pathogens such as dengue virus utilize complement and FcR pathways for antibody-dependent enhancement of disease [13]. Download: PPT PowerPoint slide PNG larger image TIFF original image Fig 1. Maternal antibody passive transfer and functional activity in the neonate. (A) IgG passive transfer in the placenta influences FcγR-mediated cell cytotoxicity, phagocytosis, and complement activation in the developing fetus/newborn. (B) IgA passive transfer in the mammary gland results in FcαR- and IgA-mediated cell activation and microbiota regulation, respectively. Fab, antigen-binding fragment; Fc, crystallizable fragment; FcαR, Fc alpha receptor; FcRn, Fc receptor neonatal; FcγR, Fc gamma receptor; IgA, immunoglobulin A; IgG, immunoglobulin G; J-chain, joining chain; pIgR, polymeric immunoglobulin receptor. https://doi.org/10.1371/journal.ppat.1008303.g001 The IgG Fc domain mediates considerable heterogeneity of its effector functions depending on the subclass and glycan profile. For example, each IgG subclass (IgG1-4) has one N-glycosylation site in each CH2 domain, an important binding site for FcγRs (Fig 2). Interestingly, there are up to 36 possible antibody glycan profiles that could theoretically be present on each CH2 domain. This allows for combinatorial diversity of the Fc region with 144 different potential functional states for the 4 IgG subclasses [14]. This is relevant in the context of maternal–fetal immunity, as FcRn has different binding affinities to each IgG subclass, which may reflect their placental transfer efficiency [15]. Additionally, recent data suggest that Fc glycan profiles create antibody transfer hierarchies in the placenta of both healthy and HIV-infected pregnant women. For example, in healthy pregnant women, there is a shift toward IgG galactosylated antibodies, which have higher FcRn-binding affinity, are more efficiently transferred across the placenta, and enhance natural killer (NK) cell degranulation and chemokine secretion [16]. Additionally, binding of tetanus toxoid–specific IgG to placental FcγRIIa H131, FcγRIIa R131, and FcγRIIIa F158 (but not canonical FcRn) was positively associated with placental IgG transfer efficiency in HIV-infected women, suggesting that noncanonical placental FcRs may also play a role in IgG placental transfer [17,18]. Fc-mediated differential selection of IgG antibodies in the placenta is likely an adaptive evolutionary mechanism to passively transfer the most effective antibodies to the infant, which can be altered by disease status. Download: PPT PowerPoint slide PNG larger image TIFF original image Fig 2. Schematic representation of IgA and IgG glycosylation. N-linked glycosylation is depicted as yellow circles, whereas O-linked glycosylation is depicted as green stars. IgA, immunoglobulin A; IgG, immunoglobulin G; sIgA2, secretory IgA. https://doi.org/10.1371/journal.ppat.1008303.g002 Do IgA Fc region characteristics influence IgA passive transfer or effector function in breast milk? IgA antibodies bind their own unique Fc receptors that facilitate epithelial cell transcytosis and innate immune cell activation. dIgA antibodies are composed of 2 monomers, linked by a 15-kDa J-chain. Transport of dIgA into breast milk is dependent on C-terminal binding of the J-chain to a portion of pIgR, known as the secretory component, on the basolateral surface of MG epithelial cells [19]. Without the J-chain, IgA antibodies are secreted as monomers and are not actively transported across the mucosal epithelium [20]. After transport of the J-chain/pIgR complex to the apical portion of the cell, pIgR is cleaved, releasing secretory IgA (sIgA) into breast milk and other mucosal fluids (Fig 1B) [21]. IgA also binds to Fc alpha receptor (FcαR) [22] on the surface of myeloid cells. Monomeric serum IgA induces inhibitory signals, whereas IgA immune complexes have increased avidity to and cross-link FcαRI, resulting in proinflammatory responses [23]. The dominant immunoglobulin class in breast milk sIgA has decreased affinity for FcαRI likely due to steric hindrance from the attached secretory component [24]. Although the opsonic activity of sIgA is poor compared with monomeric and dIgA [25], sIgA can initiate macrophage phagocytosis and neutrophil respiratory burst [26,27]. Further defining the anti- and proinflammatory effects of IgA subclass–FcR interactions would allow fine tuning of breast milk immunity and may represent an attractive therapeutic strategy. Considering breast milk sIgA protects from pathogenic insult and facilitates maturation of the microbiota in early life [28], understanding breast milk antibody Fc–mediated effector functions is integral to neonatal intestinal health (Fig 1B). This is further supported by the fact that bacteria have evolved mechanisms to block IgA and FcαR interactions [29]. Additionally, it is likely that the more complex and extensive glycosylation pattern of IgA antibodies (Fig 2) impacts effector function in milk. Indeed, mucosal secretions, including breast milk, contain mostly IgA2 [30], which has 2 [IgA2m(1)] or 3 [IgA2m(2)] additional conserved N-glycans compared with IgA1 [31], which dominates in serum [32]. Recent evidence demonstrates that IgA glycan–bacteria interactions regulate gut microbiota composition and metabolism as well as retrograde transport of sIgA immune complexes back to the lamina propria independent of antibody–epitope interactions [33–35]. Additionally, the sialic acid in IgA antibody’s C-terminal tail competes with receptor binding to some viruses, providing an innate line of defense against infection [36]. This is relevant to breast milk IgA passive transfer, considering that the leading causes of severe pediatric gastroenteritis worldwide (rotavirus and norovirus) both utilize sialic acid receptors for intestinal infection [37,38]. Studies are needed to define the mechanisms of Fc-mediated IgA effector functions in breast milk, including their interactions with the developing infant microbiome and protection against intestinal viral infections. MatAb interference is influenced by MatAb Fc domain–receptor interactions Despite the well-documented benefits of MatAbs on early life immunity [3], a mounting body of evidence indicates that MatAbs can inhibit immune responses to certain infant vaccinations [6,39]. A recent meta-analysis demonstrated that MatAbs acquired transplacentally inhibited antibody responses to priming vaccinations and these effects were not overcome by administration of a booster dose [40]. This highlights the “window of susceptibility” that exists for infants when MatAbs are not high enough for seroprotection yet still interfere with infant vaccine responses. Multiple mechanisms have been proposed to describe both Fab- and Fc-mediated MatAb interference. These include live virus vaccine neutralization, inhibition of B-cell responses by epitope masking [39], and IgG Fc binding to FcγRIIB [41]. Kim and colleagues demonstrated that B-cell responses to a live attenuated measles vaccine were inhibited by passively transferred measles-specific IgG antibodies in a FcγRIIB-dependent manner, suggesting that IgG Fc region characteristics contribute to suppression of the immune response [41]. Additionally, removing the glycans from IgG2b abolished its immunosuppressive activity both in vitro and in vivo [42,43]. Considering that the mechanisms of MatAb interference likely differ depending on vaccine type (live attenuated, inactivated, subunit), route of delivery (oral, subcutaneous [SQ], intramuscular [IM]), and adjuvant formulation, defining glycan-dependent passive transfer of maternal IgG antibody subclasses in the placenta is crucial for developing effective maternal immunization strategies. Although less studied, IgA antibodies in breast milk may also contribute to interference of immune responses to oral infant vaccines such as rotavirus and poliovirus [44,45]. Indeed, the 2 oral rotavirus vaccines Rotarix and Rotateq demonstrate lower efficacy and immunogenicity in infants from some low- and middle-income countries (LMICs) [46,47] where women tend to have higher titers of antirotavirus IgA antibodies and neutralizing activity in milk [48,49]. The high rotavirus neutralizing activity in breast milk of women from LMICs may partially explain the decrease in rotavirus vaccine efficacy; however, IgA MatAb interference is not well defined [49]. Although infant CD4+ T-cell responses are mostly unaffected by MatAb interference [6,39], recent work demonstrated that MatAbs dampen mucosal T-cell responses against commensal bacteria [50] and limit the expansion of T follicular helper (TFH) cells in the germinal center (GC) [39]. The premature decline in GC TFH cells resulted in the reduction or prevention of plasma cell and memory B-cell generation in a MatAb- and antigen dose–dependent manner [39]. Interestingly, at low or intermediate titers, MatAbs did not prevent the induction of memory B cells, suggesting a gradient effect of MatAbs on infant immune responses [39]. Defining the functional consequences of MatAb gradients will be essential for infant vaccine design and immunization timing. For example, and in addition to previously discussed mechanisms, there is evidence that preexisting antibodies can promote higher affinity antibody responses due to competitive binding in the GC [51] and increased uptake and antigen presentation through immune complexes (ICs) [52] in a Fc glycosylation–dependent manner [53,54]. However, more research is needed to determine the effects of these mechanisms in the setting of passively transferred MatAbs and infant GC responses. Harnessing MatAb Fc region characteristics and receptor interactions to fine-tune maternal immunizations that maximize infant protection Passive transfer of MatAbs is central to pathogen protection and immune system development in early life. However, MatAb-mediated interference dampens antibody responses to vaccinations, leaving children more susceptible to infections while increasing transmission rates to unvaccinated cohorts. Recent work demonstrated that maternal IgG antibodies are differentially transferred across the placenta in an Fc glycan–dependent manner [16,17]. Considering vaccination strategies could direct antigen-specific antibody glycosylation [55], defining MatAb glycan profiles represents an adaptable and powerful mechanism to fine-tune maternal immunizations that maximize infant protection while limiting MatAb interference. Future studies are needed to determine (1) how maternal vaccination and their distinct adjuvant mixtures alter IgG Fc domain glycosylation and whether certain glycan profiles are associated with IgG Fc-mediated MatAb interference and (2) whether or not the IgA Fc domain regulates passive transfer in the MG or effector function in breast milk. Defining the molecular mechanisms of Fc-mediated functional activity at the maternal–fetal/neonatal interface is critical for developing next-generation maternal vaccines and antibody-based therapeutics to improve the health of the mother–neonatal dyad. References 1. Hurley WL, Theil PK. Perspectives on immunoglobulins in colostrum and milk. Nutrients. 2011 Apr;3(4): 442–474. pmid:22254105; PubMed Central PMCID: PMC3257684. View Article PubMed/NCBI Google Scholar 2. Simister NE, Story CM, Chen HL, Hunt JS. An IgG-transporting Fc receptor expressed in the syncytiotrophoblast of human placenta. Eur J Immunol. 1996 July;26(7): 1527–1531. pmid:8766556 View Article PubMed/NCBI Google Scholar 3. Fouda GG, Martinez DR, Swamy GK, Permar SR. The Impact of IgG transplacental transfer on early life immunity. Immunohorizons. 2018 Jan 1;2(1): 14–25. pmid:29457151 View Article PubMed/NCBI Google Scholar 4. Rogier EW, Frantz AL, Bruno MEC, Wedlund L, Cohen DA, Stromberg AJ, et al. Secretory antibodies in breast milk promote long-term intestinal homeostasis by regulating the gut microbiota and host gene expression. Proc Natl Acad Sci U S A. 2014 Feb 25;111(8):3074–3079. pmid:24569806 View Article PubMed/NCBI Google Scholar 5. Sadeharju K, Knip M, Virtanen SM, Savilahti E, Tauriainen S, Koskela P, et al. Maternal antibodies in breast milk protect the child from enterovirus infections. Pediatrics. 2007 May;119: 941–946. pmid:17473095. View Article PubMed/NCBI Google Scholar 6. Niewiesk S. Maternal antibodies: clinical significance, mechanism of interference with immune responses, and possible vaccination strategies. Front Immunol. 2014 Sep 16;5: 446. pmid:25278941; PubMed Central PMCID: PMC4165321. View Article PubMed/NCBI Google Scholar 7. Li Z, Woo CJ, Iglesias-Ussel MD, Ronai D, Scharff MD. The generation of antibody diversity through somatic hypermutation and class switch recombination. Genes Dev. 2014 Jan 1;18(1): 1–11. pmid:14724175. View Article PubMed/NCBI Google Scholar 8. Lu LL, Suscovich TJ, Fortune SM, Alter G. Beyond binding: antibody effector functions in infectious diseases. Nat Rev Immunol. 2018 Jan;18(1):46–61. pmid:29063907 View Article PubMed/NCBI Google Scholar 9. Pincetic A, Bournazos S, DiLillo DJ, Maamary J, Wang TT, Dahan R, et al. Type I and type II Fc receptors regulate innate and adaptive immunity. Nat Immunol. 2014 Aug;15(8):707–16. pmid:25045879 View Article PubMed/NCBI Google Scholar 10. Horwitz JA, Bar-On Y, Lu CL, Fera D, Lockhart AAK, Lorenzi JCC, et al. Non-neutralizing Antibodies Alter the Course of HIV-1 Infection In Vivo. Cell. 2017 Aug 10;170(4):637–648.e10. pmid:28757252 View Article PubMed/NCBI Google Scholar 11. Henry Dunand CJ, Leon PE, Huang M, Choi A, Chromikova V, Ho IY, et al. Both Neutralizing and Non-Neutralizing Human H7N9 Influenza Vaccine-Induced Monoclonal Antibodies Confer Protection. Cell Host Microbe. 2016 Jun 8;19(6):800–813. pmid:27281570 View Article PubMed/NCBI Google Scholar 12. Nelson CS, Huffman T, Jenks JA, Cisneros de la Rosa E, Xie G, Vandergrift N, et al. HCMV glycoprotein B subunit vaccine efficacy mediated by nonneutralizing antibody effector functions. Proc Natl Acad Sci U S A. 2018 Jun 12;115(24):6267–6272. pmid:29712861 View Article PubMed/NCBI Google Scholar 13. Katzelnick LC, Gresh L, Halloran ME, Mercado JC, Kuan G, Gordon A, et al. Antibody-dependent enhancement of severe dengue disease in humans. 2017 Nov 17;358(6365):929–932. pmid:29097492 View Article PubMed/NCBI Google Scholar 14. Jennewein MF, Alter G. The Immunoregulatory Roles of Antibody Glycosylation. Trends Immunol. 2017 May;38(5):358–372. pmid:28385520. View Article PubMed/NCBI Google Scholar 15. Palmeira P, Quinello C, Silveira-Lessa AL, Zago CA, Carneiro-Sampaio M (2012) IgG placental transfer in healthy and pathological pregnancies. Clin Dev Immunol. 2012;2012: 985646. pmid:22235228; PubMed Central PMCID: PMC3251916. View Article PubMed/NCBI Google Scholar 16. Jennewein MF, Goldfarb I, Dolatshahi S, Cosgrove C, Noelette FJ, Krykbaeva M, et al. Fc Glycan-Mediated Regulation of Placental Antibody Transfer. Cell. 2019 Jun 27;178(1):202–215.e14. pmid:31204102; PubMed Central PMCID: PMC6741440. View Article PubMed/NCBI Google Scholar 17. Martinez DR, Fong Y, Li SH, Yang F, Jennewein MF, Weiner JA, et al. Fc Characteristics Mediate Selective Placental Transfer of IgG in HIV-Infected Women. Cell. 2019 Jun 27;178(1):190–201.e11. pmid:31204101; PubMed Central PMCID: PMC6727200. View Article PubMed/NCBI Google Scholar 18. Martinez DR, Fouda GG, Peng X, Ackerman ME, Permar SR. Noncanonical placental Fc receptors: What is their role in modulating transplacental transfer of maternal IgG? PLoS Pathog. 2018 Aug 30;14(8):e1007161. pmid:30161231; PubMed Central PMCID: PMC6117057. View Article PubMed/NCBI Google Scholar 19. Johansen FE, Kaetzel CS. Regulation of the polymeric immunoglobulin receptor and IgA transport: new advances in environmental factors that stimulate pIgR expression and its role in mucosal immunity. Mucosal Immunol. 2011 Nov;4(6):598–602. pmid:21956244; PubMed Central PMCID: PMC3196803. View Article PubMed/NCBI Google Scholar 20. Johansen FE, Braathen R, Brandtzaeg P. Role of J chain in secretory immunoglobulin formation. Scand J Immunol. 2000 Sep;52(3): 240–248. pmid:10972899 View Article PubMed/NCBI Google Scholar 21. Johansen F-E, Braathen R, Brandtzaeg P. The J Chain Is Essential for Polymeric Ig Receptor-Mediated Epithelial Transport of IgA. J Immunol. 2001 Nov 1;167(9):5185–5192. pmid:11673531. View Article PubMed/NCBI Google Scholar 22. Aleyd E, Heineke MH, van Egmond M. The era of the immunoglobulin A Fc receptor FcalphaRI; its function and potential as target in disease. Immunol Rev. 2015 Nov;268(1):123–138. pmid:26497517. View Article PubMed/NCBI Google Scholar 23. Hansen IS, Baeten DLP, den Dunnen J. The inflammatory function of human IgA. Cell Mol Life Sci. 2019 Mar;76(6):1041–1055. pmid:30498997; PubMed Central PMCID: PMC6513800 View Article PubMed/NCBI Google Scholar 24. Bonner A, Furtado PB, Almogren A, Kerr MA, Perkins SJ (2008) Implications of the near-planar solution structure of human myeloma dimeric IgA1 for mucosal immunity and IgA nephropathy. J Immunol. 2008 Jan 15;180(2):1008–1018. pmid:18178841. View Article PubMed/NCBI Google Scholar 25. Bakema JE, van Egmond M. Immunoglobulin A: A next generation of therapeutic antibodies? mAbs. 2011 Jul 1;3(4): 352–361. pmid:21691145 View Article PubMed/NCBI Google Scholar 26. Stewart WW, Kerr MA. The specificity of the human neutrophil IgA receptor (Fc alpha R) determined by measurement of chemiluminescence induced by serum or secretory IgA1 or IgA2. Immunology. 1990 Nov;71(3): 328–334. pmid:2269470; PubMed Central PMCID: PMC1384427. View Article PubMed/NCBI Google Scholar 27. Gorter A, Hiemstra PS, Leijh PC, van der Sluys ME, van den Barselaar MT, van Es LA, et al. IgA- and secretory IgA-opsonized S. aureus induce a respiratory burst and phagocytosis by polymorphonuclear leucocytes. Immunology. 1987 Jul; 61(3): 303–309. pmid:3610212; PubMed Central PMCID: PMC1453393. View Article PubMed/NCBI Google Scholar 28. Fadlallah J, El Kafsi H, Sterlin D, Juste C, Parizot C, Dorham, K, et al. Microbial ecology perturbation in human IgA deficiency. Sci Transl Med. 2018 May 2;10(439): eaan1217. pmid:29720448 View Article PubMed/NCBI Google Scholar 29. Woof JM. The human IgA-Fc alpha receptor interaction and its blockade by streptococcal IgA-binding proteins. Biochem Soc Trans. 2002 Aug;30(4):491–494. pmid:12196121. View Article PubMed/NCBI Google Scholar 30. Kett K, Brandtzaeg P, Radl J, Haaijman JJ. Different subclass distribution of IgA-producing cells in human lymphoid organs and various secretory tissues. J Immunol. 1986 May 15;136(10):3631–3635. pmid:3517160. View Article PubMed/NCBI Google Scholar 31. Mattu TS, Pleass RJ, Willis AC, Kilian M, Wormald MR, Lellouch AC, et al. The glycosylation and structure of human serum IgA1, Fab, and Fc regions and the role of N-glycosylation on Fcα receptor interactions. J Biol Chem. 1998 Jan 23;273(4):2260–2272. pmid:9442070. View Article PubMed/NCBI Google Scholar 32. Delacroix DL, Dive C, Rambaud JC, Vaerman JP. IgA subclasses in various secretions and in serum. Immunology. 1982 Oct;47(2):383–375. pmid:7118169; PubMed Central PMCID: PMC1555453. View Article PubMed/NCBI Google Scholar 33. Nakajima A, Vogelzang A, Maruya M, Miyajima M, Murata M, Son A, et al. IgA regulates the composition and metabolic function of gut microbiota by promoting symbiosis between bacteria. J Exp Med. 2018 Aug 6;215(8):2019–2034. pmid:30042191; PubMed Central PMCID: PMC6080902. View Article PubMed/NCBI Google Scholar 34. Rochereau N, Drocourt D, Perouzel E, Pavot V, Redelinghuys P, et al. Dectin-1 is essential for reverse transcytosis of glycosylated SIgA-antigen complexes by intestinal M cells. PLoS Biol. 2013 Sep;11(9):e1001658. pmid:24068891; PubMed Central PMCID: PMC3775721. View Article PubMed/NCBI Google Scholar 35. Mathias A, Corthesy B. Recognition of gram-positive intestinal bacteria by hybridoma- and colostrum-derived secretory immunoglobulin A is mediated by carbohydrates. J Biol Chem. 2011 May 13;286(19):17239–17247. pmid:21454510; PMCID: PMC3089566. View Article PubMed/NCBI Google Scholar 36. Maurer MA, Meyer L, Bianchi M, Turner HL, Le NPL, et al. Glycosylation of Human IgA Directly Inhibits Influenza A and Other Sialic-Acid-Binding Viruses. Cell Rep. 2018 Apr 3;23(1):90–99. pmid:29617676; PMCID: PMC5905402. View Article PubMed/NCBI Google Scholar 37. Graziano VR, Wei J, Wilen CB (2019) Norovirus Attachment and Entry. Viruses. 2019 May 30;11(6). pii: E495. pmid:31151248; PMCID: PMC6630345. View Article PubMed/NCBI Google Scholar 38. Stencel-Baerenwald JE, Reiss K, Reiter DM, Stehle T, Dermody TS. The sweet spot: defining virus-sialic acid interactions. Nat Rev Microbiol. 2014 Nov;12(11):739–749. pmid:25263223; PMCID: PMC4791167. View Article PubMed/NCBI Google Scholar 39. Vono M, Eberhardt CS, Auderset F, Mastelic-Gavillet B, Lemeille S, Christensen D, et al. Maternal Antibodies Inhibit Neonatal and Infant Responses to Vaccination by Shaping the Early-Life B Cell Repertoire within Germinal Centers. Cell Rep. 2019 Aug 13;28(7):1773–1784.e5. pmid:31412246. View Article PubMed/NCBI Google Scholar 40. Voysey M, Kelly DF, Fanshawe TR, Sadarangani M, O'Brien KL, Perera R, et al. The Influence of Maternally Derived Antibody and Infant Age at Vaccination on Infant Vaccine Responses: An Individual Participant Meta-analysis. JAMA Pediatr. 2017 Jul 1;171(7):637–646. pmid:28505244; PMCID: PMC5710349. View Article PubMed/NCBI Google Scholar 41. Kim D, Huey D, Oglesbee M, Niewiesk S. Insights into the regulatory mechanism controlling the inhibition of vaccine-induced seroconversion by maternal antibodies. 2011 Jun 9;117(23):6143–51. pmid:21357766; PMCID: PMC3122939. View Article PubMed/NCBI Google Scholar 42. Heyman B, Nose M, Weigle WO. Carbohydrate chains on IgG2b: a requirement for efficient feedback immunosuppression. J Immunol. 1985 Jun;134(6):4018–4023. pmid:3872908. View Article PubMed/NCBI Google Scholar 43. Heyman B, Wigzell H. Immunoregulation by monoclonal sheep erythrocyte-specific IgG antibodies: suppression is correlated to level of antigen binding and not to isotype. J Immunol. 1984 Mar;132(3):1136–1143. pmid:6363534. View Article PubMed/NCBI Google Scholar 44. Chan J, Nirwati H, Triasih R, Bogdanovic-Sakran N, Soenarto Y, Hakimi M, et al. Maternal antibodies to rotavirus: could they interfere with live rotavirus vaccines in developing countries? Vaccine. 2011 Feb 1;29(6):1242–1247. pmid:21147127. View Article PubMed/NCBI Google Scholar 45. Plotkin SA, Katz M, Brown RE, Pagano JS. Oral poliovirus vaccination in newborn African infants. The inhibitory effect of breast feeding. Am J Dis Child. 1966 Jan;111(1):27–30. pmid:5900282. View Article PubMed/NCBI Google Scholar 46. Ruiz-Palacios GM, Perez-Schael I, Velazquez FR, Abate H, Breuer T, Clemens SC, et al. Safety and efficacy of an attenuated vaccine against severe rotavirus gastroenteritis. N Engl J Med. 2006 Jan 5;354(1):11–22. pmid:16394298. View Article PubMed/NCBI Google Scholar 47. Vesikari T, Uhari M, Renko M, Hemming M, Salminen M, et al. Impact and effectiveness of RotaTeq(R) vaccine based on 3 years of surveillance following introduction of a rotavirus immunization program in Finland. Pediatr Infect Dis J. 2013 Dec;32(12):1365–1373. pmid:24051998. View Article PubMed/NCBI Google Scholar 48. Moon SS, Tate JE, Ray P, Dennehy PH, Archary D, Coutsoudis A, et al. Differential profiles and inhibitory effect on rotavirus vaccines of nonantibody components in breast milk from mothers in developing and developed countries. Pediatr Infect Dis J. 2013 Aug;32(8):863–870. pmid:23584581; PMCID: PMC4610365. View Article PubMed/NCBI Google Scholar 49. Moon SS, Wang Y, Shane AL, Nguyen T, Ray P, Dennehy P, et al. Inhibitory effect of breast milk on infectivity of live oral rotavirus vaccines. Pediatr Infect Dis J. 2010 Oct;29(10):919–23. pmid:20442687; PMCID: PMC3704726. View Article PubMed/NCBI Google Scholar 50. Koch MA, Reiner GL, Lugo KA, Kreuk LS, Stanbery AG, Ansaldo E, et al. Maternal IgG and IgA Antibodies Dampen Mucosal T Helper Cell Responses in Early Life. Cell. 2016 May 5;165(4):827–41. pmid:27153495; PMCID: PMC4866587. View Article PubMed/NCBI Google Scholar 51. Zhang Y, Meyer-Hermann M, George LA, Figge MT, Khan M, et al. Germinal center B cells govern their own fate via antibody feedback. J Exp Med. 2013 Mar 11;210(3):457–464. pmid:23420879; PMCID: PMC3600904. View Article PubMed/NCBI Google Scholar 52. Garg AK, Desikan R, Dixit NM. Preferential Presentation of High-Affinity Immune Complexes in Germinal Centers Can Explain How Passive Immunization Improves the Humoral Response. Cell Rep. 2019 Dec 17;29(12):3946–3957.e5. pmid:31851925. View Article PubMed/NCBI Google Scholar 53. Heesters Balthasar A, Chatterjee P, Kim Y-A, Gonzalez Santiago F, Kuligowski Michael P, et al. Endocytosis and Recycling of Immune Complexes by Follicular Dendritic Cells Enhances B Cell Antigen Binding and Activation. Immunity. 2013 Jun 27;38(6):1164–75. pmid:23770227; PMCID: PMC3773956. View Article PubMed/NCBI Google Scholar 54. Lofano G, Gorman MJ, Yousif AS, Yu W-H, Fox JM, Dugast AS, et al. Antigen-specific antibody Fc glycosylation enhances humoral immunity via the recruitment of complement. Sci Immunol. 2018 Aug 17;3(26). pii: eaat7796. pmid:30120121; PMCID: PMC6298214. View Article PubMed/NCBI Google Scholar 55. Mahan AE, Jennewein MF, Suscovich T, Dionne K, Tedesco J, et al. Antigen-Specific Antibody Glycosylation Is Regulated via Vaccination. PLoS Pathog. 2016 Mar 16;12(3):e1005456. pmid:26982805; PMCID: PMC4794126. View Article PubMed/NCBI Google Scholar
|
|
Scooped by
Gilbert C FAURE
November 18, 2020 5:52 AM
|
<b><i>Aim:</i></b> To investigate the relationship between hemoglobin levels and the progression of IgA nephropathy (IgAN).<b><i>Methods:</i></b> In a two-center cohort of 1,828 cases with biopsy-pro...
|
|
Scooped by
Gilbert C FAURE
August 26, 2020 8:02 AM
|
IgA nephropathy (IgAN) is the most common primary glomerulonephritis in the world among patients undergoing renal biopsy.Approximately 30% of patients with IgAN develop end-stage kidney disease 20 ye...
|
|
Scooped by
Gilbert C FAURE
May 30, 2020 12:20 PM
|
<b><i>Objectives:</i></b> IgA nephropathy (IgAN) is thought to involve an autoimmune process wherein galactose-deficient IgA1 (Gd-IgA1), recognized as autoantigen by autoantibodies, forms pathogenic i...
|
|
Scooped by
Gilbert C FAURE
December 24, 2019 8:02 AM
|
<b><i>Background:</i></b> In Europe IgA nephropathy (IgAN) is detected in 20% of children with glomerular diseases diagnosed by renal biopsy.The outcome during childhood is generally good, but progre...
|
|
|
Scooped by
Gilbert C FAURE
June 10, 7:40 AM
|
Meet Byron, an active professional working in healthcare who was diagnosed with IgA nephropathy (IgAN).
His story highlights the often unseen impact of IgAN, which can include exhaustion and feeling overwhelmed or disconnected from daily life.
At Vertex, we are inspired by stories like Byron’s as we continue to make meaningful progress in our research for serious kidney diseases.
|
|
Scooped by
Gilbert C FAURE
September 26, 2025 12:52 PM
|
CSL Vifor and Travere Therapeutics, Inc., (NASDAQ: TVTX) support the recent publication of the updated clinical practice guidelines for the treatment of IgA Nephropathy (IgAN), Kidney Disease: Improving Global Outcomes (KDIGO) 2025 clinical practice guideline for the management of IgA Nephropathy...
|
|
Scooped by
Gilbert C FAURE
November 24, 2024 11:18 AM
|
This medicine was designated as an orphan medicine for the treatment of primary IgA nephropathy in the European Union on 11 November 2024. This means that the developer will receive scientific and regulatory support from EMA to advance their medicine to the stage where they can apply for a...
|
|
Scooped by
Gilbert C FAURE
June 21, 2024 7:41 AM
|
Dr. Yariana E. Rodriguez Ortiz is a PGY5 Nephrology Fellow at Houston Methodist Hospital. Her main interests are chronic kidney disease education and prevention, health disparities, and leadership.She is the active National Vice-President of the Committee of Interns and Residents (CIR) in which she...
|
|
Scooped by
Gilbert C FAURE
May 13, 2023 2:05 AM
|
Clinicians have an expanding therapeutic armamentarium to improve outcomes in immunoglobulin A nephropathy...
|
|
Scooped by
Gilbert C FAURE
March 23, 2023 3:37 PM
|
There is insufficient evidence to confirm the involvement of tonsillar immune disorders in the pathogenesis of IgA nephropathy (IgAN). This cross-sectional study investigated the association between histological changes in the palatine tonsil, its clinical presentation, and renal histopatholog...
|
|
Scooped by
Gilbert C FAURE
August 7, 2021 12:04 PM
|
The outbreak of severe acute respiratory syndrome coronavirus 2 (SARS-CoV-2) has become a global concern. Immunoglobin A (IgA) contributes to virus neutralization at the early stage of infection. Longitudinal studies are needed to assess whether SARS-CoV-2-specific IgA production persists for a...
|
|
Scooped by
Gilbert C FAURE
December 28, 2020 7:58 AM
|
IgA nephropathy (IgAN) is the most common primary glomerulonephritis worldwide [1]. This autoimmune disease is characterized by elevated blood levels of abnormally glycosylated IgA1 (galactose-deficient in some O-glycans; Gd-IgA1). Identifying IgA1-secreting subpopulations responsible for production of Gd-IgA1, and their unique transcriptional profile, would help identify critical mechanisms in the pathobiology of IgAN. To identify transcriptional mechanisms of Gd-IgA1 production in IgA1-secreting subpopulations, we used a previously generated biobank of Epstein–Barr virus (EBV)-immortalized B cells from peripheral blood of IgAN patients and healthy controls [2–6]. The aberrant glycosylation of Gd-IgA1 is related to abnormal expression and activity of key glycosyltransferases [2,3,5]. To assess mechanisms that drive abnormal glycosylation of IgA1 in cells from IgAN patients versus controls, we used high-throughput single-cell RNA sequencing (scRNA-seq) to map differential transcriptional responses in IgA1-secreting subpopulations. To identify IgA1-secreting cells, we used the IGHA1 secreted splice variant. The splice variant is located on the 3′ end of the transcript, but the VDJ clonality – also of interest when discerning immunoglobulin function – is on the 5′ end of the gene. Thus we approached the analysis using scRNA-seq kits that targeted either the 3′ or the 5′ end (Figure 1). The purpose of this study was to develop a bioinformatic process to identify individual cells that have the IgA1-secreting isoform, the IgA1 membrane isoform or both isoforms; however, during our analysis of these IgA1 subpopulations, we found significant expression of other immunoglobulin heavy chains in the same cells, necessitating a process to identify which isotype class each cell should be called for. This problem of needing sequence identification at both ends of the transcript is well recognized, and a recent publication has looked at using 3′ end reverse transcription with targeted capture and nanopore sequencing [7]. This study used both whole-transcriptome analysis from the 3′ end and long-read sequencing via Oxford Nanopore technology. The advantage was the availability of both whole-cell transcriptome and VDJ sequences; however, the process required significantly more PCR amplification upstream for hybridization capture, which can bias expression levels, and the nanopore sequencing technology generally has low recovery rates [7]. For our studies we needed an analysis process that could be hypothesis-driven, allowing for specific subpopulations determined a priori, and then we needed to perform both hypothesis testing and unbiased analysis on these subpopulations. For this, we turned to Alteryx, a software package used to handle large databases that allows users to generate unique workflows to quickly analyze data for gene expression profiles across all their datasets. Coupled with the R single-cell package ‘Seurat’, we generated the curated data sets from the EBV-immortalized cells derived from human peripheral blood B cells [8]. Analysis of the raw and curated data from Seurat and Alteryx indicated that EBV-immortalized cells express multiple isotype classes of heavy chain genes; however, due to allelic exclusion during isotype switching, this is not biologically possible [9]. After analyzing the distribution profiles of expression of heavy chain isotypes in each cell, we defined an approach to make more appropriate calls of isotype heavy chains. With this process, we modified the hg38 reference database to include IGHA1 splice variants for secretory and membrane-bound antibodies. This approach enabled a more accurate assessment of the immunoglobulin isotype calls and identification of critical IgA1-secreting subpopulations. Materials & methods A previously established biobank of EBV-immortalized peripheral blood mononuclear cells (PBMCs) was used [2,4–6]. Briefly, PBMCs isolated from patients with IgAN or other renal disease and healthy controls underwent EBV immortalization, a process that only targets B cells. For the purposes of this study, we only used IgAN donors, but immortalized B cells from healthy controls exhibit similar immunoglobulin heavy chain patterns [2]. Heterogenic mixtures (populations secreting multiple isotypes of immunoglobulin heavy chain) of B cells were grown in RPMI 1640 medium with 10% fetal bovine serum at 5% CO2 [2,4,6]. Cells were centrifuged at 4°C, stored on ice for 30 min and, for the purpose of removing clumped and dead cells, were isolated as single live cells by using forward and side scatter in an Aria II flow cytometer before single-cell transcriptomic analysis. B cells were assessed using 10× Genomics 3′ transcriptome (v2.0, n = 4) and 5′ VDJ and GEX transcriptome kits (v1.1, n = 5), with target cell numbers of 3000 [10,11]. The target cell number of 3000 was used as recommended by 10× Genomics and See et al. who found that approximately 2000 cells were sufficient to target isotype subpopulations [12]. Transcripts were sequenced on an Illumina NextSeq 500, at 50,000 reads per cell. The sequences were called using 10× Genomics Cell Ranger v3.1. In addition to using the hg38 reference genome, splice variants for IGHA1 secreted (ENSG00000282633.1) and membrane-bound (ENSG00000211895.5) (IgHA1s and IgHA1m) were added to the reference genome. Raw data were curated and normalized using Seurat v3.0 and analyzed using Alteryx Designer x64© in the following manner (Figure 1; example workflow in Supplementary Figure 1) [13]. Using the 5′ VDJ and GEX 10× Genomics kit, we identified antibody isotypes from the 5′ VDJ results and imported those barcodes into the 5′ GEX data for further comparison of immunoglobulin heavy chain calls. Matrix data from Cell Ranger were read into Seurat v3.0 using the open source RStudio (v1.2.1335) [14,15]. Seurat was used to curate and normalize the data, using the instructions listed on the website (https://satijalab.org/seurat/v3.0/pbmc3k_tutorial.html): The Seurat object was created, and mitochondrial percentage assessed for each cell. Violin plots were created to visualize outliers and distribution characteristics. The EBV-immortalized cells are larger than primary B cells and have a higher mitochondrial content and gene set than primary cells (for visualization of primary PBMCs, see Vignettes in [14]). Thus for quality control (QC), minimum and maximum gene features were set at 1000/5000, and mitochondrial percentage at <20% (Figure 2 & Supplementary Figure 2). Data were then normalized using the LogNormalize function at 10,000. Normalized data from the Seurat object were copied into a new matrix and saved as an .rds file for future analysis. The following commands allow pulling out the data from the Seurat object and into an .rds file for further analysis by Alteryx: ○ normdataset <- pbmc[[“RNA”]]@data ○ normnames <- normdataset@Dimnames ○ normdata <- normdataset@x ○ normmatrix <- matrix(normdata, ncol = “number of cells in object”, nrow = “number of gene in object”, dimnames = list(normnames[[1]], normnames[[2]]), byrow = TRUE) ○ normgenenames <- normnames [[1]]. Both ‘normmatrix’ and ‘normgenenames’ were saved as .rds files. To compare isotype class calls in Seurat and in our workflow, we identified a subset of IGHA1s-containing cells in Seurat using the following commands only after the Seurat object had been normalized and scaled using either the standard workflow or ‘SCTransform’ (for SCTransform we also regressed out mitochondrial percentage as suggested): IGHA1s_sub <- subset(‘SeuratObject’, subset = IGHA1s >0) WhichCells(IGHA1s_sub) The cell IDs were then imported into our Alteryx workflow and used to isolate those specific cells identified by Seurat as IGHA1s expressers. All immunoglobulin heavy chain isotypes for each cell were assessed. To input the .rds files into Alteryx, we set up a workflow using the R script tool, with the following commands code: dat <- as.data.frame(readRDS(“C:/filename/normmatrix.rds”)) write.Alteryx(dat, 1) dat2 <- as.data.frame(readRDS(“C:/filename/normgenenames.rds”)) write.Alteryx(dat2, 2) Using the Output Data tool, we copied the new files in Alteryx database format (.yxdb) to the appropriate file. Using Alteryx, we can query and categorize the data matrices from Seurat to find and analyze subpopulations of cells based on their gene expression profiles. This is done by creating workflows that employ a suite of tools designed to manage large datasets. Single-isotype heavy chain-expressing cells were subgrouped based on their expression isotype (IGHM, IGHG1 etc.), and IGHA1 specifically into IGHA1s and IGHA1m subpopulations. Once specific subpopulations were grouped, either analysis was performed in Alteryx or the data were exported into a matrix table for further processing in R or other statistics packages. The relative homology of IGHA1s and IGHG1 was assessed using cDNA transcripts from Ensembl (www.eseast.ensembl.org) of IGHA1 secretory (ENST00000633714.1/ ENSG00000282633.1) and IGHG1-201/202/203 (ENST00000390542.6/ ENST00000390548.6/ ENST00000390549.6). Additional cDNA sequences used for comparison are: IGHG2-202 (ENST00000641095.1), IGHG3-202 (ENST00000641136.1), IGHG4-202 (ENST00000641978.1) and IGHM-202 (ENST00000637539.2). Results & discussion Immortalized B cells and IgA1-secreting cell lines derived from peripheral blood of patients with IgAN and healthy controls were used as model systems for mechanistic studies of Gd-IgA1 production [2]. EBV immortalization targets cells with CD21 receptors and thus creates a heterogenic mixture of B cells and immunoglobulin-secreting cells [16]. A mature B cell can be activated by a specific antigen and various cytokines to undergo a class switch from IgM/IgD to express other antibodies (IgA1/IgA2/IgG1-4/IgE). Once this occurs, the plasma cell or memory B cell does not produce any other antibody isotype [17]. With this in mind, we compared the expression of IGHA1s across all cells in two tested samples (Figure 3). As expected, we saw a range of expression levels, but we did not expect to see the IGHA1s gene expressed in all cells. As both samples were from a mixture of B cells that also secrete IgG and/or IgM (data not shown), we can assume that some or even a majority of the gene calls for IGHA1s were incorrect, and that most of the IGHA1s calls constituted background noise. These observations appear contradictory to the conventional doctrine of ‘one B cell, one antibody’; however, another publication found similar results [18]. Using the same 10× Genomics 5′ VDG and GEX platform, Shi et al. found that a significant number of B cells (∼10–40%) at various stages of differentiation express multiple immunoglobulin heavy chain transcripts [18]. Although the study did not assess the secretory sequence of the immunoglobulin heavy chain transcripts, the results were consistent with our findings. To better elucidate the potential for confounding isotype heavy chain calls in the same cell, we compared IGHA1s expression across all cells with the ratio of other heavy chain isotypes (Figure 4). Figure 4A shows the relationship between IGHA1s and IGHG1 expression in individual cells from a heterogenic B cell population assessed with a 5′ kit. This figure shows that, while there is some variability, as cells increase IGHA1s expression the relative amount of IGHG1 also expressed appears stable. Figure 4B, a close-up panel of Figure 4A, highlights that the majority of cells expressing IGHA1s are low expressers and likely constitute background noise. Figure 4C shows the exact same cells as in Figure 4A & B, but includes information on expression of all other heavy chain isotypes for every cell. These data indicate that across all cells, there will be some level of expression of multiple heavy chain isotypes, confounding the ability to make an isotype-specific designation because the ratio of other isotype heavy chains is variable. This phenomenon is consistent across multiple cell lines, the only difference being the variability of contaminating heavy chain isotypes in different samples (Supplementary Figure 3A–C). We employed the 5′ VDJ-GEX kit from 10× Genomics, which sequences the VDJ transcripts in the same cells along with 5′ GEX transcriptomes. Using the Loupe Browser from 10× Genomics, we incorporated the 5′ VDJ data into the 5′ GEX transcriptome data and exported the cell barcode IDs specific to IGHA1-positive cell calls based on the VDJ analysis [19]. We used this subpopulation of cells to compare IGHA1s and IGHG1 expression (Figure 5). Although the pattern of IGHG1 expression to IGHA1s was slightly different (the cells in Figure 5 are the same cells as in Figure 4), we still found significant IGHG1 expression across a significant number of moderate- to high-expressing IGHA1s cells using the 5′ VDJ scRNA-seq kit. While the power of this approach can yield sequence data on the VDJ regions when combined with transcriptome profiling, the limitation is the poor coverage at the 3′ end where the secreted/membrane sequence is located. Structural homology can be an issue in overlapping calls of similar sequences, but there is limited alignment similarity in the immunoglobin heavy chains [20]. Given that we were observing expression of multiple heavy chain isotypes in the same cell, the simplest answer is that we could be seeing doublets in our capture (i.e., two cells in one droplet), or another mRNA capture overlap from lysed cells. Therefore we checked whether the initial QC steps performed in Seurat to remove data outliers were sufficient. We compared our normal QC workflow with another one with a lower nFeature (3500) cutoff, a lower nFeature and nCount (15,000) and the new SCTransform function in Seurat (VlnPlots shown in Supplementary Figure 4). We found that these modified workflows did not affect the multiple isotype IGH calls in our cells (Supplementary Figure 5). Given the overlap in calls among the different heavy chain isotypes, we needed to find the best route to assign the appropriate antibody isotype. A previous publication analyzing transcriptome and VDJ clonality in B cells from breast cancer tissue found similar issues with assigning isotype class and used a cut-off value of tenfold higher than the next highest expressing heavy chain isotype in that cell [21]. However, because each cell line likely has a unique proportion of immunoglobulin producers in the total population, using a predetermined expression cutoff would not work well. Using IGHA1s, we mapped the relative ratio of its expression to the next highest expressed heavy chain isotype (IGH) for each cell (Figure 6). We can calculate this relationship using the slope of the IGHA1s/IGH, and this can help determine whether the informatic calls for a positive IGHA1s cell are improving. It is important to note that the expression levels have been log-normalized, so biological expression differences are much larger. Although we found a significant positive correlation between cells with higher IGHA1s expression and an increased ratio of IGHA1s/IGH expression, we do not believe we should use a simple expression cut-off measurement to make appropriate isotype calls, because some cells with IGHA1s expression had low IGHA1s/IGH expression ratios (Figure 6). This phenomenon held true for three other cell lines assessed (Supplementary Figure 6). Because we found consistent overlap in the heavy chain isotype calls in the same cell, we assessed expression across multiple heterogenic cell lines from various donors to determine what may be an appropriate ratio to make for a cell heavy chain isotype call. The ratio of IGHA1s/next highest IGH expressed was calculated for each cell across multiple cell lines and transcriptome PCR kits (3′ transcriptome, 5′ GEX and 5′ VDJ). The number of cells that met specific IGHA1s/IGH ratio minimums were tabulated and presented as a percentage of total population (ratios >2, >3, >4; Table 1). Additionally, the average IGHA1s/IGH ratio and standard deviation (SD) were calculated for the total population and used to find cells that fell within one or two SD higher than the average ratio; these were presented as a percentage of the total population (1SD, 2SD; Table 1). As shown in Table 1, there were substantial differences between cell lines in the amount of IGHA1s expression, but also in the relationship between the SD percentage and the hard ratio cutoff numbers. We did not see a consistent relationship between 1SD or 2SD cell numbers and the hard cutoff ratio numbers (>2, >3, >4), suggesting that biological variability may confound any attempt to assign isotype based on SD. Table 1. Percentage of cells out of the total population falling within a specific IGHA1s/next-highest isotype heavy chain expression ratio. 5′ GEX Percentage of total population, IGHA1s/IGH ratio IGHA1s/IGH ratio >2 >3 >4 1SD† 2SD† Avg SD Cell line A 1.76 0.54 0.23 11.45 4.24 0.48 0.49 Cell line B 4.26 1.60 0.70 9.46 4.46 0.63 0.67 Cell line C 6.96 3.19 1.84 8.21 3.77 0.86 0.91 5′ VDJ Cell line A 0.45 0.09 0.09 2.93 1.26 0.46 0.48 Cell line B 3.36 1.31 0.66 7.41 3.48 0.62 0.67 Cell line C 0.48 0.14 0.00 1.21 0.48 0.80 0.64 3′ GEX Cell line D 8.02 3.66 1.68 9.93 4.50 0.85 0.87 Cell line E 4.06 1.59 0.77 9.72 4.26 0.69 0.63 Cell line F 9.84 4.95 2.72 9.84 4.58 0.93 1.07 Cell line G 3.23 1.44 0.58 9.09 3.69 0.60 0.63 Three cell lines (A, B and C) were analyzed using two different kits: 5′ GEX and 5′ VDJ. Four cell lines (D, E, F and G) were analyzed using the 3′ GEX kit. Each cell was analyzed for its IGHA1s/IGH ratio using the highest other expressing immunoglobulin heavy chain in that cell. The total number of cells meeting the ratio criteria of >2, >3 and >4 were added up and presented as a percentage of the total population. The average IGHA1s/IGH ratio for all the cells in the population was calculated, as well as the SD of the total population (right-hand column). These were used to calculate how many cells had IGHA1s/IGH ratios higher than one or two SD above the average. †1 or 2 SD higher than the average ratio (Avg + 1*SD or Avg + 2*SD). Avg: Average; IGH: Immunoglobulin heavy chain isotype; IGHA1s: IgA1-secreting; SD: Standard deviation. To assess the overlap of IGHA1 secreted and membrane splice variants, ratios for IGHA1s/IGHA1m were calculated for every cell (Figure 7). A pattern similar to that seen in Figure 6 was observed, but with higher ratios associating with higher expression of IGHA1s. A significant difference between IGHA1s/m splice variants and IGHA1s and other IGH expression is the substantially higher slope value for IGHA1s/IGHA1m ratios (1.95 vs 0.68; Figures 6 & 7). It is unclear whether this greater specificity in calls for IGHA1s versus IGHA1m versus delineation from other IGH has a technical or biological underpinning. As shown in Table 2, the percentage of cells with high ratios of IGHA1s/IGHA1m was substantially greater than the comparisons shown in Table 1. This observation further supports the idea that making the call between IGHA1s and IGHA1m splice variants is easier than for alternative IGH expressers when comparing with IGHA1s. However, while most antibody-secreting cells do not express cell-surface B cell receptor, there are data suggesting that some antibody-secreting cells have an active B cell receptor [22]. This means that there will be subpopulations of cells that are only IgA1 secretors, some that are only IgA1 presenters and some that are both. Table 2. Percentage of cells out of the total population falling within a specific IGHA1s/IGHA1m ratio. 5′ GEX Percentage of total population, IGHA1s/IGHA1m IGHA1s/IGHA1m ratio >2 >3 >4 1SD† 2SD† Avg SD Cell line A 23.22 11.99 4.82 12.17 4.10 0.48 0.49 Cell line B 16.99 10.81 5.94 9.05 4.50 0.63 0.67 Cell line C 56.62 47.20 20.24 9.95 3.29 0.86 0.91 5′ VDJ Cell line A 6.45 3.25 1.35 3.43 1.22 0.46 0.48 Cell line B 13.55 8.56 4.67 8.56 3.81 0.62 0.67 Cell line C 3.96 3.19 1.35 0.72 0.24 0.80 0.64 3′ GEX Cell line D 20.09 9.58 5.14 33.71 4.59 0.85 0.87 Cell line E 19.07 7.42 3.92 10.74 4.55 0.69 0.63 Cell line F 16.08 8.23 4.83 9.93 4.83 0.93 1.07 Cell line G 19.94 10.97 6.14 9.92 4.30 0.60 0.63 Three cell lines (A, B and C) were analyzed from two different kits, 5′ GEX and 5′ VDJ. Four cell lines (D, E, F and G) were analyzed from the 3′ GEX kit. Each cell was analyzed for its IGHA1s/IGHA1m ratio. The total number of cells meeting the ratio criteria of >2, >3 and >4 were added up and presented as a percentage of the total population. The average IGHA1s/IGHA1m ratio for all the cells in the population was calculated, as well as the SD of the total population (right-hand column). These were used to calculate how many cells had an IGHA1s/IGHA1m ratio higher than one or two SD above the average. †1 or 2 SD higher than the average ratio (Avg + 1*SD or Avg + 2*SD). Avg: Average; IGHA1m: IgA1 membrane-bound; IGHA1s: IgA1-secreting; SD: Standard deviation. Screening for only cells that have a ratio >2 of IGHA1s/IGH, we calculated the IGHA1s/IGHA1m ratio and plotted against IGHA1s expression level. This approach provided a mechanism to screen cells for IGHA1s specificity versus other IGH expressers and determine the splice variants for IGHA1 secretion, membrane or both within a cell. Figure 8A shows the relationship between IGHA1s/IGHA1m in cells where the IGHA1s expression ratio was >2 compared with expression of all other IGH isotypes. The slope (and ratios) in Figure 8A is significantly higher than the slope in the total cell population in IGHA1s/IGHA1m analysis (Figure 7A), indicating that selecting for lower background of other non-IGHA1 IGH transcripts can increase the specificity for IGHA1s-expressing cells. Figure 8B shows the relationship of IGHA1s to all other IGH isotypes expressed in the same cell after screening for a ratio >2. This workflow compares well for isotype specificity (IGHA1s in this case) when viewed against the overall isotype overlap in Figure 4C & Figure 6. An alternate workflow to assess splice variants at the 3′ end using nanopore technology has also been employed with the 10× Genomics 3′ kit. The cDNA was split for gene expression analysis and whole sequencing of antibody genes, providing significant coverage on the 3′ end for secretion versus membrane delineation. This approach requires both nanopore and next-generation sequencing technologies and has a lower recovery of cell barcodes, but could potentially be used alongside a standard 3′ gene expression workflow [7]. Using a combination of R tools to curate the data and Alteryx to visualize and subcategorize cell populations, we can better identify critical IgA1-producing cells with more accurate isotype calls. With this bioinformatic and single-cell transcriptome approach, we can cast a broader net to assess heterogenic populations of IgA1-secreting cells using complex mixtures of immortalized as well as primary B cells. Future perspective Future work in primary PBMCs is necessary to assess this bioinformatic workflow in nonimmortalized cells to address potential transcriptional variables associated with the immortalization process. EBV does not infect and immortalize all the B cells in a PBMC pool; thus the immortalized pool only provides a random snapshot of some of the B cells, further highlighting the need for primary cell work. Additionally, to help validate class identification, we will combine immunoglobulin cell-surface detection and single-cell transcriptomics when assessing B cells. One of these technologies used by 10× Genomics is CITE-seq (Cellular Indexing and Transcriptomes and Epitopes), which combines nucleotide-tagged antibodies for cell-surface targets [23]. This work will help to classify some B cells but may be problematic in those antibody-secreting cells that do not present with cell-surface antibodies. This limitation can be addressed by using known subcloned B cells lines that secrete a single isotype. Supplementary data To view the supplementary data that accompany this paper please visit the journal website at: www.future-science.com/doi/suppl/10.2144/btn-2020-0044 Author contributions C Reily designed the study, performed data analysis and drafted the manuscript. N Xu performed data analysis. D Crossman designed the 10× Ranger pipeline and performed data analysis. All authors were responsible for manuscript editing. Acknowledgments The authors thank J Novak and B Julian for providing the immortalized cell lines (with IRB approval) and for their advice on this project, and L Shanrun for his support in running and executing the single-cell transcriptomics core at the University of Alabama at Birmingham. C Reily appreciates J Novak and A Agarwal for their mentoring during the K01 award. Financial & competing interests disclosure This work was supported by grants from the National Institutes of Health (R03DK122194, K01DK106341) and University of Alabama at Birmingham Center for Clinical and Translational Science (UL1TR003096). The authors have no other relevant affiliations or financial involvement with any organization or entity with a financial interest in or financial conflict with the subject matter or materials discussed in the manuscript apart from those disclosed. No writing assistance was utilized in the production of this manuscript. Ethical conduct of research The authors state that they have obtained appropriate institutional review board approval through the University of Alabama at Birmingham IRB (#070413006). In addition, informed consent was obtained from all donors and participants. Open access This work is licensed under the Attribution-NonCommercial-NoDerivatives 4.0 Unported License. To view a copy of this license, visit http://creativecommons.org/licenses/by-nc-nd/4.0/ References 1. Wyatt RJ, Julian BA. IgA nephropathy. N. Engl. J. Med. 368(25), 2402–2414 (2013).Crossref, Medline, CAS, Google Scholar 2. Suzuki H, Moldoveanu Z, Hall S et al. IgA1-secreting cell lines from patients with IgA nephropathy produce aberrantly glycosylated IgA1. J. Clin. Invest. 118(2), 629–639 (2008).Medline, CAS, Google Scholar 3. Suzuki H, Raska M, Yamada K et al. Cytokines alter IgA1 O-glycosylation by dysregulating C1GalT1 and ST6GalNAc-II enzymes. J. Biol. Chem. 289, 5330–5339 (2014).Crossref, Medline, CAS, Google Scholar 4. Yamada K, Huang ZQ, Raska M et al. Inhibition of STAT3 signaling reduces IgA1 autoantigen production in IgA nephropathy. Kidney Int. Rep. 2(6), 1194–1207 (2017).Crossref, Medline, Google Scholar 5. Kiryluk K, Li Y, Moldoveanu Z et al. GWAS for serum galactose-deficient IgA1 implicates critical genes of the O-glycosylation pathway. PLoS Genet. 13(2), e1006609 (2017).Crossref, Medline, Google Scholar 6. Yamada K, Huang Z, Raska M, Reily CR, Aderson J, Suzuki H et al. LIF signaling enhances production of galactose-deficient IgA1 in IgA nephropathy. Kidney Dis. 6(3), 168–180 (2020).Crossref, Google Scholar 7. Singh M, Al-Eryani G, Carswell S et al. High-throughput targeted long-read single cell sequencing reveals the clonal and transcriptional landscape of lymphocytes. Nat. Commun. 10(1), 3120 (2019).Crossref, Medline, Google Scholar 8. Butler A, Hoffman P, Smibert P, Papalexi E, Satija R. Integrating single-cell transcriptomic data across different conditions, technologies, and species. Nat. Biotechnol. 36(5), 411–420 (2018).Crossref, Medline, CAS, Google Scholar 9. Early P, Hood L. Allelic exclusion and nonproductive immunoglobulin gene rearrangements. Cell 24(1), 1–3 (1981).Crossref, Medline, CAS, Google Scholar 10. Zheng GX, Lau BT, Schnall-Levin M et al. Haplotyping germline and cancer genomes with high-throughput linked-read sequencing. Nat. Biotechnol. 34(3), 303–311 (2016).Crossref, Medline, CAS, Google Scholar 11. Lindeman I, Emerton G, Mamanova L et al. BraCeR: B-cell-receptor reconstruction and clonality inference from single-cell RNA-seq. Nat. Methods 15(8), 563–565 (2018).Crossref, Medline, CAS, Google Scholar 12. See P, Lum J, Chen J, Ginhoux F. A single-cell sequencing guide for immunologists. Front. Immunol. 9, 2425 (2018).Crossref, Medline, Google Scholar 13. Alteryx, Inc. http://www.alteryx.comGoogle Scholar 14. Satija Lab. Seurat software. https://satijalab.org/seurat/Google Scholar 15. RStudio. https://rstudio.comGoogle Scholar 16. Sinclair AJ, Farrell PJ. Host cell requirements for efficient infection of quiescent primary B lymphocytes by Epstein–Barr virus. J. Virol. 69(9), 5461–5468 (1995).Crossref, Medline, CAS, Google Scholar 17. Owen JA, Punt J, Stranford SA, Jones PP, Kuby J. Kuby Immunology (7th Edition). WH Freeman, NY, USA (2013).Google Scholar 18. Shi Z, Zhang Q, Yan H et al. More than one antibody of individual B cells revealed by single-cell immune profiling. Cell Discov. 5, 64 (2019).Crossref, CAS, Google Scholar 19. 10× Genomics. What is Loupe browser? https://support.10×genomics.com/single-cell-gene-expression/software/visualization/latest/what-is-loupe-cell-browserGoogle Scholar 20. Janeway CA, Travers P, Walport M, Schlomchik MJ. Structural Variation in Immunoglobulin Constant Regions. Garland Science, NY, USA (2001).Google Scholar 21. Hu Q, Hong Y, Qi P et al. An atlas of infiltrated B-lymphocytes in breast cancer revealed by paired single-cell RNA-sequencing and antigen receptor profiling. bioRxiv doi:10.1101/695601 (2019). [Epub ahead of print]Google Scholar 22. Pinto D, Montani E, Bolli M et al. A functional BCR in human IgA and IgM plasma cells. Blood 121(20), 4110–4114 (2013).Crossref, Medline, CAS, Google Scholar 23. Stoeckius M, Hafemeister C, Stephenson W et al. Simultaneous epitope and transcriptome measurement in single cells. Nat. Methods 14(9), 865–868 (2017).Crossref, Medline, CAS, Google Scholar
|
|
Scooped by
Gilbert C FAURE
December 9, 2020 9:08 AM
|
/PRNewswire/ -- The National Kidney Foundation (NKF) in partnership with the IGA Nephropathy Foundation of America, Inc. (IGANF), submitted the "Voice of the...
|
|
Scooped by
Gilbert C FAURE
November 17, 2020 11:51 AM
|
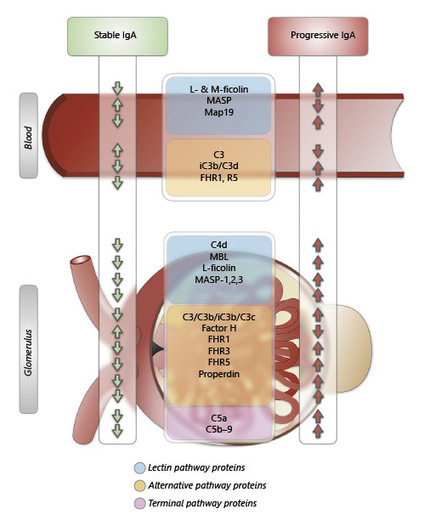
Glomerular C4d (C4dG) as an indicator of the lectin pathway of complement activation in immunoglobulin A nephropathy (IgAN) has been associated with m…...
|
|
Scooped by
Gilbert C FAURE
August 9, 2020 6:47 AM
|
The prevalence of monoclonal IgA deposition was 9.2 %. Although some parameters differed between the groups, renal outcome were similar. Thus, IgAN with monoclonal IgA deposition seems not to be different entity from those with polyclonal IgA deposition.
|
|
Scooped by
Gilbert C FAURE
April 10, 2020 2:36 PM
|
Delveinsight Business Research DelveInsight’s ‘IgA Nephropathy Epidemiology Forecast to 2030’ report delivers an in-depth understanding of the disease, historical and forecasted IgA Nephropathy epidemiology in the 7MM, i.e., the United States, EU5 (Germany, Spain, Italy, France, and the United Kingdom), and Japan. IgA Nephropathy (IgAN), also known as Berger’s disease, is a kidney disease that occurs when IgA deposits build up in the kidneys, causing inflammation that damages kidney tissues. IgA is an antibody which is a protein made by the immune system to protect the body from foreign substances such as bacteria or viruses. IgA nephropathy affects the kidneys by attacking the glomeruli. The glomeruli are sets of looping blood vessels in nephrons which is the tiny working units of the kidneys that filter wastes and remove extra fluid from the blood. The buildup of IgA deposits inflames and damages the glomeruli, causing the kidneys to leak blood and protein into the urine. The damage may lead to scarring of the nephrons that progresses slowly over many years. Eventually, IgA nephropathy can lead to End‐stage Renal Disease (ESRD). Which means the kidneys no longer work well enough to keep a person healthy. In its early stages, IgA nephropathy may have no symptoms; it can be silent for years or even decades. Once symptoms appear, the most common one is hematuria. Hematuria can be a sign of damaged glomeruli. Another symptom of IgA nephropathy is albuminuria. After 10 to 20 years with IgA nephropathy, about 20 to 40 per cent of adults develop end‐stage kidney disease. Signs and symptoms of end‐stage kidney disease may include high blood pressure, edema, drowsiness, dry skin, appetite loss, nausea, vomiting, sleep problems, trouble concentrating, darkened skin, muscle cramps etc. There are several factors that lead to IgA nephropathy progression and limit the patient’s life expectancy. These include disease progression as well as some other disease factors, such as diabetes, hypertension, and cardiovascular‐related lifestyle conditions. The DelveInsight IgA Nephropathy epidemiology report gives a thorough understanding of the IgA Nephropathy by including details such as disease definition, symptoms, causes, pathophysiology, and diagnosis. It also provides treatment algorithms and treatment guidelines for IgA Nephropathy in the US, Europe, and Japan. The report covers the detailed information of the IgA Nephropathy epidemiology scenario in seven major countries (US, EU5, and Japan). Key Highlights Of The Report As per the study conducted by Lafayette et al. IgA Immunoglobulin A (IgA) nephropathy is the most common form of primary glomerulonephritis, with a global incidence of at least 2.5 per 100,000 per year in adults. As per the American Kidney Fund, about one in every four adults with IgA nephropathy eventually gets kidney failure/End‐Stage Renal Disease (ESRD). Approximately, one in every 10–20 children gets kidney failure/End‐stage Renal Disease (ESRD) because of IgA nephropathy. In a study titled “Race/ethnicity and disease severity in IgA nephropathy”, conducted by Hall et al., IgA nephropathy is the most common form of glomerulonephritis (GN) worldwide. Approximately 20– 30% of individuals with IgA Neuropathy develop the end‐stage renal disease (ESRD) by 10–20 years following diagnosis. A study was conducted in France by Occelli et al., titled “Mapping End‐Stage Renal Disease (ESRD): Spatial Variations on Small Area Level in Northern France, and Association with Deprivation” that revealed that there are significant geographic differences in ESRD incidence. Request for Sample Pages: https://delveinsight.com/sample-request/iga-nephropathy-igan-epidemiology-forecast IgA Nephropathy Epidemiology Delveinsight’s IgA Nephropathy epidemiology division provides insights about historical and current patient pool and forecasted trends for every seven major countries. The IgA Nephropathy epidemiology data are studied through all possible divisions to give a better understanding of the Disease scenario in 7MM. The IgA Nephropathy epidemiology segment covers the epidemiology data in the US, EU5 countries (Germany, Spain, Italy, France, and the UK), and Japan from 2017 to 2030. It also helps to recognize the causes of current and forecasted trends by exploring numerous studies, survey reports and views of key opinion leaders. Scope of the Report The report provides insight into the historical and forecasted patient pool of IgA Nephropathy in seven major markets covering the United States, EU5 (Germany, Spain, France, Italy, UK), and Japan. The report assesses the disease risk and burden and highlights the unmet needs of IgA Nephropathy. The report helps to recognize the growth opportunities in the 7MM with respect to the patient population. The IgA Nephropathy report provides a detailed overview explaining its causes, symptoms, classification, pathophysiology, diagnosis and treatment patterns. The IgA Nephropathy Epidemiology Report and Model provide an overview of the risk factors and global trends of IgA Nephropathy in the seven major markets (7MM:US, France, Germany, Italy, Spain, UK, and Japan). The report provides the segmentation of the IgA Nephropathy epidemiology. Key Questions Covered In The IgA Nephropathy Report Include: What will be the growth opportunities in the 7MM with respect to the patient population pertaining to IgA Nephropathy? What are the key findings pertaining to the IgA Nephropathy epidemiology across 7MM and which country will have the highest number of patients during the forecast period (2017-2030)? What would be the total number of patients of IgA Nephropathy across the 7MM during the forecast period (2017-2030)? Among the EU5 countries, which country will have the highest number of patients during the forecast period (2017-2030)? At what CAGR the patient population is expected to grow in 7MM during the forecast period (2017-2030)? What is the disease risk, burden and unmet needs of the IgA Nephropathy? What are the currently available treatments of IgA Nephropathy? Key Benefit of IgA Nephropathy Epidemiology Report The IgA Nephropathy Epidemiology report will allow the user to – Develop business strategies by understanding the trends shaping and driving the global IgA Nephropathy market. Quantify patient populations in the global IgA Nephropathy market to improve product design, pricing, and launch plans. Organize sales and marketing efforts by identifying the age groups and sex that present the best opportunities for IgA Nephropathy therapeutics in each of the markets covered. Understand the magnitude of IgA Nephropathy population by its epidemiology. The IgA Nephropathy Epidemiology Model developed by DelveInsight is easy to navigate, interactive with dashboards, and epidemiology based with transparent and consistent methodologies. Moreover, the model supports data presented in the report and showcases disease trends over 11-year forecast period using reputable sources. Table of Contents Key Insights Executive Summary of IgA Nephropathy IgA Nephropathy Disease Background and Overview IgA Nephropathy Sign and Symptoms IgA Nephropathy Pathophysiology IgA Nephropathy Risk Factors IgA Nephropathy Diagnosis IgA Nephropathy Patient Journey IgA Nephropathy Epidemiology and Patient Population IgA Nephropathy Treatment Algorithm, Current Treatment, and Medical Practices KOL Views on IgA Nephropathy IgA Nephropathy Unmet Needs Appendix DelveInsight Capabilities Disclaimer *The table of contents is not exhaustive; will be provided in the final report About DelveInsight DelveInsight is a leading Business Consultant, and Market Research Firm focused exclusively on life sciences. It supports pharma companies by providing end to end comprehensive solutions to improve their performance. Related Reports: IgA Nephropathy (IgAN) Market Insight, Epidemiology and Market Forecast 2030 DelveInsight’ s IgA Nephropathy (IgAN) Market Insights, Epidemiology and Market Forecast 2030 report provides a detailed overview of the disease and in-depth understanding of historical and forecasted epidemiology. IgA Nephropathy (IgAN) Pipeline Insights, 2020 IgA Nephropathy (IgAN) Pipeline Insight, 2020 report by DelveInsight outlays comprehensive insights of present clinical development scenario and growth prospects across the IgA Nephropathy (IgAN) market. Media Contact Company Name: DelveInsight Business Research LLP Contact Person: Anuj Rawat Email: Send Email Phone: +919650213330 Address:304 S. Jones Blvd #2432 City: Albany State: New York Country: United States Website: https://www.delveinsight.com/
|