Your new post is loading...

|
Scooped by
Gilbert C FAURE
June 14, 2018 2:30 PM
|
Antigen-specific immunoglobulin (Ig) A plays a major role in host defense against infections in gut mucosal tissue. Follicular helper T (Tfh) cells are located in germinal centers and promote IgA production via interactions with germinal center B cells.
|
|
Scooped by
Gilbert C FAURE
June 13, 2018 12:11 PM
|
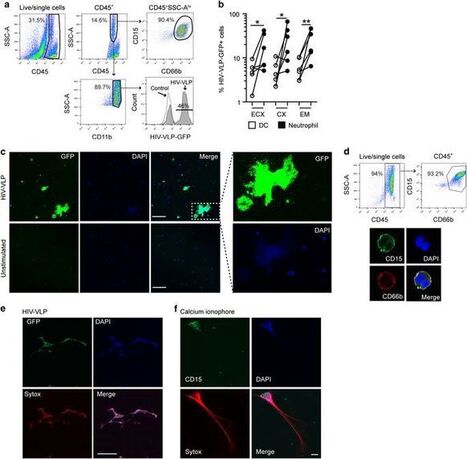
Infiltration of neutrophils into colonic mucosa has been associated with the severity of ulcerative colitis (UC). We investigated the effect of disease microenvironment on the release of neutrophil extracellular traps (NETs) as well as the involved mechanisms in NETosis and whether certain NET proteins are correlated with disease phenotype. Peripheral blood neutrophils, sera, and colonic tissue were collected from treatment-naive and mesalazine-treated patients with active UC, treatment-naive patients with active Crohn’s disease, patients suffering from infectious colitis, or healthy individuals (controls). Analysis of colonic biopsy specimens and peripheral blood neutrophils for the presence of NET-related markers using immunofluorescence confocal microscopy, ELISA, immunoblotting, flow cytometry, and quantitative PCR were performed. In vitro cell and tissue culture systems were further deployed. The local inflammatory response in colon in UC, but not Crohn’s disease, is characterized by the presence of NETs carrying bioactive IL-1β and thrombogenic tissue factor. The inflammatory environment of UC is able to induce neutrophil activation, IL-1β expression, and NET release, as shown both ex vivo and in vitro. REDD1 expression, as a mediator linking inflammation, autophagy, and NET release, was also specifically associated with the inflammatory response of UC. We show that neutrophil expression of REDD1 in colon tissue and the presence of IL-1β in neutrophils/NETs provide candidate biomarkers for the differential diagnosis of inflammatory colitis and possible targets for the treatment of UC, suggesting that UC shares common features with autoinflammatory disorders.
|
|
Scooped by
Gilbert C FAURE
June 13, 2018 6:46 AM
|
The unique composition of a mother's breastmilk may help to reduce food sensitization in her infant, report researchers at the University of California San Diego School of Medicine with colleagues in Canada.
|
|
Scooped by
Gilbert C FAURE
June 12, 2018 9:24 AM
|
Human γδ T-cells include some of the most common ‘antigen-specific’ cell types in peripheral blood and are enriched yet further at mucosal barrier sites where microbial infection and tumors often originate. While the γδ T-cell compartment includes multiple subsets with highly flexible effector functions, human mucosal tissues are dominated by host stress-responsive Vδ1+ T-cells and microbe-responsive Vδ2+ T-cells. Widely recognized for their potent cytotoxicity, emerging data suggest that γδ T-cells also exert strong influences on downstream adaptive immunity to pathogens and tumors, in particular via activation of antigen-presenting cells and/or direct stimulation of other mucosal leukocytes. These unique functional attributes and lack of MHC restriction have prompted considerable interest in therapeutic targeting of γδ T-cells. Indeed, several drugs already in clinical use including vedolizumab, infliximab, and azathioprine likely owe their efficacy in part to modulation of γδ T-cell function. Recent clinical trials of Vδ2+ T-cell-selective treatments indicate a good safety profile in human patients, and efficacy is set to increase as more potent/targeted drugs continue to be developed. Key advances will include identifying methods of directing γδ T-cell recruitment to specific tissues to enhance host protection against invading pathogens, or alternatively, retaining these cells in the circulation to limit peripheral inflammation and/or improve responses to bloo
|
|
Scooped by
Gilbert C FAURE
June 12, 2018 2:23 AM
|
|
|
Scooped by
Gilbert C FAURE
June 6, 2018 3:19 PM
|
|
|
Scooped by
Gilbert C FAURE
June 5, 2018 2:09 AM
|

|
Suggested by
Société Francaise d'Immunologie
June 4, 2018 4:26 AM
|
Inflammatory lung responses are one of the characterized features in the pathogenesis of many lung diseases including acute respiratory distress syndrome (ARDS) and chronic obstructive pulmonary disease (COPD). Alveolar macrophages (AMs) and alveolar epithelial cells are the first line of host defense and innate immunity. Due to their central roles in both the initiation and resolution of inflammatory lung responses, AMs constantly communicate with other lung cells including the alveolar epithelial cells. In the past, emerging evidence suggests that extracellular vesicles (EVs) play an essential role in cell-cell crosstalk. In this review, we will discuss the recent findings on the intercellular communications between lung epithelial cells and alveolar macrophages, via EV-mediated signal transfer.
|
|
Scooped by
Gilbert C FAURE
May 20, 2018 5:56 AM
|
Research ArticleAutoimmunityImmunology Free access | 10.1172/JCI98819 Disease-driving CD4+ T cell clonotypes persist for decades in celiac disease Louise F. Risnes,1 Asbjørn Christophersen,2 Shiva Dahal-Koirala,1 Ralf S. Neumann,2 Geir K. Sandve,2,3 Vikas K. Sarna,2 Knut E.A. Lundin,1,2,4 Shuo-Wang Qiao,1,2 and Ludvig M. Sollid1,2 First published May 14, 2018 - More info Abstract Little is known about the repertoire dynamics and persistence of pathogenic T cells in HLA-associated disorders. In celiac disease, a disorder with a strong association with certain HLA-DQ allotypes, presumed pathogenic T cells can be visualized and isolated with HLA-DQ:gluten tetramers, thereby enabling further characterization. Single and bulk populations of HLA-DQ:gluten tetramer–sorted CD4+ T cells were analyzed by high-throughput DNA sequencing of rearranged TCR-α and -β genes. Blood and gut biopsy samples from 21 celiac disease patients, taken at various stages of disease and in intervals of weeks to decades apart, were examined. Persistence of the same clonotypes was seen in both compartments over decades, with up to 53% overlap between samples obtained 16 to 28 years apart. Further, we observed that the recall response following oral gluten challenge was dominated by preexisting CD4+ T cell clonotypes. Public features were frequent among gluten-specific T cells, as 10% of TCR-α, TCR-β, or paired TCR-αβ amino acid sequences of total 1813 TCRs generated from 17 patients were observed in 2 or more patients. In established celiac disease, the T cell clonotypes that recognize gluten are persistent for decades, making up fixed repertoires that prevalently exhibit public features. These T cells represent an attractive therapeutic target. Introduction As T cells recognize peptide antigen with their TCRs in the context of MHC (HLA in humans) molecules, T cells very likely play a central role in HLA-associated disorders (1,2). Each naive T cell has a unique αβTCR as a result of gene recombination of different V, D, and J germline segments and random deletion or insertion of nongermline nucleotides at the V(D)J junction. Upon antigen recognition by the TCRs, T cells become activated and clonally expand, and naive T cells change phenotype to become memory T cells. The TCR repertoire is made up of the collective representation of unique, rearranged TCRs. Technology developments have opened avenues to explore TCR repertoire in infectious and autoimmune conditions with high-throughput methods (3–5). Obviously, in HLA-associated disorders, monitoring of the dynamics of pathogenic T cells in time and body space will be of interest. This is, however, challenging, mainly due to difficulties in defining pathogenic T cells, and no studies have so far investigated changes in the repertoires of antigen-specific and disease-relevant T cells. By harnessing HLA-DQ:gluten tetramers (6–11) relevant to celiac disease (CD) covering the immunodominant gluten epitopes (DQ2.5-glia-α1a, DQ2.5-glia-α2, DQ2.5-glia-ω1, DQ2.5-glia-ω2, DQ8-glia-α1, and DQ8-glia-γ1b) (12–16) and undertaking large-scale TCR sequencing of HLA-DQ:gluten tetramer–binding cells, we have performed a study addressing TCR repertoire dynamics and maintenance. CD is an autoimmune and inflammatory disease of the small intestine driven by gluten-specific CD4+ T cells that recognize deamidated gluten peptides in the context of the disease-associated HLA-DQ2/8 molecules (17–19). More than 20 gluten T cell epitopes have been identified, but each individual patient does not mount a T cell response to all epitopes (16). More frequent responses are seen to immunodominant epitopes, and within each patient, the immunodominant epitopes make up substantial parts of the total antigluten T cell responses. The disease activity in CD is controlled by dietary gluten exposure, and hence, life-long gluten-free diet (GFD) is an effective treatment of the disease. In this study, we have followed the dynamics of the TCR repertoire of disease-driving T cells in blood and gut tissue of patients after they start treatment with GFD and monitored changes in the TCR repertoire over an extended period of time and after gluten challenge in treated CD patients. Results Identical gluten-specific clonotypes are found in peripheral blood and gut mucosa. We sorted gluten-specific CD4+ T cells binding to a pool of 4 HLA-DQ:gluten tetramers presenting the most immunodominant HLA-DQ2.5–restricted gluten epitopes from matched blood and gut biopsy samples from 3 untreated CD (UCD) patients (Supplemental Figure 1; supplemental material available online with this article; https://doi.org/10.1172/JCI98819DS1). While such tetramer-binding cells amount to around 2% of CD4+ T cells in intestinal lamina propria of untreated patients, these cells are rare in blood, ranging from 3 to 70 cells per million CD4+ T cells (Figure 1A and Supplemental Table 1). Identical TCR-β clonotypes defined by a unique nucleotide sequence were found in both sampled compartments (Supplemental Figure 2A). Because of sampling limitations, the maximum observed clonotype overlap between 2 independent sequencing experiments of the same sample was around 50% (95% CI, 42%–59%) (Supplemental Figure 2B). Based on the high degree of clonotype sharing and the fact that the HLA-DQ:gluten tetramer–binding effector-memory T cells in blood were gut homing (Supplemental Figure 1), we conclude that the more easily accessible gluten-specific T cells in blood reflect the repertoire of the gluten-specific T cells in gut. Figure 1 The number of circulating gluten-specific T cells decreases after commencement of GFD, and the T cell repertoires overlap in samples taken weeks or years apart. (A) Frequency of gut-homing effector-memory CD4+ T cells binding to a pool of HLA-DQ:gluten tetramers in blood and gut samples taken from 6 patients during the first weeks and 1 to 2 years after commencement of GFD. (B) Distribution of TCR-αβ clonotypes obtained by single-cell TCR sequencing of gluten-specific T cells from 2 patients with the most available TCR data. Data from the remaining 4 patients are shown in Supplemental Figure 3A. Clonotypes observed in at least 2 cells are plotted as stacked boxes in the percentage of the total number of cells. The clonal size of the most dominant clonotype is displayed as a number. The total numbers of clonotypes and cells in each sample are shown below each stacked bar. (C) Area-proportional Venn diagrams of TCR-αβ clonotypes obtained by single-cell sequencing at various time points after commencement of GFD. The patients indicated in the top panels were followed for 10 weeks up to 1 year, whereas the patients indicated in the lower panels were followed for 1 to 2 years after commencement of GFD. The dark red areas represent clonotypes that were observed both at the latest time points and when the patients were untreated. The percentages denote the proportion of these shared clonotypes (dark red areas) at the latest time point (black border). The remaining clonotype overlaps are marked in light red. Asterisks indicate that data were obtained from blood sample only. Frequency of gluten-specific CD4+ T cells decreases upon GFD. We analyzed gluten-specific T cells in gut biopsies and in peripheral blood of 6 UCD patients who were followed up until 2 years after commencement of GFD. Upon commencement of GFD, the frequency of gluten-specific T cells in blood decreased in all subjects, but at a variable rate. Most subjects had a clear decline by 1 year, except 2 subjects (CD1283 and CD1268) who showed a decrease in the frequency of gluten-specific CD4+ T cells only at additional follow-up after 2 years of GFD. From all 6 patients, we sorted circulating and gut tissue–resident gluten-specific CD4+ T cells as single cells and performed paired TCR-αβ sequencing. We observed expansion of multiple clones in all samples. The extent of clonal dominance, calculated by the sample-corrected Shannon diversity index, was highest in UCD patients and decreased upon GFD (Figure 1B and Supplemental Figure 3, A and B). Thus, clonal contraction contributes to the observed decrease in the frequency of circulating gluten-specific CD4+ T cells upon GFD. The same clonotypes are found in multiple samples taken weeks to years apart. Next, we studied whether cells of the same clonotype, defined by cells expressing paired identical nucleotide TCR-αβ chains, were present in samples taken at different time points from the same individual. We found in all 6 patients the reoccurrence of many clonotypes in multiple samples (Figure 1C). The proportion of clonotypes found after commencement of GFD that were also found in the first samples when the patients were untreated varied somewhat, likely due to limited sampling. More importantly, there was no trend of decreasing overlap over time. Since the patients were on GFD after the initial sampling point, new gluten-specific clonotypes should not have been recruited from the naive to the memory repertoire. Thus, after commencement of GFD, the clonally expanded gluten-specific T cells contract and remain as memory T cells. Gluten-specific memory T cells expand and dominate on oral gluten challenge. To study the impact of gluten antigen reintroduction on the gluten-specific T cell repertoire, we challenged treated CD patients with dietary gluten for 14 days. In 7 participants who showed significant increase in the number of HLA-DQ:gluten tetramer–binding T cells after gluten challenge, we performed paired single-cell TCR-αβ sequencing (Figure 2A). Similarly to what was shown in earlier findings (20), we found that the total number of circulating gluten-specific T cells reached a peak level on day 6 (Figure 2A) and that the repertoires were composed of clonally expanded cells from a diverse set of clonotypes (Figure 2B). The degree of clonal expansion increased, as demonstrated by a lower sample-corrected Shannon diversity index, in the circulating gluten-specific T cells on day 6 (Supplemental Figure 3, C and D). Figure 2 Preexisting T cell clonotypes expand and dominate during and after gluten-challenge response. (A) Frequency of CD4+ T cells binding to a pool of HLA-DQ:gluten tetramers in blood and duodenal biopsy samples from 7 patients during gluten challenge. Tem, effector-memory T cells. (B) Distribution of TCR-αβ clonotypes obtained by single-cell TCR sequencing of tetramer-binding T cells from the 2 patients who showed the most response. Data from the remaining 5 patients are shown in Supplemental Figure 3C and Supplemental Figure 4. The x axes denote the sampling time points baseline before challenge (B) and day 6 (D6), day 14, and day 28 after the initiation of gluten challenge. The y axes show the percentage share of each clonotype represented as stacked boxes. Only clonotypes observed in at least 2 cells are plotted, and the most dominant clonotypes are displayed as numbers within the boxes. The colored boxes represent the 3 most dominant clonotypes at day 6 that were also observed at other time points. The isolated and nonstacked colored boxes represent shared clonotypes with clonal size 1. The total numbers of clonotypes and cells in each sample are shown below each stacked bar. Reoccurrence of identical TCR clonotypes in different samples from patients CD1300 and CD442 is depicted in area-proportional Venn diagrams (C and D). (C) TCR-αβ clonotype data obtained by single-cell sequencing. (D) TCR-β clonotype data compiled from both single-cell and bulk sequencing. The dark red areas represent clonotypes that were observed both at baseline and at the latest time point. The percentages denote the proportion of these shared clonotypes (dark red areas) at the latest time points (black border). The light red areas represent all other clonotype overlaps. Asterisks show only single-cell data for day 28. A major question coming from this challenge study is whether the gluten-specific T cell response induced by reexposure to gluten will consist of reactivation of preexisting memory T cells or will involve recruitment of naive cells. When we compared clonotypes sampled on day 6 with the baseline memory repertoire, we found a considerable overlap (Figure 2C and Supplemental Figure 4A). These data suggest that the gluten-specific T cell repertoire on day 6 is made up by clonal expansions of preexisting memory T cells. Unchanged dominance of memory clonotypes 28 days after reintroduction of gluten. We next compared paired nucleotide TCR-αβ clonotype data from blood and biopsy samples taken on day 14, or an additional day-28 blood sample after gluten challenge, with clonotype data at baseline. From the single-cell data of all 7 patients, we found that 12%–44% of TCR-αβ clonotypes detected at the latest time point were also found in the memory T cell repertoire at baseline prior to challenge (Figure 2C and Supplemental Figure 4A). To maximize the sample sizes, we performed, in addition, bulk sequencing of samples from 2 patients who had many gluten-specific T cells. With more clonotypes being detected by bulk sequencing, we found that 52%–55% of TCR-β clonotypes detected at the latest time point were present in the baseline samples (Figure 2D). Note that the proportion of clonotypes in samples taken at day 6, day 14, and day 28 that had already been observed at baseline remained remarkably stable (48%–58%), with no indication of declining dominance of memory clonotypes over time (Supplemental Figure 4B). The data suggest that reintroduction of gluten causes a transient clonal expansion of the existing gluten-specific memory T cells. The overlap observed was largely within the range of maximum expected clonotype overlap between 2 independent sequencing experiments (Supplemental Figure 2B), indicating little change of the overall gluten-specific T cell repertoire upon gluten challenge. Similar fraction of clonotypes is observed 6 months and 27 years apart. Patients in the challenge study were followed for only up to 28 days. It is possible that the gluten-specific T cell repertoire changes slowly or only after repeated gluten antigen exposure. To compare TCR repertoires many years apart, we invited 5 patients, from whom we had historic T cell material from decades ago, to donate new blood and biopsy samples. By single-cell sequencing, we observed paired TCR-αβ clonotype sharing on the nucleotide level, including identical nucleotide sequences of secondary productive TCR-α chains (Supplemental Figure 5), between historic and recent samples, but to a variable degree (Figure 3A). For patients CD373 and CD412, the sharing was low (2%–4%) due to the small number of clonotypes we could retrieve from the few cryopreserved blood cells from the 1990s. By bulk sequencing a T cell line (TCL) established from a single biopsy specimen of CD412 in the 1990s, we obtained a higher number of unique TCR-β clonotypes and found an overlap of 18% (Figure 3B). For CD114, who was diagnosed in his early childhood, we had 2 historic samples from the 1980s that were taken 19.5 and 20 years after the diagnosis and commencement of the GFD. These 2 samples taken 6 months apart had 51 clonotypes in common, which made up 71% of the smaller 19.5-year GFD sample (total of 72 clonotypes), but only 19% of the much larger (n = 264) 20-year GFD sample (Figure 3B). Interestingly, we found a degree of TCR-β clonotype overlap in the recent samples taken 47 years after the diagnosis that was similar to that of the previous samples taken more than 2 decades ago (22%–53%). Identical clonotypes, especially those with the largest clonal sizes, were also observed in samples taken 16 to 20 years apart in the remaining 2 patients (CD364 and CD436, Supplemental Figure 6). Taking the limited sampling from a diverse repertoire into account, we conclude that the gluten-specific T cell repertoire in CD patients remains remarkably stable over several decades. Figure 3 T cell clonotypes persist in gut tissue and blood for decades. Gluten-specific TCR clonotypes observed at various time points in years after commencement of GFD from patients CD412, CD114, and CD373 are depicted in area-proportional Venn diagrams. (A and B) Single-cell data (TCR-αβ) and combined single-cell and bulk sequencing data (TCR-β), respectively. The dark red areas represent clonotypes that were observed both at the latest time point and when the patient was untreated (CD412) or in the earliest samples we had access to (19.5-year or 20-year GFD for CD114; 2-year GFD for CD373). The percentage (black font) denotes the proportion of shared clonotypes (dark red areas) at the latest time point (black border). For CD114, the proportion of shared clonotypes at 19.5-year GFD and 20-year GFD is also shown (blue font). Asterisks show data obtained from blood sample only. Double asterisks show data obtained from TCL generated from single biopsy. Public TCR sequences observed in 10% of gluten-specific T cells. We collected a total of 1,813 unique paired amino acid TCR-αβ sequences from 17 HLA-DQ2.5+ CD patients by single-cell TCR sequencing. Within this data set, we frequently observed identical amino acid sequences for either the TCR-α or TCR-β chain in different individuals (Figure 4 and Supplemental Table 2). Closer inspection of these public TCR sequences revealed common CDR3 motifs. We collapsed public TCR sequences that used the same V- and J-gene segment, had the same CDR3 length, and differed by no more than 3 amino acids in the CDR3 sequences to generate a list of semipublic TCR sequence motifs (Figure 4). Lists of the top semipublic CDR3α and CDR3β motifs are given in Table 1 and Table 2, respectively. In addition, we identified 40 paired public TCR-αβ sequences in which identical amino acid TCR-αβ sequences were found among cells from 2 to 4 individuals. In most cases, this public response was a result of convergent recombination in which each individual expresses unique nucleotide sequences that converge toward identical amino acid sequences (Supplemental Table 3). In total, there were 188 publicly used TCR-α, TCR-β, or paired TCR-αβ sequences amounting to 10% of all paired TCR-αβ amino acid sequences in this study (Figure 4). Figure 4 Public TCR sequences amount to 10% of the gluten-specific T cell repertoire. (A) Number of public TCRs defined as identical TCR-α, TCR-β, or paired TCR-αβ amino acid sequences observed in at least 2 individuals in a data set of a total of 1,813 gluten-specific TCR amino acid sequences from 17 HLA-DQ2.5+ patients. (B and C) Number of public TCR-α and TCR-β sequences, respectively, that were found in the number of patients plotted on the y axes. The open bars show public TCR-α or TCR-β sequences defined as identical amino acid sequences, whereas gray bars show semipublic TCR-α and TCR-β motifs generated by collapsing TCR-α or TCR-β amino acid sequences that differ by 3 residues or less. Table 1 The top semipublic CDR3α motifs Table 2 The top semipublic CDR3β motifs Discussion In most autoimmune diseases, MHC genes are the chief genetic determinants, and this underlies the phenomenon of HLA association with disease (21, 22). Given the crucial role of MHC molecules in presenting antigenic peptides to T cells, a key role of T cells in the pathogenesis of HLA-associated disorders has been invoked (1, 2). Yet for most human diseases, the antigen presented by HLA molecules, and hence driving the pathogenic T cell response, remains elusive (23). The clear HLA association, the existence of T cells that recognize gluten epitopes in the context of disease-associated HLA-DQ allotypes, and the extraordinary performance of disease-relevant HLA-DQ:gluten peptide tetramers together present CD as an ideal model disorder to characterize the dynamics of pathogenic T cells in a human HLA-associated disorder. By studying patients at different stages of disease and patients undergoing oral gluten challenge, we found that the clonotypes of gluten-specific T cells are shared between the gut and blood compartments, that the recall response to gluten is dominated by expansion of preexisting memory T cells, and that T cell clonotypes persist for decades. We also found that about 10% of the TCR-α, TCR-β, or paired TCR-αβ sequences are publicly used in the response to gluten. The findings demonstrate that in an HLA-associated disease, after antigen sensitization, the patients are marked with permanent and stable immunological scars of disease-driving T cells. Our work was possible because of the ability to combine tetramer-based cell isolation with high-throughput sequencing of TCR-α and TCR-β genes of thousands of single cells and of bulk cell populations. Uniquely, we had access to historic patient samples, allowing us to assess the changes in TCR repertoire over decades. Our conclusion is dependent on the high specificity of HLA-DQ:gluten tetramer staining. Previously, we found that 80% of HLA-DQ:gluten tetramer–sorted T cell clones cultured in vitro from celiac patients showed antigen-specific proliferative responses (10). Further, our conclusions are critically dependent on the correct assignment of clonotype sharing across samples. Potentially, faulty excessive sharing could be caused by sample contamination, sequencing errors, or bioinformatics mistakes. For single-cell data, we rigorously required identical paired TCR-αβ nucleotide sequences for clonotype assignment. The few cases of identical paired TCR-αβ nucleotide sequences across individuals in our single-cell data originated from different sequencing libraries prepared and analyzed months apart and thus represented a truly public response. Therefore, the extensive clonotype sharing we found in samples from the same individuals was not caused by cross contamination. The finding of the same T cell clonotypes in samples collected decades apart raises the question of how the clonotypes are preserved in patients. Possibly this could be due to the longevity of memory cells. Relevant to this, in multiple sclerosis, CD8+ T cell clones have been found to persist for years in the brain (24), and myelin basic protein-specific CD4+ T cell clones have been traced by TCR-β sequence analysis in peripheral blood of patients as well as controls for up to 7 years (25). In the gut of humans, it was recently demonstrated that plasma cells survive for decades (26). Even though long-lived memory CD4+ T cells have been described in humans (27), it might be that gluten antigen challenge due to dietary transgressions contributes to the maintenance of the T cell clonotypes in CD. Upon oral gluten challenge in patients in remission, we observed that the majority of expanded clonotypes found at the peak of the response were present prior to challenge as expanded populations of memory T cells. Moreover, the majority of T cell clonotypes observed in the gut lesion following challenge were identical to those circulating in the blood at peak response, suggesting that these clonotypes dominate the recall response. Thus, a head start of memory T cells on antigen reexposure will result in stable maintenance of the TCR repertoire. We cannot rule out that there is no recruitment of new T cell clonotypes over many years with CD. Extensive recruitment does seem unlikely, however, given the persistence of clonotypes over decades. We observed that 10% of TCR-α, TCR-β, or paired TCR-αβ sequences were publicly used among 1,813 unique paired TCR-αβ sequences from 17 HLA-DQ2.5+ patients. Such public sequences can potentially be exploited as diagnostic markers in a noninvasive blood test. Critical for this test will be whether the public sequences can be found in healthy subjects. Further investigations are required to explore this diagnostic approach. The long-term persistence of disease-driving gluten-specific T cells point to these cells as an attractive therapeutic target in CD. Eradication of these cells, perhaps most effectively done by removing activated T cells after oral gluten challenge in CD patients in remission, could be a way to treat the disease. HLA-DQ:gluten tetramers could be used to monitor the efficacy of the treatment. Alternatively, T cells can be targeted with epitope-specific immunotherapy. This approach is currently being explored in the clinic (28). Overall, the findings of the current study with long-term persistence and stable repertoires of pathogenic T cells have implications for the understanding of and treatment approaches to other HLA-associated disorders in which the detailed insights into disease pathogenesis are much less mature. Methods Human biological material. All patients donated up to 100 ml of blood and 6 to 12 duodenal biopsy samples. In addition, we had access to cryopreserved peripheral blood mononuclear cells (PBMCs) or TCLs derived from single duodenal biopsies (18) from 5 subjects donated from 1988 to 2000. In the gluten-challenge study, treated CD patients on GFD were recruited to a 14-day gluten challenge clinical study (29). We obtained 50–100 ml of citrated blood at baseline, day 6, and day 14 as well as 8 duodenal biopsies at baseline and on day 14. In 1 case (CD1300), we also obtained a blood sample on day 28. Patient characteristics are given in Supplemental Table 1. We isolated PBMCs by Ficoll-based density gradient centrifugation before cryopreservation. Duodenal biopsies were collected in ice-cold RPMI-1640 and treated for 2 × 10 minutes with 2 mM EDTA in 2% FCS in PBS at 37°C to remove the epithelial layer prior to further digestion with collagenase (1 mg/ml) in 2% FCS in PBS at 37°C for 30 to 60 minutes. The samples were then homogenized using a syringe with a 1.2 mm needle and filtered through a 40 μm or 70 μm cell strainer to obtain lamina propria cell suspension prior to cryopreservation. Tetramer staining and cell sorting. Frozen lamina propria cell suspensions of duodenal biopsies or PBMC samples were thawed and stained with a pool of PE-conjugated HLA-DQ:gluten tetramers (10 μg/ml each). For the majority of subjects who were HLA-DQ2.5+, samples were stained with 4 HLA-DQ:gluten tetramers in which each tetramer consisted of the HLA-DQ2.5 molecule linked with the DQ2.5-glia-α1a (QLQPFPQPELPY; the 9-mer core region is underlined), the DQ2.5-glia-α2 (PQPELPYPQPQL), the DQ2.5-glia-ω1 (PQQPFPQPEQPFP), or the DQ2.5-glia-ω2 (FPQPEQPFPWQP) epitope. Similarly, samples from 1 HLA-DQ8+ subject (CD1374) were stained with a mix of 2 HLA-DQ:gluten tetramers in which each tetramer consisted of the HLA-DQ8 molecule linked with the DQ8-glia-α1 (SGEGSFQPSQENPQ) or the DQ8-glia-γ1b (FPEQPEQPYPEQ) epitope. The recombinant HLA-DQ:gluten tetramers were produced as previously described (6, 14). The samples were incubated with the tetramers for 30 to 45 minutes at room temperature. After tetramer staining, the duodenal biopsy samples were cooled and then directly stained with surface antibody mix and LIVE/DEAD marker for 20 minutes on ice. PBMC samples were subjected to enrichment after HLA-DQ:gluten tetramer staining according to a previously described protocol (10). Cryopreserved chymotrypsin/trypsin-digested, gliadin–stimulated TCLs were thawed, split in 4, and stained directly with 10 μg/ml of individual HLA-DQ:gluten tetramers with a prolonged incubation step of 2 hours at 37°C in order to upregulate mRNA expression of the TCR genes. Subsequently, the TCLs were placed on ice before antibody surface staining. We used the following surface-staining antibodies: CD62L-PerCP/Cy5.5 (clone DREG-56), CD14–Pacific Blue (M5E2), CD15–Pacific Blue (W6D3), CD19–Pacific Blue (HIB19), CD56–Pacific Blue (MEM-188), and integrin-β7–APC (FIB504) (all from BioLegend); CD3-FITC (OKT3), CD11c-Horizon V450 (B-Ly6), CD4-APC (SK3), or CD4-APC-H7 (SK3) (all from BD Biosciences); CD45RA-PE-Cy7 (HI100), CD3-eVolve605 (OKT3), CD8-PE-Cy7 (RPA-T8), or CD8-PerCP (SK1) (all from eBioscience). Pacific Blue/Horizon V450–labeled antibodies together with LIVE/DEAD marker fixable violet stain (catalog L34955, Invitrogen, Thermo Fischer) were used to exclude unspecific binding (dump channel). For PBMCs, cells within the singlet lymphocyte population were further gated to isolate tetramer-binding CD4+ effector-memory gut-homing T cells that were as follows: CD3+, CD11c–, CD14–, CD15–, CD19–, CD56–, CD45RA–, CD62L–, integrin β7+, and CD4+. For lamina propria cell suspensions of duodenal biopsies, live cells within the singlet lymphocyte population were further gated to obtain tetramer-binding CD4+ T cells that were as follows: CD3+, CD11c–, CD14–, CD15–, CD19–, CD56–, CD8–, and CD4+. All sorting was performed on an Aria II Cell Sorter (BD Biosciences) at the Flow Cytometry Core Facility at Oslo University Hospital. In samples with a relatively high number of tetramer-positive T cells, we performed bulk-cell sorting in addition to single-cell sorting. Flow cytometry data were analyzed with FlowJo software (FlowJo LLC). TCR sequencing and data processing. Paired TCR-α and TCR-β sequences from single cells were obtained by 3 nested PCR with multiplexed primers covering all TCR-α and TCR-β V genes according to the published protocol (30) and paired-end 250 bp sequencing using the Illumina MiSeq platform. For bulk TCR sequencing, we used a modified SMART protocol (31). The bulk TCR library was then sequenced using paired-end 300 bp Illumina MiSeq sequencing. A detailed protocol for TCR sequencing is given in Supplemental Methods. A full description of the data processing pipeline is given in Supplemental Methods. In brief, we used selected steps of the pRESTO toolkit (32) for preprocessing and the International ImMunoGeneTics Information System (IMGT)/HighV-QUEST online tool (33) for identification of V, D, and J genes and the CDR3 junctions. The IMGT results were then filtered and collapsed. For single-cell data, only valid singleton cells containing no more than 3 chains (dual T cell receptor α [TRA] and T cell receptor β [TRB]) with 100 or more reads were considered for downstream analysis. For bulk data, only sequences present in 2 or more replicas and having cumulative reads of 10 or more were used. To assess data quality with regard to cross-contamination due to sample contamination or errors, we searched for identical paired TCR-αβ nucleotide sequences across individuals in our single-cell data. Of a total of 3,834 single cells expressing 1,859 unique TCR-αβ clonotypes, we found 4 paired TCR-αβ nucleotide sequences that were identical across individuals. In every case, samples sharing the same sequences were prepared and sequenced in different libraries. Similarly, in our bulk sequencing data, we found 12 TCR-β sequences that were identical across individuals out of a total of 1,129 unique TCR-β sequences. Of these, 9 sequences were found in different libraries. Overall, identical nucleotide sequences across patients were found in approximately 1% of all sequences when clonotype was defined by TCR-β nucleotide sequence alone. When clonotype was defined by paired TCR-αβ nucleotide sequences, sharing across patients was found in 0.2% of the clonotypes, demonstrating that cross-contamination was not an issue. All original TCR sequence data were deposited in the NCBI’s Sequence Read Archive database (SRA SRP102399 and SRP102402). Statistics. Repertoire diversity was quantified in samples with more than 20 cells with a nonparametric estimate of the classic Shannon entropy where corrections were made for undersampling by taking into account the unseen species (clonotypes) in the samples (34). This sample-corrected version of Shannon diversity index performs largely independently of sample sizes. Study approval. The studies were approved by the Regional Committee for Medical and Health Research Ethics South-East Norway (2010/2720 and 2011/2472). All patients gave written informed consent. Author contributions LFR, AC, and SDK designed the study, collected patient material, acquired and analyzed the data, and wrote the manuscript. RSN developed the bioinformatics tools, and GKS performed statistical analyses. KEAL and VKS provided patient material and revised the manuscript. SWQ and LMS designed the study, analyzed data, and wrote the manuscript. Supplemental material View Supplemental data Acknowledgments We are grateful to the patients who participated in this study. We thank S. Furholm for contacting patients; M.H. Bakke, J. Bratlie, S. Furholm, C. Hinrichs, and M.G. Dahl for collecting biological material from patients; and Ø. Molberg for being involved in sampling material decades ago. Further, we express our gratitude to B. Simonsen and S.R. Lund for producing the biotinylated HLA-DQ:gluten molecules and M.K. Johannesen for technical assistance. This study was supported by grants from Stiftelsen Kristian Gerhard Jebsen (project SKGJ-MED-017), the Research Council of Norway (project 179573/V40 through the Centre of Excellence funding scheme and project 233885), and the South-Eastern Norway Regional Health Authority (projects 2011050 and 20130462015009). Footnotes Conflict of interest: LMS, SWQ, KEAL, LFR, AC, SDK, RSN and GKS have filed a patent application (GB 1804724.1) on the use of the gluten-specific public T cell receptor sequences described in the current work for diagnosis of celiac disease. LMS, SWQ, AC, and KEAL are holders of a patent application on the detection of gluten-specific T cells by HLA-DQ:gluten tetramers (EP20140789602). KEAL is an advisor to ImmusanT and Bioniz Therapeutics. LMS is an advisor to ImmusanT and Bioniz Therapeutics and is a consultant to Celgene and Intrexon. Regeneron Pharmaceuticals and ImmusanT have provided research grants to the research group of LMS. Reference information: J Clin Invest. https://doi.org/10.1172/JCI98819. References Nepom GT. Class II antigens and disease susceptibility. Annu Rev Med. 1995;46:17–25. View this article via: PubMed CrossRef Google Scholar Thorsby E. Invited anniversary review: HLA associated diseases. Hum Immunol. 1997;53(1):1–11. View this article via: PubMed CrossRef Google Scholar Joachims ML, et al. Single-cell analysis of glandular T cell receptors in Sjögren’s syndrome. JCI Insight. 2016;1(8):e85609. View this article via: JCI Insight PubMed Google Scholar Emerson RO, et al. Immunosequencing identifies signatures of cytomegalovirus exposure history and HLA-mediated effects on the T cell repertoire. Nat Genet. 2017;49(5):659–665. View this article via: PubMed CrossRef Google Scholar Michels AW, et al. Islet-Derived CD4 T Cells Targeting Proinsulin in Human Autoimmune Diabetes. Diabetes. 2017;66(3):722–734. View this article via: PubMed CrossRef Google Scholar Quarsten H, et al. Staining of celiac disease-relevant T cells by peptide-DQ2 multimers. J Immunol. 2001;167(9):4861–4868. View this article via: PubMed CrossRef Google Scholar Ráki M, et al. Tetramer visualization of gut-homing gluten-specific T cells in the peripheral blood of celiac disease patients. Proc Natl Acad Sci U S A. 2007;104(8):2831–2836. View this article via: PubMed CrossRef Google Scholar Bodd M, Ráki M, Bergseng E, Jahnsen J, Lundin KE, Sollid LM. Direct cloning and tetramer staining to measure the frequency of intestinal gluten-reactive T cells in celiac disease. Eur J Immunol. 2013;43(10):2605–2612. View this article via: PubMed CrossRef Google Scholar Han A, et al. Dietary gluten triggers concomitant activation of CD4+ and CD8+ αβ T cells and γδ T cells in celiac disease. Proc Natl Acad Sci U S A. 2013;110(32):13073–13078. View this article via: PubMed CrossRef Google Scholar Christophersen A, et al. Tetramer-visualized gluten-specific CD4+ T cells in blood as a potential diagnostic marker for coeliac disease without oral gluten challenge. United European Gastroenterol J. 2014;2(4):268–278. View this article via: PubMed CrossRef Google Scholar Petersen J, et al. Determinants of gliadin-specific T cell selection in celiac disease. J Immunol. 2015;194(12):6112–6122. View this article via: PubMed CrossRef Google Scholar van de Wal Y, et al. Small intestinal T cells of celiac disease patients recognize a natural pepsin fragment of gliadin. Proc Natl Acad Sci U S A. 1998;95(17):10050–10054. View this article via: PubMed CrossRef Google Scholar Arentz-Hansen H, et al. The intestinal T cell response to alpha-gliadin in adult celiac disease is focused on a single deamidated glutamine targeted by tissue transglutaminase. J Exp Med. 2000;191(4):603–612. View this article via: PubMed CrossRef Google Scholar Tollefsen S, et al. HLA-DQ2 and -DQ8 signatures of gluten T cell epitopes in celiac disease. J Clin Invest. 2006;116(8):2226–2236. View this article via: JCI PubMed CrossRef Google Scholar Tye-Din JA, et al. Comprehensive, quantitative mapping of T cell epitopes in gluten in celiac disease. Sci Transl Med. 2010;2(41):41ra51. View this article via: PubMed Google Scholar Sollid LM, Qiao SW, Anderson RP, Gianfrani C, Koning F. Nomenclature and listing of celiac disease relevant gluten T-cell epitopes restricted by HLA-DQ molecules. Immunogenetics. 2012;64(6):455–460. View this article via: PubMed CrossRef Google Scholar Lundin KE, et al. Gliadin-specific, HLA-DQ(alpha 1*0501,beta 1*0201) restricted T cells isolated from the small intestinal mucosa of celiac disease patients. J Exp Med. 1993;178(1):187–196. View this article via: PubMed CrossRef Google Scholar Molberg O, et al. Tissue transglutaminase selectively modifies gliadin peptides that are recognized by gut-derived T cells in celiac disease. Nat Med. 1998;4(6):713–717. View this article via: PubMed CrossRef Google Scholar van de Wal Y, et al. Selective deamidation by tissue transglutaminase strongly enhances gliadin-specific T cell reactivity. J Immunol. 1998;161(4):1585–1588. View this article via: PubMed Google Scholar Dahal-Koirala S, et al. TCR sequencing of single cells reactive to DQ2.5-glia-α2 and DQ2.5-glia-ω2 reveals clonal expansion and epitope-specific V-gene usage. Mucosal Immunol. 2016;9(3):587–596. View this article via: PubMed CrossRef Google Scholar Wellcome Trust Case Control Consortium. Genome-wide association study of 14,000 cases of seven common diseases and 3,000 shared controls. Nature. 2007;447(7145):661–678. View this article via: PubMed CrossRef Google Scholar Sollid LM, Pos W, Wucherpfennig KW. Molecular mechanisms for contribution of MHC molecules to autoimmune diseases. Curr Opin Immunol. 2014;31:24–30. View this article via: PubMed CrossRef Google Scholar Sollid LM, Jabri B. Triggers and drivers of autoimmunity: lessons from coeliac disease. Nat Rev Immunol. 2013;13(4):294–302. View this article via: PubMed CrossRef Google Scholar Skulina C, et al. Multiple sclerosis: brain-infiltrating CD8+ T cells persist as clonal expansions in the cerebrospinal fluid and blood. Proc Natl Acad Sci U S A. 2004;101(8):2428–2433. View this article via: PubMed CrossRef Google Scholar Goebels N, Hofstetter H, Schmidt S, Brunner C, Wekerle H, Hohlfeld R. Repertoire dynamics of autoreactive T cells in multiple sclerosis patients and healthy subjects: epitope spreading versus clonal persistence. Brain. 2000;123 Pt 3:508–518. View this article via: PubMed Google Scholar Landsverk OJ, et al. Antibody-secreting plasma cells persist for decades in human intestine. J Exp Med. 2017;214(2):309–317. View this article via: PubMed CrossRef Google Scholar Hammarlund E, et al. Duration of antiviral immunity after smallpox vaccination. Nat Med. 2003;9(9):1131–1137. View this article via: PubMed CrossRef Google Scholar Goel G, et al. Epitope-specific immunotherapy targeting CD4-positive T cells in coeliac disease: two randomised, double-blind, placebo-controlled phase 1 studies. Lancet Gastroenterol Hepatol. 2017;2(7):479–493. View this article via: PubMed CrossRef Google Scholar Sarna VK, et al. HLA-DQ:gluten tetramer test in blood gives better detection of coeliac patients than biopsy after 14-day gluten challenge. [published online ahead of print August 4, 2017]. Gut. https://doi.org/10.1136/gutjnl-2017-314461. View this article via: PubMed Google Scholar Han A, Glanville J, Hansmann L, Davis MM. Linking T-cell receptor sequence to functional phenotype at the single-cell level. Nat Biotechnol. 2014;32(7):684–692. View this article via: PubMed CrossRef Google Scholar Quigley MF, Almeida JR, Price DA, Douek DC. Unbiased molecular analysis of T cell receptor expression using template-switch anchored RT-PCR. Curr Protoc Immunol. 2011;Chapter 10:Unit10.33. View this article via: PubMed Google Scholar Vander Heiden JA, et al. pRESTO: a toolkit for processing high-throughput sequencing raw reads of lymphocyte receptor repertoires. Bioinformatics. 2014;30(13):1930–1932. View this article via: PubMed CrossRef Google Scholar Alamyar E, Duroux P, Lefranc MP, Giudicelli V. IMGT(®) tools for the nucleotide analysis of immunoglobulin (IG) and T cell receptor (TR) V-(D)-J repertoires, polymorphisms, and IG mutations: IMGT/V-QUEST and IMGT/HighV-QUEST for NGS. Methods Mol Biol. 2012;882:569–604. View this article via: PubMed CrossRef Google Scholar Chao A, Chazdon RL, Colwell RK, Shen TJ. Abundance-based similarity indices and their estimation when there are unseen species in samples. Biometrics. 2006;62(2):361–371. View this article via: PubMed CrossRef Google Scholar Version history Version 1 (May 14, 2018): Electronic publication
|
|
Scooped by
Gilbert C FAURE
May 20, 2018 5:51 AM
|
Microbial communities in the gut can be highly individual. What engenders this specificity? The gut characteristically produces gram quantities of immunoglobulin A (IgA) antibody, which is presumed to protect the gut from pathogen attack.
|
|
Scooped by
Gilbert C FAURE
May 20, 2018 5:40 AM
|
Many studies have linked the gut microbiome to health and disease. New research reveals mechanisms utilized by gut bacteria to assemble a microbiome in the first place.
|
|
Scooped by
Gilbert C FAURE
May 20, 2018 5:39 AM
|
Human affinity-matured antibodies to Klebsiella pneumoniae lipopolysaccharide O-antigen have different patterns of glycan fine specificity without being polyreactive. These antibodies might constitute an important mechanism for homeostatic control of the intestinal microbiome.
|
|
Scooped by
Gilbert C FAURE
May 15, 2018 8:11 AM
|
|
|
|
Scooped by
Gilbert C FAURE
June 14, 2018 6:40 AM
|
|
|
Scooped by
Gilbert C FAURE
June 13, 2018 10:05 AM
|
|
|
Scooped by
Gilbert C FAURE
June 12, 2018 11:32 AM
|
Invariant natural killer T (iNKT) cells and neutrophils play an increasingly important part in the pathogenesis of inflammatory diseases, but their precise roles in modulating colitis remain unclear. Previous studies have shown important interplays between host immune system and the gut microbiota, and the resulting modulation of inflammation. However, the interactions between iNKT cells, neutrophil and gut microbiota in regulating colitis pathology are poorly understood. Here, we show iNKT cell-deficient Jα18-/- mice display reduced dextran sodium sulphate (DSS)-induced colonic inflammation compared to their wildtype (WT) counterparts. We reveal that there is a distinct gut microbiota shaped by the absence of iNKT cells, which comprises of microorganisms that are associated with protection from colonic inflammation. Additionally, the reduced inflammation in Jα18-/- mice was correlated with increased expressions of neutrophil chemoattractant (Cxcl1 and Cxcl2) and increased neutrophil recruitment. However, these neutrophils were recruited to the colon at day 3 of our model, prior to observable clinical signs at day 5. Further analysis shows that these neutrophils, primed by the microbiota shaped by the lack of iNKT cells, exhibit anti-inflammatory and immune-modulatory properties. Indeed, depletion of neutrophils in DSS-treated Jα18-/- mice demonstrates that neutrophils confer an anti-colitogenic effect in the absence of iNKT cells. Thus, our data supports a changing dogm
|
|
Scooped by
Gilbert C FAURE
June 12, 2018 2:53 AM
|
Abstract. Acute severe ulcerative colitis is a medical emergency that requires prompt recognition, evaluation, and intervention.Patients require hospital admi...
Via Krishan Maggon
|
|
Scooped by
Gilbert C FAURE
June 5, 2018 2:24 AM
|
|
|
Scooped by
Gilbert C FAURE
June 4, 2018 3:19 PM
|
J Innate Immun. 2018 Jun 1:1-7. doi: 10.1159/000489405. [Epub ahead of print] Review
|
|
Scooped by
Gilbert C FAURE
May 26, 2018 3:59 PM
|
There is cross-talk between the intestinal epithelium and the microbiota that functions to maintain a tightly regulated microenvironment and prevent chronic inflammation. This communication is partly mediated through the recognition of bacterial proteins by host-encoded innate receptors, such as...
|
|
Scooped by
Gilbert C FAURE
May 20, 2018 5:53 AM
|
|
|
Scooped by
Gilbert C FAURE
May 20, 2018 5:50 AM
|
|
|
Scooped by
Gilbert C FAURE
May 20, 2018 5:39 AM
|
Biomed Pap Med Fac Univ Palacky Olomouc Czech Repub. 2018 May 15. doi: 10.5507/bp.2018.022.[Epub ahead of print]...
|
|
Scooped by
Gilbert C FAURE
May 15, 2018 1:51 PM
|
Although much work has linked the human microbiome to specific phenotypes and lifestyle variables, data from different projects have been challenging to integrate and the extent of microbial and molecular diversity in human stool remains unknown. Using standardized protocols from the Earth Microbiome Project and sample contributions from over 10,000 citizen-scientists, together with an open research network, we compare human microbiome specimens primarily from the United States, United Kingdom, and Australia to one another and to environmental samples. Our results show an unexpected range of beta-diversity in human stool microbiomes compared to environmental samples; demonstrate the utility of procedures for removing the effects of overgrowth during room-temperature shipping for revealing phenotype correlations; uncover new molecules and kinds of molecular communities in the human stool metabolome; and examine emergent associations among the microbiome, metabolome, and the diversity of plants that are consumed (rather than relying on reductive categorical variables such as veganism, which have little or no explanatory power). We also demonstrate the utility of the living data resource and cross-cohort comparison to confirm existing associations between the microbiome and psychiatric illness and to reveal the extent of microbiome change within one individual during surgery, providing a paradigm for open microbiome research and education.
IMPORTANCE We show that a citizen science, self-selected cohort shipping samples through the mail at room temperature recaptures many known microbiome results from clinically collected cohorts and reveals new ones. Of particular interest is integrating n = 1 study data with the population data, showing that the extent of microbiome change after events such as surgery can exceed differences between distinct environmental biomes, and the effect of diverse plants in the diet, which we confirm with untargeted metabolomics on hundreds of samples.
|