Big Data is being used in colleges and universities to help student's perform better. But not everybody agrees with this controversial practice.

 Your new post is loading...
 Scoop.it! Big Data is being used in colleges and universities to help student's perform better. But not everybody agrees with this controversial practice. 
No comment yet.
Sign up to comment
Scoop.it!


Ana Cristina Pratas's curator insight,
March 20, 2014 2:05 AM
"DATA NOW STREAM from daily life: from phones and credit cards and televisions and computers; from the infrastructure of cities; from sensor-equipped buildings, trains, buses, planes, bridges, and factories. The data flow so fast that the total accumulation of the past two years—a zettabyte—dwarfs the prior record of human civilization. “There is a big data revolution,” saysWeatherhead University Professor Gary King. But it is not the quantity of data that is revolutionary. “The big data revolution is that now we can do something with the data.” "
Scoop.it!

From
www

As Laurie Miles, head of analytics for big data specialist SAS, says: "The term big data has been around for decades, and we've been doing analytics all this time. It's not big, it's just bigger."
But it's the velocity, variety and volume of data that has merited the new term.
Scoop.it!
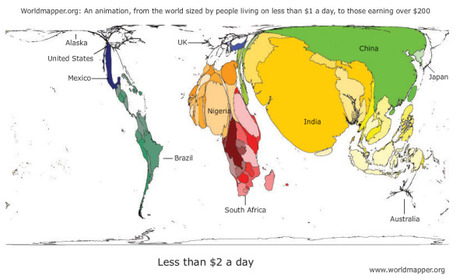
While written and oral language dominate instruction, the explosion of visual information has created new opportunities to represent complexity, reveal themes, explore data, and communicate information in powerful ways. Here is an overview of some of my favorite examples of visual data representation for education. Via Kathrin Jäger
Scoop.it!

We invite you to read our latest SVC2UK White Paper, “The Future of E-ducation“, written in collaboration with Gold Mercury International, the Corporate Vision® Strategy Think Tank. The Paper draws on many of the case studies from SVC2UK 2013 and explores what the future is likely to look like for teachers and students. Via Nik Peachey

Alfredo Corell's curator insight,
February 3, 2014 6:36 AM
Nice selection of papers aproaching main subjects in education and technology. In my reading list 
Laura Rosillo's curator insight,
June 14, 2014 7:17 AM
Buena selección de artículos sobre el futuro de la educación 
A/Prof Jon Willis's curator insight,
June 16, 2014 6:28 PM
Where is technology taking us in Higher Ed? Here's one vision, from the UK
Scoop.it!

"Register now for Tackling the Challenges of Big Data, an online MIT course for engineering and business professionals offered by MIT Professional Education and CSAIL. This Online X course will survey state-of-the-art topics in Big Data, looking at data collection (smartphones, sensors, the Web), data storage and processing (scalable relational databases, Hadoop, Spark, etc.), extracting structured data from unstructured data, systems issues (exploiting multicore, security), analytics (machine learning, data compression, efficient algorithms), visualization, and a range of applications. Each module will introduce broad concepts as well as provide the most recent developments in research." Via Jenny Pesina
Scoop.it!

At a conference devoted to exploring Big Data in higher education, the event’s keynote speaker had a surprisingly contrarian take on the subject.
“Big Data is bull—,” Harper Reed, the chief technology officer of President Obama’s 2012 campaign, said to an audience that included many campus IT officials hoping to learn more about Big Data’s benefits.
Reed, who used the power of data to help Obama secure reelection, said the term is just a marketing tool meant to drive college and university IT officials toward expensive technologies for storing and analyzing data.
Kim Flintoff's insight:
Is Big Data just too big to distil into meaningful decisions?
Scoop.it!

No two students are the same; each brings their own interests, learning modalities, strengths, and prior knowledge of the topic at hand. Addressing students’ individual learning needs in the classroom has always been a key challenge for educators—but new instructional technologies can help.
Kim Flintoff's insight:
Personalisation is one of the big hopes for the "big data:" movement ion Higher Education.
Scoop.it!

The collection of data in higher education will never produce a single formula for success, no matter how much students clamor for such a miracle algorithm.
That, along with other harsh realities of data collection and analysis on college campuses, was discussed during the “Allure of Big Data” session at the EDUCAUSE 2013 conference in Anaheim, Calif., where campus technologists from across the world gathered to discuss trends in educational technology.
Scoop.it!

When education investors talk about so-called adaptive learning, in which a computer tailors instructional software personally for each student, the name Knewton invariably surfaces. The ed-tech start up began five years ago as an online test prep service. But it transformed the personalization technology it uses for test prep classes into a “recommendations” engine that any software publisher or educational institution can use. Today the New York City company boasts it can teach you almost any subject better and faster than a traditional class can. At the end of 2012, 500,000 students were using its platform. By the end of this year, the company estimates it will be more than 5 million. By next year, 15 million students. Most users will be unaware that Knewton’s big data machine is the hidden engine inside the online courses provided by Pearson or Houghton Mifflin Harcourt or directly by a school, such as Arizona State University and University of Alabama. The Hechinger Report talked with David Kuntz, Knewton’s vice president of research, to understand how the company’s adaptive learning system works. Kuntz hails from the testing industry. He previously worked at Education Testing Service (ETS), which makes the GRE and administers the SAT for The College Board. Before that Kuntz worked for the company that makes the LSAT law school exam.
Scoop.it!

"Education is increasingly occurring online or in educational software, resulting in an explosion of data that can be used to improve educational effectiveness and support basic research on learning. In this course, you will learn how and when to use key methods for educational data mining and learning analytics on this data."
Workload: 6-8 hours/week . Via Jim Lerman
Scoop.it!

Daniel Jimenez Zulic's curator insight,
August 18, 2013 11:30 PM
una presentacion de George Siemens sobre los conceptos basicos de la analitica del aprendizaje. Un imperdible del padre del conectivismo. |
Scoop.it!

Higher education is overflowing with data to be parsed and analyzed but a data-related skills gap could stand in the way of analytics' potential.
Scoop.it!
MOOCs should be the Holy Grail of student data, but they aren't there yet.
One of the great promises of massive open online courses, besides making education more accessible for more students, is the treasure trove of student data collected on a grand scale.
Large amounts of data are exactly what higher education needs to stay relevant in this era of disruptive change, as Arizona State University's Adrian Sannier pointed out in his keynote at last year's Campus Technology annual conference. The only way to make sure colleges and universities are continually boosting student success, he said, is evidence-based pedagogy. And that requires scale: "You can't take evidence one class at a time, one person at a time — it takes too long, you don't get a broad enough sample…. I'm not sure you can do it at a university, at a single institution. You may not have enough scale, you may not have enough size."
Scoop.it!

If you have been allocated just one iPad for your classroom then you have very different issues to 1-to-1 classrooms as the iPad is not designed as a shared device. But don't despair! There are app... Via JP Hale

Jonathan Jarc's curator insight,
March 3, 2014 8:55 PM
Always a concern, especially for the under-served school districts.
Scoop.it!

Raquel Oliveira's curator insight,
January 27, 2014 10:22 AM
a humanidade clama por ser envolvida nas decisoes, projetos e aprendizagem. Sim, eu sinto esse movimento em diversos setores. Em relação a aprendizagem de adultos, é irreversível !
Scoop.it!

How Can Data Mining and Analytics Enhance Education Infographic answers how can educational data mining & learning analytics improve and personalize education.
Kim Flintoff's insight:
via Sara de Freitas
Scoop.it!

Educators, have you ever wondered if your students are really learning when you teach? Soon you’ll have to wonder no more. Via Dr. Susan Bainbridge
Scoop.it!
This second part in an eCampus News series about the power and pitfalls of Big Data examines the criticism and skepticism surrounding the buzz words. A university recently crunched all of the “Big Data” it had gathered on a course and made a surprising discovery.
Out of the two professors who taught the course, one had significantly lower performing students. But this was a professor who had won several teaching awards and was well-respected by campus leaders. What was going on here, the researchers wondered as they sifted through all of the data points at their disposal. They could only draw one conclusion based on the data at hand: the poorer student performance was because the professor was not the level of teacher everyone believed him to be.
The conclusion, it turns out, was wrong.
Kim Flintoff's insight:
How do we make meaning out of massive quantities of data? Numbers don't tell the whole story. Only the right num,bers in the right context. How do educators determine what goes where?
Scoop.it!

Data Mining Reveals the Secret to Getting Good Answers Via Howard Rheingold

Howard Rheingold's curator insight,
December 4, 2013 1:46 PM
I can't imagine what coding was like before Stack Overflow. These days, problem-solving in coding involves knowing the right question to ask in order to find an answer. It's not just coding. Knowing how to get good answers to questions has become a primary infotention skill now that search engines are so much more intelligent and Q&A sites like Stack Overflow and Quora have become popular and useful.
Scoop.it!

American schools are in crisis. Thirty years after the scathing education report "A Nation at Risk: The Imperative for Educational Reform" they continue to lag behind in reading, science, math and high school graduation rates.
Scoop.it!

Smart universities are turning to new data sources to identify those students who need a nudge toward success.
Scoop.it!

ghbrett's curator insight,
July 18, 2013 9:08 AM
This is another post where I recommend that you scroll down to have a look at Robin Good's great commentary. I can not beat his for details. His Scoop.it site is: http://curation.masternewmedia.org/ Thanks Robin! 
Jenifer Rettler's curator insight,
July 18, 2013 10:15 AM
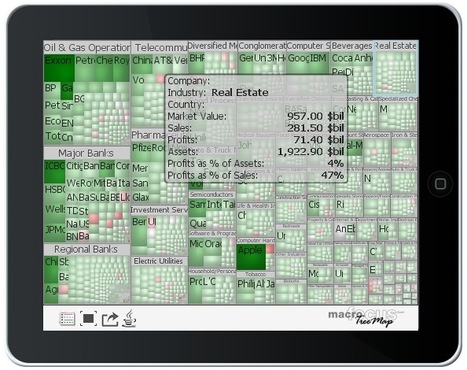
If you are looking for additional visualization tools for displaying data, TreeMap v. 3.0 offers a classic tree map layout as well as others, like squarified variant, circular, tag cloud and voronoi.
Scoop.it!
Two colleges tap into the power of big data and analytics to help improve student success.
|