 Your new post is loading...

|
Scooped by
Gilbert C FAURE
May 5, 2024 1:19 PM
|
The authors show that early Th2 cell differentiation is driven via prolonged T–DC macro-clustering in lymph nodes and occurs in a skin site-specific manner
|
|
Scooped by
Gilbert C FAURE
November 4, 2023 4:19 AM
|
Contrary to prior belief, certain T-cells remain in lymph nodes for a long time and store information about immune reactions there. That’s been discovered by researchers at the University of Würzburg and the RWTH Aachen.
|
|
Scooped by
Gilbert C FAURE
October 30, 2022 4:18 AM
|
bioRxiv - the preprint server for biology, operated by Cold Spring Harbor Laboratory, a research and educational institution
|
|
Scooped by
Gilbert C FAURE
April 25, 2021 3:38 AM
|
T Cell Proliferation T cell proliferation leads to formation of millions of T cells expressing specific cell membrane TCRs, capable of binding the most diverse antigens, including self-antigens. From: Epigenetic Principles of Evolution (Second Edition), 2019 Related terms: View all Topics Stem Cell-Based Approach to Immunomodulation Kathryn J. Wood, ... Ou Li, in Regenerative Medicine Applications in Organ Transplantation, 2014 61.3.4 Modulation of T-Cell Responses in Rejection by MSCs T-cell proliferation and activation are prerequisites for allograft rejection [2,85]. A large body of data demonstrate that MSCs can modulate T-cell proliferation, activation, and function both in vitro and in vivo[28,44,86–89]. Moreover, the capacity for MSCs to inhibit Th17 cell differentiation [90,91] or to shift the T-helper cell balance in favor of a more anti-inflammatory phenotype has been demonstrated in vitro [92–96]. The mechanisms utilized by MSCs in mediating these effects vary between in vitro and in vivo models. However, the secretion of soluble factors by MSCs is a common feature (English, 2012). IDO and PGE-2 have been implicated in MSC inhibition of Th17 differentiation [90,91]. In the case of PGE-2, the steps involved in the process require contact-dependent COX-2 induction of PGE-2 and direct inhibition through EP4 [90]. MSCs can also mediate this effect through suppressing the Th17 transcription factor RORγt and upregulating Foxp3 to induce a Treg phenotype producing IL-10 [96]. MSC-derived TGF-β has been shown to play a partial role in shifting the balance of Th1/Th2/Th17 and Treg in an autoimmune disease model [31]. A role for matrix metalloproteinase (MMP)2 and MMP9 secreted by MSCs facilitating cleavage of CD25 expressed on CD4+ T cells thereby inhibiting alloantigen driven proliferation and so preventing islet allograft rejection has also been described [44]. Other evidence suggests that MSC-derived MMPs also cleave CCL2 which subsequently inhibits Th17 activation via a STAT3-dependent pathway [97]. MSCs also have the capacity to expand or induce Treg in the setting of an alloimmune response [43,45,98,99] and in some cases can generate a state of Treg-dependent tolerance [30,45]. Both of these studies elegantly demonstrate the importance of Treg in MSC-induced tolerance using Treg depletion strategies with IDO potentially playing a significant role [30]. In vitro, MSC induction of Treg is thought to involve cell contact, PGE-2, and TGF-β [94]. In vivo, MSC-derived TGF-β was required for the generation of antigen-specific Treg and overall, TGF-β seems to be the major soluble factor involved in MSC promotion of Treg in vivo [29,31,100,101]. T-Cell Activation and Tolerance Erik J. Peterson, Jonathan S. Maltzman, in Clinical Immunology (Fifth Edition), 2019 Coreceptors Transduce Signals That Are Integrated With TCR Signals T-cell proliferation and the initiation of effector function require that the T cell must receive signals in addition to the TCR via other cell surface receptors.18 This requirement for multiple signals allows the T cell to be extremely sensitive to TCR binding while protecting against the inappropriate activation of potentially dangerous effector cells. Because T cells respond to antigens presented on APCs, stimulation under physiological conditions involves the potential engagement of multiple coreceptors on the T cell by cognate ligands on the APCs. Some coreceptors may function to increase the avidity of T cells for interacting APCs. However, many coreceptors exhibit intrinsic signal-transducing capacity. Some signal independently of the TCR; others intersect with TCR-driven signaling machinery. Additionally, coreceptors may function as recruiters of cytoplasmic signaling molecules, including adaptor proteins, as described above. The most intensively studied coreceptors are CD4 and CD8 (Chapter 4). CD4 or CD8 expression on peripheral T cells define subsets that respond to MHC class II- or class I-bound peptide antigens, respectively (Chapter 6). Either CD4 or CD8 can contribute to enhanced TCR signal strength because they each associate with LCK.19 This constitutive interaction, which occurs via specific residues within the CD4 and CD8 cytoplasmic domains, localizes a key effector enzyme to the TCR complex. Cytokines in Hematopoietic Stem Cell Transplantation Kate A. Markey, Geoffrey R. Hill, in Cytokine Effector Functions in Tissues, 2017 IL-6 IL-6 promotes T cell proliferation, the differentiation of cytotoxic T lymphocyte populations, and, when present in combination with TGF-β, promotes Th-17 development.65,66 Preclinical studies of IL-6 in GVHD and GVL confirm its key role as a pathogenic cytokine in GVHD. The absence of IL-6 in the donor T cell pool (using IL-6 deficient donor mice) or systemic blockade of IL-6 with an anti-IL-6R antibody results in decreased aGVHD with no loss of GVL effects in the models used.9,67 Recent data demonstrate that IL-6 is the major cytokine detectable in patient plasma early after BMT and that it appears to play a dominant role in conditioning-related pathology.68 Blockade of IL-6 with tocilizumab (soluble IL-6R) has now progressed through a successful phase I/II clinical trial with low levels of acute GVHD in comparison to historical controls.68 This represents a promising new strategy for GVHD prevention. Macrophages Galen B. Toews, in Asthma and COPD (Second Edition), 2009 Macrophages and Initiation of Antigen-specific T2 Immune Responses in Asthma Resident pulmonary AMs actively suppress T-cell proliferation induced by antigen or polyclonal stimuli [73]. Changes occur within the local inductive milieu of the lung in patients with asthma. AM suppression is reduced after exposure to allergens [106–108]. The tissue microenvironment is a crucial regulator of specific immune response generation (Fig. 11.1). The presence of IgE on APCs likely promotes the uptake and the processing of allergens and their eventual presentation to naïve T-cells. DCs express both FcεR I and FcεR II. These two receptors could function to capture allergen bound to allergen-specific IgE and thus focus the immune response through facilitated antigen presentation [109]. Antigens also deliver signals via quantitative variation in ligand density on APC. Peptide/MHC class II complexes that interact strongly with the TCR favor T1 responses, whereas weak interactions result in the priming of T2 responses. The overall binding affinity can be varied by modifying the peptide, which results in different signals. The mechanisms by which signals delivered via the TCR control differentiation is uncertain; differential TCR aggregation may result in differential intracellular signals that favor distinct cytokine gene expression or certain MHC–TCR interactions may favor differential co-receptor expression [110]. As noted above, co-stimulatory molecules may direct the polarization of T-cells into T1 or T2 cells; B7.2 provides only a moderate signal for T2 cell differentiation; and co-stimulatory signals may be delivered either by the APC that presents the antigen or by the bystander APC. Thus, macrophages may serve as bystander APC and influence DC-induced T-cell proliferation [111]. Soluble cytokines produced by cells of the innate immune response are likely the major regulators of T-cell differentiation (see “Innate Control of Adaptive Immune Responses” section). Immunotherapy in Transplantation Kentaro Akiyama, ... Takuo Kuboki, in Stem Cell Biology and Tissue Engineering in Dental Sciences, 2015 61.2.1.1 Interaction with T-Lymphocytes MSCs are known to inhibit T-cell proliferation by arresting the cell cycle in the G1/G0 phase and down-regulating cyclin D2 expression [6]. As part of the mechanisms involved in this process, MSCs produce a large number of soluble factors that work as anti-inflammatory agents. Di Nicola M et al. reported that human bone marrow MSCs inhibit both CD4+ and CD8+ T-lymphocyte proliferation by secreting transforming growth factor beta 1 (TGFβ1), hepatocyte growth factor (HGF), and prostaglandin E2 (PGE2) in vitro [7]. Another study showed that MSCs inhibit stimulated lymphocyte proliferation and mitogenic response independently of the major histocompatibility complex (MHC) [8]. MSCs also produce indoleamine 2,3-dioxygenase (IDO), which accelerates tryptophan degradation and kynureine synthesis resulting in inhibition of T-lymphocyte proliferation [9]. Nitric oxide (NO) is another immune regulation factor secreted by MSCs [10,11]. NO inhibits proliferation of T-lymphocytes by suppressing phosphorylation of transcription factor, signal transducer, and activator transcription-5 (STAT-5) [12]. Human leucocyte antigen-G5 (HLA-G5) from MSCs is a trigger for inhibition of T-lymphocyte function, followed by up-regulation of T-helper type 2 (Th2) and regulatory T-cell (Tregs) [13,14]. On the other hand, MSCs are able to inhibit T-lymphocyte proliferation by direct cell-to-cell contact [15–17]. Krampera et al. reported that MSCs physically hinder T-lymphocytes from contacting antigen presenting cells in a non-cognate fashion [18]. T-lymphocytes have several subsets. CD8+CTL plays an important role in MHC-dependent allogenic or virus- infected cell depletion. MSCs showed reducing CTL cytotoxicity by inhibiting CTL formation [19]. It has been indicated that the relationship between gamma-delta T-lymphocytes (γδT) and acute graft-vs-host disease (GvHD). MSCs suppress γδT-lymphocyte proliferation without any functional inhibition in vitro (Figure 61.1) [20]. Furthermore, some reports indicated that immunomodulation of MSCs are not only through inhibition of T-lymphocyte proliferation, but also by induction of T-lymphocyte apoptosis. A previous study demonstrated that MSCs secrete IDO, induce 3-Hydroxyanthranilic acid (HAA) synthesis during tryptophan metabolism, and induce cell apoptosis by inhibiting the NFκB pathway in T-lymphocytes [21]. Augello et al. reported that MSCs induce apoptosis of T-lymphocytes by activation of the programmed death 1 pathway [22]. More recently, MSCs have been demonstrated to induce T-lymphocyte apoptosis through the FAS/FAS ligand (FASL) pathway, and consequently lead to immunotolerance (Figure 61.1) [23]. Neuropeptides for Mucosal Immunity David W. Pascual, Kenneth L. Bost, in Mucosal Immunology (Third Edition), 2005 Tachykinins and VIP as costimulation factors for T lymphocytes Early studies showed that SP supports T-cell proliferation (Payan et al., 1983; Stanisz et al., 1986), suggesting that T lymphocytes can express NK1-R. In support of this possibility, recent investigations by several laboratories have demonstrated in vitro and in vivo expression of NK1-R by T lymphocytes. NK1-R mRNA expression by cultured murine (McCormack et al., 1996) and human T cells (Li et al., 2000) or T-cell lines has been reported. In addition, the functionality of NK1-R expression by T lymphocytes has been demonstrated in co-cultures with SP-producing dendritic cells (Lambrecht et al., 1999). It is interesting that NK1-R mRNA expression was observed in intraepithelial and lamina propria T lymphocytes but not in splenic T cells (Qian et al., 2001a). During the host response against respiratory syncytial virus, NK1-R expression was markedly increased in CD4+ T lymphocytes (Tripp et al., 2002). However, the most compelling evidence to date for the importance of NK1-R expression on T lymphocytes comes from studies by Weinstock and colleagues, using a murine model of schistosomiasis. Using NK1-R−/– mice, they observed significant reductions in the size of schistosome-induced granulomas in comparison with disease in wild-type mice (Blum et al., 1999). The limited IFN-γ production by infected NK1-R−/– mice suggested that T cells may be an important target for SP during schistosomiasis. Additional studies clearly demonstrated that the presence of NK1-R on T lymphocytes was largely responsible for schistosome antigen–induced IFN-γ production (Blum et al., 2003). Mechanistic studies demonstrated that schistosome antigen, as well as IL-12, could induce expression of NK1-R during murine schistosomiasis (Blum et al., 2001). Collectively, these studies clearly demonstrate the importance of NK1-R expression and activity during the host response to a parasitic infection. To further address the role of SP contribution to S-IgA responses, NK1-R−/– mice were orally immunized with an attenuated Salmonella construct expressing colonization factor antigen I (CFA/I). This vaccine construct has been shown to elicit a biphasic Th cell response (Pascual et al., 1999) supported by early robust IL-4- and IL-5-producing CD4+ T cells. When such a construct was used to orally immunize NK1-R−/– mice, a significant increase in antigen-specific S-IgA antibody titers was obtained (Trunkle et al., 2003). Surprisingly, no significant differences in IFN-γ production were observed between NK1-R/+/+ and NK1-R−/– mice, but increased production to IL-6 was obtained. This evidence suggests, minimally, that some intracellular infections are resolvable in the absence of NK1-R function, perhaps via increases in S-IgA antibody responses. VIP-containing nerve fibers also extend into the T-cell regions of the Peyer's patches (Ottaway et al., 1987) to affect the CD4+ T cells, whereby stimulation of CD4+ T cells by SP or VIP can affect Ig synthesis. While SP has been shown to exert stimulatory effects upon T cells, VIP has the opposite effect and will inhibit mitogen-induced T-cell proliferation (Stanisz et al., 1986; Ottaway and Greenberg, 1984). This effect apparently occurs through a reduction of IL-2 synthesis (Ottaway, 1987; Metawali et al., 1993) and an inhibition of IL-4 in anti-CD3-stimulated T cells incubated with VIP (Wang et al., 1996). These early studies suggested that VIP exhibited anti-inflammatory properties, but this was not confirmed until recently. As stated earlier, VPAC1 is constitutively expressed, whereas VPAC2 is inducible when T cells are stimulated with anti-CD3 antibody (Delgado et al., 1996). Upon stimulation, VPAC1 levels decrease, while VPAC2 levels are induced. This evidence suggests that VIP action on CD4+ T cells is via the effect of VPAC2 acting specifically upon Th2 cells. To begin to address the regulation of VPAC1 and VPAC2, a mouse deficient in VPAC2 was derived and exhibited enhanced delayed-type hypersensitivity (DTH) responses supported by increased IFN-γ production (Goetzl et al., 2001). To exacerbate Th2 cell function, a transgenic mouse was derived in which CD4+ T cells express the human VPAC2 (Voice et al., 2001). These mice showed increased serum IgE and IgG1 but not IgA antibodies. This Th2 cell bias was evidenced as enhanced susceptibility to TNP-induced cutaneous anaphylaxis and depressed DTH responses. Studies have yet to determine whether VPAC1 and VPAC2 are regulated in a similar fashion by Peyer's patch Th cells, in a manner analogous to that seen with splenic Th cells. Bone Marrow DANIEL A. ARBER, in Modern Surgical Pathology (Second Edition), 2009 T-CELL PROLYMPHOCYTIC LEUKEMIA T-PLL is a clonal T-cell proliferation that occurs most commonly in elderly patients and has a slight male predominance.328,372,373 The disease also occurs frequently in younger patients with ataxia telangiectasia.374 Patients have a markedly elevated white blood cell count as well as organomegaly and lymphadenopathy. Nodular or maculopapular skin lesions are also common. The peripheral blood white blood cell count is usually greater than 100 × 109/L with a predominance of medium-sized cells with abundant basophilic cytoplasm and a single prominent nucleolus (Fig. 43-27). These cells are similar to B-cell prolymphocytes but may have a more convoluted nucleus than in B-PLL. Normocytic anemia and thrombocytopenia are common. The bone marrow may not be involved to the degree that would be expected by the marked elevation in peripheral blood prolymphocytes. The pattern of involvement may be interstitial, diffuse, or mixed and reticulin fibrosis is frequently present (Fig. 43-28).353 In general, T-PLL is an aggressive disease with short survival. However, a subpopulation of patients with T-PLL, including many with ataxia telangiectasia, have an initial, indolent disease course that eventually transforms to the more typical aggressive disease.375 Immunophenotyping is necessary to distinguish T-PLL from B-PLL and is often helpful in excluding acute leukemia. T cell-associated antigens CD2, CD3, CD5, and CD7 are expressed by T-PLL and surface CD3 is present. Most cases are CD4+, but a subset of cases expresses CD8 or both CD4 and CD8. The absence of both CD20 and immunoglobulin light-chain expression excludes B-PLL. The lack of TdT and CD1a expression and the presence of surface CD3 exclude most cases of T-cell ALL. T-cell receptor gene rearrangements are uniformly detectable in T-PLL. Cytogenetic abnormalities in T-PLL include inv(14)(q11q32) and t(14;14)(q11;q32), involving the TCL1 gene in the region of the T-cell receptor α/β locus, iso(8q), trisomy 8, 12p13 deletions, and t(X;14)(q28;q11).375,376 Abnormalities of chromosome region 11q22-23, involving the ATM tumor suppressor gene that is consistently mutated in ataxia telangiectasia are present in some patients with T-PLL even in the absence of ataxia telangiectasia.377 Some T-cell chronic lymphoproliferative disorders have cells with morphologic features similar to those of B-CLL without the prominent nucleolus typical of usual-type PLL.378,379 Cases of this type are considered small cell variants of T-PLL, and the term T-cell CLL should no longer be used. Although the median age and white blood cell count are lower in these patients than in usual-type T-PLL, these cases have immunophenotypic and cytogenetic features similar to those of T-PLL and a similarly aggressive clinical course. Development of T Cell Immunity Jeong M. Kim, in Progress in Molecular Biology and Translational Science, 2010 E Granzyme Dependent Cytotoxicity Treg cell mediated inhibition of in vitro effector T cell proliferation was demonstrated to require cell-to-cell contact. Although the molecular basis for contact-mediated suppression is largely unknown, recent reports have revealed that Tregs also require cellular contact for target cell killing via the granule exocytosis pathway.150,151 Granule-mediated cytoxicity is dependent on granzymes, granule resident proteases, which initiate a cascade of apoptosis-promoting cleavage events. As in effector T cells, granzyme expression is induced in Tregs in response to T cell receptor signaling. While granzyme A is primarily expressed by activated human Tregs,151 granzyme B is the predominant granzyme induced in murine Tregs.150 Granzyme A and B differ in substrate specificity and the kinetics of cell death induction, but activated murine and human Tregs comparably induce effector T cell death at 1:1 ratio of regulatory to effector T cells. In vitro cytotoxicity was dependent on granzyme function, as suppression of effector T cell proliferation was severely compromised in cultures containing granzyme B deficient Tregs.150 Cytolytic granules also contain perforin, which is essential for target cell lysis in CD8+ CTLs and NK cells. The deposited perforin polymerizes on the target cell plasma membrane in a calcium dependent manner and generates holes that were hypothesized to serve as granzyme conduits into the target cell. However, accurate measurements of pores formed by perforin suggest that the diameter of polyperforin channels do not accommodate granzyme passage.152 Although the exact function of perforin remains unknown, phenotypic similarities in mice deficient in either perforin or granzyme B provide evidence that perforin plays a nonredundant role in targeted cytolysis by lymphocytes. In support of this idea, inhibiting perforin by either EDTA or concanamycin A treatment abrogates target cell killing by human Tregs. In contrast to these findings, perforin deficient murine Tregs were equally suppressive as its wild-type counterparts in vitro, suggesting that perforin is not essential for granzyme B dependent target cell lysis in murine Treg cells. These discrepant results may reflect the usage of different granzymes for target cell killing in mouse versus human Tregs. In this regard, granzyme A may be more dependent on perforin for killing that granzyme B. Alternatively, calicium chelators or concanamycin A may not be specific for perforin inhibition, affecting target cell cytolysis independent of perforin function. Human Tregs, additionally, have been demonstrated to kill monocytes, DCs, and activated CD8+ T cells151 (Fig. 3B). Murine Tregs are also capable of killing B cells in vitro.114 Assay for Antigen-Specific T-Cell Proliferation in Mice Şefik Ş. Alkan, in Immunological Methods, 1979 Publisher Summary This chapter discusses the assay for antigen-specific T-cell proliferation in mice. While lymphocyte proliferative responses to allogeneic cells or to mitogens in the mouse can be readily measured, the reliable assay of antigen-induced T-lymphocyte proliferation in culture has proved to be substantially more difficult to establish. The uncontrolled nature of proliferation and the contribution of B-cell responses have made these methods of questionable value as a T-cell assay. The novel features of the method are the use of only draining lymph node cells of primed mice instead of spleen cells and the use of horse serum in the culture medium instead of fetal calf serum. Only draining lymph node cells rich for antigen-reactive cells are used. Animals are sensitized by injecting antigen into the tail or footpads, the draining lymph nodes are removed, the cells are cultured in microculture plates in the presence or absence of antigens (and/or mitogens), and proliferation is measured by [3H] thymidine uptake. This technique can be used for several antigens, such as monovalent antigens and protein antigens. The Digestive Involvement in Systemic Autoimmune Diseases A.J. Czaja, in Handbook of Systemic Autoimmune Diseases, 2017 4.4 Regulatory T Cells Regulatory CD4+CD25+ T cells modulate CD8 T cell proliferation by exerting a direct suppressive effect on the production of IFN-γ while increasing secretion of IL-4, IL-10, and TGF-β [143–146]. They can also induce the apoptosis of inflammatory and immune cells [147], inhibit hepatic stellate cells [148], impair the secretion of IL-17 [149], and limit the proliferation of Th17 lymphocytes [149]. These cells have been decreased in number and function in the peripheral blood of patients with autoimmune hepatitis [144,150,151], and they have been less evident in the portal tracts of liver specimens (Table 2.3) [151]. A signaling defect that influences the function of the regulatory T cells may also contribute to regulatory failure [5]. Galectin 9 is a beta galactosidase–binding protein expressed on regulatory T cells, and its ligation with the mucin domain-3 receptor (TIM-3) on Th1 cells and dendritic cells induces the apoptosis of Th1 lymphocytes and dendritic cells [152,153]. In autoimmune hepatitis, the expression of galectin 9 on regulatory T cells and TIM-3 on Th1 cells is reduced, and these deficiencies may limit the ability of the regulatory T cells to restore immune tolerance [153]. Deficiencies in the function of regulatory T cells have also been described in the siblings and children of patients with PBC, and the suppressor activity of this subset may be modulated by genetic factors [146]. Regulatory T cells can be defined more rigidly by the phenotype CD4+CD25+CD127+(low)Foxp3+, and cells with this phenotype have had normal function in patients with autoimmune hepatitis. Furthermore, increased numbers of these cells have been described in the peripheral circulation and liver tissue of patients with autoimmune hepatitis [154]. These findings have challenged the hypothesis that perturbations in the regulatory T cell population are critical for the development of autoimmune hepatitis. The discrepant findings between studies may relate to differences in the phenotypic definition of the regulatory T cells, methods for the detection and evaluation of these cells, and the severity and treatment of the liver disease in the study population [155]. The abnormalities associated with regulatory T cells may be transient and improved by medications (corticosteroids, mycophenolate mofetil, or rapamycin) and the resolution of inflammatory activity [5,144]. Relative imbalances between the number and functions of the regulatory T cells and effectors cells may be the critical factor affecting the autoreactive response rather than the absolute number and function of an individual cell population.
|
|
Scooped by
Gilbert C FAURE
July 8, 2020 1:50 AM
|
Love n°5 for my lymph node PPT
|
|
Scooped by
Gilbert C FAURE
April 24, 2020 3:27 PM
|
KEY POINTS Free ISG15 causes tissue alert in the skin upon therapeutic vaccination in mice. Free ISG15 is a potent adjuvant for the CTL response, acting, in part, via NK cells. Free ISG15 function in mice requires amino acids defining ligand function in humans. Abstract Type I IFN is produced upon infection and tissue damage and induces the expression of many IFN-stimulated genes (ISGs) that encode host-protective proteins. ISG15 is a ubiquitin-like molecule that can be conjugated to proteins but is also released from cells in a free form. Free, extracellular ISG15 is suggested to have an immune-regulatory role, based on disease phenotypes of ISG15-deficient humans and mice. However, the underlying mechanisms by which free ISG15 would act as a “cytokine” are unclear and much debated. We, in this study, demonstrate in a clinically relevant mouse model of therapeutic vaccination that free ISG15 is an alarmin that induces tissue alert, characterized by extracellular matrix remodeling, myeloid cell infiltration, and inflammation. Moreover, free ISG15 is a potent adjuvant for the CTL response. ISG15 produced at the vaccination site promoted the vaccine-specific CTL response by enhancing expansion, short-lived effector and effector/memory differentiation of CD8+ T cells. The function of free ISG15 as an extracellular ligand was demonstrated, because the equivalents in murine ISG15 of 2 aa recently implicated in binding of human ISG15 to LFA-1 in vitro were required for its adjuvant effect in vivo. Moreover, in further agreement with the in vitro findings on human cells, free ISG15 boosted the CTL response in vivo via NK cells in the absence of CD4+ T cell help. Thus, free ISG15 is part of a newly recognized innate route to promote the CTL response. Introduction Infection and tissue damage lead to the production of type I IFNs (IFN-I). These cytokines induce the expression of many IFN-stimulated genes (ISGs), encoding proteins that protect the host in many different ways (1). This group of proteins includes ISG15 that has a diubiquitin-like structure (2). Isg15 is one of the genes most strongly upregulated in response to viral infection in a diversity of species, including humans (3, 4). ISG15 is also induced by bacterial infections (5, 6). Isg15-deficient mice and humans display phenotypes that indicate a role for ISG15 in the protection against infection, but the underlying mechanisms have not been fully elucidated (3, 7, 8). ISG15 can be conjugated to proteins but also exists in a free form and thus may act by different mechanisms either within or outside the cell. Like ubiquitin, ISG15 can be covalently conjugated to lysine residues through a C-terminal diglycine motif (LRLRGG) (9). This process, termed ISGylation, relies on one E1-activating enzyme (UBE1L) (10), one E2 enzyme (UBC8) (11, 12), and one major E3 enzyme (HERC5 in humans and HERC6 in mice) (13, 14). ISGylation is reversible, and the major ISG15-deconjugating enzyme in vivo is USP18/UBP43 (15). All enzymes that regulate ISGylation are induced by type I IFN (9). It was shown that ISGylation can occur cotranslationally on newly synthesized proteins without apparent target specificity (16). Proteins are, in general, decorated with ISG15 monomers rather than polymeric chains, and ISG15 is not a signal for proteasomal targeting (17). Rather, by competition for ubiquitin, it can protect proteins from ubiquitination and ensuing proteasomal degradation (18). However, it was shown that ISG15 can also modify ubiquitin, thus forming ISG15–ubiquitin mixed chains (19). Various signal transduction proteins can be ISGylated, and this can affect signaling outcome, as shown in some specific cases (3). Several viruses have developed distinct strategies to counteract ISGylation (7), further indicating that ISGylation plays an important role in the arms race against viral infection. Susceptibility to different viral infections has been studied in Isg15−/− mice, Ube1l−/− mice, and Usp18−/− mice (8). Response to a number of virus types, but not all, was found to be impaired in Isg15−/− mice. By comparing phenotypes of Isg15−/− mice with those of Ube1l−/− mice, in which only the conjugation to substrates, but not the function of free ISG15, is eliminated, the function of free ISG15 can be separated from that of ISGylation-dependent mechanisms. Irrespective of its protease function toward ISG15-modified substrates, USP18 represents a major negative regulator of the type I IFN response (20). Therefore, mice lacking USP18 protein expression exhibit phenotypical alterations not directly linked to ISG15. A knock-in mouse model with selective inactivation of only the protease function of USP18 exhibited enhanced ISGylation and increased viral resistance (21). From the collected work, it can be concluded that both ISGylation (22) and free ISG15 (23) can protect against certain viral infections in mice. In the few ISG15-deficient human patients that have been reported, no evidence for increased susceptibility to viral infection has been detected so far (8). Initially, ISG15-deficient patients were discovered on basis of failed immunity to live attenuated mycobacteria (bacillus Calmette-Guérin) (5). A second group of ISG15-deficient patients that had not been vaccinated with bacillus Calmette-Guérin presented with a syndrome characterized by excessive type I IFN signaling (18), as did USP18-deficient patients (24). Mechanistic studies revealed that USP18 negatively regulates type I IFNR (IFNAR) signaling, independent of its de-ISGylation activity (18, 25). USP18 is subject to ubiquitin-dependent proteasomal degradation, which is inhibited by free intracellular ISG15. In this way, USP18 and ISG15 mediate negative feedback on IFNAR signaling, which explains the inflammatory phenotype in the ISG15-deficient patients (20). Remarkably, this stabilizing effect of free ISG15 on USP18 is found in humans, but not in mice (26), in which the affinity of the interaction is lower, likely because of the significant divergence in amino acid sequence of ISG15 between species (7). The function of the free extracellular form of ISG15 has been an enigma. Free ISG15 does not have an N-terminal hydrophobic signal sequence (27, 28), so it is not secreted from cells in the classical way. However, ISG15 can be released from different cell types, including myeloid and lymphoid cells (5, 27–30) and is found in the serum of patients treated with type I IFN (27, 28, 31). The suggested immunomodulatory role of extracellular ISG15 is ill-defined and primarily based on cell culture experiments. ISG15 was shown to enhance IFN-γ secretion by NK cells and T cells (5, 31–33), which has been suggested to be its main antimycobacterial activity (5). A breakthrough has been the recent identification of the integrin LFA-1 (αLβ2) as cell surface receptor for extracellular ISG15. This work, performed on human cells in vitro, defined a signaling role for extracellular ISG15 by showing that 2 aa in ISG15 are critical for binding to LFA-1 and supporting IFN-γ secretion from IL-12–primed NK cells (33). One in vivo study indicates that ISG15 encoded by a DNA vaccine can promote the CTL response in mice (34), and another study reported that recombinant ISG15 protein can promote dendritic cell (DC) activation in mice (35). We have addressed the potential role of extracellular ISG15 in supporting the CTL response in vivo and evaluated the underlying mechanisms in a clinically relevant mouse model of therapeutic vaccination. With this study, we demonstrate that extracellular ISG15 is an alarmin that promotes the CTL response via NK cells. Materials and Methods Mice C57BL/6JRj mice were obtained from Janvier Laboratories (Le Genest-Saint-Isle, France). Isg15−/− mice (36) were provided by Dr. K.-P. Knobeloch (Freiburg, Germany). In all experiments, gender- and age-matched (8–12 wk) mice were used and maintained in individually ventilated cages (Innovive, San Diego, CA). Control and test mice were selected at random. Experiments were performed according to national and institutional guidelines and approved by the institutional committee for animal experimentation. Cells Bone marrow (BM) cells were isolated by flushing femurs of Isg15−/− mice with PBS supplemented with 2% FCS (Life Technologies BRL, Thermo Fisher Scientific). RBCs were lysed in 0.14 M NH4Cl and 0.017 M Tris-HCl (pH 7.2) for 1 min. DCs were generated by culturing 2 × 10⁶ BM cells in IMDM supplemented with 8% FCS and rFlt3 ligand (homemade) for 8 d. HeLa cells were cultured in DMEM supplemented with 8% FCS. Phoenix-Eco packaging cells were cultured in IMDM supplemented with 5% FCS. DNA constructs and gene expression The E7SH DNA vaccine was generated as described (37, 38). Briefly, gene fragments of the human papilloma virus (HPV)–16 E7 gene were introduced into pVAX1 vector. The cDNA-encoding mouse ISG15 wild-type (WT) (NM_015783) or ISG15 ΔGG, synthesized as a gBlock gene fragment (Integrated DNA Technologies) was inserted into the pVAX1 plasmid (Invitrogen) using BamHI and NotI restriction sites. The mutant version of ISG15, which contains a leucine instead of a tyrosine residue at position 94 and an aspartate instead of a glutamine residue at position 100 (pVAX-ISG15-Y94L_Q100D), was generated using the QuikChange kit (StrataGene) in accordance with the manufacturer’s instructions. To express ISG15 variants in BM-derived DCs, ISG15 WT and ΔGG were subcloned into the pMX-IRES-GFP vector using BamHI and NotI restriction sites. BM-derived DCs expressing murine ISG15 WT or ΔGG were generated by retroviral transfection. For virus production, retroviral constructs were transfected using FuGENE HD Transfection Reagent (Promega) into Phoenix-Eco packaging cells, together with the pCL-Eco vector encoding the ecotropic retrovirus receptor. Medium that contained retrovirus was harvested from the Phoenix-Eco packaging cells 48 h later. For retroviral transduction, BM-derived DC precursors were cultured with Flt3 ligand for 3 d. Next, they were resuspended at 2 × 10⁶ cells/ml retrovirus-containing medium plus Flt3 ligand and placed in nontissue culture–treated, 24-well plates (BD Biosciences) coated with 50 μg/ml RetroNectin (Takara Bio). Plates were spun for 90 min at 450 × g. Cells were cultured in this medium for 24 h. Cells were then transferred to BM-derived DC culture medium and maintained for 4 extra d before use. Transfections of cDNA in HeLa cells were performed using FuGENE HD transfection reagent (Promega) according to the manufacturer’s instructions. Western blotting Cells were harvested, washed with PBS, and lysed in 50 mM Tris-HCl (pH 7.4), 150 mM NaCl, 1% Nonidet P-40, and cOmplete Inhibitor Cocktail (Roche). Insoluble material was removed by centrifugation at 20,000 × g for 15 min. Protein concentration was determined by Bradford protein assay (Bio-Rad Laboratories). Equal amounts of lysate were separated on NuPAGE 4–12% Bis-Tris gels (Invitrogen), and proteins were transferred to nitrocellulose transfer packs (Bio-Rad Laboratories) using the Semi-dry Trans-Blot Turbo Transfer System (Bio-Rad Laboratories) according to manufacturer’s instructions. Membranes were blocked with Roche Western block solution (1:10) in TBS with 0.1% Tween 20 for 1 h at room temperature. Next, membranes were incubated overnight at 4°C with appropriate primary Abs in Roche Western block solution (1:20)/TBS with 0.1% Tween 20, washed with TBS with 0.1% Tween 20, and probed with the adequate secondary Abs (1:10,000) in Roche Western block solution/TBS with 0.1% Tween 20 for 1 h at room temperature. Primary Abs used were the following: rabbit anti-mouse ISG15 (1:5000, kindly provided by Dr. K.-P. Knobeloch), mouse anti-actin (1:10,000, clone C4; MAB1501R; MilliporeSigma), and anti-mouse GAPDH (1:2000, clone D4C6R; 97166S; Cell Signaling Technology). Secondary Abs used were the following: goat anti-mouse IRDye 682/800 (925-68070/926-32210) or goat anti-rabbit IRDye 682/800 (925-68071/925-32211) from LI-COR Biosciences. Immunoblots were developed with the aid of an Odyssey Imaging System (LI-COR Biosciences). Intraepidermal DNA “tattoo” vaccination On day 0, mice were anesthetized with isoflurane, and the hair on a hind leg was removed using depilating cream (Veet; Reckitt Benckiser). On days 0, 3, and 6, a 15-μl drop of a solution containing 2 mg/ml plasmid DNA (pDNA) mixture in 10 mM Tris-HCl and 1 mM EDTA (pH 8) was applied to the hairless skin of anesthetized animals and delivered into the epidermis with a Permanent Makeup Tattoo machine (MT.DERM) using a sterile disposable nine-needle bar with a needle depth of 1 mm and an oscillating frequency of 100 Hz for 45 s. In vivo NK cell depletion Mice were injected i.v. with 100 μl of anti-asialo GM1 (39) or control rabbit sera (Wako Chemicals) diluted 1∶10 in HBSS the day before the first DNA vaccination and on days 0 and 3. Leukocyte isolation and flow cytometry Blood was collected from tail bleeding using Microvette CB 300 LH tubes (Sarstedt). To isolate lymphocytes from spleen and inguinal draining lymph node (dLN), organs were passed through a 70-μm cell strainer (BD Falcon). RBCs were lysed in 0.14 M NH4Cl and 0.017 M Tris-HCl (pH 7.2) for 1 min at room temperature. Then, cell samples were centrifuged for 5 min at 400 × g and resuspended in FACS buffer (PBS with 2% FCS; Antibody Production Services). Surface staining with relevant mAbs and allophycocyanin–H-2Db/E749–57 tetramers was performed for 30 min on ice. Intracellular staining was performed after cell fixation and permeabilization using Foxp3 Transcription Factor Staining Buffer Set (eBioscience). Fluorochrome-labeled mAbs employed were as follows: anti-CD8α–V500 (1:200, clone 53-6.7) and anti–IFN-γ–eF450 (1:100, clone XMG1.2) from BD Biosciences; anti-CD127–BV421 (1:200, clone A7R34) and anti-CD3–Alexa Fluor 488 (1:200, clone 17A2) from BioLegend; anti-KLRG1–PEeF610 (1:200, clone 2F1), anti-CD44–PerCP-Cy5.5 (1:400, clone IM7), anti-CD49b–PE-Cy7 (1:200, clone DX5), anti-NK1.1–Alexa Fluor 700 (1:200, clone PK136), anti-CD4–eF450 (1:200, clone GK1.5), anti-Tbet–PE-Cy7, and anti-CD62L–FITC (1:100, MEL-14), from eBioscience; and anti–granzyme B (GZB)–PE (1:200, clone CLB-GB11) (Sanquin Reagents). To detect cytokine production by E749–57-specific CD8+ T cells in dLN and spleen, cells were incubated for 16 h with 1 μg/ml E749–57 or no peptide (negative control) in the presence of GolgiPlug (BD Biosciences) in IMDM supplemented with 8% FCS. Flow cytometry was performed using LSRFortessa (BD Biosciences), and data were analyzed with FlowJo software (Tree Star). Live cells were selected based on staining with LIVE/DEAD Near Infrared dye (Thermo Fisher Scientific). RNA preparation and sequencing At day 4 postvaccination, total skin from the tattooed area was isolated, and total RNA was isolated using the RNeasy Mini Kit (catalog no. 74106; QIAGEN), including an on-column DNA digestion (catalog no. 79254; QIAGEN), according to the manufacturer’s instructions. Quality and quantity of the total RNA was assessed by the 2100 Bioanalyzer using an RNA Nano Chip and RNA Pico Chip (Agilent Technologies). Total RNA samples having RNA integrity number > 8 were subjected to library generation. Strand-specific cDNA libraries were generated using the TruSeq Stranded mRNA Sample Preparation Kit (Illumina) according to the manufacturer’s instructions. The libraries were analyzed on a 2100 Bioanalyzer using a DNA 7500 Chip (Agilent Technologies), diluted and pooled equimolar into a multiplex sequencing pool and stored at −20°C. The libraries were sequenced with 65 base single reads on a HiSeq 2500 using V4 chemistry (Illumina). RNA sequence analysis Differential expression of genes was assessed using the DESeq2 package (40) using default parameters in R v.3.5.3 (https://www.R-project.org/). Genes with adjusted p values ≤ 0.05 were deemed significantly differentially expressed. To find activated pathways, overexpressed in comparison with the control (according to log-fold change > 0, adjusted p value ≤ 0.1), were used as input for enrichment analysis using the Reactome enrichment analysis tool available at https://reactome.org/PathwayBrowser/#TOOL=AT. Additionally, we analyzed activated pathways using Ingenuity Pathway Analysis (IPA; QIAGEN). In this case, raw read counts were loaded into the software and analysis carried out using default settings. Data have been deposited in the Gene Expression Omnibus database (https://www.ncbi.nlm.nih.gov/geo/) under accession number GSE139469. Statistical analysis Statistical significance was determined with GraphPad Prism software as indicated in the figure legends. Illustrations Illustrations in Figs. 1A, 2A, and 6A were made with BioRender. Results ISG15 causes innate immune alert in the skin We were intrigued by earlier findings that extracellular ISG15 may act as an adjuvant to support the CTL response (34). We aimed to corroborate this and to understand the mechanistic basis, making use of a versatile therapeutic DNA vaccination model in mice (37) that we have well characterized previously (38, 41, 42). In this model, pDNA is applied on the depilated skin and injected into the epidermis using a tattoo device (Fig. 1A). This results in transfection of keratinocytes with the pDNA of interest, which is subsequently transcribed and translated (42). To determine whether ISG15 protein expression had a local effect on the vaccinated skin, we performed the following experiment: two groups of mice were vaccinated with pDNA encoding specific Ag (to be described in Fig. 2) combined with pDNA encoding ISG15 or an equal dose of empty vector (Fig. 1A). At day 4 after vaccination, total skin from the area of vaccination was excised, and mRNA was isolated and subjected to deep sequencing. FIGURE 1. The skin transcriptome reports ISG15 activity. (A) Illustration of the intraepidermal pDNA tattoo vaccination procedure and expression of pDNA-encoded protein (green) in transfected keratinocytes. Mice were vaccinated in comparative settings with pDNA encoding HPV-E7 (vaccine DNA) in combination with either pDNA-encoding ISG15 ΔGG (ISG15 DNA) or an equal amount of empty vector pDNA. (B) mRNA from total skin of mice (n = 3 per group) vaccinated with “vaccine DNA” versus “vaccine DNA + ISG15 DNA” was subjected to deep sequencing. Gene ontology analysis was performed by IPA of the 444 genes found to be differentially expressed between the comparative vaccination settings (p value ≤ 0.05). The functional categories connected to cell migration and with a predictive activation z-score ≥2 are depicted. (C) IPA-based rendering of differentially expressed molecules from the functional categories depicted in (B) and their subcellular localization. The total experiment was performed once. FIGURE 2. WT ISG15 promotes the Ag-specific CTL response to vaccination. (A) Illustration of the cellular context of vaccine Ag delivery in the skin and the route of the Ag from keratinocytes to the dLN. (B) Scheme of the DNA sequence encoding the shuffled (SH) version of the HPV-16 E7 protein (E7SH vaccine) and ISG15 WT used for vaccination. For the E7 protein, the different exons (A–D) and the signal peptide (SP) are indicated. In exon B, the immunodominant H-2Db–restricted epitope RAHYNIVTF (corresponding to aa 49–57 from the original E7 protein) is depicted (37, 38). For ISG15, the two exons (A and B) are indicated (ENSMUST00000085425.5). In exon B, the conjugation site (LRLRGG, aa 150–155) is depicted. (C) MHC tetramer technology to identify by flow cytometry CD8+ T cells with a TCR that recognizes H-2Db/E749–57. Recombinant H-2Db MHC class I (MHCI) monomers are folded with E749–57 peptide, conjugated to biotin and multimerized with streptavidin conjugated to a fluorophore allophycocyanin. (D–G) Mice (n = 5 per group) were vaccinated with HPV-16 E7SH cDNA (E7SH) in combination with pVAX empty vector (EV) or pVAX-mouse ISG15 (ISG15 WT) on days 0, 3, and 6. The CD8+ T cell response was followed in time by flow cytometric analysis of peripheral blood using H-2Db/E749–57 tetramers. (D) Representative staining of cells with H-2Db/E749–57 tetramer and anti-CD8 Ab. Numbers indicate frequency of tetramer+ cells among total CD8+ T cells. (E) Quantification of the percentage of H-2Db/E749–57 tetramer+ cells among total CD8+ T cells over time postvaccination. (F) Representative staining of cells with H-2Db/E749–57 tetramer and Ab to GZB. Numbers indicate percentage of GZB+ cells among tetramer+ cells. (G) Quantification of the percentage of GZB+ cells among tetramer+ cells at day 13 postvaccination. Results are representative of at least three experiments. Statistical analysis was performed using two-tailed Student t test. *p < 0.05, **p < 0.01. Statistical analysis of normalized transcript read counts showed that 444 genes were differentially expressed in the skin as a result of ISG15 coexpression (Supplemental Table I; Gene Expression Omnibus submission GSE139469). Using IPA, we identified 29 functional categories predicted to be increased according to an activation z-score ≥2. Interestingly, 15 of these categories indicated that ISG15 stimulated cell migration, particularly of myeloid cells and endothelial cells (Fig. 1B). A zoom-in on the 140 specific molecules in the functional categories listed in Fig. 1B highlighted that ISG15 significantly upregulated the expression of various metalloproteases (Mmp2, Mmp9, Mmp11, Mmp14, and Adam12; downregulation of inhibitor Timp4) and collagens (Col1a1, Col3a1, Col6a1, and Col18a1) (Fig. 1C), suggesting remodeling of the extracellular matrix. This correlated with gene ontology analysis using Reactome, which more precisely specified metalloprotease activity, collagen degradation and formation, and extracellular matrix organization (Table I). The extracellular matrix remodeling and immune cell signature observed in the transcriptome strongly suggests that ISG15 is able to evoke tissue alarm. View inlineView popup Table I. Gene ontology analysis of ISG15-induced differential gene expression in skin WT ISG15 promotes the CD8+ T cell response to therapeutic vaccination Using a fluorescent protein encoded by the vaccine, we have previously shown that vaccine protein expressed by keratinocytes can reach the proximal skin-draining dLN in two ways: the protein can be transported by migratory dermal DCs or drain passively via the lymph (42). In both cases, DCs can process the vaccine protein and cross-present relevant peptides in MHC class I, which can lead to the activation of Ag-specific CD8+ T cells (Fig. 2A). To examine CD8+ T cell activation, we used a DNA vaccine–encoding HPV-16 E7 protein in a shuffled configuration (E7SH) (37, 38). This protein contains an immunodominant epitope, E749–57, that is presented by H-2Db (Fig. 2B). To examine the effect of ISG15 on the T cell response, we vaccinated the mice with the E7SH vaccine in combination with empty vector or vector encoding WT ISG15. We followed the CD8+ T cell response by flow cytometry, using MHC tetramers (Fig. 2C). We knew that vaccination with E7SH elicits a weak CTL response (38, 41) and purposely used this vaccination setting to create a good window for testing the potential adjuvant effect of ISG15. The E7-specific CD8+ T cell response was followed in blood over time (Fig. 2D). This analysis revealed that the frequency of E7-specific cells within total CD8+ T cells was dramatically increased in the ISG15-adjuvanted setting. Analysis for expression of the CTL effector molecule GZB at day 13 emphasized that more CTLs were raised in the ISG15-adjuvanted setting (Fig. 2E). Free ISG15 enhances the generation of vaccine Ag-specific CTLs We next examined whether it was free or conjugated ISG15 that promoted the CTL response. For this purpose, we compared the activity of ISG15 WT with the activity of the ISG15 ΔGG mutant that lacks the C-terminal glycine residues that are required for substrate conjugation (Fig. 3A). Lack of ISG15 conjugation was validated by expression of ISG15 WT and the ISG15 ΔGG mutant in Isg15−/− DCs. As expected, transduction of a vector encoding ISG15 WT led to expression of the free form as well as ISG15 conjugation to multiple proteins, whereas transduction of the vector encoding ISG15 ΔGG led to expression of the free form only (Fig. 3B). FIGURE 3. The free form of ISG15 promotes CTL priming in response to vaccination. (A) Scheme of mouse ISG15 WT protein (aa 1–161) and its C-terminal truncated version, ISG15 ΔGG (aa 1–153). The minimal sequence (LRLRGG) required for its conjugation to intracellular proteins is depicted in ISG15 WT. (B) Validation of ISG15 constructs by assessment of ISGylation of intracellular proteins. pDNA encoding ISG15 WT or ISG15 ΔGG and empty control vector (EV) were expressed in Isg15−/− BM-derived DCs, and ISGylation was assessed by Western blotting on total cell lysates. Actin served as loading control. Results are representative of multiple independent analyses with individual samples. (C–E) Mice (n = 7 per group) were vaccinated with plasmid encoding E7SH, either combined with EV, ISG15 WT, or ISG15 ΔGG as outlined in Fig. 2. (C and D) The E7-specific CTL response was followed over time in peripheral blood by flow cytometric analysis using H-2Db/E749–57 tetramers and Abs to CD8, GZB, Tbet, CD44, and CD62L. (C) Quantification of the percentage of H-2Db/E749–57 tetramer+ cells among total CD8+ T cells. (D) Quantification of the percentage of GZB+, Tbet+, and CD44+CD62L− cells within H-2Db/E749–57 tetramer+ cells. (E) On day 16, three mice per group were sacrificed, and the T cell response was assessed in dLN and spleen. Depicted are percentage of H-2Db/E749–57 tetramer+ cells within total CD8+ T cells, percentage of GZB+ cells within tetramer+ cells ex vivo, and percentage of IFN-γ+TNF-α+ cells among total CD8+T cells after in vitro stimulation. Results are representative of two experiments. Statistical analysis was performed using one-way ANOVA (C and D) or two-way ANOVA (E) and Tukey posttest. *p < 0.05, **p < 0.01, ***p < 0.001, ****p < 0.0001. The CD8+ T cell response to vaccination with E7SH was increased in equal measure by concomitant vaccination with either ISG15 WT or ISG15 ΔGG throughout the entire kinetics, as monitored in blood (Fig. 3C). The CD8+ T cells raised after ISG15-adjuvanted vaccination had undergone CTL effector differentiation, as determined by expression of GZB and the transcription factor Tbet and the effector phenotype CD44+CD62L− (Fig. 3D). Both ISG15 WT and nonconjugatable ISG15 ΔGG promoted the CTL response in equal measure (Fig. 3C, 3D). To validate that the increased magnitude of the CTL response observed in blood was a consequence of an increase in CD8+ T cell priming, we examined the response in dLN and spleen. Both ISG15 WT and ISG15 ΔGG significantly increased, in equal measure, the magnitude of the E7-specific CD8+ T cell response in dLN and spleen (Fig. 3E). Furthermore, the responder CD8+ T cells had differentiated into CTLs as determined on day 16 by expression of GZB and coexpression of IFN-γ and TNF-α (Fig. 3E). This analysis highlighted that vaccination with E7SH alone hardly generated functional CTLs, whereas ISG15 WT or ISG15 ΔGG-adjuvanted vaccination raised a sizeable CTL response. We conclude that ISG15 does not need to be conjugated to proteins to have an adjuvant effect on the CTL response to vaccination. Free ISG15 enhances CTL differentiation, formation of short-lived effector and effector memory CTLs To examine the impact of ISG15 on the intrinsic functionality of CTLs, we analyzed the protein expression levels of GZB, Tbet, and CD44 on a per-cell basis. In the ISG15-adjuvanted settings (WT or ΔGG), CTLs expressed higher levels of these molecules, indicating improved effector differentiation (Fig. 4A). Furthermore, we determined the formation of short-lived effector cells (SLECs) and memory precursor effector cells (MPECs) throughout the primary immune response. ISG15 WT and ΔGG increased in equal measure the frequency of SLECs (KLRG1+ CD127) within E7-specific CD8+ T cell pool raised upon vaccination, as measured in blood throughout the entire response kinetics. The frequency of MPECs (CD127+KLRG1−) within the E7-specific CD8+ T cell pool was correspondingly reduced in both ISG15-adjuvanted settings (Fig. 4B, 4C). Thus, CTL differentiation seemed to be geared more toward a short-lived effector- than an effector memory differentiation fate in the ISG15-adjuvanted setting. Nevertheless, the absolute numbers of E7-specific MPECs in spleen at day 16 postvaccination were significantly higher when ISG15 was included in the vaccination setting (Fig. 4D). This result correlated with an increased frequency of E7-specific CD8+ T cells in blood at day 72 postvaccination (steady-state memory) (Fig. 4E). Among these memory cells, effector memory phenotype cells (CD44+CD62L−) were drastically increased in the ISG15-adjuvanted setting (Fig. 4F). Thus, free ISG15 promotes the effector differentiation of CTLs, the formation of short-lived effector CTLs, as well as the formation of memory precursor effector CTLs and effector memory CTLs. FIGURE 4. The free form of ISG15 supports short-lived effector and effector memory differentiation of CTLs. (A–D) Mice (n = 7 per group) were vaccinated with plasmid encoding E7SH, either combined with EV, ISG15 WT, or ISG15 ΔGG as outlined in Fig. 2. (A) Flow cytometric analysis of protein expression as assessed by mean fluorescence intensity (MFI) of GZB, Tbet, and CD44 on E7-specific CD8+ T cells in blood at day 13 postvaccination. (B) Representative flow cytometric analysis of E7-specific CD8+ T cells stained with Abs to KLRG1 and CD127. Numbers indicate percentage of cells in each quadrant. (C) Quantification of percentage of SLECs (KLRG1+CD127−) (left) and MPECs (CD127+KLRG1−) (right) within E7-specific CD8+ T cells in blood over time. (D) On day 16, three mice per group were sacrificed, and total numbers of CD127+KLRG1− E7-specific cells per spleen were determined. (E) Quantification of the percentage of E7-specific cells within CD8+ T cells in blood on day 72. (F) Quantification of the percentage of CD44+CD62L− cells among E7-specific CD8+ T cells in blood on day 72. Results are representative of two experiments. Statistical analysis was performed using one-way ANOVA and Tukey posttest (A–D) or two-tailed Student t test (E). *p < 0.05, **p < 0.01, ***p < 0.001, ****p < 0.0001. Amino acid residues Y94 and Q100 of ISG15 are required for its adjuvant effect on the CTL response Recently, the integrin LFA-1 has been defined as a receptor for free ISG15 in a human cell culture system. Amino acid residues Y96 and Q102 in human ISG15 proved to be critical for LFA-1 binding (33) (Fig. 5A). Based on these findings, we hypothesized that the effect of free ISG15 on the CTL response that we observed in this study in vivo is a consequence of ISG15 binding to a receptor. We therefore tested the adjuvant activity of mouse ISG15 with the equivalent mutations, Y94L_Q100D (Fig. 5A), that should abrogate its ligand activity. The mutant, encoded by the pVAX expression vector, was expressed to at least equivalent levels as WT ISG15 at the protein level in transfected cells (Fig. 5B). FIGURE 5. Residues Y94 and Q100 in ISG15 are critical for its adjuvant effect on the CTL response. (A) Three-dimensional structure of ISG15 and the position of amino acids Y94 and Q100 (http://www.rcsb.org/structure/5TLA) (61). (B) Validation of equal expression of WT and Y94L_Q100D mutant ISG15 constructs in HeLa cells, as determined by Western blotting on total cell lysates. GAPDH was used as loading control. Results are representative of two analyses with individual samples. (C–E) Mice (n = 4 per group) were vaccinated with plasmid encoding E7SH, either combined with EV, ISG15 WT, or ISG15 Y94L_Q100D as outlined in Fig. 2. (C) Quantification of the E7-specific CD8+ T cell response over time in blood. (D) Quantification of the percentage of GZB+ cells among H-2Db/E749–57 tetramer+ cells at day 16. (E) Protein quantification (mean fluorescence intensity [MFI]) of GZB in H-2Db/E749–57 tetramer+ cells at day 16. Results are representative of two experiments. Statistical analysis was performed using one-way ANOVA and Tukey posttest and is indicated for day 16. **p < 0.01, ****p < 0.0001. Mice were vaccinated as described above with a vector encoding E7SH, in conjunction with either empty vector, vector encoding ISG15 WT, or ISG15 Y94L_Q100D. The E7-specific CD8+ T cell response was followed in blood over time. The two mutations in ISG15 completely abrogated its ability to improve the E7-specific CD8+ T cell response, as determined by response magnitude (Fig. 5C), generation of E7-specific GZB+ cells (Fig. 5D), and intrinsic CTL quality, as defined by GZB expression on a per cell basis (Fig. 5E). ISG15 promotes the CTL response via NK cells In the same study based on human cells culture as referred above (33), extracellular recombinant ISG15 was shown to promote IFN-γ production from IL-12–primed NK cells by binding to LFA-1 (Fig. 6A). We therefore examined whether ISG15 acted via NK cells to improve the CTL response in our vaccination setting. For this purpose, NK cells were depleted with antiserum to glycolipid asialo GM1 (39) before and during the vaccination regimen. This depletion did not affect CD8+ T cells (Fig. 6B) and was very effective in NK cell depletion as measured in blood throughout the T cell response kinetics (Fig. 6C). Interestingly, the response to vaccination with E7SH in combination with ISG15 WT was significantly reduced upon NK cell depletion (Fig. 6D). In the NK cell–depleted setting, the E7-specific CD8+ T cell response was negligible until day 10, which was the peak of the response in the control setting. At day 13 postvaccination, the CD8+ T cell response reached its peak in the NK cell–depleted setting, which was lower than in the control setting. Furthermore, NK cell depletion led to a significant reduction in the frequency of SLECs and a corresponding increase in MPECs at day 10 of the response, but no differences in SLEC and MPEC frequencies were evident at day 13 in the control and NK cell–depleted settings (Fig. 6E). This indicates that the CTLs were capable of acquiring an effector phenotype in the absence of NK cells. Thus, in absence of NK cells, the effects of ISG15 on the magnitude and effector quality of the CTL response were delayed. However, the response was not fully abrogated as in case of the ISG15 Y94L_Q100D mutant, suggesting that ISG15 additionally stimulates the CD8+ T cell response in an NK cell–independent manner. FIGURE 6. NK cells contribute to relaying the effects of ISG15 to E7-specific CD8+ T cells. (A) Scheme showing ISG15 interaction with LFA-1 (αLβ2 integrin and CD11a/CD18) receptor in NK cells and its biological impact as described for human cells in vitro (33). (B–E) Mice (n = 4 per group) were vaccinated on days 0, 3, and 6 with plasmid encoding E7SH combined with ISG15 WT. On days −1, 0, 3, and 6, mice were injected i.v. with control serum or anti-asialo GM1 antiserum. (B) Frequency of CD8+ cells among live cells in blood at the indicated days postvaccination. (C) Frequency of NK1.1+ cells within CD3-negative cells in blood at the indicated days postvaccination to validate NK cell depletion. (D) E7-specific cells within CD8+ cells in blood at the indicated days postvaccination. (E) Percentage of SLECs (KLRG1+CD127−) (left) and MPECs (CD127+KLRG1−) (right) within E7-specific CD8+ T cells in blood at days 10 and 13. Results are representative of two experiments. Statistical evaluation was performed using one-way ANOVA evaluation and Tukey posttest and is indicated for day 10. **p < 0.01, ****p < 0.0001. Discussion In the current study, we have identified a tissue-wide response to free ISG15. Gene expression profiling demonstrated that expression of ISG15 ΔGG in the epidermis stimulated the migration of innate immune cells and endothelial cells, as well as extracellular matrix degradation and remodeling. Endogenous ISG15 has been implicated in migration of different cancer cell lines (43). Furthermore, recombinant ISG15 was found to induce neutrophil chemotaxis in vitro (44) and influx of DCs to the site of infection in vivo (34). The gene expression signature induced by free ISG15 in the skin suggested myeloid cell recruitment and proinflammatory activity according to the upregulation of the cell surface receptors Trem1 and Trem2 (45). Free ISG15 promoted inflammation also as judged by the upregulation of chemokines CXCL1 and CXCL3, which are produced by neutrophils and promote vascular leakage (46), as well as the upregulation of IL-21R, which responds to T cell–derived IL-21 by induction of proinflammatory cytokines (47). However, the gene signature also suggested epithelial tissue repair, as indicated by collagen synthesis and increased expression of IL-24 (48) and ICOSL (49). Its collective properties as a molecule that is released from cells following pathogen challenge and/or cell death and is able to mobilize and activate various leukocytes suggest that free ISG15 acts as an alarmin (50), as has been proposed earlier (51). Another criterion to classify ISG15 as an alarmin is that the candidate molecule is able to activate innate and adaptive immune responses, which we indeed show to be the case for free ISG15. In our gene set obtained from the vaccinated skin, we did not observe upregulation of IL-10 or IL-6 that were previously shown to be produced by human blood–derived monocytes in response to extracellular ISG15 (51). We also did not find IFN-γ that can be produced by human blood–derived lymphoid cells in response to extracellular ISG15 (31–33). This may be explained by the fact that we determine a response in the skin rather than peripheral blood. Vaccination using an MHC class I epitope only is known to be ineffective in eliciting a CTL response. That is why MHC class II–binding helper epitopes are included in therapeutic vaccines to cancer and infectious disease (52). An optimal CTL response to vaccination relies on cross-presentation and activation of the DCs presenting the vaccine Ag by CD4+ T cells (53). We and others have shown previously in the DNA vaccination model presented in this study how inclusion of helper epitopes supports the CTL response (37, 38, 41). In the current study, we find that free ISG15 can improve the CTL response to the vaccine as an alternative to CD4+ T cell help. Moreover, we find that this adjuvant activity depends on residues Y94 and Q100 of mouse ISG15, whose equivalents were implicated in LFA-1 binding in a human in vitro system (33). We now show that the in vivo function of free ISG15 depends on these amino acids. The fact that free ISG15 needs these residues to bind to LFA-1 in vitro and to optimize the CTL response in vivo supports the concept that free ISG15 acts extracellularly as an immunomodulatory molecule. Remarkably, we found that free ISG15 promoted the vaccine-specific CTL response, at least in part, via NK cells. This is in further agreement with the study of Swaim et al. (33), which found free ISG15 to promote human NK cell functin in vitro. In our study, free ISG15 promoted the clonal expansion of CD8+ T cells that respond to the vaccine, as well as their differentiation into SLECs and effector memory cells. The improved effector quality of CTLs primed in presence of free ISG15 was testified by the increased expression of GZB on a per-cell basis. CD4+ T cell help also promotes the CTL response in this manner, but the “help” delivered by ISG15 was CD4+ T cell independent, because we have shown that CD4+ T cells do not respond to the vaccine that we have employed in the current study (38). Our findings are consistent with those of other authors who found that free ISG15 promoted the CTL response in a setting with i.m. DNA vaccination (34) that is less robust than intraepidermal vaccination (54). In our study, we show the underlying mechanisms. As discussed above, free ISG15 caused a tissue alert and promoted the CTL response. Free ISG15 may have acted directly on CD8+ T cells to promote their response, but, more likely, given the myeloid cell activity induced, DC function was affected. The limiting factor in the CTL response in this model is the appropriate activation of DCs. Migratory cDC1 deliver the vaccine Ag from the skin to the dLNs, and a deficiency in their activation limits the CTL response to vaccination (42). We hypothesize that free ISG15 acts as an alarmin in the skin, promoting an inflammatory phenotype and creating the required signals for adequate activation of migratory cDC1s presenting the vaccine Ag. Free ISG15 proved to act, at least in part, via NK cells to optimize the CTL response. NK cells and DCs are known to communicate in a bidirectional fashion: DCs can help activate NK cells and thereby promote innate immunity, and reciprocally, NK cells can help activate DCs and thereby promote adaptive immunity (55). Therefore, we hypothesize that ISG15 impacts NK cell–DC cross-talk and thereby creates an optimal CTL response. This cross-talk may take place in the skin, because NK cells have been found in both healthy and inflamed skin (56, 57), and migratory DCs are known to play a role in our vaccination model (42). Therefore, in our model, ISG15 may have promoted IFN-γ production by NK cells, which is known to enhance expression of costimulatory molecules and IL-12 by DCs (58). The (migratory) DCs would thereby be optimized for CTL priming. Because NK cell depletion did not fully abrogate the ISG15 effect on the CTL response in our model in contrast to mutation of Y94 and Q100, ISG15 likely acts as an immunostimulatory ligand on other cells as well. NKT cells are a good candidate, because this cell type was not depleted by our strategy, and reciprocal NKT cell–DC activation has been described (59). We conclude that ISG15 is part of an innate route to promote the CTL response as an alternative or supplement to CD4+ T cell help (53). An earlier study reports that DC activation promoted by NK cell–derived IFN-γ could replace CD4+ T cell help in inducing a protective antitumor CD8+ T cell response (60) that supports this concept. Our data tie together various independent observations on free ISG15 function that were primarily made in vitro and, even in human cells, into one concept that explains how free ISG15 can act as an alarmin and adjuvant to bridge innate and adaptive immunity. Our study relies on deliberate expression of ISG15, which has likely widened the window to observe this immune stimulatory function of ISG15 and its underlying mechanisms. By binding to USP18 and stabilizing it, intracellular free ISG15 promotes negative feedback on the type I IFN response in human, but not in mouse (7, 26). The question is whether this process would limit the application of free ISG15 as immune adjuvant in human. We show, in this study, that local and transient production of free ISG15 in the mouse skin is beneficial for the T cell response to therapeutic vaccination. In human, such a setting might be created as well, formulating free ISG15 and Ag either in pDNA or in protein form. In such vaccine-adjuvant settings, free ISG15 in proteinaceous form can only act extracellularly, and free ISG15 encoded by pDNA is expressed locally and transiently. For these reasons, the vaccine-adjuvant effect of free ISG15 may be reproducible in human. Disclosures The authors have no financial conflicts of interest. Acknowledgments We thank Astrid Bovens and the personnel of the experimental animal, flow cytometry, and genomics core facilities of the Netherlands Cancer Institute for expert assistance. Footnotes This work was supported by The Netherlands Organisation for Health Research and Development Gravitation Subgrant 00002 from the Institute for Chemical Immunology. Data have been deposited in the Gene Expression Omnibus (https://www.ncbi.nlm.nih.gov/geo/) under accession number GSE139469. The online version of this article contains supplemental material. Abbreviations used in this article: BM bone marrow DC dendritic cell dLN draining lymph node GZB granzyme B HPV human papilloma virus IPA Ingenuity Pathway Analysis ISG IFN-stimulated gene MPEC memory precursor effector cell pDNA plasmid DNA SLEC short-lived effector cell WT wild-type. Received December 10, 2019. Accepted February 1, 2020. Copyright © 2020 by The American Association of Immunologists, Inc. This article is distributed under The American Association of Immunologists, Inc., Reuse Terms and Conditions for Author Choice articles. References ↵Schneider, W. M., M. D. Chevillotte, C. M. Rice. 2014. Interferon-stimulated genes: a complex web of host defenses. Annu. Rev. Immunol. 32: 513–545.OpenUrlCrossRefPubMed ↵Narasimhan, J., M. Wang, Z. Fu, J. M. Klein, A. L. Haas, J. J. Kim. 2005. Crystal structure of the interferon-induced ubiquitin-like protein ISG15. J. Biol. Chem. 280: 27356–27365. ↵Perng, Y. C., D. J. Lenschow. 2018. ISG15 in antiviral immunity and beyond. Nat. Rev. Microbiol. 16: 423–439.OpenUrlCrossRefPubMed ↵Sampson, D. L., B. A. Fox, T. D. Yager, S. Bhide, S. Cermelli, L. C. McHugh, T. A. Seldon, R. A. Brandon, E. Sullivan, J. J. Zimmerman, et al. 2017. A four-biomarker blood signature discriminates systemic inflammation due to viral infection versus other etiologies. Sci. Rep. 7: 2914.OpenUrl ↵Bogunovic, D., M. Byun, L. A. Durfee, A. Abhyankar, O. Sanal, D. Mansouri, S. Salem, I. Radovanovic, A. V. Grant, P. Adimi, et al. 2012. Mycobacterial disease and impaired IFN-γ immunity in humans with inherited ISG15 deficiency. Science 337: 1684–1688. ↵Radoshevich, L., F. Impens, D. Ribet, J. J. Quereda, T. Nam Tham, M. A. Nahori, H. Bierne, O. Dussurget, J. Pizarro-Cerdá, K. P. Knobeloch, P. Cossart. 2015. ISG15 counteracts Listeria monocytogenes infection. eLife 4: e06848. ↵Dzimianski, J. V., F. E. M. Scholte, É. Bergeron, S. D. Pegan. 2019. ISG15: it’s complicated. J. Mol. Biol. 431: 4203–4216.OpenUrl ↵Hermann, M., D. Bogunovic. 2017. ISG15: in sickness and in health. Trends Immunol. 38: 79–93.OpenUrlCrossRef ↵Loeb, K. R., A. L. Haas. 1992. The interferon-inducible 15-kDa ubiquitin homolog conjugates to intracellular proteins. J. Biol. Chem. 267: 7806–7813. ↵Yuan, W., R. M. Krug. 2001. Influenza B virus NS1 protein inhibits conjugation of the interferon (IFN)-induced ubiquitin-like ISG15 protein. EMBO J. 20: 362–371. ↵Kim, K. I., N. V. Giannakopoulos, H. W. Virgin, D. E. Zhang. 2004. Interferon-inducible ubiquitin E2, Ubc8, is a conjugating enzyme for protein ISGylation. Mol. Cell. Biol. 24: 9592–9600. ↵Zhao, C., S. L. Beaudenon, M. L. Kelley, M. B. Waddell, W. Yuan, B. A. Schulman, J. M. Huibregtse, R. M. Krug. 2004. The UbcH8 ubiquitin E2 enzyme is also the E2 enzyme for ISG15, an IFN-alpha/beta-induced ubiquitin-like protein. Proc. Natl. Acad. Sci. USA 101: 7578–7582. ↵Dastur, A., S. Beaudenon, M. Kelley, R. M. Krug, J. M. Huibregtse. 2006. Herc5, an interferon-induced HECT E3 enzyme, is required for conjugation of ISG15 in human cells. J. Biol. Chem. 281: 4334–4338. ↵Ketscher, L., A. Basters, M. Prinz, K. P. Knobeloch. 2012. mHERC6 is the essential ISG15 E3 ligase in the murine system. Biochem. Biophys. Res. Commun. 417: 135–140.OpenUrlCrossRefPubMed ↵Malakhov, M. P., O. A. Malakhova, K. I. Kim, K. J. Ritchie, D. E. Zhang. 2002. UBP43 (USP18) specifically removes ISG15 from conjugated proteins. J. Biol. Chem. 277: 9976–9981. ↵Durfee, L. A., N. Lyon, K. Seo, J. M. Huibregtse. 2010. The ISG15 conjugation system broadly targets newly synthesized proteins: implications for the antiviral function of ISG15. Mol. Cell 38: 722–732.OpenUrlCrossRefPubMed ↵Liu, M., X. L. Li, B. A. Hassel. 2003. Proteasomes modulate conjugation to the ubiquitin-like protein, ISG15. J. Biol. Chem. 278: 1594–1602. ↵Zhang, X., D. Bogunovic, B. Payelle-Brogard, V. Francois-Newton, S. D. Speer, C. Yuan, S. Volpi, Z. Li, O. Sanal, D. Mansouri, et al. 2015. Human intracellular ISG15 prevents interferon-α/β over-amplification and auto-inflammation. Nature 517: 89–93.OpenUrlCrossRefPubMed ↵Fan, J. B., K. Arimoto, K. Motamedchaboki, M. Yan, D. A. Wolf, D. E. Zhang. 2015. Identification and characterization of a novel ISG15-ubiquitin mixed chain and its role in regulating protein homeostasis. Sci. Rep. 5: 12704.OpenUrlCrossRefPubMed ↵Basters, A., K. P. Knobeloch, G. Fritz. 2018. USP18 - a multifunctional component in the interferon response. Biosci. Rep. 38: BSR20180250. ↵Ketscher, L., R. Hannß, D. J. Morales, A. Basters, S. Guerra, T. Goldmann, A. Hausmann, M. Prinz, R. Naumann, A. Pekosz, et al. 2015. Selective inactivation of USP18 isopeptidase activity in vivo enhances ISG15 conjugation and viral resistance. Proc. Natl. Acad. Sci. USA 112: 1577–1582. ↵Rodriguez, M. R., K. Monte, L. B. Thackray, D. J. Lenschow. 2014. ISG15 functions as an interferon-mediated antiviral effector early in the murine norovirus life cycle. J. Virol. 88: 9277–9286. ↵Werneke, S. W., C. Schilte, A. Rohatgi, K. J. Monte, A. Michault, F. Arenzana-Seisdedos, D. L. Vanlandingham, S. Higgs, A. Fontanet, M. L. Albert, D. J. Lenschow. 2011. ISG15 is critical in the control of Chikungunya virus infection independent of UbE1L mediated conjugation. PLoS Pathog. 7: e1002322. ↵Meuwissen, M. E., R. Schot, S. Buta, G. Oudesluijs, S. Tinschert, S. D. Speer, Z. Li, L. van Unen, D. Heijsman, T. Goldmann, et al. 2016. Human USP18 deficiency underlies type 1 interferonopathy leading to severe pseudo-TORCH syndrome. J. Exp. Med. 213: 1163–1174. ↵Malakhova, O. A., K. I. Kim, J. K. Luo, W. Zou, K. G. Kumar, S. Y. Fuchs, K. Shuai, D. E. Zhang. 2006. UBP43 is a novel regulator of interferon signaling independent of its ISG15 isopeptidase activity. EMBO J. 25: 2358–2367. ↵Speer, S. D., Z. Li, S. Buta, B. Payelle-Brogard, L. Qian, F. Vigant, E. Rubino, T. J. Gardner, T. Wedeking, M. Hermann, et al. 2016. ISG15 deficiency and increased viral resistance in humans but not mice. Nat. Commun. 7: 11496.OpenUrlCrossRefPubMed ↵D’Cunha, J., S. Ramanujam, R. J. Wagner, P. L. Witt, E. Knight Jr.., E. C. Borden. 1996. In vitro and in vivo secretion of human ISG15, an IFN-induced immunomodulatory cytokine. J. Immunol. 157: 4100–4108.OpenUrlAbstract ↵Knight, E. Jr.., B. Cordova. 1991. IFN-induced 15-kDa protein is released from human lymphocytes and monocytes. J. Immunol. 146: 2280–2284.OpenUrlAbstract Padovan, E., L. Terracciano, U. Certa, B. Jacobs, A. Reschner, M. Bolli, G. C. Spagnoli, E. C. Borden, M. Heberer. 2002. Interferon stimulated gene 15 constitutively produced by melanoma cells induces e-cadherin expression on human dendritic cells. Cancer Res. 62: 3453–3458. ↵Taylor, J. L., J. D’Cunha, P. Tom, W. J. O’Brien, E. C. Borden. 1996. Production of ISG-15, an interferon-inducible protein, in human corneal cells. J. Interferon Cytokine Res. 16: 937–940.OpenUrlCrossRefPubMed ↵Recht, M., E. C. Borden, E. Knight Jr.. 1991. A human 15-kDa IFN-induced protein induces the secretion of IFN-gamma. J. Immunol. 147: 2617–2623. D’Cunha, J., E. Knight Jr.., A. L. Haas, R. L. Truitt, E. C. Borden. 1996. Immunoregulatory properties of ISG15, an interferon-induced cytokine. Proc. Natl. Acad. Sci. USA 93: 211–215. ↵Swaim, C. D., A. F. Scott, L. A. Canadeo, J. M. Huibregtse. 2017. Extracellular ISG15 signals cytokine secretion through the LFA-1 integrin receptor. Mol. Cell 68: 581–590.e5.OpenUrlCrossRefPubMed ↵Villarreal, D. O., M. C. Wise, R. J. Siefert, J. Yan, L. M. Wood, D. B. Weiner. 2015. Ubiquitin-like molecule ISG15 acts as an immune adjuvant to enhance antigen-specific CD8 T-cell tumor immunity. Mol. Ther. 23: 1653–1662.OpenUrlCrossRef ↵Napolitano, A., A. G. van der Veen, M. Bunyan, A. Borg, D. Frith, S. Howell, S. Kjaer, A. Beling, A. P. Snijders, K. P. Knobeloch, E. M. Frickel. 2018. Cysteine-reactive free ISG15 generates IL-1β-producing CD8α+ dendritic cells at the site of infection. J. Immunol. 201: 604–614. ↵Osiak, A., O. Utermöhlen, S. Niendorf, I. Horak, K. P. Knobeloch. 2005. ISG15, an interferon-stimulated ubiquitin-like protein, is not essential for STAT1 signaling and responses against vesicular stomatitis and lymphocytic choriomeningitis virus. Mol. Cell. Biol. 25: 6338–6345. ↵Oosterhuis, K., E. Aleyd, K. Vrijland, T. N. Schumacher, J. B. Haanen. 2012. Rational design of DNA vaccines for the induction of human papillomavirus type 16 E6- and E7-specific cytotoxic T-cell responses. Hum. Gene Ther. 23: 1301–1312.OpenUrlCrossRefPubMed ↵Ahrends, T., N. Bąbała, Y. Xiao, H. Yagita, H. van Eenennaam, J. Borst. 2016. CD27 agonism plus PD-1 blockade recapitulates CD4+ T-cell help in therapeutic anticancer vaccination. Cancer Res. 76: 2921–2931. ↵Kasai, M., M. Iwamori, Y. Nagai, K. Okumura, T. Tada. 1980. A glycolipid on the surface of mouse natural killer cells. Eur. J. Immunol. 10: 175–180.OpenUrlCrossRefPubMed ↵Love, M. I., W. Huber, S. Anders. 2014. Moderated estimation of fold change and dispersion for RNA-seq data with DESeq2. Genome Biol. 15: 550.OpenUrlCrossRefPubMed ↵Ahrends, T., A. Spanjaard, B. Pilzecker, N. Bąbała, A. Bovens, Y. Xiao, H. Jacobs, J. Borst. 2017. CD4+ T cell help confers a cytotoxic T cell effector program including coinhibitory receptor downregulation and increased tissue invasiveness. Immunity 47: 848–861.e5.OpenUrlCrossRef ↵Bąbała, N., A. Bovens, E. de Vries, V. Iglesias-Guimarais, T. Ahrends, M. F. Krummel, J. Borst, A. D. Bins. 2018. Subcellular localization of antigen in keratinocytes dictates delivery of CD4+ T-cell help for the CTL response upon therapeutic DNA vaccination into the skin. Cancer Immunol. Res. 6: 835–847. ↵Chen, Y. L., W. L. Wu, C. W. Jang, Y. C. Yen, S. H. Wang, F. Y. Tsai, Y. Y. Shen, Y. W. Chen. 2019. Interferon-stimulated gene 15 modulates cell migration by interacting with Rac1 and contributes to lymph node metastasis of oral squamous cell carcinoma cells. Oncogene 38: 4480–4495.OpenUrl ↵Owhashi, M., Y. Taoka, K. Ishii, S. Nakazawa, H. Uemura, H. Kambara. 2003. Identification of a ubiquitin family protein as a novel neutrophil chemotactic factor. Biochem. Biophys. Res. Commun. 309: 533–539.OpenUrlCrossRefPubMed ↵Ford, J. W., D. W. McVicar. 2009. TREM and TREM-like receptors in inflammation and disease. Curr. Opin. Immunol. 21: 38–46.OpenUrlCrossRefPubMed ↵DiStasi, M. R., K. Ley. 2009. Opening the flood-gates: how neutrophil-endothelial interactions regulate permeability. Trends Immunol. 30: 547–556.OpenUrlCrossRefPubMed ↵Monteleone, G., F. Pallone, T. T. Macdonald. 2009. Interleukin-21 (IL-21)-mediated pathways in T cell-mediated disease. Cytokine Growth Factor Rev. 20: 185–191.OpenUrlCrossRefPubMed ↵Sa, S. M., P. A. Valdez, J. Wu, K. Jung, F. Zhong, L. Hall, I. Kasman, J. Winer, Z. Modrusan, D. M. Danilenko, W. Ouyang. 2007. The effects of IL-20 subfamily cytokines on reconstituted human epidermis suggest potential roles in cutaneous innate defense and pathogenic adaptive immunity in psoriasis. J. Immunol. 178: 2229–2240. ↵Maeda, S., M. Fujimoto, T. Matsushita, Y. Hamaguchi, K. Takehara, M. Hasegawa. 2011. Inducible costimulator (ICOS) and ICOS ligand signaling has pivotal roles in skin wound healing via cytokine production. Am. J. Pathol. 179: 2360–2369.OpenUrlCrossRefPubMed ↵Yang, D., F. Wei, P. Tewary, O. M. Howard, J. J. Oppenheim. 2013. Alarmin-induced cell migration. Eur. J. Immunol. 43: 1412–1418.OpenUrlCrossRefPubMed ↵Dos Santos, P. F., J. Van Weyenbergh, M. Delgobo, D. Oliveira Patricio, B. J. Ferguson, R. Guabiraba, T. Dierckx, S. M. Menezes, A. Báfica, D. S. Mansur. 2018. ISG15-induced IL-10 is a novel anti-inflammatory myeloid axis disrupted during active tuberculosis. J. Immunol. 200: 1434–1442. ↵Melief, C. J., T. van Hall, R. Arens, F. Ossendorp, S. H. van der Burg. 2015. Therapeutic cancer vaccines. J. Clin. Invest. 125: 3401–3412.OpenUrlCrossRefPubMed ↵Borst, J., T. Ahrends, N. Bąbała, C. J. M. Melief, W. Kastenmüller. 2018. CD4+ T cell help in cancer immunology and immunotherapy. Nat. Rev. Immunol. 18: 635–647.OpenUrlCrossRef ↵Verstrepen, B. E., A. D. Bins, C. S. Rollier, P. Mooij, G. Koopman, N. C. Sheppard, Q. Sattentau, R. Wagner, H. Wolf, T. N. Schumacher, et al. 2008. Improved HIV-1 specific T-cell responses by short-interval DNA tattooing as compared to intramuscular immunization in non-human primates. Vaccine 26: 3346–3351.OpenUrlCrossRefPubMed ↵Pampena, M. B., E. M. Levy. 2015. Natural killer cells as helper cells in dendritic cell cancer vaccines. Front. Immunol. 6: 13.OpenUrlPubMed ↵Buentke, E., L. C. Heffler, J. L. Wilson, R. P. Wallin, C. Löfman, B. J. Chambers, H. G. Ljunggren, A. Scheynius. 2002. Natural killer and dendritic cell contact in lesional atopic dermatitis skin--Malassezia-influenced cell interaction. J. Invest. Dermatol. 119: 850–857.OpenUrlCrossRefPubMed ↵Ebert, L. M., S. Meuter, B. Moser. 2006. Homing and function of human skin gammadelta T cells and NK cells: relevance for tumor surveillance. J. Immunol. 176: 4331–4336. ↵Ferlazzo, G., B. Morandi. 2014. Cross-talks between natural killer cells and distinct subsets of dendritic cells. Front. Immunol. 5: 159.OpenUrlCrossRefPubMed ↵Fujii, S., K. Shimizu, C. Smith, L. Bonifaz, R. M. Steinman. 2003. Activation of natural killer T cells by alpha-galactosylceramide rapidly induces the full maturation of dendritic cells in vivo and thereby acts as an adjuvant for combined CD4 and CD8 T cell immunity to a coadministered protein. J. Exp. Med. 198: 267–279. ↵Adam, C., S. King, T. Allgeier, H. Braumüller, C. Lüking, J. Mysliwietz, A. Kriegeskorte, D. H. Busch, M. Röcken, R. Mocikat. 2005. DC-NK cell cross talk as a novel CD4+ T-cell-independent pathway for antitumor CTL induction. Blood 106: 338–344. ↵Daczkowski, C. M., J. V. Dzimianski, J. R. Clasman, O. Goodwin, A. D. Mesecar, S. D. Pegan. 2017. Structural insights into the interaction of coronavirus papain-like proteases and interferon-stimulated gene product 15 from different species. J. Mol. Biol. 429: 1661–1683.OpenUrlCrossRefPubMed
|
|
Scooped by
Gilbert C FAURE
April 18, 2020 10:29 AM
|
Single-cell RNA sequencing provides a comprehensive map of lymph-node–resident lymphatic endothelial cells, identifying new specific markers and functions of cell subpopulations, including the scavenging of low-density lipoprotein and mediation of rapid lymphocyte egress from lymph nodes.
|
|
Scooped by
Gilbert C FAURE
February 25, 2020 6:51 AM
|
The influx and efflux of cells and antigens to and from the draining lymph nodes largely take place through the subcapsular, cortical and medullary sinus systems. Recent analyses in mice and humans have revealed unexpected diversity in the lymphatic endothelial cells, which form the distinct regions of the sinuses. As a semipermeable barrier, the lymphatic endothelial cells regulate the sorting of lymph-borne antigens to the lymph node parenchyma and can themselves serve as antigen-presenting cells. The leukocytes entering the lymph node via the sinus system and the lymphocytes egressing from the parenchyma migrate through the lymphatic endothelial cell layer. The sinus lymphatic endothelial cells also orchestrate the organogenesis of lymph nodes, and they undergo bidirectional signalling with other sinus-resident cells, such as subcapsular sinus macrophages, to generate a unique lymphatic niche. In this Review, we consider the structural and functional basis of how the lymph node sinus system coordinates immune responses under physiological conditions, and in inflammation and cancer. Recent single-cell studies have revealed a previously unappreciated heterogeneity among endothelial cells that line the lymphatic sinuses of the lymph nodes. In this Review, the authors describe these various lymphatic endothelial cell types and how they support the trafficking of cells and antigens through lymph nodes.
|
|
Scooped by
Gilbert C FAURE
September 13, 2019 8:05 AM
|
|
|
Scooped by
Gilbert C FAURE
August 8, 2019 2:08 PM
|
T follicular helper (Tfh) cells are a specialized subset of CD4+ T cells that collaborate with B cells to promote and regulate humoral responses. Unlike other CD4+ effector lineages, Tfhs require interactions with both dendritic cells (DCs) and B cells to complete their differentiation. While numerous studies have assessed the potential of different DC subsets to support Tfh priming, the conclusions of these studies depend heavily on the model and method of immunization used. We propose that the location of different DCs subsets within the lymph node (LN) and their access to antigen determine their potency in Tfh priming. Finally, we provide a three-step model that accounts for the ability for multiple DCs subsets and related lineages to support the Tfh differentiation program.
|
|
Scooped by
Gilbert C FAURE
June 25, 2019 4:14 AM
|
Significance TLS, which are clusters of lymphocytes and stromal cells observed at sites of chronic inflammation, play a key role in sustaining disease progression in autoimmune conditions. While the role of lymphocytes in these structures has been studied extensively, the role of fibroblasts, nonhematopoietic stromal cells, in the formation and maintenance of TLS has not been demonstrated. Here, we establish that, at sites of TLS establishment, resident fibroblasts expand and acquire immunological features in a process that is dependent on IL13 and IL22. Interference with this process or depletion of immunofibroblasts leads to involution of TLS, resulting in decreased immune-cell activation and resolution of tissue pathology, thus supporting the use of fibroblast-targeting strategies to treat TLS-associated autoimmune diseases. Abstract Resident fibroblasts at sites of infection, chronic inflammation, or cancer undergo phenotypic and functional changes to support leukocyte migration and, in some cases, aggregation into tertiary lymphoid structures (TLS). The molecular programming that shapes these changes and the functional requirements of this population in TLS development are unclear. Here, we demonstrate that external triggers at mucosal sites are able to induce the progressive differentiation of a population of podoplanin (pdpn)-positive stromal cells into a network of immunofibroblasts that are able to support the earliest phases of TLS establishment. This program of events, that precedes lymphocyte infiltration in the tissue, is mediated by paracrine and autocrine signals mainly regulated by IL13. This initial fibroblast network is expanded and stabilized, once lymphocytes are recruited, by the local production of the cytokines IL22 and lymphotoxin. Interfering with this regulated program of events or depleting the immunofibroblasts in vivo results in abrogation of local pathology, demonstrating the functional role of immunofibroblasts in supporting TLS maintenance in the tissue and suggesting novel therapeutic targets in TLS-associated diseases. The establishment of TLS (tertiary lymphoid structures) is a phenomenon associated with cancer, infection, and autoimmunity (1). Within peripheral tissue, in autoimmune conditions such as primary Sjögren’s syndrome (pSS), TLS form pathogenic hubs of acquired immune responses that are classically associated with a Th2 paradigm, ectopic autoantibody production, and the potential expansion of malignant autoreactive B cell clones (1). While principally composed of lymphocytes and dendritic cells, TLS organization is supported by a complex network of nonhematopoietic stromal cells. These include endothelial cells, lymphatic vessels, nerves, and immunofibroblasts that closely resemble the fibroblastic reticular cells (FRCs) that inhabit secondary lymphoid organs (SLOs). These populations form a network that is believed to support the organization and maintenance of the immune cells in TLS and have been deemed responsible for local disease resistance to lymphocyte depletion (2, 3). Elegant in vivo and in silico studies have revealed the heterogeneity of the stromal cell populations in SLOs (4) and demonstrated that interfering with the podoplanin (pdpn)+/Fibroblast activation protein 1 (FAP)+ network of immunofibroblasts profoundly affects immune cell homeostasis (5⇓–7). Similar data are not available in chronic autoimmune conditions where targeting the pathogenic microenvironment could be envisaged, alongside immune-cell biological therapy, to induce disease remission. During embryogenesis, innate lymphoid cells (ILCs) provide molecular cues for the activation of the resident mesenchyme in ICAM-1high, VCAM-1high organizer cells (8⇓–10). Thereafter, lymphocyte migration in the anlagen is responsible for the full differentiation of FRCs within distinct areas of an SLO. Within TLS, the molecular requirement for immunofibroblast specification is still debated (2), and this hampers the development of therapeutics aimed at targeting this population in humans. We and others have previously demonstrated that specific cytokines might support the acquisition of pathogenic features of resident fibroblasts (11⇓⇓⇓–15). However, a broader understanding of the signals involved in TLS mesenchymal specification is still missing, and definitive proof that targeting activated fibroblasts might interfere with TLS-associated disease is not available. Here, we provide evidence that immunofibroblasts in human and murine TLS are required to support local pathology and support the production of antinuclear antibodies (ANAs). We show that human TLS are underpinned by the formation of a network of immunofibroblasts that express pdpn and FAP and respond in vitro to stimulation with Th2 cytokines and IL22. In vivo, we demonstrate the presence of resident immunofibroblast progenitors at the sites of TLS establishment, whose development is initiated by IL13. We prove that leukocytes are dispensable for this early phase of priming but are later required for the expansion of the fibroblast network, in a process mediated by the expression of IL22 and LTα1β2. Finally, we show that targeting this microenvironment in vivo, either by depleting immunofibroblasts or interfering with their cytokine-dependent developmental pathway, is sufficient to induce abrogation of local pathology and silence the humoral autoantibody response. As such, we provide evidence that targeting immunofibroblasts, alongside lymphocytes, could be considered to achieve long-term remission in chronic inflammatory diseases. Results IL13 and IL22 Modulate the Phenotype and Proliferation of the TLS Immunofibroblasts in Salivary Glands of Patients with pSS. The establishment of TLS in the salivary glands of patients with pSS is supported by a fibroblast network that express pdpn and FAP, identified both by immunofluorescence (Fig. 1A and SI Appendix, Fig. S1) and flow cytometry (Fig. 1B). The development of this network in human samples, that is similar to the FRC network observed in the SLOs (16), correlates with the severity of CD45+ immune cell infiltration (SI Appendix, Fig. S1). Single-cell PCR analysis of the pdpn+ fibroblasts unveiled 2 separate clusters (1, 2). Cluster 1 was characterized by enrichment for FAP, ICAM-1, VCAM-1, and CD34 transcripts (Fig. 1C). Given the overlap between CD34 and ICAM-1/VCAM-1 expression, CD34 was used as a surrogate marker to sort CD34+ and CD34-PDPN+ cells, the former being ICAMhigh/VCAMhigh (SI Appendix, Fig. S1). Interestingly, sorted pdpn+CD34+ cells display enrichment for transcripts encoding for IL7 and B cell activation factor (BAFF) while pdpn+CD34− cells showed enrichment for transcripts encoding for CXCL13, CCL19, and CCL21 (Fig. 1D). These data suggest that, within the pdpn+ population in humans, 2 subpopulations of stromal cells are present that respectively support lymphocyte survival and organization within the TLS. Both populations were found to express receptors for TNFα, LTα1β2, IL4, and IL13, and for IL22, a cytokine that we previously demonstrated to be responsible for chemokine expression in TLS (12) (Fig. 1D and SI Appendix, Fig. S1). Fig. 1. TLS human fibroblasts are characterized by expression of pdpn, FAP, and adhesion molecules. (A) Immunofluorescence analysis of salivary gland biopsy from pSS patient stained for pdpn (red), FAP (green), and DAPI (blue). (Scale bar: 250 µm.) (B) viSNE plots of CD45−CD235a−CD11b−EpCAM−CD31− cells from pSS patients’ salivary gland biopsy tissue, analyzed by multicolor flow cytometry. Colors indicate cell expression level of labeled markers (pdpn, FAP, ICAM-1, and VCAM-1). (C) Principle component analysis (PCA) plot from pdpn+ single-cell PCR data. Data are shown for FAP, ICAM-1, VCAM-1, and CD34 in the 2 clusters identified by hierarchical clustering analysis. (D) viSNE plots of CD45−CD235a−CD11b−EpCAM−CD31− cells from pSS patients’ salivary gland biopsy tissue, analyzed by multicolor flow cytometry. Colors indicate cell expression level of labeled markers (CD34). Graphs show differential gene expression data for baff, il7, pdgfrα, cxcl12, pdgfrß, cxcl13, ccl19, ccl21, il4rα, and il22rα transcripts in FACS-sorted CD34+ and CD34−pdpn+ populations. Data are expressed as mean ± SD (n = 5); *P < 0.05; **P < 0.01; paired t test. (E) Expression of vcam1, icam1, and pdpn mRNA transcript levels in pSS fibroblasts stimulated in vitro with IL13, TNF, and LTα1β2 (n = 5). Relative quantitation (RQ) was calculated with unstimulated cells. *P < 0.05; **P < 0.01; one-way ANOVA. Data are represented as mean ± SD. (F) Analysis of the percentage of pSS fibroblasts positive for BrdU flow cytometry staining post in vitro stimulation with IL22, TNF, and LTα1β2 (n = 5). *P < 0.05; one-way ANOVA. Data are represented as mean ± SD. IL13 expression has been previously associated with autoimmunity (17⇓⇓⇓⇓–22). Interestingly, the in vitro challenge of human isolated fibroblasts with IL13 significantly increased the expression of VCAM-1 and, to a lesser extent, pdpn and ICAM-1 in synergy with TNFα and LTα1β2 (Fig. 1E). On the contrary, stimulation of the same fibroblasts with IL22 demonstrated the functional ability of this cytokine to induce cell proliferation (Fig. 1F). However, IL22 did not induce VCAM-1, ICAM-1, and pdpn (SI Appendix, Fig. S1). While a certain degree of variability was observed in the fibroblasts’ response to cytokines in vitro, our results suggested the possibility that cytokines belonging to different families exert different and complementary effects on the resident mesenchyme and cooperate with the TNFα family members toward the acquisition of an immune-pathogenic phenotype during TLS assembly. Immunofibroblast Activation and Expansion Are Observed During TLS Formation in a Murine Model of Induced Salivary Gland Inflammation. We took advantage of a previously described model of TLS assembly, characterized by formation of TLS upon salivary gland infection of wild-type (wt) mice with AdV5 (108–12 plaque-forming unit) (23). We demonstrated that progressive lymphocyte aggregation in the salivary glands upon infection (SI Appendix, Fig. S2) is underpinned by the expansion of a network of (CD45−EPCAM−CD31−) pdpn+ fibroblasts which are similar to those observed in humans and precedes lymphocyte infiltration and reverts to baseline levels upon clearance of the TLS from the tissue (Fig. 2 A and B and SI Appendix, Fig. S2). This population is characterized by expression of additional stromal cell markers, such as pdgfrα and pdgfrß, FAP, ICAM-1, VCAM-1, MadCAM, and RANK-L (Fig. 2C and SI Appendix, Fig. S2). Pdpn+ fibroblasts were found to express CXCL13, CCL19, BAFF, IL7, and LTβR (Fig. 2D and SI Appendix, Fig. S2). Interestingly, subdividing the pdpn+ population into ICAM-1+/VCAM-1+ or ICAM-1+VCAM-1− and ICAM-1−/VCAM-1+ unveiled increased expression of lymphoid chemokines, but not survival factors in the ICAM-1+/VCAM-1+ (double positive) pdpn+ fibroblasts (Fig. 2E). Fig. 2. Salivary gland inflammation induces activation and expansion of pdpn+ fibroblasts in murine salivary glands. (A) Representative flow cytometry plot of pdpn+ cells within CD45−EpCAM− cells and time course analysis of percentage of pdpn+ fibroblasts in wt mice. Data are presented as mean ± SD of 3 independent experiments with at least four biological replicates. *P < 0.05; **P < 0.01; one-way ANOVA. (B) Immunofluorescence staining for EpCAM (gray), CD4 (red), and pdpn (green) in salivary glands at days 0 and 5 p.c. (Scale bars: 100 µm.) (C) Representative viSNE plots of CD45− EpCAM−CD31− cells from salivary glands at days 0 and 5 p.c., analyzed by multicolor flow cytometry. Colors indicate cell expression level of labeled markers (pdpn, FAP, PDGFRα, PDGFRβ, ICAM-1, and VCAM-1). (D) Gene expression analysis for cxcl13, baff, ccl19, and il7 transcripts on sorted populations (pdpn+ fibroblasts, pdpn− fibroblasts, and EpCAM+ cells). Relative quantitation (RQ) was calculated with calibrator day 0 (CD45−EpCAM−CD31−pdpn− cells). Data are expressed as mean ± SD (n = 6). *P < 0.05; **P < 0.01; ***P < 0.001; one-way ANOVA. (E) Gene expression analysis for cxcl13, ccl19, and baff transcripts on fibroblast subsets sorted on differential ICAM-1 and VCAM-1 expression. Relative quantitation (RQ) was calculated with calibrator as day 0 (CD45−EpCAM−CD31−ICAM-1−VCAM-1− cells). Data are expressed as mean ± SD (n = 6). *P < 0.05; ***P < 0.001; one-way ANOVA. All together, these data demonstrate that the expression of pdpn identifies within both human and murine TLS a heterogeneous population of immunofibroblasts that are able to support the key immunological functions of survival and migration/organization exerted in the SLOs by FRCs (SI Appendix, Fig. S2). As demonstrated in human TLS fibroblasts, pdpn+ fibroblasts are characterized by the expression of IL4R, IL13R, and, as previously described, of IL22R (12), alongside TNFR and LTβR (SI Appendix, Fig. S2) (12). IL4R Engagement Regulates Stromal Cell Priming in an Animal Model of TLS Assembly. To dissect in vivo the role of these receptors in TLS assembly, we induced salivary gland inflammation in mice deficient for IL4R, IL4, and IL13. We demonstrated that, in vivo, the deficiency of IL4R or IL13, but not of IL4, resulted in a failure to up-regulate pdpn+ and to prime resident progenitors (Fig. 3A and SI Appendix, Fig. S3). Interestingly, this defect was not accompanied by defective stromal cell proliferation (SI Appendix, Fig. S3). Instead, IL4R−/− mice displayed defective TLS assembly, including decreased production of homeostatic chemokines (Fig. 3B) and formation of smaller inflammatory foci in the salivary glands (Fig. 3C). While chemokine expression was compensated in the absence of IL4R signaling by day 15 postinfection, autoantibody production was, in the IL4R−/−, completely abolished (SI Appendix, Fig. S3). Fig. 3. The IL13 pathway is significantly involved in immunofibroblast activation. (A) Flow cytometry data of the percentage of pdpn+ stroma from wt (black squares, n = 3 to 6), IL4R−/− (open squares, n = 3 to 6), IL4−/− (open circles, n = 3 to 5) and IL13−/− (black triangle, n = 3 to 5) mice at days 0, 2, and 5 p.c. **P < 0.01; ***P < 0.001; one-way ANOVA. Data are represented as mean ± SD. (B) Immunofluorescence of lymphoid aggregates in salivary glands (day 15 p.c.) from wt and IL4R−/− mice (CD3, red; CD19, blue; CXCL13 or CCL21, green). (Scale bars: 100 µm.) (C) il13 and il4 transcripts time course analysis by qRT-PCR in wt mice. Data are represented as mean ± SD of 2 to 3 independent experiments with 2 to 3 mice per group. *P < 0.05; **P < 0.01; one-way ANOVA. (D) Immunofluorescence staining for IL13 (green) and CD45 (red) at 3 h and day 2 p.c. (Scale bars: 50 µm; Inset shows higher magnification, scale bars: 10 µm.) (E) Identification of IL13+ cells in the CD45+ compartment by flow cytometry at 3 h and days 2 and 5 p.c. (F) Analysis of IL13 transcript and protein expression by fibroblasts (n = 3) and epithelial cells (n = 3). *P < 0.05; **P < 0.01; ***P < 0.001; t test. Data are represented as mean ± SD. To understand the relevance of IL13 in wild type (wt) animals, we investigated the expression of this cytokine upon salivary glands following viral infection in C57/bl6 mice. A rapid induction of IL13, but not of IL4, was observed in these animals in the early phases of TLS formation (Fig. 3C). IL13+ cells were localized in the inner part of the developing TLS in C57/bl6 mice reconstituted with IL13gfp bone marrow (Fig. 3D). Innate lymphoid cells were identified as an early source of IL13 (Fig. 3E), alongside fibroblasts and epithelial cells (Fig. 3F and SI Appendix, Fig. S3). This was confirmed by mixed bone marrow chimera experiments that demonstrate the conserved ability of mice reconstituted with IL13gfp bone marrow (deficient for IL13 in the hematopoietic compartment) to prime resident fibroblasts (SI Appendix, Fig. S3). Together, these data confirm that priming of the resident progenitors occurs independently of lymphocyte infiltration in the TLS and that IL13, but not IL4, is responsible for the early engagement of the IL4R signaling on the immunofibroblast progenitors. To test this hypothesis, we delivered recombinant IL13 (rIL13) into murine salivary glands in vivo, and we found that IL13 alone was able to induce up-regulation of pdpn, ICAM-1, and VCAM-1 (SI Appendix, Fig. S3). Immunofibroblast Proliferation Is Dependent on IL22/IL22R Interaction. Observations in wt mice demonstrated that the pdpn+ fibroblasts undergo a phase of active proliferation after priming (SI Appendix, Fig. S4); however, this is not regulated by IL13 or IL4. We therefore aimed to investigate the molecular mechanism underpinning this phenomenon. We previously demonstrated that IL22 regulates CXCL13 expression in TLS (12). Moreover, human fibroblasts isolated from pSS salivary glands expand in vitro in response to IL22, suggesting the possibility that this cytokine also mediates fibroblast proliferation in vivo, during TLS assembly. Murine fibroblasts express IL22Rα, and this expression increases significantly in pdpn+ cells upon viral infection (Fig. 4 A and B). To test the proliferative ability of IL22, we administered recombinant murine (m) IL22 to unmanipulated salivary glands in vivo and also in vitro to isolated pdpn+ fibroblasts. We observed that IL22 was sufficient to induce proliferation of pdpn+ cells both when administered in vivo (Fig. 4C) and in vitro (Fig. 4D). Correspondingly, both IL22- and IL22R-deficient mice presented a numeric defect in pdpn+ stromal cells that was significant from day 5 postinfection (Fig. 4E). This defect was accompanied by a significant decrease in BrdU incorporation by the fibroblasts (Fig. 4F) and could be reproduced by administering therapeutic doses of the anti-IL22 antibody to virus-cannulated wt mice (Fig. 4G). Together, these data suggest that, during TLS assembly, while IL13 mediates the early acquisition of an “activated phenotype” of the resident progenitors, IL22 is responsible for the expansion of this immunofibroblast network. Fig. 4. Expansion of immunofibroblasts is dependent on the IL22/IL22Rα pathway. (A) Representative plot of IL22Rα expression by CD45−EpCAM−CD31− cells at days 0 and 5 p.c. (B) Fold change of IL22Rα expression by pdpn+ (n = 3) and pdpn− (n = 3) fibroblasts, analyzed by flow cytometry. *P < 0.05; paired t test. (C) Flow cytometry analysis of Ki67+pdpn+ fibroblasts in wt salivary glands cannulated with IL22 (black bars), BSA (white bars), or PBS (gray bars) and analyzed at day 2 p.c. Data are represented as mean ± SD of 3 independent experiments, 2 mice per group. **P < 0.01; ***P < 0.001; one-way ANOVA. (D) Percentage of BrdU incorporation in pdpn+ fibroblasts isolated from wt salivary glands at day 2 p.c. and then stimulated in vitro with IL22 (black bars); with IL22, TNFα, and LTβR agonist (dark gray bars); with TNFα and LTβR agonist (light gray bars); or with PBS (white bars). Data are represented as mean ± SD of 2 independent experiments, *P < 0.05; ***P < 0.001; one-way ANOVA. (E) Percentage of pdpn+ fibroblasts in IL22Rα−/− (open circles, n = 4 to 6), IL22−/− (gray triangles, n = 4 to 6), and wt mice (black squares, n = 3 to 6). *P < 0.05; **P < 0.01; one-way ANOVA. Data are represented as mean ± SD. (F) Analysis of BrdU incorporation by pdpn+ fibroblast from wt (black bars, n = 4 to 6) and IL22Rα−/− (white bars, n = 3 to 5) mice (days 2, 5, 8, 15, and 23 p.c.). *P < 0.05; **P < 0.01; ***P < 0.001; one-way ANOVA. Data are represented as mean ± SD. (G) Analysis of BrdU+ pdpn+ fibroblasts at days 5 and 8 p.c. with anti-IL22 (open bars), control Ig (gray bars), or untreated (black bars). Data are presented as the mean ± SD of 2 independent experiments, with 2 to 3 mice per group. **P < 0.01; one-way ANOVA. Priming and Expansion of pdpn+ Fibroblasts in TLS Are Independent of LTα1β2 and RORγ+ Cells. Full development of FRCs in SLOs is largely regulated by LTα1β2, provided during embryogenesis by RORγ+ lymphoid tissue inducer cells21. To investigate the effects that LTα1β2 and RORγ exert on the identified population of immunofibroblasts, we induced salivary gland inflammation in Ltßr−/− and Rorγ−/− mice. Both strains exhibited normal up-regulation of ICAM-1, VCAM-1, and pdpn and normal proliferation of the pdpn+ fibroblasts up to day 8 p.c. (Fig. 5A and SI Appendix, Fig. S5). Interestingly, by day 15 p.c., both strains exhibited a defect in the number and proliferation of pdpn+ fibroblasts, together with a reduction in the percentage of the ICAM-1/VCAM-1 intermediate and high cells (Fig. 5A and SI Appendix, Fig. S5). Fig. 5. LTα1β2 and RORγ+ cells regulate chemokine expression but not early fibroblast priming or expansion. (A) Time course flow cytometry analysis of the percentage of pdpn+ fibroblasts from wt (black squares, n = 3 to 5), Rorγ−/− (open squares, n = 3 to 5), and Ltßr−/− (gray squares, n = 3 to 5) mice. *P < 0.05; one-way ANOVA. Data are represented as mean ± SD. (B and C) Analysis of cxcl13 and ccl19 mRNA transcripts by qRT-PCR in wt (black bars, n = 7 to 12), Rorγ−/− (open bars, n = 4 to 5), and Ltßr−/− (gray bars, n = 4 to 7) mice at days 5, 8, 15, and 23 p.c. *P < 0.05; **P < 0.01; ***P < 0.001; one-way ANOVA. Data are represented as mean ± SD. (D and E) Immunofluorescence of salivary glands (day 15 p.c.) from wt, Ltßr−/−, and Rorγ−/− mice [CD3, red; CD19, blue; CXCL13 (D) or CCL21 (E), green]. (Scale bars: 100 µm.) (F) qRT-PCR analysis of cxcl13 and ccl19 mRNA from wt (black bars, n = 4 to 6) and Rag2−/− (white bars, n = 4 to 6) salivary glands at days 5, 8, 15, and 23 p.c. *P < 0.05; **P < 0.01; ***P < 0.001; one-way ANOVA. Data are represented as mean ± SD. (G) Time course flow cytometry analysis of the percentage of pdpn+ fibroblasts from wt (black squares, n = 4 to 6) and Rag2−/− (open squares, n = 4 to 6) mice. *P < 0.05; **P < 0.01; one-way ANOVA. Data are represented as mean ± SD. During TLS assembly, Ltßr−/− and Rorγ−/− mice failed to express normal levels of lymphoid chemokines and to form organized foci upon viral infection (Fig. 5 B–E). These data suggest that, while not required for priming and expansion of the fibroblastic network, Ltα1β2- and Rorγ-positive cells play a nonredundant role at the final differentiation and stabilization of the functional phenotype of the immunofibroblasts. Lymphocytes Are Dispensable for pdpn+ Fibroblast Priming but Required for Expansion and Conversion of the Stromal Network to a Fully Mature Immune Phenotype. The data generated suggested that different phases of fibroblast modifications during TLS assembly are regulated by diverse cytokines and depend on the interaction between fibroblasts and different cell types. To better understand this phenomenon, we induced TLS formation in lymphocyte-deficient mice. As expected, Rag2−/− mice infected with adenovirus failed to induce homeostatic chemokine expression and exhibited a phenotype similar to that of LtβR−/− mice (Fig. 5F). However, the analysis of the fibroblast compartment in Rag2−/− mice showed an early significant defect in the expansion of the pdpn+ fibroblasts, not observed in the absence of the LTβR signal. This defect was significant from day 5 post viral infection (Fig. 5G) and closely mimicked the phenotype observed in the IL22R−/− and IL22−/− mice (Fig. 4). Interestingly, the early fibroblast priming was maintained in Rag2−/− (Fig. 5G), confirming that IL13 expression and the engagement of IL4R in the salivary gland at this stage is not dependent on lymphocytes. Accordingly, PCR analysis for IL13 in the Rag2−/− demonstrated a conserved signal for this cytokine (SI Appendix, Fig. S5). Deletion of pdpn+/Fap+ Fibroblasts Abrogates TLS Establishment and Compromises Establishment of Local Pathology. To finally demonstrate whether the fibroblast network that we described is required for TLS assembly and maintenance in vivo, we utilized the Dm2 mouse to deplete pdpn-expressing cells. Dm2 mice have been previously used to delete pdpn+ FRCs in SLOs, taking advantage of the expression of FAP+ on pdpn+ FRCs and the engineered expression of the diphtheria receptor (DTR) under the FAP promoter (5, 24, 25). We firstly demonstrated that, similarly to SLOs, pdpn+ cells in the TLS forming in both wt mice and Dm2 salivary glands express FAP (Fig. 6 A and B) and that FAP expression is up-regulated upon inflammation in viral-infected salivary glands (Fig. 6 C and D). We then treated Dm2 mice with diptheria toxin as previously described (5, 24, 25) before the induction of TLS (Materials and Methods). By day 8 postinfection in Dm2+, but not in control treated mice, there was a significant loss of pdpn+ stromal cells in the salivary gland (Fig. 6E and SI Appendix, Fig. S6); this effect was associated with a reduced number of lymphocytes (Fig. 6F and SI Appendix, Fig. S5), less organized TLS (Fig. 6G and SI Appendix, Fig. S6), and low chemokine expression in infected glands (Fig. 6H). Local disaggregation of TLS resulted in abrogated autoantibody production (Fig. 6I). Given the potential interference of FAP systemic deletion on the immune response (5), we performed local deletion of FAP+ cells by delivering DTX directly in the salivary glands. Infected mice treated with local DTX also display loss of pdpn+ fibroblasts and a decrease in CD45+ cells, activated T cells, and B cells (SI Appendix, Fig. S6). Overall, local stromal cell depletion was less efficient than systemic and was reflected in the lack of impact on ANA production in treated mice. Fig. 6. Depletion of FAP+ fibroblasts impairs the formation of TLS. (A) Immunofluorescence staining of FAP (red) and DAPI (gray) in wt salivary glands at days 0 and 15 p.c. (Scale bars: 200 µm.) (B) Representative flow cytometry plot of FAP expression by pdpn+ fibroblasts. The gate shows percentage of FAP+ pdpn+ cells. (C) Time course analysis of the percentage of pdpn+ FAP+ fibroblasts in wt mice. Data are presented as mean ± SD. (D) Analysis of fap mRNA transcript by qRT-PCR in wt salivary glands at days 0, 2, 5, and 15 p.c. (n = 4 to 9). *P < 0.05; ***P < 0.001; one-way ANOVA. Data are represented as mean ± SD. (E) Flow cytometry data for absolute numbers of pdpn+ fibroblasts at day 8 p.c. in Lm DTX treated (black bars, n = 8) and Dm2 DTX treated (red bars, n = 6). ***P < 0.001; t test. Data are represented as mean ± SD. (F) Flow cytometry data for absolute numbers of T and B lymphocytes at days 8, 15, and 23 p.c. in Lm DTX treated (black squares) and Dm2 DTX treated (red bars). Data are represented as mean ± SD of 2 independent experiments with at least 3 mice for each experiment. **P < 0.01; one-way ANOVA. (G) Immunofluorescence staining of CD3 (red) and CD19 (blue) in Lm DTX treated and Dm2 DTX treated at day 8 p.c. (Scale bars: 100 μm.) (H) qRT-PCR analysis of cxcl13 and ccl19 mRNA from Lm DTX treated (black bars, n = 6) and Dm2 DTX treated (red bars, n = 4) salivary glands at day 8 p.c. Data are represented as mean ± SD. (I) Percentage of positive mice for ANA in lm DTX treated (black bar) and Dm2 DTX treated (red bar) experimental groups at day 23 p.c. Discussion TLS form in response to the immunological requirement to generate a local immune response against invading pathogens and local antigens (26). However, TLS persistence in autoimmune conditions correlates with worse outcome, including the development of MALT (mucosal-associated lymphoid tissue) lymphoma and increased systemic manifestations (1). Resistance to immune-cell depletion in subsets of patients with TLS-associated autoimmune conditions has been linked to the inability to interfere with local excess of survival factors and cytokines produced within the TLS. This suggests that the identification of the molecular mechanisms responsible for the establishment and maintenance of this local microenvironment could be exploited therapeutically (2). Here, we demonstrate that TLS assembly, both in humans and in an animal model of TLS, is underpinned by the formation of a network of pdpn+ immunofibroblasts, phenotypically and functionally similar to the FRC networks described within SLOs. Interestingly, murine and human fibroblasts display differential associations between expression of chemokines and survival factors and expression of ICAM-1, VCAM-1, and CD34. The developmental imprinting underpinning these differences is currently under investigation. The cellular requirements and microenvironmental signals responsible for the formation of this fibroblast network, both in humans and mice, appear to be conserved across species and unique to TLS and encompass the engagement of Th2 cytokines and IL22, in synergy with LTα1β2. The analysis of this cascade and the cellular interaction responsible for it demonstrates that lymphocytes are dispensable for the early priming of the immunofibroblast progenitors in TLS. Lymphocytes are, however, required for the expansion of the network and for its full conversion to an immune phenotype. Genome-wide association studies have previously identified MHC class II haplotypes and components of the IL4/IL13 receptor complex, including Tyk2, as independent risk factors in immune-mediated inflammatory diseases (27, 28). This risk was classically associated with the role of the IL4R pathway in CD4 T cell function. However, MHC class II, the IL4/IL13 receptor complex, and Tyk2 expression are expressed and functional in nonhematopoietic cells, including smooth muscle cells. Moreover, IL4R activation is known to regulate adult muscle regeneration (29). Previous reports have suggested the association between IL13 and the production of autoantibodies (17⇓⇓⇓⇓–22). Nevertheless, no functional proof of this relationship has been provided outside the role of this pathway in B and T cell regulation (30). Here, we demonstrate that the release of IL13 by resident ILCs and stromal cells, including fibroblasts and epithelium, directly regulates phenotypical changes but not proliferation of a population of pdpn+ immunofibroblast progenitors. This IL4R-mediated priming is required for the up-regulation of adhesion molecules, in particular VCAM-1, that enable the interaction of the fibroblasts with incoming leukocytes. IL13 production by resident stromal cells strongly assimilates this intrinsic and rapid response with the mechanisms of immunosurveillance ascribed to this cytokine in carcinogenesis (31). In this latter model, IL13 regulated the release of thymic stromal lymphopoietin and IL33, thereby accelerating epithelium repair (31). In our example, IL13 acts on a resident population of fibroblasts, modulating their ability to interact with incoming immune cells and form TLS. Together, these observations provide evidence in support of a critical role of IL13 in response to external danger signals in a series of pathogenic settings that extend from inflammation to autoimmunity and cancer. Intriguingly, IL4R engagement was not able to induce fibroblast proliferation. FRC expansion postimmunization has been described in SLOs and deemed dependent on LTα1β2 and IL4R (32⇓–34). Here, we demonstrate that, in TLS, expansion of pdpn+ fibroblasts also occurs, with active stromal cell proliferation peaking at day 5 postinfection. However, this phenomenon is largely independent of LTα1β2 and RORγt+ cells, but regulated by lymphocytes and IL22, a cytokine known to promote stromal cell repair and proliferation (35⇓⇓–38). The biological effect described here in murine and human fibroblasts, together with our previous report on the link between IL22 and CXCL13 expression in TLS, strongly advocates for an intervention against this cytokine in clinical practice. Interestingly, RORγt-dependent IL17 production appears not to play a major role in this system as a fairly conserved expansion of the immunofibroblasts occurs, along with TLS formation in RORγt−/− mice. Whether this is a feature specific of the TLS forming at mucosal sites is not clear as IL17 production has been deemed important for TLS establishment in other organs (13⇓–15). We previously demonstrated that interfering in vivo with IL22 expression by the use of a blocking antibody profoundly affects TLS maintenance in the tissue (12). Here, we expanded this observation and reported the formation of aberrant TLS with decreased immunofibroblast proliferation in mice treated with anti-IL22 antibodies, but also in mice deficient for IL4R and in a model of fibroblast depletion in vivo (Dm2). Previous work demonstrated that stromal cell depletion in SLOs of Dm2 mice only marginally affects lymphoid organ architecture (5). However, the impact on immune effector functions of Dm2 mice with diphtheria toxin demonstrates that systemic depletion of immunofibroblasts in TLS exerts a more profound effect, severely compromising aggregate assembly, inducing loss of anatomical organization, diminishing lymphocyte recruitment, and resolution of tissue pathology. Importantly, in this model and, similarly, in the absence of the IL4R or IL22R signaling, a reduction in the production of antinuclear antibodies was observed. These observations highlight the importance of a normal fibroblast network to support autoantibody production. Stromal cell depletion, induced by local DTX delivery, was less efficient in depleting immunofibroblasts. However, it still profoundly affected local pathology, but not systemic ANA production in viral infected animals. Several reports have highlighted the association between failure to respond to B cell-depleting therapies and the persistence of TLS in the tissue of patients with autoimmune conditions (39⇓⇓⇓⇓⇓⇓⇓–47). These observations establish a pathogenic role for TLS and their local microenvironment to sustain pathology. Here, we have demonstrated that the formation of a network of immune fibroblasts in TLS is responsible for the establishment of the TLS pathogenic microenvironment and that interfering with the signals responsible for its establishment profoundly affects local pathology and interferes with autoantibody production, providing a strong rationale for targeting immunofibroblasts in the treatment of TLS-associated diseases. Materials and Methods Study Design. Immunohistochemistry, immunofluorescence (IF), and flow cytometry were used to define the phenotype of immunofibroblasts in the salivary glands of patients with pSS. Tissue was obtained from patients recruited in the OASIS cohort (Optimising assessments in Sjögren’s syndrome) at University of Birmingham under ethics no. 10-018. IL13, IL4, and IL22 receptor expression was detected in both humans and mice, and differential biological effects were observed in fibroblasts stimulated with these molecules. To dissect these effects in vivo, we studied the dynamic response of a population of pdpn+ cells in a model of TLS assembly in wt mice and in mutants defective for IL13, IL4R, IL4, IL22, IL22R, LTβR, and Rorγ, as well as Rag2 mice. Mice were maintained in the Biomedical Service Unit at the University of Birmingham according to Home Office and local ethics committee regulations (University of Birmingham), under license no. P4B291FAA. IF, flow cytometry, and qRT PCR were used to assess differential effects in these mutants in the salivary glands of mice killed at different time points. Recombinant proteins for the molecules of interest and a blocking antibody against IL22 were used in gain- or loss-of-function experiments to dissect the requirements of these pathways in fibroblast maturation and TLS formation. Finally, to prove the effect that pdpn+ fibroblast deletion would exert on TLS, we used DM2 mice that express the diphtheria toxin receptor under the FAP promoter. Detailed materials and methods can be found in SI Appendix. Acknowledgments We thank Peter Lane, David Withers, Jorge Caamano, Andrew McKenzie, Adam Cunningham, Klaus Pfeffer, and Haley Daniels for providing animals; and Technology Hub (University of Birmingham) for flow cytometry, imaging, and PCR. We are indebted to the Biomedical Services Unit and Biological Services Facility for maintaining the colonies. F.B. was funded by the Wellcome Trust and is now an Arthritis Research UK (ARUK) Senior Fellow. This work was supported by ARUK Grant G0601156 (to C.D.B. and M.C.C.); National Centre for the Replacement, Refinement, and Reduction of Animals in Research, Grant NC/K000527/1 and Human Frontier Science Program Grant RGP0006/2009 (to M.C.C.); and grants from the Ligue Nationale Contre le Cancer (to K.T.). B.A.F. and S.J.B. have received support from the National Institute for Health Research (NIHR) Birmingham Biomedical Research Centre at the University Hospitals Birmingham NHS Foundation Trust and the University of Birmingham (Grant BRC-1215-20009). The views expressed are those of the authors and not necessarily those of the NIHR or the Department of Health and Social Care. Footnotes ↵1S.N. and J.C. contributed equally to this work. ↵2Present address: Kennedy Institute of Rheumatology, Nuffield Department of Orthopaedics, Rheumatology and Musculoskeletal Sciences, University of Oxford, Oxford, OX3 7FY, United Kingdom. ↵3To whom correspondence may be addressed. Email: f.barone{at}bham.ac.uk or mark.coles{at}kennedy.ox.ac.uk. Author contributions: S.N., K.T., S.A.L., B.A.F., C.D.B., M.C.C., and F.B. designed research; S.N., J.C., C.G.S., V.I., D.H.G., F.M., D.R., J.T., M.S., S.A., B.G., S.J.B., A.F., and K.T. performed research; D.T.F. contributed new reagents/analytic tools; S.N., J.C., and F.B. analyzed data; and S.N. and F.B. wrote the paper. The authors declare no conflict of interest. This article is a PNAS Direct Submission. This article contains supporting information online at www.pnas.org/lookup/suppl/doi:10.1073/pnas.1905301116/-/DCSupplemental. Copyright © 2019 the Author(s). Published by PNAS. This open access article is distributed under Creative Commons Attribution-NonCommercial-NoDerivatives License 4.0 (CC BY-NC-ND). References ↵ C. Pitzalis, G. W. Jones, M. Bombardieri, S. A. Jones, Ectopic lymphoid-like structures in infection, cancer and autoimmunity. Nat. Rev. Immunol. 14, 447–462 (2014).OpenUrlCrossRefPubMed ↵ F. Barone et al., Stromal fibroblasts in tertiary lymphoid structures: A novel target in chronic inflammation. Front. Immunol. 7, 477 (2016).OpenUrl ↵ C. D. Buckley, F. Barone, S. Nayar, C. Bénézech, J. Caamaño, Stromal cells in chronic inflammation and tertiary lymphoid organ formation. Annu. Rev. Immunol. 33, 715–745 (2015).OpenUrlCrossRefPubMed ↵ L. B. Rodda et al., Single-cell RNA sequencing of lymph node stromal cells reveals niche-associated heterogeneity. Immunity 48, 1014–1028.e6 (2018).OpenUrl ↵ A. E. Denton, E. W. Roberts, M. A. Linterman, D. T. Fearon, Fibroblastic reticular cells of the lymph node are required for retention of resting but not activated CD8+ T cells. Proc. Natl. Acad. Sci. U.S.A. 111, 12139–12144 (2014). ↵ M. Novkovic, L. Onder, G. Bocharov, B. Ludewig, Graph theory-based analysis of the lymph node fibroblastic reticular cell network. Methods Mol. Biol. 1591, 43–57 (2017).OpenUrl ↵ M. Novkovic et al., Topological small-world organization of the fibroblastic reticular cell network determines lymph node functionality. PLoS Biol. 14, e1002515 (2016).OpenUrlCrossRefPubMed ↵ C. Bénézech et al., Ontogeny of stromal organizer cells during lymph node development. J. Immunol. 184, 4521–4530 (2010). ↵ T. Cupedo, G. Kraal, R. E. Mebius, The role of CD45+CD4+CD3- cells in lymphoid organ development. Immunol. Rev. 189, 41–50 (2002).OpenUrlCrossRefPubMed ↵ G. Eberl, D. R. Littman, The role of the nuclear hormone receptor RORgammat in the development of lymph nodes and Peyer’s patches. Immunol. Rev. 195, 81–90 (2003).OpenUrlCrossRefPubMed ↵ L. Peduto et al., Inflammation recapitulates the ontogeny of lymphoid stromal cells. J. Immunol. 182, 5789–5799 (2009). ↵ F. Barone et al., IL-22 regulates lymphoid chemokine production and assembly of tertiary lymphoid organs. Proc. Natl. Acad. Sci. U.S.A. 112, 11024–11029 (2015). ↵ A. Peters et al., Th17 cells induce ectopic lymphoid follicles in central nervous system tissue inflammation. Immunity 35, 986–996 (2011).OpenUrlCrossRefPubMed ↵ N. B. Pikor et al., Integration of Th17- and lymphotoxin-derived signals initiates meningeal-resident stromal cell remodeling to propagate neuroinflammation. Immunity 43, 1160–1173 (2015).OpenUrlCrossRefPubMed ↵ J. Rangel-Moreno et al., The development of inducible bronchus-associated lymphoid tissue depends on IL-17. Nat. Immunol. 12, 639–646 (2011).OpenUrlCrossRefPubMed ↵ A. Link et al., Association of T-zone reticular networks and conduits with ectopic lymphoid tissues in mice and humans. Am. J. Pathol. 178, 1662–1675 (2011).OpenUrlCrossRefPubMed ↵ A. Spadaro, T. Rinaldi, V. Riccieri, E. Taccari, G. Valesini, Interleukin-13 in autoimmune rheumatic diseases: Relationship with the autoantibody profile. Clin. Exp. Rheumatol. 20, 213–216 (2002).OpenUrlPubMed ↵ J. Mahlios, Y. Zhuang, Contribution of IL-13 to early exocrinopathy in Id3-/- mice. Mol. Immunol. 49, 227–233 (2011).OpenUrlPubMed ↵ Z. Xu, Y. Chen, Determination of serum interleukin-13 and nerve growth factor in patients with systemic lupus erythematosus and clinical significance. J. Huazhong Univ. Sci. Technolog. Med. Sci. 25, 360–361 (2005).OpenUrlCrossRefPubMed ↵ G. M. Villarreal, J. Alcocer-Varela, L. Llorente, Differential interleukin (IL)-10 and IL-13 gene expression in vivo in salivary glands and peripheral blood mononuclear cells from patients with primary Sjögren’s syndrome. Immunol. Lett. 49, 105–109 (1996).OpenUrlCrossRefPubMed ↵ D. I. Mitsias et al., The Th1/Th2 cytokine balance changes with the progress of the immunopathological lesion of Sjogren’s syndrome. Clin. Exp. Immunol. 128, 562–568 (2002).OpenUrlCrossRefPubMed ↵ K. Raza et al., Early rheumatoid arthritis is characterized by a distinct and transient synovial fluid cytokine profile of T cell and stromal cell origin. Arthritis Res. Ther. 7, R784–R795 (2005).OpenUrlCrossRefPubMed ↵ M. Bombardieri et al., Inducible tertiary lymphoid structures, autoimmunity, and exocrine dysfunction in a novel model of salivary gland inflammation in C57BL/6 mice. J. Immunol. 189, 3767–3776 (2012). ↵ D. T. Fearon, The carcinoma-associated fibroblast expressing fibroblast activation protein and escape from immune surveillance. Cancer Immunol. Res. 2, 187–193 (2014). ↵ M. Kraman et al., Suppression of antitumor immunity by stromal cells expressing fibroblast activation protein-alpha. Science 330, 827–830 (2010). ↵ G. W. Jones, S. A. Jones, Ectopic lymphoid follicles: Inducible centres for generating antigen-specific immune responses within tissues. Immunology 147, 141–151 (2016).OpenUrlCrossRef ↵Wellcome Trust Case-Control Consortium (WTCCC) M. Ban et al.; Wellcome Trust Case-Control Consortium (WTCCC), Replication analysis identifies TYK2 as a multiple sclerosis susceptibility factor. Eur. J. Hum. Genet. 17, 1309–1313 (2009).OpenUrlCrossRefPubMed ↵ P. D. Burbelo, K. Ambatipudi, I. Alevizos, Genome-wide association studies in Sjögren’s syndrome: What do the genes tell us about disease pathogenesis? Autoimmun. Rev. 13, 756–761 (2014).OpenUrlCrossRefPubMed ↵ J. E. Heredia et al., Type 2 innate signals stimulate fibro/adipogenic progenitors to facilitate muscle regeneration. Cell 153, 376–388 (2013).OpenUrlCrossRefPubMed ↵ T. A. Wynn, IL-13 effector functions. Annu. Rev. Immunol. 21, 425–456 (2003).OpenUrlCrossRefPubMed ↵ T. Dalessandri, G. Crawford, M. Hayes, R. Castro Seoane, J. Strid, IL-13 from intraepithelial lymphocytes regulates tissue homeostasis and protects against carcinogenesis in the skin. Nat. Commun. 7, 12080 (2016).OpenUrl ↵ C. Y. Yang et al., Trapping of naive lymphocytes triggers rapid growth and remodeling of the fibroblast network in reactive murine lymph nodes. Proc. Natl. Acad. Sci. U.S.A. 111, E109–E118 (2014). ↵ L. K. Dubey et al., Lymphotoxin-dependent B cell-FRC crosstalk promotes de novo follicle formation and antibody production following intestinal helminth infection. Cell Rep. 15, 1527–1541 (2016).OpenUrl ↵ L. K. Dubey, P. Karempudi, S. A. Luther, B. Ludewig, N. L. Harris, Interactions between fibroblastic reticular cells and B cells promote mesenteric lymph node lymphangiogenesis. Nat. Commun. 8, 367 (2017).OpenUrlCrossRef ↵ S. Pantelyushin et al., Rorγt+ innate lymphocytes and γδ T cells initiate psoriasiform plaque formation in mice. J. Clin. Invest. 122, 2252–2256 (2012).OpenUrlCrossRefPubMed ↵ A. Andoh et al., Interleukin-22, a member of the IL-10 subfamily, induces inflammatory responses in colonic subepithelial myofibroblasts. Gastroenterology 129, 969–984 (2005).OpenUrlCrossRefPubMed ↵ M. Colonna, Interleukin-22-producing natural killer cells and lymphoid tissue inducer-like cells in mucosal immunity. Immunity 31, 15–23 (2009).OpenUrlCrossRefPubMed ↵ J. A. Dudakov, A. M. Hanash, M. R. van den Brink, Interleukin-22: Immunobiology and pathology. Annu. Rev. Immunol. 33, 747–785 (2015).OpenUrlCrossRefPubMed ↵ F. Barone, S. Colafrancesco, Sjögren’s syndrome: From pathogenesis to novel therapeutic targets. Clin. Exp. Rheumatol. 34 (suppl. 98), 58–62 (2016).OpenUrl ↵ F. Lavie et al., Increase of B cell-activating factor of the TNF family (BAFF) after rituximab treatment: Insights into a new regulating system of BAFF production. Ann. Rheum. Dis. 66, 700–703 (2007). ↵ S. De Vita et al., Sequential therapy with belimumab followed by rituximab in Sjögren’s syndrome associated with B-cell lymphoproliferation and overexpression of BAFF: Evidence for long-term efficacy. Clin. Exp. Rheumatol. 32, 490–494 (2014).OpenUrlPubMed ↵ L. Quartuccio et al., Controversies on rituximab therapy in sjögren syndrome-associated lymphoproliferation. Int. J. Rheumatol. 2009, 424935 (2009).OpenUrlPubMed ↵ L. Quartuccio et al., Resistance to rituximab therapy and local BAFF overexpression in Sjögren’s syndrome-related myoepithelial sialadenitis and low-grade parotid B-cell lymphoma. Open Rheumatol. J. 2, 38–43 (2008).OpenUrlCrossRefPubMed ↵ B. Marston, A. Palanichamy, J. H. Anolik, B cells in the pathogenesis and treatment of rheumatoid arthritis. Curr. Opin. Rheumatol. 22, 307–315 (2010).OpenUrlCrossRefPubMed ↵ S. Bugatti, B. Vitolo, R. Caporali, C. Montecucco, A. Manzo, B cells in rheumatoid arthritis: From pathogenic players to disease biomarkers. BioMed Res. Int. 2014, 681678 (2014).OpenUrl ↵ C. Gorman, M. Leandro, D. Isenberg, B cell depletion in autoimmune disease. Arthritis Res. Ther. 5 (suppl. 4), S17–S21 (2003).OpenUrlCrossRefPubMed ↵ G. Nocturne, X. Mariette, B cells in the pathogenesis of primary Sjögren syndrome. Nat. Rev. Rheumatol. 14, 133–145 (2018).OpenUrl

|
Suggested by
Société Francaise d'Immunologie
May 2, 2019 2:53 PM
|
Nanoscale and microscale materials can be used as drug delivery vehicles to target specific lymph node-resident cell subtypes for immunotherapy. In this Review, the authors discuss the transport mechanisms to and from lymph nodes and how they can be explored for drug delivery.

|
Suggested by
LIGHTING
April 9, 2019 2:13 PM
|
The lymphatics fulfil a vital physiological function as the conduits through which leucocytes traffic between the tissues and draining lymph nodes for the initiation and modulation of immune responses. However, until recently many of the molecular mechanisms controlling such migration have been unclear. As a result of careful research, it is now apparent that the process is regulated at multiple stages from initial leucocyte entry and intraluminal crawling in peripheral tissue lymphatics, through to leucocyte exit in draining lymph nodes where the migrating cells either participate in immune responses or return to the circulation via efferent lymph. Furthermore, it is increasingly evident that most if not all leucocyte populations migrate in lymph and that such migration is not only important for immune modulation, but also for the timely repair and resolution of tissue inflammation. In this article, we review the latest research findings in these areas, arising from new insights into the distinctive ultrastructure of lymphatic capillaries and lymph node sinuses. Accordingly, we highlight the emerging importance of the leucocyte glycocalyx and its novel interactions with the endothelial receptor LYVE-1, the intricacies of endothelial chemokine secretion and sequestration that direct leucocyte trafficking and the significance of the process for normal immune function and pathology.
|
|
|
Scooped by
Gilbert C FAURE
December 30, 2023 7:45 AM
|
Lymph nodes are secondary lymphoid organs in which immune responses of the adaptive immune system are initiated and regulated. Distributed throughout the body and embedded in the lymphatic system, local lymph nodes are continuously informed about the state of the organs owing to a constant drainage of lymph. The tissue-derived lymph carries products of cell metabolism, proteins, carbohydrates, lipids, pathogens and circulating immune cells. Notably, there is a growing body of evidence that individual lymph nodes differ from each other in their capacity to generate immune responses. Here, we review the structure and function of the lymphatic system and then focus on the factors that lead to functional heterogeneity among different lymph nodes. We will discuss how lymph node heterogeneity impacts on cellular and humoral immune responses and the implications for vaccination, tumour development and tumour control by immunotherapy. This Review from Wolfgang Kastenmüller and colleagues highlights the heterogeneity that exists among lymph nodes at different anatomical locations. The authors consider the factors that contribute to lymph node heterogeneity and explain the relevance of this for the immune response, particularly in the contexts of vaccination and cancer.
|
|
Scooped by
Gilbert C FAURE
February 18, 2023 2:32 AM
|
Non-hematopoietic lymphoid stromal cells (LSC) maintain lymph node architecture and form niches allowing the migration, activation, and survival of immune cells. Depending on their localization in the lymph node, these cells display heterogeneous properties and secrete various factors supporting the different activities of the adaptive immune response. LSCs participate in the transport of antigen from the afferent lymph as well as in its delivery into the T and B cell zones and organize cell migration via niche-specific chemokines. While marginal reticular cells (MRC) are equipped for initial B-cell priming and T zone reticular cells (TRC) provide the matrix for T cell-dendritic cell interactions within the paracortex, germinal centers (GC) only form when both T- and B cells successfully interact at the T-B border and migrate within the B-cell follicle containing the follicular dendritic cell (FDC) network. Unlike most other LSCs, FDCs are capable of presenting antigen via complement receptors to B cells, which then differentiate within this niche and in proximity to T follicular helper (TFH) cells into memory and plasma cells. LSCs are also implicated in maintenance of peripheral immune tolerance. In mice, TRCs induce the alternative induction of regulatory T cells instead of TFH cells by presenting tissue-restricted self-antigens to naïve CD4 T cells via MHC-II expression. This review explores potential implications of our current knowledge of LSC populations regardin
|
|
Scooped by
Gilbert C FAURE
October 29, 2022 9:46 AM
|
|
|
Scooped by
Gilbert C FAURE
June 5, 2020 1:27 PM
|
Research ArticleImmunologyOncology Free access | 10.1172/jci.insight.137263 CCL5 mediates CD40-driven CD4+ T cell tumor infiltration and immunity Austin P. Huffman,1 Jeffrey H. Lin,1 Samuel I. Kim,1 Katelyn T. Byrne,1,2 and Robert H. Vonderheide1,2,3 First published April 23, 2020 - More info Abstract The role CD4+ T cells play in tumor immunity is less well appreciated than the cytotoxic role of CD8+ T cells. Despite clear evidence for CD4+ T cell dependency across multiple immunotherapies, the mechanisms by which CD4+ T cells infiltrate tumors remain poorly understood. Prior studies by our group have shown in a mouse model of pancreatic cancer that systemic activation of the cell surface TNF superfamily member CD40 drives T cell infiltration into tumors and, in combination with immune checkpoint blockade, leads to durable tumor regressions and cures that depend on both CD8+ and CD4+ T cells. Here, we used single-cell transcriptomics to examine the tumor microenvironment following treatment with agonist CD40 antibody with or without immune checkpoint blockade. We show that intratumor myeloid cells produce the chemokine CCL5 in response to CD40 agonist and that CCL5 mediates an influx of CD4+ T cells into the tumor microenvironment. Disruption of CCL5 genetically or pharmacologically mitigates the influx of CD4+ but not CD8+ T cells into tumors and blunts the therapeutic efficacy of immunotherapy. These findings highlight a previously unappreciated role for CCL5 in selectively mediating CD4+ T cell tumor infiltration in response to effective immunotherapy. Introduction CD4+ T cells play a critical role in tumor immunity and response to immunotherapy, but their mechanisms of action remain incompletely understood (1–6). Canonical functions, such as T cell help provided to professional antigen-presenting cells (APCs) during priming and production of antitumor cytokines like IFN-γ, have been well described (7–9). A recent study demonstrated, however, that spontaneous and immunotherapy-mediated antitumor responses may require CD4+ T cells in addition to CD8+ T cells, even when tumors lack MHC class II (10). These findings recall early preclinical experiments with cytotoxic T lymphocyte–associated protein 4 (CTLA-4) monoclonal antibody (mAb), in which antitumor responses were dependent not only on CD8+ T cells but on CD4+ T cells as well (4). Since then, CD4+ T cell dependency has been observed in many other cancer immunotherapeutic approaches (1–6, 11–14). In the clinic, major tumor regressions have been observed following adoptive transfer of CD4+ (without CD8+) T cells in refractory solid tumors that are unlikely to express MHC class II on cancer cells (15, 16). Therefore, further mechanistic study of CD4+ T cells in the context of immunotherapy is warranted. The TNF superfamily member CD40 is expressed on the surface of APCs and confers cellular maturation upon ligation with CD40 ligand, which is classically expressed on activated CD4+ T cells (17). Our group has shown that systemically administered agonistic CD40 monoclonal antibody (mAb) induces intratumor T cell infiltration in a genetic mouse model of pancreatic adenocarcinoma and potentiates response to immune checkpoint blockade (18, 19). This concept has now been taken forward to a national randomized clinical trial, which is ongoing (ClinicalTrials.gov NCT03214250). Preclinically, tumor regressions with CD40 mAb require both CD8+ and CD4+ T cells. Mice depleted of CD4+ T cells fail to reject implanted pancreatic cancer cell lines despite treatment with CD40 mAb combined with chemotherapy, radiotherapy, or immune checkpoint blockade (18, 20–22). Furthermore, CD4+ but not CD8+ T cells are required for memory protection against rechallenge in mice cured of these tumors, despite the fact that these tumors do not express MHC class II (18). This antitumor response appears to be driven by a strong upregulation of cytokine production by intratumor CD4+ T cells in response to the combination of CD40 agonist and immune checkpoint blockade (18). Therefore, CD40 agonist–induced tumor immunity is a desirable system in which to study CD4+ tumor immunity. To advance this novel approach to immunotherapy (23) — with emerging promising results (24–28) — understanding cellular and molecular effects is increasingly important. It seems clear that chemotaxis of CD4+ T cells into the tumor microenvironment is required for response to immunotherapy, including CD40 agonists, given that therapeutic response is lost upon systemic administration of the sphingosine-1-phosphate receptor antagonist, which blocks lymph node egress (2). Several studies have been performed in recent years on mechanisms of CD8+ T cell tumor infiltration, in particular implicating the CXCL9/CXCL10/CXCR3 axis, but the extent to which these mechanisms do or do not apply to CD4+ T cell tumor infiltration remain unexplored (12–14, 29, 30). Here, we used single-cell sequencing to examine heterogeneous populations in our CD40 model in a highly dimensional and unbiased manner (31, 32). We discover a broad and consistent upregulation of the chemokine CCL5 by intratumor myeloid populations in response to CD40 activation. Blocking the CCL5/CCR5 pathway pharmacologically or genetically decreases tumor CD4+ T cell infiltration in response to CD40 agonist immunotherapy, hinders immune control of tumor outgrowth, and shortens survival. Our findings suggest a novel critical role for CCL5 in CD4+ T cell tumor chemotaxis and response to immunotherapy. Results Single-cell RNA-sequencing identifies intratumor immune populations. To investigate the differences in the tumor microenvironment after CD40 agonist treatment, we subcutaneously transplanted C57BL/6J mice with a clonal murine pancreatic ductal adenocarcinoma (PDAC) cell line (4226.MD10). After 14 days of tumor growth, tumor-bearing mice were randomized into groups of equal baseline tumor size and were treated with an agonist CD40 mAb, immune checkpoint blockade (ICB) with CTLA-4 and programmed cell death 1 (PD-1) mAb, both CD40 and ICB (hereafter CD40/ICB), or control mAbs (Figure 1A). Tumor growth curves comparing CD40/ICB-treated mice with untreated mice statistically diverged 12 days after the start of treatment (Figure 1B). Day 12 was therefore chosen as the optimal time point at which to query changes in the immune compartment of the tumor following therapy. Figure 1 Single-cell RNA-sequencing identifies intratumor immune populations. (A) Treatment of mice subcutaneously implanted with clonal KPC cell line 4662.MD10 with combination CD40 agonist and anti–CTLA-4 with anti–PD-1 (ICB). CD45+ cells were sorted for single-cell transcriptomic analysis using the 10x Genomics platform 12 days after beginning therapy. (B) Tumor growth kinetics of subcutaneously implanted mice treated as shown in A. (C) UMAP nondimensional linear reduction and clustering of immune cell populations from the tumor microenvironment merged across all treatment conditions. (D) Scaled expression of cluster-specific genes visualized by heatmap. The mean expression of each gene across all clusters was scaled to 0 with a variance of 1. n = 4 mice per treatment group (A, C, and D). n = 10 mice per group (B). Error bars indicate mean ± SEM. *P < 0.05 (Student’s 2-tailed t test). Data shown in B are representative of 2 independent experiments with 5 to 10 mice per group. gMDSC, granulocytic myeloid-derived suppressor cell; mMDSC, monocytic myeloid-derived suppressor cell. Tumors were harvested and disaggregated on day 12 after treatment induction. Live CD45+ cells were sorted from each tumor for single-cell RNA-sequencing using the 10x Genomics pipeline. The 10x Genomics platform yielded data for approximately 5000 cells per treatment condition with an average of approximately 50,000 reads per cell (Supplemental Figure 1A; supplemental material available online with this article; https://doi.org/10.1172/jci.insight.137263DS1). In total across all 4 treatment conditions, 28,348 cells were sequenced. FASTQ files were aligned and preprocessed using 10x Genomics’ Cell Ranger software and the Seurat3 R package (Supplemental Figure 1B). To define immune populations within the tumor microenvironment, a normalized subset of approximately 2000 cells was computationally pooled from each treatment group. Graph-based clustering was then used to identify transcriptional clusters consisting of individual cell types (Figure 1C). The top conserved genes across all treatment groups were identified within each cluster (Figure 1D). Identification of canonical marker genes and comparison with the Immunological Genome Project (ImmGen) database yielded 11 distinct clusters of immune cell types. Uniform manifold approximation and projection (UMAP) nonlinear dimensional reduction revealed 3 larger metaclusters containing cells associated with distinct immune characteristics: a T cell metacluster containing CD4+ and CD8+ T cells, a “protumor myeloid” metacluster containing immune-suppressive lineages including myeloid-derived suppressor cells and granulocytes, and an “antitumor myeloid” metacluster containing monocytes, macrophages, and dendritic cells. We next sought to determine whether differentiation of intratumor myeloid cells was affected upon treatment. To address this, single-cell myeloid clusters were subjected to a pseudotemporal analysis using the Monocle2 package in R (Supplemental Figure 2A). Monocle2 is an algorithm that aligns single cells based on gene expression along a trajectory that mirrors biological processes, such as differentiation. Cell populations from all 4 treatment conditions aligned as expected along the pseudotime trajectory. Immature myeloid-derived suppressor cells aligned earlier in pseudotime, while more terminally differentiated macrophage populations aligned later (Supplemental Figure 2B). Examination of myeloid clusters within each treatment group did not reveal any differences in their distribution along the pseudotime trajectory (Supplemental Figure 2C). Treatment with ICB, CD40 agonist, or both therefore does not appear to alter the differentiation state of myeloid cells within the tumor microenvironment. Intratumor myeloid populations upregulate CCL5 in response to CD40 activation. We next sought to query transcriptional changes within each cluster as a function of treatment. Differential gene expression analysis was used to compare gene expression in cell clusters isolated from CD40/ICB-treated versus untreated tumors, beginning with the numerically predominant macrophages. After filtering for genes that achieved an adjusted P value less than 0.05, we ranked genes based on absolute value of fold change in expression. The top 40 differentially expressed genes by adjusted P value in macrophages from CD40/ICB-treated tumors compared with untreated tumors can be found in Supplemental Table 1. This list of genes was then intersected with genes known to be associated with T cell trafficking. The most upregulated of these genes was Ccl5 (Figure 2A). Differential gene expression analysis of macrophages from CD40 agonist–treated versus untreated tumors also yielded Ccl5. Notably, macrophages from tumors treated with ICB alone did not upregulate Ccl5. The chemokine CCL5, also known as RANTES, is a T cell chemoattractant that has been best described for its critical roles in immune control of viral infections (33). The role of CCL5 in cancer remains incompletely examined, as it has been associated with both antitumor and protumor functions, including T regulatory cell attraction, progression and metastasis, tumor-associated macrophage function, and the indirect modulation of both CD8+ chemoattraction and repulsion (30, 34–38). Figure 2 Antitumor myeloid populations upregulate Ccl5 transcripts after CD40 activation. Differential gene expression analysis was performed on immune cell clusters from the tumor microenvironment as resolved by UMAP nonlinear dimensional reduction shown in Figure 1. (A) Volcano plot of differentially expressed genes in macrophages as a function of treatment. (B) Expression of Ccl5 overlaid onto UMAP clusters. Color intensity scale represents average number of Ccl5 transcripts per Ccl5+ cell. (C) Proportion of cells positive for reads of Ccl5 gene transcript in immune clusters from untreated versus combination-treated (CD40/ICB) tumors. Size of circle indicates proportion of cells within a cluster positive for Ccl5 transcript. Color intensity scale represents average number of Ccl5 transcripts per Ccl5+ cell. To examine whether other cell clusters upregulated Ccl5 in response to CD40 agonist treatment, a heatmap of Ccl5 expression was overlaid onto the UMAP visualization of our graph-based clustering (Figure 2B). The macrophage, proliferating macrophage, monocyte, and type 2 conventional DC clusters all increased Ccl5 expression following CD40/ICB treatment — on the basis of both the proportion within each cluster expressing Ccl5 as well as the average expression of Ccl5 per cell (Figure 2C). In contrast, Ccl5 expression remained insignificant within the granulocyte, monocytic myeloid-derived suppressor cell, granulocytic myeloid-derived suppressor cell, and nonconventional monocyte populations, as none of these clusters expressed Ccl5 in more than 6% of their cells even following CD40 agonism. The proportion of cells within the CD8+ T cell and type 1 conventional DC clusters that expressed Ccl5 remained unchanged from baseline, though the average expression of Ccl5 per cell increased among CD8+ T cells (Figure 2C). To examine CCL5 induction at the protein level, 4662.MD10 tumor cells were subcutaneously implanted into C57BL/6J mice. Mice were then treated with CD40/ICB and sacrificed on day 12 after treatment induction. Tumors were harvested for flow cytometric analyses, and cell subsets were gated according to the schema outlined in Supplemental Figure 4A. Consistent with our single-cell transcriptomic analysis, macrophages increased expression of CCL5 in response to treatment (Figure 3, A and B). Monocytes also increased expression of CCL5 in response to treatment (Figure 3, A and B). MDSCs did not express CCL5 in either the untreated or treated settings, nor did the CD45– compartment, composed of tumor cells, stroma, and fibroblasts (Figure 3, A and B). In the T cell compartment at baseline, relatively high CCL5 expression was observed in CD8+ T cells, and relatively low CCL5 expression was observed in CD4+ T cells, both FoxP3+ and FoxP3– subpopulations (Figure 3, C and D). Consistent with single-cell transcriptomic analysis, the proportion of all T cell subsets expressing CCL5 did not change as a result of treatment (Figure 3, C and D). The magnitude of CCL5 expression also remained unchanged in T cells from CD40/ICB-treated tumors. Figure 3 CCL5 is upregulated by antitumor myeloid populations following CD40/ICB therapy. Female C57BL/6J mice were subcutaneously transplanted with 3 × 10⁵ 4662.MD10 cells and treated with CD40/ICB as shown in Figure 1A. Flow cytometric analysis of tumors was then performed on day 12 following initiation of therapy. Gating scheme for flow cytometric analysis is shown in Supplemental Figure 4A. (A and B) Expression of CCL5 in intratumor macrophages, monocytes, myeloid-derived suppressor cells (MDSCs), and the CD45(–) compartment from untreated versus CD40/ICB-treated mice. (C and D) Expression of CCL5 in intratumor CD8+ T cells, CD4+ T cells, and FoxP3+ T regulatory cells from untreated versus CD40/ICB-treated mice. (E) Proportion of CCL5-expressing macrophages. Splenic macrophages were isolated and cultured for 24 hours either unstimulated or stimulated with cross-linked anti-CD40 mAb. n = 3 mice per group. *P ≤ 0.05, and **P ≤ 0.01 (1-tailed Student’s t test). Data shown are representative of 3 independent experiments with 3 to 5 mice per group (A–D). n = 5 mice per group. *P ≤ 0.05 (paired, 1-tailed Student’s t test). Data shown are representative of 3 independent experiments with 3 to 5 biological replicates (E). To determine whether CD40 agonism can directly induce CCL5 expression, F4/80+ splenic macrophages were isolated from C57BL/6J mice and cultured for 24 hours with cross-linked CD40 agonist mAb. Macrophages cultured with CD40 agonist significantly upregulated CCL5 compared with unstimulated controls as quantified by flow cytometry (Figure 3E). Having supported our findings at the protein level, we next set out to interrogate the functional relevance of CCL5 in the context of CD40/ICB immunotherapy. CCL5 mediates treatment efficacy. To determine whether CCL5 is required for response to CD40 agonism, we implanted syngeneic CCL5–genetic knockout mice (B6.129P2-Ccl5tm1Hso/J) with 4662.MD10 and compared tumor growth kinetics and survival with those of C57BL/6J WT controls. A subset then received CD40/ICB while another subset was left untreated, as described in Supplemental Figure 5A. Additionally, we observed that the 4662.MD10 tumor cell line expresses MHC class I but not MHC class II following IFN-γ treatment in vitro (Supplemental Figure 4B). Tumors in WT mice responded as expected to treatment with CD40/ICB, both in terms of tumor growth retardation (Figure 4A) and rate of tumor regressions (Figure 4B). In CCL5-KO mice, however, while the treatment effect of CD40/ICB-treated mice remained directionally true, the effect was no longer observed at the statistically significant level relative to untreated CCL5-KO controls (Figure 4, A and B). Over the time course of the entire experiment (75 days), CD40/ICB-treated CCL5-KO mice bearing tumors exhibited statistically worse long-term survival than tumor-bearing WT controls (Figure 4C), consistent with a potential role of CCL5 in mediating response to CD40/ICB immunotherapy. Figure 4 CCL5 is required for treatment efficacy. (A) Three hundred thousand 4662.MD10 cells were subcutaneously implanted into C57BL/6J or B6.129P2-Ccl5tm1Hso/J (CCL5-KO) mice. Mice were treated with CD40/ICB as shown in Supplemental Figure 5A. Tumor growth kinetics shown over the course of treatment. (B) Change in tumor volume of mice from A on day 24 (or most recent available) compared with day 0. (C) Survival of mice of mice from A from each treatment group. (D) Three hundred thousand 4662.MD10 cells were subcutaneously implanted into C57BL/6J mice that were then treated with CD40/ICB and/or CCL5-blocking antibody as shown in Supplemental Figure 5B. Tumor growth kinetics shown over the course of treatment. (E) Change in tumor volume of mice from D on day 16 (or most recent available) compared with day 0. (F) Survival of mice from D from each treatment group. (A–B): n = 10 mice per group. (C): combined results of 2 identical experiments with n = 10 mice per group. (D–F): n = 10 mice per group. ****P ≤ 0.0001, ***P ≤ 0.001, **P ≤ 0.01, and *P ≤ 0.05 (1-way ANOVA with Tukey’s honestly significant difference posttest in A and D; log-rank test in C and F). Data shown are representative of 2 independent experiments with 10–20 mice per group. T cells from CCL5-KO mice are known to have baseline defects with potential but unknown compensation during development (39). To rule out this potential confounder, we used a pharmacological inhibitor of CCL5 given just before therapy in WT mice to extend our observations. C57BL/6J mice were subcutaneously injected with 4662.MD10 and were treated with CD40/ICB, anti-CCL5, both, or neither, according to the schema in Supplemental Figure 5B. CCL5 blockade alone did not affect tumor growth, or affect the rate of tumor progression, compared to control antibody (Figure 4, D and E). Although CD40/ICB showed major tumor growth delay and high rate of tumor regressions, these effects were abrogated with the addition of anti-CCL5 to CD40/ICB treatment. Additionally, tumor-bearing mice treated with anti-CCL5 and CD40/ICB had significantly worse long-term survival compared with those treated with CD40/ICB alone (Figure 4F). We next sought to determine which immune cell types mediated this treatment dependency on CCL5. We used flow cytometry to compare the T cell content of untreated tumors in WT and CCL5-KO mice 16 days after subcutaneous implantation with 4662.MD10. CCL5-KO mice had statistically significantly lower proportions of FoxP3+CD4+ T cells among all CD45+ cells in the tumor compared with WT, although no differences were otherwise found in total T cell, FoxP3–CD4+ T cell, or CD8+ T cell quantity (Figure 5A). We next examined the effect of CCL5 blockade on the tumor microenvironment of tumor-bearing WT mice, with or without CD40/ICB. In contrast to CCL5-KO mice, WT tumor-bearing mice treated with anti-CCL5 did not have altered T cell content compared with untreated mice at day 12 posttreatment (Figure 5B). Treatment with CD40/ICB, as expected, increased the percentage of total T cells, CD4+ T cells, and CD8+ T cells (20). The addition of anti-CCL5 to CD40/ICB at the same time point, however, decreased total T cell infiltration and abrogated the FoxP3–CD4+ T cell influx in response to therapy. Notably, CCL5 blockade did not affect the proportion of FoxP3+CD4+ T cells or CD8+ T cells. These T cell infiltration dynamics were also observed at the level of cells per unit volume of tumor, indicating that CCL5 modulates absolute infiltration and is not simply repolarizing the immune infiltrate (Supplemental Figure 6). FoxP3–CD4+ and CD8+ T cells in the tumor microenvironment were further examined for expression of T cell activation markers. None of these markers changed in CD8+ T cells in any treatment or control condition (Figure 5C). In contrast, a number of changes were observed in CD4+ T cells in both the untreated and CD40/ICB-treated settings. Anti-CCL5 treatment alone increased the percentage of CD4+ T cells expressing CD39, lymphocyte activating 3 (LAG-3), and PD-1, and CD40/ICB decreased the percentage of cells expressing LAG-3 and markedly increased PD-1+ cells compared with untreated controls (Figure 5D). The addition of anti-CCL5 to CD40/ICB also increased the percentage of CD4+ T cells expressing CD39, restored the percentage of cells expressing LAG-3, and did not affect PD-1, compared with CD40/ICB treatment without anti-CCL5. Figure 5 CCL5 is required for CD4+ T cell infiltration following CD40/ICB. (A) Enumeration of T cell populations by flow cytometry in tumors of untreated CCL5-KO and WT control mice on day 16 postimplantation. (B) Enumeration of T cell populations in tumors of mice treated with combination CD40/ICB with or without anti-CCL5 day 12 postimplantation, as outlined in Supplemental Figure 5B. (C) Expression of T cell activation markers on CD4+ T cells from B. (D) Expression of T cell activation markers on CD8+ T cells from B. (E) Expression of CCR5 on CD8+ T cells, CD4+ T cells, and FoxP3+ T regulatory cells from B. (F) Enumeration of adoptively transferred WT or CCR5-KO CD4+ T cells identified by flow cytometry in tumors of mice treated with combination CD40/ICB relative to untreated mice. (A): n = 6 C57BL/6J and n = 8 CCL5-KO mice. (B–E): n = 3–5 C57BL/6J mice each group. ****P ≤ 0.0001, ***P ≤ 0.001, **P ≤ 0.01, and *P ≤ 0.05 (2-tailed Student’s t test in A–E; 2-tailed paired Student’s t test in F). Data shown are representative of 2 independent experiments with at least 5 mice per group. The best-characterized receptor for CCL5 is CCR5 (40). CCR5 expression on intratumor T cells was confirmed by flow cytometry but did not change as a function of either CD40/ICB treatment or CCL5 blockade (Figure 5E). To determine whether CD4+ T cell trafficking to the tumor after CD40/ICB was mediated by CCR5, an equal mixture of CCR5-KO and WT CD4+ T cells was adoptively transferred into tumor-bearing mice 13 days after tumor implantation. Mice were then treated with CD40/ICB according to the schema in Supplemental Figure 5B and sacrificed 7 days later to compare the ability of CCR5-KO T cells (as distinguished by an allelic marker) to traffic to the tumor relative to WT control T cells. Tumors of untreated mice contained equal proportions of CCR5-KO and WT CD4+ T cells, but tumors from CD40/ICB-treated mice contained more than twice as many WT CD4+ T cells on average than CCR5-KO cells (Figure 5F). Thus, CCR5 is at least partially responsible for CD4+ T cell tumor infiltration in response to CD40/ICB immunotherapy. Discussion CD4+ T cells are critical mediators of tumor immunity, but mechanisms of intratumor CD4+ T cell chemotaxis remain incompletely understood. Our group has previously demonstrated that CD40 agonism drives CD4+ T cell tumor influx and synergizes with ICB in a CD4+ and CD8+ T cell–dependent manner. Here, we report that the chemokine CCL5 is broadly induced in myeloid populations after treatment with agonist CD40 mAb. Using a suite of genetic and pharmacological experiments in vivo, we show that CCL5 mediates CD4+ T cell tumor influx via CCR5 following CD40 therapy. The effect of CCL5 is selective for CD4+ T cells, not CD8+ T cells. Therapeutic benefit is substantially diminished in the absence of CCL5. Overall, our results demonstrate a previously unappreciated role for CCL5 that underlies the therapeutic adaptive immune response to CD40 agonist. Given the diverse nature of CD40 expression, it has long been appreciated that the activity of CD40 agonist is likely pleiotropic. CD40 agonism has been shown to have antitumor effects on a number of CD40-expressing myeloid cell types. Macrophages have been shown to remodel tumor stroma after CD40 agonist treatment (24). Monocytes have been shown to degrade fibrosis and enhance the effects of chemotherapy upon CD40 activation (41). We have also observed that the antitumor efficacy of CD40 agonist requires conventional type 1 DCs, the subset of DCs uniquely capable of antigen cross-presentation (18, 20, 42). However, because of past technological limitations, it has been difficult to query all CD40-expressing cell types simultaneously following treatment. The recent emergence of single-cell RNA-sequencing allows us to examine these pleiotropic effects in a highly dimensional and unbiased manner for the first time. Our single-cell transcriptomic analysis reveals an upregulation of the chemokine Ccl5 across a broad range of myeloid cells following CD40 agonism. This is shown to critically and selectively mediate CD4+ T cell chemotaxis and immune control of tumor outgrowth following therapy. Thus, we demonstrate that the antitumor effects of CD40 agonism are largely dependent on the upregulation of a single chemokine. The current understanding of CCL5 in cancer posits that the chemokine is generally a negative prognostic marker and attracts FoxP3+ T regulatory cells and tumor-associated macrophages to the tumor (34, 37, 43, 44). Consistent with these prior studies, we observed fewer T regulatory cells in the tumors of CCL5-KO mice. When CD40 agonist was administered, however, the primary effect of CCL5 in our system was the promotion of CD4+ (FoxP3–) T cell infiltration into the tumor. CCL5 blockade also increased the expression of CD39, LAG-3, and PD-1 in intratumor CD4+ T cells with no effect on CD8+ T cells, suggesting a role for CCL5 in maintaining CD4+ T cell activation in the tumor microenvironment. Thus, we show a strikingly different role of CCL5 in tumor immune biology following CD40 agonism. Rather than attracting protumor T regulatory cells at baseline, CCL5 plays a critical antitumor role in FoxP3–CD4+ T cell chemotaxis following CD40 agonism. Additionally, in at least one other model, CCL5 derived from the tumor cells has been shown to indirectly enable chemoattraction of CD8+ T cells by way of CXCL9 (36). In our system, however, CCL5 did not modulate CD8+ T cell infiltration and was not produced by any of the nonhematopoietic tumor components. This differential effect is particularly interesting given the comparable expression levels of CCR5 between CD4+ and CD8+ T cells in our system. It may be that different homing receptors are functionally more important in different T cell subsets than others, for example, CCR5 dominating CD4+ T cell homing and CXCR3 dominating CD8+ T cell homing. Alternatively, there may be additional chemokine/chemokine receptor interactions at play in CD8+ T cells acting in opposition to the effect of CCL5/CCR5 in this system or differentially modulating T cell egress from the tumor. Our data, therefore, highlight the context-dependent nature of CCL5 in tumor immunology. Although we predict that the effect of CCL5 in this system is source agnostic, it may be that cells beyond the antitumor myeloid lineages meaningfully contribute to this phenotype. In terms of CCL5 derived from CD8+ T cells or conventional type 1 DCs, there were far fewer of these cells than macrophages in the PDAC tumors at baseline (Supplemental Figure 3), and neither lineage increased the proportion of cells expressing CCL5 as a function of CD40/ICB treatment. Nevertheless, both lineages are strong producers of CCL5 at the cell-by-cell level and could contribute to this phenotype on that basis. Therefore, an important future direction to understand the specific effect of myeloid-derived CCL5 would be testing CD40/ICB in myeloid-specific CCL5-KO systems. Our findings raise several additional preclinical questions of interest for future studies. This study was performed in a subcutaneously transplanted model of pancreatic cancer, which facilitated single-cell analysis. T cell trafficking to the pancreas in orthotopic or autochthonous models in response to CD40/ICB therapy may operate under different biology. Whether our findings extend to other priming-deficient cancers beyond PDAC is also of significant interest. In addition, while we have no evidence to support a role for CCL5 beyond attracting CD4+ T cells to the tumor, we cannot eliminate that possibility. Finally, although our results demonstrate the dominance of CCR5 in this system, chemokine/chemokine receptor interactions are notoriously complex, and supplemental or compensatory roles for other CCL5 receptors may exist. Past manipulations of the CCL5/CCR5 signaling axis in patients with cancer have been dominated by the use of CCR5 antagonists to mitigate T regulatory cell and tumor-associated macrophage infiltration (38, 45, 46). CCR5 inhibition has also been used in attempts to sensitize tumors to chemotherapy and prevent metastasis and shows promise as a means of preventing visceral graft-versus-host disease in patients with cancer after allogenic bone marrow transplant (47–50). Our finding that T regulatory cell content is reduced in tumors implanted into CCL5-KO mice corroborates these findings and supports the use of these inhibitors at baseline before immunotherapy. However, our findings suggest further that the use of CCR5 antagonists may be harmful with continued use once an immune response is initiated. This may have immediate clinical relevance for at least 2 ongoing clinical trials (ClinicalTrials.gov NCT03631407, NCT03274804) combining the CCR5 small-molecule inhibitors maraviroc and vicriviroc with the PD-1 inhibitor pembrolizumab. Moving forward, our data should inform the optimal combinations in which CCR5 inhibitors are administered. CD40 agonist immunotherapies are currently being tested in the clinic (ClinicalTrials.gov NCT03214250, NCT02588443) (23, 25, 26). Early results are promising, especially in combination with PD-1 inhibitors. A particularly promising trial was recently performed in which patients with pancreatic adenocarcinoma received a CD40 agonist mAb (APX005M) in addition to standard-of-care gemcitabine/nab-paclitaxel chemotherapy (26). The overall response rate was 54.2%, compared with historical controls of 18% with standard-of-care chemotherapy alone. Moving forward, CCL5 can be evaluated as a potential biomarker of response to CD40 agonism in these clinical studies. Finally, our findings also provide rationale for enhancing CD40 agonist or other cancer immunotherapies through ectopic delivery of CCL5 using CCL5-expressing oncolytic viruses or intratumor injection of recombinant CCL5. Methods Animal studies. Mice were housed under specific pathogen–free conditions in a barrier facility. C57BL/6J mice were purchased from The Jackson Laboratory; B6.129P2-Ccl5tm1Hso/J (CCL5-KO) mice were purchased from The Jackson Laboratory or bred in-house. Tumor cell lines were derived from spontaneous tumors in the KPC (LSL-KrasG12D/+ LSL-Trp53R172H/+ Pdx-1-Cre) mouse model of PDAC (51) as previously described (52). 4662 is a polyclonal KPC cell line, and 4662.MD10 is a clonal KPC cell line derived from 4662. Cell culture was performed in DMEM supplemented with 10% FBS, l-glutamine, and gentamicin. Transplanted tumors were generated by injecting 3 × 10⁵ cells in serum-free DMEM subcutaneously into the right flank. Tumors were then allowed to grow for 14 days (average size, 30–60 mm3). Mice were assigned to groups such that average tumor volume at baseline did not vary by treatment condition. Tumors were measured every 3 days by caliper. Tumor volumes were calculated using the formula (L × W2)/2, where L is the longer diameter and W is the diameter perpendicular to L. For survival studies, mice were deemed to have reached endpoint when their tumor exceeded 500 mm3. Mice that died suddenly or developed large tumor ulcerations were censored from survival studies on the day of death or euthanasia. In vivo antibody studies. Mice were treated intraperitoneally with ICB (anti–PD-1: RMP1-14; Bio X Cell; 200 μg/dose on days 0, 3, 6, 9, and 12 and anti–CTLA-4: 9H10; Bio X Cell; 200 μg/dose on days 0, 3, and 6) and CD40 agonist (FGK45; Bio X Cell; endotoxin free; 100 μg/dose) on day 3. For CCL5 blockade studies, mice were treated intraperitoneally with anti-CCL5 blocking antibody (PeproTech; 32 μg/dose on days –1, 2, 5, 8, and 11) or polyclonal rabbit isotype control (PeproTech; 32 μg/dose on days –1, 2, 5, 8, and 11). Tissue processing and flow cytometry. Mice were sacrificed on day 12 posttreatment. The entire tumor was dissected, washed in DMEM-F12 and 10% FBS, minced into small fragments, and digested in DMEM-F12 with 1 mg/mL collagenase and protease inhibitor (MilliporeSigma C6079) for 30 minutes at 37°C. Cells were then filtered through a 70-μm cell strainer then 40-μm strainer. Tissue-derived cells were washed with PBS before viability stain with LIVE/DEAD Fixable Aqua (Invitrogen, Thermo Fisher Scientific, L34957) for 20 minutes at room temperature. Samples were then washed with FACS Buffer (PBS with 0.2% BSA + 2 mM EDTA) before being stained for surface markers for 30 minutes at 4°C. Samples were then fixed and permeabilized using the eBioscience fixation/permeabilization kit (Thermo Fisher Scientific, 88-8824-00) and stained intracellularly overnight at 4°C. Flow cytometry antibodies can be found in Supplemental Table 2. Samples were collected on an LSR Fortessa flow cytometer (BD Biosciences). Data were analyzed using FlowJo v10 (Tree Star). In vitro stimulation assay. Spleens from 5 female C57BL/6J mice were isolated, and macrophages were enriched by magnet-assisted cell sorting column using the F4/80 positive selection kit (Miltenyi Biotec 130-110-443). Macrophages were cultured in a 96-well plate overnight in an incubator at 37°C in DMEM with 10% FBS, l-glutamine, and gentamicin and stimulated with cross-linked CD40 agonist (FGK45; Bio X Cell; endotoxin free). Cells were stained for CCL5 by flow cytometry the following day as described above. Single-cell RNA-sequencing library generation. Five thousand live CD45+ cells were isolated from each tumor by FACS using the 100-μm nozzle on a BD Biosciences FACSAria II. Sorted cells were then barcoded and used to generate single-cell RNA libraries with the droplet-based 10x Genomics Chromium platform according to the manufacturer’s protocol. Library quality was verified with an Agilent BioAnalyzer and LifeTech QuBit fluorimeter. Libraries were then sequenced as 150-bp paired-end reads on an Illumina HiSeq4000 to a depth of approximately 312 million read pairs. Library alignment, barcode assignment, and unique molecular identifier counting. 10x Genomics’ Cell Ranger Single-Cell Software Suite v. 3.1.0 was used to perform sample demultiplexing, barcode processing, and single-cell 3′ counting from the generated FASTQ files. The “count” function was used to align samples to the mm10 Mus musculus genome, filter cells, and quantify reads. The resulting analysis files were aggregated per treatment group using the “aggr” function, which performs between-sample normalization and sample merging. These combined data sets were used as input into Seurat v3.0 on R v. 3.6.1 (53, 54). Preprocessing. Cells that contained reads for more than 2500 or less than 200 genes were excluded as doublets or empty wells, respectively. Cells that contained reads for which more than 5% aligned to mitochondrial genes were excluded as dead cells. Data were normalized with a scale factor of 104. Highly variable genes between cells were identified using variance stabilizing transformation (“vst”), which directly models mean-variance relationships within single-cell data sets. The number of cells in each treatment group was then reduced to 2072 cells. Batch correction within treatment groups was performed using the “FindIntegrationAnchors” and “IntegrateData” functions, generating a “batch-corrected” expression matrix. Cells across all treatment groups were then integrated into a single data set using the same functions (i.e., “FindIntegrationAnchors” and “IntegrateData”). Linear dimensional reduction and clustering. The fully merged data set was linearly transformed using the “ScaleData” function such that the mean expression of a given gene across all cells was 0 and the variance of that gene across all cells was 1. Linear dimensional reduction was then performed using principal component analysis. Based on the distribution of P values per principal component, the first 20 principal components were used to cluster cells using the “FindNeighbors” and “FindClusters” functions, which implement shared nearest neighbor modularity optimization-based clustering. This was performed using a chosen resolution of 0.5, yielding 16 total clusters. Nonlinear dimensional reduction was then performed using UMAP to visualize clusters in 2-dimensional space. Cluster identification. To identify cell type within a given cluster, the “FindConservedMarkers” function was used to identify genes for which expression was conserved across treatment groups. This function performs differential gene expression testing for each treatment group and combines the P values using meta-analysis methods from the MetaDE R package. Cell type identities were then assigned to clusters based on identification of canonical cell markers and characterization of top conserved genes using the MyGeneSet tool from ImmGen. Clusters that comprised contaminating nonimmune populations (i.e., tumor cells and fibroblasts) were removed. Scaled expression of conserved marker genes was used for heatmap representation. Differential gene expression analysis. A Wilcoxon rank-sum test was used to identify differentially expressed genes between 2 treatment groups within a given cluster. The fold change in expression and adjusted P value for each gene were used for volcano plot representation using the ggplot2 R package. After filtering for genes with an adjusted P value < 0.05, genes were then ranked based on highest to lowest absolute value of fold change. Pseudotime analysis. Myeloid clusters identified using Seurat (as described above) were used as input to the Monocle v. 2.4.0 R package (55). Genes expressed in 10 or more cells were ranked based on differential analysis between clusters. Genes with a q value less than 0.01 were used for downstream pseudotemporal analysis. Dimensionality reduction was done using the DDRTree method. Cells were ordered along a pseudotime trajectory with the orderCells function and visualized in 2-dimensional space. Data availability. Data were deposited into the National Center for Biotechnology Information’s Gene Expression Omnibus database (GSE150176). Statistics. Comparison of 2 groups was performed using 2-tailed Student’s t test unless otherwise indicated. Tumor growth curves were analyzed by 2-way ANOVA, with Tukey’s multiple comparisons of means as a post hoc test to assess differences between any 2 groups. Survival curves were compared using log-rank (Mantel-Cox) test. Statistical analyses were performed in Prism 7 (GraphPad) or Excel (Microsoft). P < 0.05 was considered statistically significant, and *P < 0.05, **P < 0.01, ***P < 0.001, and ****P < 0.0001. Study approval. All mouse experiments were performed at the Perelman School of Medicine of the University of Pennsylvania in accordance with university IACUC and University Laboratory Animal Resources approvals and regulations. Author contributions APH, JHL, KTB, and RHV designed experiments. APH, JHL, and SIK performed experiments. JHL performed informatics. All authors interpreted data. APH, JHL, and RHV wrote the manuscript, which all authors helped edit. RHV supervised the study. Supplemental material View Supplemental data Acknowledgments We thank the Next Generation Sequencing Core at the University of Pennsylvania for assistance and advice. This work was supported by National Cancer Institute grants R01 CA229803, P30 CA016520, and P01 CA210944 (to RHV); the Parker Institute for Cancer Immunotherapy (to RHV and KTB); and the Roy and Diana Vagelos Scholars Program in the Molecular Life Sciences at the University of Pennsylvania (to SIK). Footnotes Conflict of interest: RHV reports having received consulting fees or honoraria since 2015 from Celgene, Celldex, Janssen, Lilly, MedImmune, and Verastem and research funding from Apexigen, FibroGen, Inovio, Janssen, and Lilly. He is an inventor on licensed patents relating to cancer cellular immunotherapy (10286066, 9453199, and 7670781) and receives royalties from Boston Children’s Hospital for a licensed research-only monoclonal antibody. Copyright: © 2020, American Society for Clinical Investigation. Reference information: JCI Insight. 2020;5(10):e137263.https://doi.org/10.1172/jci.insight.137263. References Veatch JR, et al. Endogenous CD4+ T cells recognize neoantigens in lung cancer patients, including recurrent oncogenic KRAS and ERBB2 (Her2) driver mutations. Cancer Immunol Res. 2019;7(6):910–922. View this article via: PubMed CrossRef Google Scholar Spitzer MH, et al. Systemic immunity is required for effective cancer immunotherapy. Cell. 2017;168(3):487–502.e15. View this article via: PubMed CrossRef Google Scholar Carmi Y, et al. Allogeneic IgG combined with dendritic cell stimuli induce antitumour T-cell immunity. Nature. 2015;521(7550):99–104. View this article via: PubMed CrossRef Google Scholar Hurwitz AA, Yu TF, Leach DR, Allison JP. CTLA-4 blockade synergizes with tumor-derived granulocyte-macrophage colony-stimulating factor for treatment of an experimental mammary carcinoma. Proc Natl Acad Sci USA. 1998;95(17):10067–10071. View this article via: PubMed CrossRef Google Scholar Gubin MM, et al. Checkpoint blockade cancer immunotherapy targets tumour-specific mutant antigens. Nature. 2014;515(7528):577–581. View this article via: PubMed CrossRef Google Scholar Currie AJ, et al. Dual control of antitumor CD8 T cells through the programmed death-1/programmed death-ligand 1 pathway and immunosuppressive CD4 T cells: regulation and counterregulation. J Immunol. 2009;183(12):7898–7908. View this article via: PubMed CrossRef Google Scholar Borst J, Ahrends T, Bąbała N, Melief CJM, Kastenmüller W. CD4+ T cell help in cancer immunology and immunotherapy. Nat Rev Immunol. 2018;18(10):635–647. View this article via: PubMed CrossRef Google Scholar Bogen B, Fauskanger M, Haabeth OA, Tveita A. CD4+ T cells indirectly kill tumor cells via induction of cytotoxic macrophages in mouse models. Cancer Immunol Immunother. 2019;68(11):1865–1873. View this article via: PubMed CrossRef Google Scholar Kim HJ, Cantor H. CD4 T-cell subsets and tumor immunity: the helpful and the not-so-helpful. Cancer Immunol Res. 2014;2(2):91–98. View this article via: PubMed CrossRef Google Scholar Alspach E, et al. MHC-II neoantigens shape tumour immunity and response to immunotherapy. Nature. 2019;574(7780):696–701. View this article via: PubMed CrossRef Google Scholar Odaka M, et al. Eradication of intraperitoneal and distant tumor by adenovirus-mediated interferon-beta gene therapy is attributable to induction of systemic immunity. Cancer Res. 2001;61(16):6201–6212. View this article via: PubMed Google Scholar Palomba ML, et al. CD8+ T-cell-dependent immunity following xenogeneic DNA immunization against CD20 in a tumor challenge model of B-cell lymphoma. Clin Cancer Res. 2005;11(1):370–379. View this article via: PubMed Google Scholar Zamarin D, et al. Localized oncolytic virotherapy overcomes systemic tumor resistance to immune checkpoint blockade immunotherapy. Sci Transl Med. 2014;6(226):226ra32. View this article via: PubMed CrossRef Google Scholar Liang H, et al. Radiation-induced equilibrium is a balance between tumor cell proliferation and T cell-mediated killing. J Immunol. 2013;190(11):5874–5881. View this article via: PubMed CrossRef Google Scholar Lu YC, et al. Treatment of patients with metastatic cancer using a major histocompatibility complex class II-restricted T-cell receptor targeting the cancer germline antigen MAGE-A3. J Clin Oncol. 2017;35(29):3322–3329. View this article via: PubMed CrossRef Google Scholar Tran E, et al. Cancer immunotherapy based on mutation-specific CD4+ T cells in a patient with epithelial cancer. Science. 2014;344(6184):641–645. View this article via: PubMed CrossRef Google Scholar Banchereau J, et al. The CD40 antigen and its ligand. Annu Rev Immunol. 1994;12:881–922. View this article via: PubMed CrossRef Google Scholar Morrison AH, Diamond MS, Hay CA, Byrne KT, Vonderheide RH. Sufficiency of CD40 activation and immune checkpoint blockade for T cell priming and tumor immunity. Proc Natl Acad Sci U S A. 2020;117(14):8022–8031. View this article via: PubMed CrossRef Google Scholar Winograd R, et al. Induction of T-cell immunity overcomes complete resistance to PD-1 and CTLA-4 blockade and improves survival in pancreatic carcinoma. Cancer Immunol Res. 2015;3(4):399–411. View this article via: PubMed CrossRef Google Scholar Byrne KT, Vonderheide RH. CD40 stimulation obviates innate sensors and drives T cell immunity in cancer. Cell Rep. 2016;15(12):2719–2732. View this article via: PubMed CrossRef Google Scholar Twyman-Saint Victor C, et al. Radiation and dual checkpoint blockade activate non-redundant immune mechanisms in cancer. Nature. 2015;520(7547):373–377. View this article via: PubMed CrossRef Google Scholar Rech AJ, et al. Radiotherapy and CD40 activation separately augment immunity to checkpoint blockade in cancer. Cancer Res. 2018;78(15):4282–4291. View this article via: PubMed CrossRef Google Scholar Vonderheide RH. CD40 agonist antibodies in cancer immunotherapy. Annu Rev Med. 2020;71:47–58. View this article via: PubMed CrossRef Google Scholar Beatty GL, et al. CD40 agonists alter tumor stroma and show efficacy against pancreatic carcinoma in mice and humans. Science. 2011;331(6024):1612–1616. View this article via: PubMed CrossRef Google Scholar Bajor DL, et al. Long-term outcomes of a phase I study of agonist CD40 antibody and CTLA-4 blockade in patients with metastatic melanoma. Oncoimmunology. 2018;7(10):e1468956. View this article via: PubMed CrossRef Google Scholar O’Hara MH, et al. Abstract CT004: A Phase Ib study of CD40 agonistic monoclonal antibody APX005M together with gemcitabine (Gem) and nab-paclitaxel (NP) with or without nivolumab (Nivo) in untreated metstatic ductal pancreatic adenocarcinoma (PDAC) patients. Cancer Res. 2019;79(13 suppl):CT004. Nowak AK, Robinson BW, Lake RA. Synergy between chemotherapy and immunotherapy in the treatment of established murine solid tumors. Cancer Res. 2003;63(15):4490–4496. View this article via: PubMed Google Scholar Vonderheide RH, et al. Clinical activity and immune modulation in cancer patients treated with CP-870,893, a novel CD40 agonist monoclonal antibody. J Clin Oncol. 2007;25(7):876–883. View this article via: PubMed CrossRef Google Scholar Spranger S, Dai D, Horton B, Gajewski TF. Tumor-residing Batf3 dendritic cells are required for effector T cell trafficking and adoptive T cell therapy. Cancer Cell. 2017;31(5):711–723.e4. View this article via: PubMed CrossRef Google Scholar Harlin H, et al. Chemokine expression in melanoma metastases associated with CD8+ T-cell recruitment. Cancer Res. 2009;69(7):3077–3085. View this article via: PubMed CrossRef Google Scholar Villani AC, et al. Single-cell RNA-seq reveals new types of human blood dendritic cells, monocytes, and progenitors. Science. 2017;356(6335):eaah4573. View this article via: PubMed CrossRef Google Scholar Papalexi E, Satija R. Single-cell RNA sequencing to explore immune cell heterogeneity. Nat Rev Immunol. 2018;18(1):35–45. View this article via: PubMed CrossRef Google Scholar Crawford A, Angelosanto JM, Nadwodny KL, Blackburn SD, Wherry EJ. A role for the chemokine RANTES in regulating CD8 T cell responses during chronic viral infection. PLoS Pathog. 2011;7(7):e1002098. View this article via: PubMed CrossRef Google Scholar Aldinucci D, Colombatti A. The inflammatory chemokine CCL5 and cancer progression. Mediators Inflamm. 2014;2014:292376. View this article via: PubMed Google Scholar Zhang S, Zhong M, Wang C, Xu Y, Gao WQ, Zhang Y. CCL5-deficiency enhances intratumoral infiltration of CD8+ T cells in colorectal cancer. Cell Death Dis. 2018;9(7):766. View this article via: PubMed CrossRef Google Scholar Dangaj D, et al. Cooperation between constitutive and inducible chemokines enables T cell engraftment and immune attack in solid tumors. Cancer Cell. 2019;35(6):885–900.e10. View this article via: PubMed CrossRef Google Scholar Wang X, et al. Cancer-FOXP3 directly activated CCL5 to recruit FOXP3+Treg cells in pancreatic ductal adenocarcinoma. Oncogene. 2017;36(21):3048–3058. View this article via: PubMed CrossRef Google Scholar Aldinucci D, Casagrande N. Inhibition of the CCL5/CCR5 axis against the progression of gastric cancer. Int J Mol Sci. 2018;19(5):E1477. View this article via: PubMed Google Scholar Makino Y, et al. Impaired T cell function in RANTES-deficient mice. Clin Immunol. 2002;102(3):302–309. View this article via: PubMed CrossRef Google Scholar Sarvaiya PJ, Guo D, Ulasov I, Gabikian P, Lesniak MS. Chemokines in tumor progression and metastasis. Oncotarget. 2013;4(12):2171–2185. View this article via: PubMed Google Scholar Long KB, Gladney WL, Tooker GM, Graham K, Fraietta JA, Beatty GL. IFNγ and CCL2 cooperate to redirect tumor-infiltrating monocytes to degrade fibrosis and enhance chemotherapy efficacy in pancreatic carcinoma. Cancer Discov. 2016;6(4):400–413. View this article via: PubMed CrossRef Google Scholar Vonderheide RH. The immune revolution: a case for priming, not checkpoint. Cancer Cell. 2018;33(4):563–569. View this article via: PubMed CrossRef Google Scholar Cambien B, et al. CCL5 neutralization restricts cancer growth and potentiates the targeting of PDGFRβ in colorectal carcinoma. PLoS One. 2011;6(12):e28842. View this article via: PubMed CrossRef Google Scholar Willenbrock F, et al. Abstract B40: High circulating CCL5 is associated with poor prognosis in locally advanced pancreatic cancer (LAPC): biomarker analysis from the randomized phase II SCALOP trial. Cancer Res. 2019;79(24 suppl):B40. Jiao X, et al. Recent advances targeting CCR5 for cancer and its role in immuno-oncology. Cancer Res. 2019;79(19):4801–4807. View this article via: PubMed CrossRef Google Scholar Pervaiz A, Zepp M, Mahmood S, Ali DM, Berger MR, Adwan H. CCR5 blockage by maraviroc: a potential therapeutic option for metastatic breast cancer. Cell Oncol (Dordr). 2019;42(1):93–106. View this article via: PubMed Google Scholar Reshef R, et al. Blockade of lymphocyte chemotaxis in visceral graft-versus-host disease. N Engl J Med. 2012;367(2):135–145. View this article via: PubMed CrossRef Google Scholar Reshef R, et al. High graft CD8 cell dose predicts improved survival and enables better donor selection in allogeneic stem-cell transplantation with reduced-intensity conditioning. J Clin Oncol. 2015;33(21):2392–2398. View this article via: PubMed CrossRef Google Scholar Moy RH, et al. Clinical and immunologic impact of CCR5 blockade in graft-versus-host disease prophylaxis. Blood. 2017;129(7):906–916. View this article via: PubMed CrossRef Google Scholar Huffman AP, et al. Pharmacodynamic monitoring predicts outcomes of CCR5 blockade as graft-versus-host disease prophylaxis. Biol Blood Marrow Transplant. 2018;24(3):594–599. View this article via: PubMed CrossRef Google Scholar Hingorani SR, et al. Trp53R172H and KrasG12D cooperate to promote chromosomal instability and widely metastatic pancreatic ductal adenocarcinoma in mice. Cancer Cell. 2005;7(5):469–483. View this article via: PubMed CrossRef Google Scholar Lo A, et al. Tumor-promoting desmoplasia is disrupted by depleting fap-expressing stromal cells. Cancer Res. 2015;75(14):2800–2810. View this article via: PubMed CrossRef Google Scholar Stuart T, et al. Comprehensive integration of single-cell data. Cell. 2019;177(7):1888–1902.e21. View this article via: PubMed CrossRef Google Scholar Butler A, Hoffman P, Smibert P, Papalexi E, Satija R. Integrating single-cell transcriptomic data across different conditions, technologies, and species. Nat Biotechnol. 2018;36(5):411–420. View this article via: PubMed CrossRef Google Scholar Trapnell C, et al. The dynamics and regulators of cell fate decisions are revealed by pseudotemporal ordering of single cells. Nat Biotechnol. 2014;32(4):381–386. View this article via: PubMed CrossRef Google Scholar Version history Version 1 (April 23, 2020): In-Press Preview Version 2 (May 21, 2020): Electronic publication
|
|
Scooped by
Gilbert C FAURE
April 20, 2020 3:18 AM
|
PubMed comprises more than 30 million citations for biomedical literature from MEDLINE, life science journals, and online books. Citations may include links to full-text content from PubMed Central and publisher web sites.
|
|
Scooped by
Gilbert C FAURE
March 26, 2020 3:27 PM
|
KEY POINTS α2β1 deficiency does not alter the balance of NK cell/ILC1 generation. α2β1 deficiency does not alter NK cell maturation. α2β1-deficient NK cells efficiently protect from lethal mousepox and control MCMV. Abstract NK cells play an important role in antiviral resistance. The integrin α2, which dimerizes with integrin β1, distinguishes NK cells from innate lymphoid cells 1 and other leukocytes. Despite its use as an NK cell marker, little is known about the role of α2β1 in NK cell biology. In this study, we show that in mice α2β1 deficiency does not alter the balance of NK cell/ innate lymphoid cell 1 generation and slightly decreases the number of NK cells in the bone marrow and spleen without affecting NK cell maturation. NK cells deficient in α2β1 had no impairment at entering or distributing within the draining lymph node of ectromelia virus (ECTV)–infected mice or at becoming effectors but proliferated poorly in response to ECTV and did not increase in numbers following infection with mouse CMV (MCMV). Still, α2β1-deficient NK cells efficiently protected from lethal mousepox and controlled MCMV titers in the spleen. Thus, α2β1 is required for optimal NK cell proliferation but is dispensable for protection against ECTV and MCMV, two well-established models of viral infection in which NK cells are known to be important. This article is featured in In This Issue, p.1419 Footnotes This work was supported by grants from the National Institute of Allergy and Infectious Diseases (NIAID) (R01AI110457 and R01AI065544) and the National Institute on Aging (AG048602 to L.J.S.). B.M. and C.J.K. were supported by Grant T32 AI134646 from the NIAID. P.A.-P. was partially supported by a Ph.D. fellowship (PD/BD/128078/2016) from the M.D./Ph.D. Program of the University of Minho-School of Medicine funded by the Fundação para a Ciência e Tecnologia. Research reported in this publication used the Flow Cytometry and Animal Laboratory facilities at the Sidney Kimmel Cancer Center at Jefferson Health and was supported by the National Cancer Institute of the National Institutes of Health under Award P30CA056036. The online version of this article contains supplemental material. Abbreviations used in this article: α2 integrin α2 β1 integrin β1 dLN draining lymph node dpi day postinfection ECTV ectromelia virus Eomes eomesodermin GzmB granzyme B hpi hour postinfection ILC innate lymphoid cell LN lymph node K181 MCMV K181 MCMV mouse CMV ndLN nondraining LN qRT-PCR quantitative RT-PCR, . Received August 2, 2019. Accepted January 5, 2020. Copyright © 2020 by The American Association of Immunologists, Inc.
|
|
Scooped by
Gilbert C FAURE
November 13, 2019 3:40 PM
|
As we learn more about the HIV latent reservoir, we continue to discover that the viral reservoir is more complicated than just a pool of infected resting memory CD4+ T cells in peripheral blood. Evidence increasingly points to both certain tissues and certain types of cells as potential viral reservoirs. T follicular helper cells (TFH) are prime targets of HIV infection—this creates a sanctuary for infected cells because CD8+ T cells generally do not enter lymph node follicles unless they express CXCR5, and are not as effective at killing infected CD4+ T cells as peripheral CD8+ T cells. In this review, we summarize the current state of research on TFH cell infection in peripheral lymphoid tissues and focus on the question of whether CD8+ T cell exclusion from B cell follicles is responsible, at least in part, for establishing secondary lymphoid tissue B cell follicles as an anatomic site of HIV transcription and replication.
|
|
Scooped by
Gilbert C FAURE
September 7, 2019 11:28 AM
|
Clinical MedicineImmunologyPulmonology Free access | 10.1172/JCI128654 The alveolar immune cell landscape is dysregulated in checkpoint inhibitor pneumonitis Karthik Suresh,1 Jarushka Naidoo,2,3 Qiong Zhong,1 Ye Xiong,1 Jennifer Mammen,4 Marcia Villegas de Flores,5 Laura Cappelli,5 Aanika Balaji,2 Tsvi Palmer,1 Patrick M. Forde,2,3 Valsamo Anagnostou,2,3 David S. Ettinger,2 Kristen A. Marrone,2,3 Ronan J. Kelly,2,3 Christine L. Hann,2,3 Benjamin Levy,2,3 Josephine L. Feliciano,2,3 Cheng-Ting Lin,6 David Feller-Kopman,1 Andrew D. Lerner,1 Hans Lee,1 Majid Shafiq,1 Lonny Yarmus,1 Evan J. Lipson,3,4 Mark Soloski,5 Julie R. Brahmer,2,3 Sonye K. Danoff,1 and Franco D’Alessio1 First published July 16, 2019 - More info Abstract BACKGROUND. Checkpoint inhibitor pneumonitis (CIP) is a highly morbid complication of immune checkpoint immunotherapy (ICI), one which precludes the continuation of ICI. Yet, the mechanistic underpinnings of CIP are unknown. METHODS. To better understand the mechanism of lung injury in CIP, we prospectively collected bronchoalveolar lavage (BAL) samples in ICI-treated patients with (n = 12) and without CIP (n = 6), prior to initiating first-line therapy for CIP (high-dose corticosteroids). We analyzed BAL immune cell populations using a combination of traditional multicolor flow cytometry gating, unsupervised clustering analysis, and BAL supernatant cytokine measurements. RESULTS. We found increased BAL lymphocytosis, predominantly CD4+ T cells, in patients with CIP. Specifically, we observed increased numbers of BAL central memory T cells, evidence of type I polarization, and decreased expression of cytotoxic T lymphocyte–associated protein 4 and programmed cell death protein 1 in BAL Tregs, suggesting both activation of proinflammatory subsets and an attenuated suppressive phenotype. CIP BAL myeloid immune populations displayed enhanced expression of IL-1β and decreased expression of counterregulatory interleukin-1 receptor antagonist. We observed increased levels of T-cell chemoattractants in the BAL supernatant, consistent with our proinflammatory, lymphocytic cellular landscape. CONCLUSION. We observe several immune cell subpopulations that are dysregulated in CIP, which may represent possible targets that could lead to therapeutics for this morbid immune-related adverse event. FUNDING. NIH, Department of Defense, and the Bloomberg~Kimmel Institute for Cancer Immunotherapy. Graphical Abstract Introduction With recent clinical trials demonstrating clear efficacy for immunotherapy in patients with locally advanced and advanced-stage non–small-cell lung cancer (NSCLC) as well as other tumors, the use of immune checkpoint inhibitors (ICIs) for the treatment of NSCLC has rapidly increased (1–3), becoming the standard of care. ICIs, however, are associated with a constellation of toxicities termed immune-related adverse events (irAEs). These toxicities include arthritis, colitis, endocrinopathies, and lung injury; the last is termed checkpoint inhibitor pneumonitis (CIP) (4, 5). Clinically, patients with CIP present with acute to subacute onset of dyspnea, hypoxemia, and pulmonary infiltrates similar to that seen in patients with lung injury from acute respiratory distress syndrome (6). Although CIP can result in high morbidity, it was previously thought to be an uncommon complication of ICI therapy, with an incidence of around 3% to 5% (7, 8) based on clinical trial data. Recent evidence from our group and others suggests, however, that the occurrence of CIP may be higher in real-world settings (9, 10). For instance, using a multidisciplinary, standardized approach (11), we recently observed an incidence of 19% in a cohort of 205 patients with NSCLC treated with ICI (12). In addition, we also observed an association between CIP development and increased mortality rates in patients with NSCLC treated with ICI (13). Despite the rising incidence of CIP and its association with increased mortality, the current paradigms for diagnosis and treatment of CIP are largely based on anecdotal evidence, primarily because fundamental knowledge of CIP pathobiology is lacking (14). CIP is diagnosed by the presence of compatible symptoms (shortness of breath, hypoxia, cough), new radiographic infiltrates, which can be either unilateral or bilateral (15, 16), typically with ground glass and consolidative components (Figure 1), and the exclusion of infectious etiologies (with sputum cultures or bronchoalveolar lavage [BAL]). There are currently no diagnostic biomarkers for CIP, so the diagnosis remains largely one of exclusion. Once diagnosed, clinical severity is used to determine CIP grade (Supplemental Table 1; supplemental material available online with this article; https://doi.org/10.1172/JCI128654DS1). For CIP grade 2 (i.e., symptomatic patients with compatible radiographic infiltrates) and higher, ICI therapy is immediately discontinued, and empiric high-dose steroids are initiated. More targeted, disease-specific therapy is not instituted as first-line treatment for CIP in part because there are currently no available data on the mechanism of lung injury in CIP. Due to the lack of diagnostic and therapeutic options, patients diagnosed with CIP are typically also not eligible for further ICI; this is particularly disadvantageous in individuals with ongoing tumor response. Figure 1 Radiographic presentation of CIP. Representative computed tomography images of an ICI-treated NSCLC patient (A) prior to development of CIP, (B) at the time of CIP diagnosis, and (C) after 3 weeks of steroid treatment. *Denotes area of preexisting post-radiotherapy changes that were stable before initiation of ICI. As part of a multidisciplinary immune-related toxicity (irTox) team (11) engaged in diagnosis, management, and study of irAEs following ICI therapy, we prospectively collected BAL fluid (BALF) specimens from patients treated with ICI who have no evidence of CIP as well as those with suspected CIP. Clinical, laboratory, and radiographic data of patients suspected of having CIP were subsequently reviewed by the irTox team, and a determination was made as to whether the presenting symptoms were due to CIP or another etiology. Using these specimens, we performed multiparametric flow cytometric analysis on BALF samples to better understand the landscape of immune dysregulation in CIP. In part due to the lack of available data on the biology of lung injury in CIP, we utilized unbiased clustering analytic techniques to examine our flow cytometric results. Such approaches have the advantage of detecting changes in small cell populations that may otherwise be excluded with manual gating. Importantly, the control group comprised patients who also received ICI but did not exhibit any clinical evidence of CIP at the time of bronchoscopy. Results BAL lymphocytosis is a hallmark for CIP. Study design as well as baseline clinical characteristics for the patients enrolled in this observational study are shown in Figure 2 and Table 1, respectively. Clinical grade, management, and outcomes data for the 12 patients with CIP are presented in Supplemental Table 2. We first manually counted BAL cell differentials in a subset of control and CIP samples. We found a relative increase in lymphocytes with a concomitant decrease in monocytes in CIP (Supplemental Figure 2) compared with patients without CIP. Notably, BAL neutrophils were not abundant in patients with CIP. To further characterize subsets of BAL immune cells, we performed multiparametric flow cytometric analysis using optimized T cell and monocyte panels (Supplemental Table 3). We initially analyzed these data using traditional gating methods, and similar to our manual cell differentials, found an increase in the percentage of T lymphocytes in patients with CIP (Figure 3). Specifically, we found an increase in CD3+CD4+ cells (Figure 3A; P = 0.04) and a possible association with increased CD3+CD8+ cells (Figure 3B; P = 0.073). We also noted a decrease in monocytes, specifically CD3–CD19–CD14+ cells (Figure 3C; P = 0.04). We did not observe any differences in the percentage of Tregs (CD3+CD4+CD127loCD25+Foxp3+) among patients who were CIP+ and CIP– (data not shown). Figure 2 Study design and participating patients. Consort diagram showing study enrollment and adjudication of patients into control and CIP groups. *Pertinent clinical, radiographic, laboratory and microbiologic (including BAL culture when available) data were reviewed by the immune-related toxicity (irTox) team before and (in cases of suspected CIP) after bronchoscopy. At both time points, patients with suspected CIP with an alternative etiology for symptoms were excluded from the CIP group (n = 2). ICI, immune checkpoint inhibitor; VATS, video-assisted thoracic surgery; CIP, checkpoint inhibitor pneumonitis. Figure 3 BAL lymphocytosis in patients with CIP. Scatter plots showing number of (A) CD4+, (B) CD8+, (C) CD14+, and (D) CD16+ T cells (A and B) and monocytes (C and D), respectively, in control and CIP samples. n = 6 (CIP–), 12 (CIP+). Comparisons between groups performed using Mann-Whitney test. Table 1 Baseline characteristics Unsupervised clustering reveals differential T cell subpopulations in CIP. To understand immune cell subpopulations in our samples in more granular detail, we next turned to unsupervised clustering analysis. The total numbers of cells per condition used for our unsupervised analyses are shown in Supplemental Table 4. We represent the results of our clustering analysis using star charts. As shown in Supplemental Figure 1, groups of cells that share similar cytokine profiles are identified as a node and represented by a circle. The diameter of the circle reflects the number of cells present within that subpopulation. The cell surface or intracellular mean fluorescence intensity (MFI) for each fluorophore is expressed as a wedge within the circle; the radius of the wedge segment represents the expression level of that particular marker. For instance, in Supplemental Figure 1B, a node with very high PD-1, CD45RA, and CD127 expression is shown. Topologically, nodes are arranged by similarity to each other in a cluster map (Supplemental Figure 1C). Cell subsets occupy distinct areas within a map; for instance, in the T cell cluster map, as expected, CD4+ and CD8+ cells are clustered together in opposite ends because they are very distinct from each other (Supplemental Figure 1, D and E). In control, unstimulated T cells, we observed clustering around 2 cell populations: CD4+ cells with high PD-1 expression (Figure 4A) and CD8+ cells with moderate PD-1 expression (Figure 4A). Unstimulated CIP samples exhibited increased CD8+ cell populations compared with unstimulated controls (Figure 4B) as well as a local shift in CD4+ Treg populations (Figure 4B), as discussed in more detail in the information to follow. Figure 4 T cell populations in CIP. Unsupervised clustering of T cells in BALF samples of patients without (control, n = 6) and with CIP (n = 12). Cluster maps showing distribution of T cell subpopulations in (A) unstimulated controls and (B) unstimulated CIP. Within each cluster map, larger cell populations distinct to that particular condition are highlighted (square boxes). To better understand the specific T cell subsets that were up/downregulated in patients with CIP, we examined the differential cluster map of T cell subsets, which highlights only clusters where the magnitude of difference between groups was greater than 95%. As shown in Figure 5, in CIP, we observed a significant increase in CD4+CD45RA+CD25– cells that also expressed CD62L. Because this cytokine profile resembled that of central memory T cells (Tcms), a non-Treg (i.e., conventional) T cell subpopulation characterized by high CD62L and low CD45RA expression, we performed manual gating for Treg and non-Treg subpopulations (Supplemental Figure 3) and observed a significantly higher percentage of Tcm in CIP samples (P = 0.01). As mentioned earlier, we observed a shift in CD4+FoxP3+ cells between unstimulated control and CIP cluster maps. Closer examination of these clusters revealed that while clusters of PD-1loCTLA-4lo Tregs were similarly expressed in both CIP and controls, a subpopulation of Tregs with high PD-1 and CTLA-4 expression was only seen in controls, and these effector molecules were downregulated in alveolar Tregs in CIP (Figure 5). Compared with controls, multiple CD8+TNF-αhi subpopulations were upregulated at baseline in CIP (Figure 5). Ex vivo stimulation of CIP samples polarized T cells toward a type 1 phenotype with increased TNF-α and IFN-γ production across multiple cell subsets with varying degrees of CD8 expression; these cell populations were not increased in control cells following stimulation (Supplemental Figure 4). Figure 5 Abnormal T cell subsets in CIP. Differential cluster map (center) shows clusters where the number of cells within the cluster were increased by 95% in controls (red, n = 6) or CIP (cyan, n = 12). Cytokine profile (inset) and scatter plot of relevant cytokines showing MFI in the selected clusters (red) compared with MFI across all clusters (black) in (counterclockwise): (i) CD4+FoxP3loCD25–CD62LhiCD45RAlo cluster increased in CIP; (ii) PD-1hiCTLA-4hi clusters of Tregs increased in controls, scatter plot showing PD-1/CTLA-4 MFI in selected clusters; (iii) similar (i.e., <95% difference) expression of PD-1loCTLA-4lo Treg clusters in CIP and controls, scatter plot showing PD-1/CTLA-4 MFI in selected clusters; (iv) a CD3+CD4lo CD8–TNF-αhi population increased in CIP, scatter plot showing CD4/TNF-α MFI in selected clusters; (v) CD8+TNF-αhiPD-1hi clusters increased in CIP, scatter plot showing CD8/TNF-α MFI in selected clusters; and (vi) a second set of CD8+TNF-αhi clusters increased in CIP. In summary, these findings suggest multiple dysregulated T cell subsets in patients with CIP. At baseline, we observe in CIP: (a) increased Tcms, (b) loss of PD-1hi/CTLA-4hi CD4+ Tregs and (c) upregulation of proinflammatory (i.e., TNF-αhi, IFN-γhi) CD8+ cells. With stimulation, we observe an increase in numbers of CD8+ TNF-αhi subsets and the amount of TNF-α expression in stimulated CIP samples compared with controls. Upregulation of IL-1βhi monocytes in CIP and IL-1RA–expressing B cells in controls. Next, we sought to examine population differences in non–T (i.e., CD3–) cells. Similar to our T cell analyses, we represented the results in cluster maps where the distinct cell populations (e.g., CD14+ monocytes, CD16+ monocytes, B cells) occupy various regions within the map (Supplemental Figure 5). We observed clear differences between unstimulated control and CIP samples (Figure 6). As shown in Figure 6, A and B, and in closer detail in Figure 7, two reciprocal populations were upregulated in controls and CIP, respectively. In controls, we observed a large increase in several clusters corresponding to IL-1RA–expressing CD86+ B cells (CD19+). While this cluster was downregulated in CIP, a different cluster of IL-1βhiTNF-αhiCD-11bhi myeloid cells (CD19–, CD14int/CD16int) was significantly upregulated in CIP. Similar to our T cell analysis, we confirmed the presence of a TNF-αhiIL-1βhiCD11bhi population in CIP samples with manual gating (Supplemental Figure 6). Unlike T cells, we did not observe significant differences in cluster profiles between unstimulated and stimulated cells either in the control or CIP condition (Supplemental Figure 7). Figure 6 Monocyte populations in CIP. Unsupervised clustering of non–T cells (singlet, live, CD3–) in BALF samples of patients without (control, n = 6) and with CIP (n = 12). Cluster maps showing distribution of myeloid subpopulations in (A) unstimulated controls and (B) unstimulated CIP. Figure 7 Abnormal monocyte subsets in CIP. Differential cluster map of myeloid cells showing clusters that are increased by at least 95% between unstimulated controls (n = 6) and unstimulated CIP (n = 12) samples. Cytokine profiles and scatter plot of relevant cytokines showing MFI in the selected clusters (red) compared with MFI across all clusters (black) showing: (i) population of IL-1RAhi B cells (CD19+) increased in controls and (ii) large population of related clusters of IL-10hiIL-1βhi myeloid cells (CD14loCD16loCD19–) increased in CIP. We also compared the subpopulations identified previously as being significantly different in controls or CIP to the results of a meta-clustering analysis, to determine whether the subpopulations selected to be differentially upregulated in our prior analyses were also identified as distinct populations using an autogating strategy. As shown in Supplemental Figure 8, meta-clustering identified the clusters previously examined in our T cell and monocyte/B cell cluster maps (Figure 4 and Figure 6) as distinct subpopulations. Upregulation of lymphocyte chemoattractants in the BALF of patients with CIP. To determine whether BALF cytokines were promoting the cellular phenotypes observed in our flow cytometry data, we measured key cytokines in the cell-free BAL supernatant (Figure 8, A–C, and Supplemental Table 5). Surprisingly, despite observing an increased number of IL-1βhi cells in our flow analysis, we observed decreased levels of IL-1β in CIP BAL supernatants. We observed no differences in TNF-α levels, but discovered increased levels of the type 1 skewing cytokine IL-12p40. We also measured levels of cytokines involved in the recruitment of inflammatory cells to the alveolus. We observed lower levels of IL-8, the classical neutrophil chemoattractant, in CIP. Although no differences were seen in levels of monocyte chemoattractant proteins 1 or 4, we observed lower levels of macrophage inflammatory protein-3α (MIP-3α), a significant increase in levels of the IFN-γ–induced protein 10 (IP-10, or CXCL-10) and a trend toward increased levels of T cell chemoattractant protein TARC (also known as CCL17; P = 0.06). Figure 8 BALF cytokine analysis. (A) Heatmap showing expression of various cytokines in control and CIP BAL supernatant samples. Cytokines are scaled, centered, and hierarchically clustered (using the Euclidean distance). (B) Box-and-whisker plots showing median, minimum, and maximum with individual data point overlay (dots) for select cytokines involved in alveolar inflammation and immune cell skewing (B) or inflammatory cell recruitment/chemotaxis (C). *Denotes significant difference from control BALF samples (Mann-Whitney, P < 0.05). Discussion In this study, we describe multiple baseline and functional abnormalities in both lymphoid and myeloid alveolar cell types in patients who developed CIP. These abnormalities involve both upregulation of proinflammatory subsets and downregulation of the counterregulatory antiinflammatory process in both T cells and myeloid cells (Figure 9). In healthy adults, the BAL is composed primarily of macrophages (>85%) and lymphocytes (10%) (17). These percentages are similar to the pattern seen in our control samples (i.e., patients who received ICI but did not have CIP at the time of bronchoscopy), suggesting that ICI therapy alone does not appear to significantly alter the alveolar immune cell pattern. In contrast, we observed lymphocytosis of greater than 20% in most of our CIP+ BAL samples. BAL lymphocytosis has been reported in other conditions such as sarcoidosis, hypersensitivity pneumonitis, cryptogenic organizing pneumonia, nonspecific interstitial pneumonia, and radiation pneumonitis. Our finding of lymphocytosis in the BALF of patients with CIP argues for the use of BAL cell count differentials and flow cytometry for CD4+/CD8+ cells as part of the clinical evaluation scheme during BAL in patients with suspected CIP. As no biomarker currently exists for this disease, this discovery represents a translational application of our current findings. Figure 9 Summary of dysregulated immune cell phenotypes in CIP. Our unbiased clustering approach identified several subpopulations of T cells that are likely to be playing key roles in the pathobiology of CIP. First, CD4+ central memory subsets (Tcms, CD4+CD45RA–CD62L+) were increased in CIP. Tcms have been shown to be more resistant to steroid-induced apoptosis than other conventional T cells, such as effector memory T cells. Moreover, CD62L+ cells play an important role in adhesion to inflammatory sites and can perpetuate injury (18). Increased Tcm in CIP might explain why some patients fail high-dose steroid therapy. We recently reported steroid-refractory disease in up to 40% of patients with CIP in our cohort (10); from a lung injury standpoint, this feature of CIP is unique compared with other lymphocytic pneumonitides, which generally tend to be steroid responsive. The incidence of CIP is significantly higher in patients with underlying NSCLC than other cancers, and we have shown (5) that within patients with NSCLC, tumor histology further stratifies CIP incidence and risk. These findings, coupled with our current data, suggest that Tcm could be responding to tumor-specific antigens. T cell receptor sequencing of the T cell subsets in CIP samples will be useful in this regard. Second, a subpopulation of CD4+ cells skewed toward a type I phenotype with high IFN-γ and TNF-α production is upregulated in CIP. Type I lymphocytes have been linked to several lung diseases including sarcoidosis, hypersensitivity pneumonitis, and lung allograft rejection (19–21). Thus, the combination of “sticky” lung CD4+ T cells (i.e., CD62L+ CD4+ cells) and type I skewing may be synergistically contributing to lung injury seen in patients with CIP. Third, we observed decreased CTLA-4 and PD-1 expression within Treg (i.e., FoxP3+) populations, suggesting an attenuated Treg suppressive phenotype. One explanation for our findings is that, in CIP, loss of Treg suppression may be promoting exuberant Th1 T cell responses. We have shown that alveolar Tregs play a pivotal role orchestrating resolution of lung inflammation and are present in humans with lung injury (22), while others have shown that PD-1+ Tregs are more suppressive to control CD8+ T cells (23). In addition to PD-1, the lack of CTLA-4 may further impair Treg ability to control conventional T cell (such as Tcm) and macrophage proinflammatory responses (24). Overall, our findings suggest highly activated alveolar T cells with loss of a regulatory, antiinflammatory Treg suppressive phenotype contributing to unchecked immune dysregulation seen in CIP. Interestingly, while we observed decreased numbers of CD14+ monocytes based on traditional gating methods, our clustering data show additional dramatic shifts in myeloid populations between controls and patients with CIP, such as a significant increase in CD11bhiIL-1βhi, myeloid cells with varying degrees of CD14/CD16 expression. This is accompanied by a loss of IL-1RA+CD19+ cells in patients with CIP, reflected in the cluster maps as a relative upregulation of these cells in controls. These findings suggest that an imbalance in IL-1 signaling, along with overexuberant TNF-α signaling may be contributing to the pathobiology of lung injury in patients with CIP. The concomitant presence of increased Tcms, as discussed earlier, may also serve to augment T cell and monocyte inflammation. Our BALF cytokine results also point toward a proinflammatory, chemoattractant cytokine milieu. Interestingly, we observed a decrease in soluble IL-1β, while an increase in IL-1β–expressing monocyte subsets was observed in flow cytometry. The dynamics of IL-1β production and release is complex, however, and thought to be related to the strength of the inflammatory stimulus (25). Thus, one possibility is that, in CIP, the underlying source of inflammation promotes IL-1β translation and endosomal storage, but not membrane release. Another possibility is that soluble IL-1β release occurs earlier in injury and is decreased by the time our samples are obtained (generally 2 to 3 days at a minimum, after symptom onset). This lack of time resolution in our BALF data may also explain why TNF-α levels were not significantly different. Another explanation is that, although our controls did not have CIP, they underwent bronchoscopy prior to tumor sampling/resection; this bias may be skewing our control IL-1β results. Despite these findings, our IL-12p40 and CXCL-10 (IP-10) data further implicate CD4+ cells in the pathobiology of CIP. IL-12 is a known orchestrator of tissue inflammation and type I polarization. IL-12p40 can form heterodimers with IL-12p70 and IL-23 (26); however, neither of these cytokines was elevated in the BALF of subjects with CIP (Supplemental Table 5). Thus, we postulate that the increased IL-12p40 observed in CIP constitutes the monomeric form. This secreted form has been reported to be 10- to 20-fold in excess compared with IL-12p70 in stimulated human peripheral blood cells (27) and has been known to be elevated in patients with asthma during airway inflammation (28). Additionally, IP-10 is known to guide Tcm lymphocytes (a T cell subset seen to be upregulated in our flow cytometry data) to their destination within lymph nodes (29). Therapeutically, antibody-mediated blockade of IL-12p40 and CXCL10 has been used to treat inflammatory diseases (30, 31). Our chemotactic cytokine data collectively reflect a lack of neutrophil chemoattraction to the lung (decreased IL-8). Similarly, MIP-3α, which is decreased in patients with CIP BALF, has been previously observed in the context of airway infections (32), is thought to have antimicrobial properties. This observation, along with our IL-8 data and lack of significant neutrophil predominance in our BAL cell differentials (Supplemental Figure 2) further supports the notion that CIP may not be a bacterial infection–triggered phenomenon. Lastly, our finding of increased CCL17 levels correlates with our flow cytometric finding of increased CD11bhi populations of myeloid cells; CD11b+ cells have been previously identified as a key source of the CCL17-honing chemokine in the lung (33). Our findings suggest several targets for therapeutic consideration in patients with steroid-refractory CIP. We note upregulation of several TNF-αhi subsets (lymphoid and myeloid) at baseline in CIP; this finding provides some tissue-specific rationale for the use of infliximab for steroid-refractory CIP, although our BAL cytokine data suggest that timing of TNF-α inhibition may need to be further explored. Importantly, our data also identify several potentially novel populations upregulated in CIP (such as CD62Lhi Tcms and IL-1β–expressing monocytes) that could be targeted using existing therapies. Anti-CD62L antibodies or small-molecule inhibitors have been used to attenuate models of lung injury (34, 35), although these inhibitors are not currently approved for any clinical indication. Biological agents against IL-1β (e.g., anakinra or canakinumab) are currently either in trials or in use, and thus, further validation of these results could provide the rationale for testing these therapies either as first-line adjuncts or as salvage therapies for high-grade CIP. It is known that transient expression of IL-1β can induce lung inflammation, increase TNF-α, and contribute to progressive tissue fibrosis (36); hence, targeting IL-1β could represent an attractive target in treating CIP. CCL-17 (TARC) the ligand for CCR4 is usually considered a selective chemoattractant for type 2 cells, although it has been shown to be elevated in sarcoidosis, a classical type I–mediated lung disease (37). Blocking TARC or its receptor CCR4 could decrease T cell infiltration into the inflamed CIP lungs. Alternatively, transiently enhancing Treg suppressive function could lead to multiple beneficial effects, such as improving control of exuberant type I responses and limiting proliferation, abrogating macrophage proinflammatory responses and ultimately orchestrating lung repair (22, 38). For instance, we have previously shown that a short-course administration of the DNA methyltransferase inhibitor decitabine can potently augment endogenous Tregs and mediate resolution of lung inflammation and promote lung repair (39). Analysis of CIP rates in ongoing trials utilizing ICI/DNA methyltransferase inhibitor combinations could provide further insight into a potential beneficial effect for these agents from a CIP standpoint. Although our data provide insight into potential pathobiologic mechanisms in CIP, CIP is unique in comparison to other irAEs regarding incidence (across cancer types) (40) and relationship to overall survival (OS). CIP is much more common in lung cancers compared with other cancers, and although other irAEs have been associated with improved OS, we did not observe a similar association with CIP (13). Thus, we do not believe that our results are necessarily generalizable to other irAEs. There are several limitations to this study. First, due to the logistical challenges associated with identifying and promptly performing lavage in patients with suspected CIP before antibiotic or steroid administration, our sample sizes are low and thus preclude adjustment for clinical comorbidities (such as chronic obstructive pulmonary disease) that may confound our results. Second, while only patients with a negative infectious work-up were included in the CIP cohort, it is possible that BAL cultures did not identify a focus of infection in patients thought to have CIP. Third, although BAL of CIP infiltrates were performed in areas not previously affected by tumor, it is possible that presence of malignancy in the nearby airways could have influenced our results. In conclusion, our data provide several hypothesis-generating insights into the dysregulated alveolar immune dysregulation in patients with CIP. In the absence of a preclinical model for CIP, our findings provide the first rigorous report to our knowledge of immunological mechanisms underlying CIP. In addition to validation in larger clinical cohorts, these data could inform the design of preclinical and translational studies aimed at further understanding the mechanistic basis of CIP, so that targeted therapies can be developed for this morbid complication of immunotherapy. Methods Study population. Patients were enrolled in this prospective observational study if they were (a) diagnosed with NSCLC and (b) treated with ICIs. Patients who received neoadjuvant ICI underwent bronchoscopy with the collection of BALF prior to surgery. Otherwise, BALF was collected whenever patients underwent bronchoscopy. If CIP was suspected, the BALF sampled was categorized as “CIP” if (a) the sample was obtained before initiating steroids and antibiotics and (b) a clinical diagnosis of CIP was adjudicated by the multidisciplinary irTox team (information to follow). After adjudication, patients with CIP were treated with high-dose steroids (1 mg/kg prednisone). Second-line agents (infliximab, i.v. immunoglobulin, or mycophenolate mofetil) were added at the discretion of the treating team if no improvement was noted after 72 hours, as described previously (12). CIP diagnosis. CIP was defined as (a) shortness of breath, decreased exercise tolerance, exertional desaturation, and/or cough along with (b) the presence of new radiographic infiltrates and (c) lack of evidence of infection (negative cultures on BAL, negative respiratory viral swab) or alternate etiologies (diffuse alveolar hemorrhage, heart failure). Radiographic assessment was performed based on response evaluation criteria in solid tumors (RECIST); cases where the new infiltrates were deemed to represent tumor progression were excluded from both control and CIP groups. A diagnosis of CIP was adjudicated following review and discussion of the pertinent microbiologic and radiographic (11, 12) data by the primary oncologist, a second oncologist (JN), 2 pulmonologists (KS, SD), and a radiologist (CTL), with additional input from other members of the immune-related toxicity team (11) (such as radiation oncology or infectious disease), as needed. Patients in whom clinical equipoise regarding infection was present (e.g., clinical presence of fever, purulent sputum, sick contacts, elevated bands on complete blood count differential) were not adjudicated as CIP even if the BAL cultures were negative. BAL. In control patients, the middle lobe was lavaged. In patients with CIP, an area with new infiltrates not previously known to be associated with tumor was lavaged. The volume of instilled and returned saline was abstracted from the BAL procedure note. BAL specimens were processed with ammonium chloride–potassium lysis solution. Cells were then counted following trypan blue staining to exclude dead cells. Manual cell differentials. BALF cells were stained with Diff-Quik (Thermo Fisher) and equal numbers of total cells (n = 500) were counted per specimen by 2 investigators blinded to the sample group classification as previously described (22). BAL cytokine measurements. BAL supernatant was collected following centrifugation of the cellular components and stored at –80° until further processing. Cytokine measurements were performed using the Mesoscale Discovery platform. Values were normalized to total volume of BAL fluid returned, as noted during bronchoscopy. Flow cytometry. After thawing samples at 37°C, cells were stained for flow cytometry. Approximately 1 × 10⁶ cells per sample were stained with violet LIVE/DEAD (Invitrogen). Cells were incubated with human IgG (Rockland Immunochemicals) to block Fc receptors. Cells were then surface stained with BD Biosciences–Pharmingen antibodies: BV510-conjugated anti-CD3 (UCHT1), BUV395-conjugated anti-CD4 (RPA-T4), allophycocyanin-Cy7–conjugated anti-CD25 (M-A251), BUV737-conjugated anti-CD8 (SK1), PE-CF594–conjugated anti-CD62L (DREG-56), BV421-conjugated anti-CD127 (HIL-7R-M21), BV650-conjugated anti-CD45RA (HI100), PE-Cy7–conjugated anti-CD14 (MoP9), BV711-conjugated anti–PD-1 (EH12), BB700-conjugated anti-CD19 (SJ25C1), PE-Cy7–conjugated anti-CD80 (L307), APC-Cy7–conjugated anti–HLD-DR (G46-6), BV650-conjugated anti-CD11b (M1/70), BV711-conjugated anti-C86 (2331-FUN-1), APC-R700–conjugated anti-CD274 (MIH1), BV786-conjugated anti-CD206 (19.2), PE-conjugated anti–IL-1RA (AS-17), and BUV395-conjugated anti-CD16 (3G8), and intracellularly stained with allophycocyanin-conjugated anti-Foxp3 (PCH101; eBioscience). The following intracellular antibodies from BD Biosciences were also used: Alexa-488–conjugated anti–IL-4 (8D4-8), PE-conujgated anti–IL-10 (JES3-9D7), APC-R700–conjugated anti–IL-17A (N49-653), BV605-conjugated anti–IFN-γ (B27), BV750-conjugated anti–TNF-α (Mab11), BV786-conjugated anti–CTLA-4 (BNI3), PE-CF594–conjugated anti–TGF-β (TW4-9E7), BV510-conjugated anti–IL-8 (G265-8), and BV421-conjugated anti–IL-1β (H1b-98; BioLegend). A UV-excitable LIVE/DEAD discrimination assay (Invitrogen) was applied. Cells were then analyzed on a FACSAria (BD Biosciences). Data were analyzed using either FlowJo (TreeStar, Inc.) for traditional gating analyses or R/Bioconductor for unsupervised clustering, as detailed in the information to follow. BAL cell ex vivo stimulation. Cells were resuspended in a 96-well U-bottom plate using Iscove’s modified Dulbecco medium (Thermo Fisher) (10% heat-inactivated fetal bovine serum, 1% sodium pyruvate, 1% HEPES, 2 mM GlutaMax, 100 U/mL penicillin/streptomycin, and 50 μM β-mercaptoethanol). For lymphocyte stimulation, cells were stimulated with PMA (40 ng/mL) and ionomycin (500 ng/mL) for a total for 4 hours, and GolgiStop and GolgiPlug (BD Biosciences) were added the last 3 hours. For myeloid stimulation, cells were stimulated with LPS (1 μg/mL) and IFN-γ (100 ng/mL) for a total of 4 hours, with GolgiStop and GolgiPlug added for the last 3 hours. BAL biomarker measurements using Vplex immunoassays. BAL supernatants were used to measure C-reactive protein, eotaxin, eotaxin-3, FGF (basic), GM-CSF, ICAM-1, IFN-γ, IL-1α, IL-1β, IL-2, IL-4, IL-5, IL-6, IL-7, IL-8, IL-8 (HA), IL-10, IL-12 (p40), IL-12 (p70), IL-13, IL-15, IL-16, IL-17A, IL-21, IL-22, IL-23, IL-27, IL-31, IP-10, MCP-1, MCP-4, MDC, MIP-1α, MIP-1β, MIP-3α, PlGF, SAA, TARC, Tie-2, TNF-α, TNF-β, VCAM-1, VEGF-A, VEGF-C, VEGF-D, and VEGFR-1/Flt-1 using Vplex immunoassays (Meso-Scale Discovery), according to the manufacturer’s instructions. Samples were run in duplicate. All BAL supernatants were diluted equivalently, the cytokine results were normalized for the amount of BALF recovered, and the results are thus expressed as micrograms per milliliter of recovered BALF, as per the guidelines for measurement of acellular BALF components (17, 41). Statistics. Unsupervised clustering analysis was conducted using the FlowSOM and flowCore packages in R/Bioconductor (42). Briefly, scaled, transformed MFIs for each cell are used as the coordinates for a data point in n-dimensional space, where n is the number of fluorophores. A self-organizing map of nodes in this space was to maximize similarity within each node. The distances between nodes reflects the degree of similarity between groups of cells. Importantly, MFI is treated as a continuous variable, thus allowing visualization and analysis of cell subsets where a surface marker expression may be intermediate. Further, because this method of analyzing flow cytometry data incorporates the MFIs for each fluorophore for each cell, it allows for greater resolution of differences in cytokine expression in a multiparametric flow cytometric data set. A graphical abstract of the algorithm is provided in Supplemental Figure 1A. All MFI values are compensated, scaled, and transformed as previously described (43, 44). For both T cells (i.e., singlet, live, CD3+ cells) and monocytes/B cells (i.e., singlet, live, CD3–), the cluster map was first constructed on a concatenated data set composed of unstimulated control, stimulated control, unstimulated CIP, and stimulated CIP samples. This concatenated set represents the sum total of biological replicates (n = 18; 6 controls and 12 CIP cases). Next, group comparisons between controls and CIP as well as unstimulated and stimulated samples were made by generating group-specific cluster maps as well as a differential cluster map, where a node was considered to be upregulated if there was a greater than 95% difference between groups. As the initial conditions for the clustering algorithm is randomly chosen, the map shape can differ slightly with each run; each analysis was rerun 5 times to ensure that the same clusters were upregulated across multiple runs (map stability). Lastly, a meta-clustering analysis was performed. This represents an auto-gating strategy where the algorithm attempts to classify cell populations across clusters based on their cytokine profile. The code used to generate the clustering analysis and high-resolution copies of cluster maps are provided in the supplemental data. Scaled, centered values were used to generate the heatmap for BALF cytokine data (gplots package, R). Cytokine profiles were hierarchically clustered (using complete linkage clustering and Euclidean distance). Individual cytokine comparisons were plotted and compared using GraphPad Prism. Two-tailed nonparametric tests (Mann-Whitney) were used to compare mean differences between control and CIP cytokine values. A P value less than 0.05 was accepted as significant. Study approval. IRB and ethical approval as well as consent was obtained for all participants in this study. All human work was approved by the IRB at the Johns Hopkins Hospital. Author contributions KS was responsible for flow cytometric and multiplex experimental design, data processing and statistical analysis, manuscript writing and review, and figure preparation. JN was responsible for study design, IRB and clinical database design/administration, clinical data analysis, and manuscript writing and review. KS, FD, JN, JRB, SKD, M Shafiq, PMF, JM, MVF, LC, M Soloski, and VA were responsible for study design. KS, FD, QZ, YX, TP, AB, JM, MVF, LC, VA, DSE, KAM, RJK, CLH, BL, JLF, CTL, DFK, ADL, HL, M Shafiq, LY, M Soloski, and EJL were responsible for conducting experiments/adjudication of patient data/data acquisition. QZ, YX, TP, KS, FD, and AB were responsible for data analysis. KS, FD, JN, and SKD were responsible for writing the manuscript. All authors reviewed and edited the manuscript. Supplemental material Acknowledgments We wish to thank Naresh Punjabi, Larissa Shimoda, and Mahendra Damarla for their comments on design and interpretation of unsupervised clustering analyses, the Bayview Immunomics Core for their technical expertise with BALF cytokine measurement, and the Bloomberg~Kimmel Institute for Cancer Immunotherapy for research and administrative support. This research supported in part by the National Institutes of Health (NIH HL132055, HL131812), Department of Defense (DoDW81XWH-16-1-0510) and the Bloomberg~Kimmel Institute for Cancer Immunotherapy. Footnotes Conflict of interest: The authors have declared that no conflict of interest exists. Copyright: © 2019, American Society for Clinical Investigation. Reference information: J Clin Invest. https://doi.org/10.1172/JCI128654. References Lipson EJ, Forde PM, Hammers HJ, Emens LA, Taube JM, Topalian SL. Antagonists of PD-1 and PD-L1 in cancer treatment. Semin Oncol. 2015;42(4):587–600. View this article via: PubMed CrossRef Google Scholar Brahmer J, et al. Nivolumab versus docetaxel in advanced squamous-cell non-small-cell lung cancer. N Engl J Med. 2015;373(2):123–135. View this article via: PubMed CrossRef Google Scholar Hellmann MD, et al. Nivolumab plus ipilimumab as first-line treatment for advanced non-small-cell lung cancer (CheckMate 012): results of an open-label, phase 1, multicohort study. Lancet Oncol. 2017;18(1):31–41. View this article via: PubMed CrossRef Google Scholar Balaji A, Verde F, Suresh K, Naidoo J. Pneumonitis from anti-PD-1/ PD-L1 therapy. Oncology (Williston Park, NY). 2017;31(10):739–746, 754. Suresh K, Naidoo J, Lin CT, Danoff S. Immune checkpoint immunotherapy for non-small cell lung cancer: benefits and pulmonary toxicities. Chest. 2018;154(6):1416–1423. View this article via: PubMed CrossRef Google Scholar ARDS Definition Task Force , et al. Acute respiratory distress syndrome: the Berlin Definition. JAMA. 2012;307(23):2526–2533. View this article via: PubMed Google Scholar Khunger M, et al. Incidence of pneumonitis with use of programmed death 1 and programmed death-ligand 1 inhibitors in non-small cell lung cancer: a systematic review and meta-analysis of trials. Chest. 2017;152(2):271–281. View this article via: PubMed CrossRef Google Scholar Forde PM, Chaft JE, Pardoll DM. Neoadjuvant PD-1 blockade in resectable lung cancer. N Engl J Med. 2018;379(9):e14. View this article via: CrossRef Google Scholar Cho JY, et al. Characteristics, incidence, and risk factors of immune checkpoint inhibitor-related pneumonitis in patients with non-small cell lung cancer. Lung Cancer. 2018;125:150–156. View this article via: PubMed CrossRef Google Scholar Suresh K, et al. Pneumonitis in non-small cell lung cancer patients receiving immune checkpoint immunotherapy: incidence and risk factors. J Thorac Oncol. 2018;13(12):1930–1939. View this article via: PubMed CrossRef Google Scholar Naidoo J, et al. A multidisciplinary toxicity team for cancer immunotherapy-related adverse events. J Natl Compr Canc Netw. 2019;17(6):712–720. View this article via: PubMed CrossRef Google Scholar Suresh K, et al. Pneumonitis in non-small cell lung cancer patients receiving immune checkpoint immunotherapy: incidence and risk factors. J Thorac Oncol. 2018;13(12):1930–1939. View this article via: PubMed CrossRef Google Scholar Suresh K, et al. Impact of checkpoint inhibitor pneumonitis on survival in NSCLC patients receiving immune checkpoint immunotherapy. J Thorac Oncol. 2019;14(3):494–502. View this article via: PubMed CrossRef Google Scholar Puzanov I, et al. Managing toxicities associated with immune checkpoint inhibitors: consensus recommendations from the Society for Immunotherapy of Cancer (SITC) Toxicity Management Working Group. J Immunother Cancer. 2017;5(1):95. View this article via: PubMed CrossRef Google Scholar Naidoo J, et al. Pneumonitis in patients treated with anti-programmed death-1/programmed death ligand 1 therapy. J Clin Oncol. 2017;35(7):709–717. View this article via: PubMed CrossRef Google Scholar Tirumani SH, et al. Radiographic profiling of immune-related adverse events in advanced melanoma patients treated with ipilimumab. Cancer Immunol Res. 2015;3(10):1185–1192. View this article via: PubMed CrossRef Google Scholar Meyer KC, et al. An official American Thoracic Society clinical practice guideline: the clinical utility of bronchoalveolar lavage cellular analysis in interstitial lung disease. Am J Respir Crit Care Med. 2012;185(9):1004–1014. View this article via: PubMed CrossRef Google Scholar Lucas M, et al. Ex vivo phenotype and frequency of influenza virus-specific CD4 memory T cells. J Virol. 2004;78(13):7284–7287. View this article via: PubMed CrossRef Google Scholar Agostini C, et al. Involvement of the IP-10 chemokine in sarcoid granulomatous reactions. J Immunol. 1998;161(11):6413–6420. View this article via: PubMed Google Scholar Prasse A, et al. Th1 cytokine pattern in sarcoidosis is expressed by bronchoalveolar CD4+ and CD8+ T cells. Clin Exp Immunol. 2000;122(2):241–248. View this article via: PubMed CrossRef Google Scholar Yamasaki H, Ando M, Brazer W, Center DM, Cruikshank WW. Polarized type 1 cytokine profile in bronchoalveolar lavage T cells of patients with hypersensitivity pneumonitis. J Immunol. 1999;163(6):3516–3523. View this article via: PubMed Google Scholar D’Alessio FR, et al. Resolution of experimental lung injury by monocyte-derived inducible nitric oxide synthase. J Immunol. 2012;189(5):2234–2245. View this article via: PubMed CrossRef Google Scholar Gianchecchi E, Fierabracci A. Inhibitory receptors and pathways of lymphocytes in the role of PD-1 in Treg development and their involvement in autoimmunity onset and cancer progression. Front Immunol. 2018;9:2374. View this article via: PubMed Google Scholar Rowshanravan B, Halliday N, Sansom DM. CTLA-4: a moving target in immunotherapy. Blood. 2018;131(1):58–67. View this article via: PubMed Google Scholar Lopez-Castejon G, Brough D. Understanding the mechanism of IL-1β secretion. Cytokine Growth Factor Rev. 2011;22(4):189–195. View this article via: PubMed CrossRef Google Scholar Cooper AM, Khader SA. IL-12p40: an inherently agonistic cytokine. Trends Immunol. 2007;28(1):33–38. View this article via: PubMed CrossRef Google Scholar D’Andrea A, et al. Production of natural killer cell stimulatory factor (interleukin 12) by peripheral blood mononuclear cells. J Exp Med. 1992;176(5):1387–1398. View this article via: PubMed CrossRef Google Scholar Walter MJ, Kajiwara N, Karanja P, Castro M, Holtzman MJ. Interleukin 12 p40 production by barrier epithelial cells during airway inflammation. J Exp Med. 2001;193(3):339–351. View this article via: PubMed CrossRef Google Scholar Sung JH, et al. Chemokine guidance of central memory T cells is critical for antiviral recall responses in lymph nodes. Cell. 2012;150(6):1249–1263. View this article via: PubMed CrossRef Google Scholar Mannon PJ, et al. Anti-interleukin-12 antibody for active Crohn’s disease. N Engl J Med. 2004;351(20):2069–2079. View this article via: PubMed CrossRef Google Scholar Mayer L, et al. Anti-IP-10 antibody (BMS-936557) for ulcerative colitis: a phase II randomised study. Gut. 2014;63(3):442–450. View this article via: PubMed CrossRef Google Scholar Starner TD, Barker CK, Jia HP, Kang Y, McCray PB. CCL20 is an inducible product of human airway epithelia with innate immune properties. Am J Respir Cell Mol Biol. 2003;29(5):627–633. View this article via: PubMed CrossRef Google Scholar Medoff BD, et al. CD11b+ myeloid cells are the key mediators of Th2 cell homing into the airway in allergic inflammation. J Immunol. 2009;182(1):623–635. View this article via: PubMed CrossRef Google Scholar Ridings PC, et al. A dual-binding antibody to E- and L-selectin attenuates sepsis-induced lung injury. Am J Respir Crit Care Med. 1995;152(1):247–253. View this article via: PubMed CrossRef Google Scholar Seekamp A, Regel G, Rother K, Jutila M. The effect of anti-L-selectin (EL-246) on remote lung injury after infrarenal ischemia/reperfusion. Shock. 1997;7(6):447–454. View this article via: PubMed CrossRef Google Scholar Kolb M, Margetts PJ, Anthony DC, Pitossi F, Gauldie J. Transient expression of IL-1beta induces acute lung injury and chronic repair leading to pulmonary fibrosis. J Clin Invest. 2001;107(12):1529–1536. View this article via: JCI PubMed CrossRef Google Scholar Heffner DK. Treatments for pulmonary sarcoidosis. Respir Med. 2008;102(11):1674. View this article via: PubMed CrossRef Google Scholar Mock JR, et al. Foxp3+ regulatory T cells promote lung epithelial proliferation. Mucosal Immunol. 2014;7(6):1440–1451. View this article via: PubMed CrossRef Google Scholar Singer BD, et al. Regulatory T cell DNA methyltransferase inhibition accelerates resolution of lung inflammation. Am J Respir Cell Mol Biol. 2015;52(5):641–652. View this article via: PubMed CrossRef Google Scholar Puzanov I, et al. Managing toxicities associated with immune checkpoint inhibitors: consensus recommendations from the Society for Immunotherapy of Cancer (SITC) Toxicity Management Working Group. J Immunother Cancer. 2017;5(1):95. View this article via: PubMed CrossRef Google Scholar Haslam PL, Baughman RP. Report of ERS Task Force: guidelines for measurement of acellular components and standardization of BAL. Eur Respir J. 1999;14(2):245–248. View this article via: PubMed Google Scholar R Core Team. R: A language and environment for statistical computing. R Foundation for Statistical Computing, Vienna, Austria. http://www.R-project.org/ Accessed July 11, 2019. Hahne F, et al. flowCore: a Bioconductor package for high throughput flow cytometry. BMC Bioinformatics. 2009;10:106. View this article via: PubMed Google Scholar Van Gassen S, et al. FlowSOM: using self-organizing maps for visualization and interpretation of cytometry data. Cytometry. 2015;87(7):636–645. View this article via: PubMed Google Scholar Version history Version 1 (July 16, 2019): In-Press Preview Version 2 (September 4, 2019): Electronic publication
|
|
Scooped by
Gilbert C FAURE
August 6, 2019 5:13 AM
|
Research ArticleImmunologyInflammation Free access | 10.1172/JCI127542 TLR9 signaling in fibroblastic reticular cells regulates peritoneal immunity Li Xu,1,2 Yiming Li,1,3 Chenxuan Yang,1,4 Patricia Loughran,1,5 Hong Liao,1 Rosemary Hoffman,1 Timothy R. Billiar,1 and Meihong Deng1 First published August 5, 2019 - More info Abstract Fibroblastic reticular cells (FRCs), a subpopulation of stromal cells in lymphoid organs and fat-associated lymphoid clusters (FALCs) in adipose tissue, play immune-regulatory roles in the host response to infection and may be useful as a form of cell therapy in sepsis. Here, we found an unexpected major role of TLR9 in controlling peritoneal immune cell recruitment and FALC formation at baseline and after sepsis induced by cecal ligation and puncture (CLP). TLR9 regulated peritoneal immunity via suppression of chemokine production by FRCs. Adoptive transfer of TLR9-deficient FRCs more effectively decreased mortality, bacterial load, and systemic inflammation after CLP than WT FRCs. Importantly, we found that activation of TLR9 signaling suppressed chemokine production by human adipose tissue–derived FRCs. Together, our results indicate that TLR9 plays critical roles in regulating peritoneal immunity via suppression of chemokine production by FRCs. These data form a knowledge basis upon which to design new therapeutic strategies to improve the therapeutic efficacy of FRC-based treatments for sepsis and immune dysregulation diseases. Graphical Abstract Introduction Sepsis is now the leading cause of death in US hospitals and is projected to account for more than 5 million deaths globally each year (1–3). Currently, no effective treatments for sepsis are available. With an improved understanding of the overall disease process, scientists have developed single molecule–targeted therapies that modulate the activity of a specific pathway of the innate immune system, such as TLRs and proinflammatory cytokines. Clinical trials testing these agents have yielded little or no success, most likely due to the complex, multifaceted, and redundant nature of the host response to sepsis (4). Recently, this has led to a focus on cell-based therapies, founded on the notion that cells with immune-regulatory properties would improve outcomes in sepsis by influencing many different cells and molecular events (5, 6). Fibroblastic reticular cells (FRCs), characterized as CD45–, CD31–, and podoplanin+ (PDPN+), are a unique subpopulation of stromal cells in lymphoid organs, such as lymph nodes and fat-associated lymphoid clusters (FALCs) (7, 8). FRCs are essential for the formation of lymphoid organs, as they fashion the scaffolding that recruits and supports immune cells (9–16). Besides their structural functions, FRCs have been recognized as major regulators of both innate and adaptive immunity in response to microbial pathogen invasion through interactions with neighboring immune cells within lymphoid tissues (9, 10, 14, 17). A single injection of ex vivo–expanded allogeneic lymph node–derived FRCs reduced mortality in cecal ligation and puncture–induced (CLP-induced) sepsis (17). FRCs are therefore attractive candidates for use as cell-based therapy in sepsis. A greater understanding of the cellular and molecular mechanisms of the effects of FRC in both health and disease may lead to more effective therapies employing modified FRCs. Previous studies have shown that genetically and pharmacologically blocking TLR9 alleviates inflammation, organ damage, and mortality in mouse polymicrobial sepsis models (18–20). However, the mechanisms underlying the protective roles of TLR9 inhibition are unclear. A recent study in rodents demonstrated that FRCs in FALCs drive protective immunity in a myeloid differentiation primary response 88–dependent (MyD88-dependent) manner (14). TLR2 and TLR4 signaling via MyD88 play roles in the regulation of immunomodulatory functions of FRCs and enable them to orchestrate peritoneal immunity in mouse Salmonella infection (14). MyD88 is an important downstream adapter protein for many TLR- and cytokine-signaling pathways (e.g., TNF and IL-1) (21, 22). TLR9 is known to signal through MyD88 (21, 22); however, the role of TLR9 in regulating FRC function remains unknown. In this study, we show that blocking TLR9 signaling increases peritoneal immune cell recruitment and FALC formation. TLR9 regulation of peritoneal immunity occurs via suppression of chemokine expression in FRCs. These findings not only address our knowledge gaps regarding the detrimental roles of TLR9 in sepsis, but also identify an unsuspected role for TLR9 in baseline FRC function and in peritoneal responses to bacterial infection. Modulating TLR9 signaling could improve the therapeutic efficacy of FRC-based sepsis therapies. Results TLR9 controls peritoneal immunity at baseline and during sepsis. We first confirmed the findings of others that genetically or pharmacologically blocking TLR9 reduces bacterial load, inflammation, and mortality in mouse polymicrobial sepsis (Figure 1, A–E; supplemental material available online with this article; https://doi.org/10.1172/JCI127542DS1; refs. 18–20). However, the mechanisms underlying the protection resulting from TLR9 suppression in sepsis are unclear. Recruitment of immune cells to infectious foci is an essential mechanism for peritoneal immunity and is critical for early bacterial clearance as well as prevention of an excessive inflammatory response (23, 24). Previous studies have reported that blocking TLR9 signaling increases immune cell recruitment into the peritoneal cavity after CLP (20). Here, we observed that total peritoneal cell counts were significantly higher in Tlr9CpG1/CpG1 mutant mice and global Tlr9–/– mice compared with WT mice at baseline and after CLP (Supplemental Figure 1F). These data suggest that TLR9 may regulate host defense via modulation of peritoneal immunity. To understand the basis of TLR9 in the regulation of peritoneal immunity, we analyzed the cellular composition and TLR9 expression patterns in cells of the peritoneum. Peritoneal cell components were heterogenous at baseline and after CLP and included B cells, T cells, neutrophils, macrophages, and dendritic cells (DCs) (Figure 1A). At baseline, B cells were the dominant cell type, while neutrophils were recruited in large numbers after CLP and became the dominant cell type in the peritoneal cavity (Figure 1A). B cells, DCs, and macrophages expressed TLR9 (Figure 1B). However, the expression levels of TLR9 in DCs and macrophages significantly decreased after CLP compared with control levels (Figure 1B). The expression of TLR9 in T cells and neutrophils was undetectable by flow cytometry (Supplemental Figure 2). We next assessed the number of each cell type in peritoneal cavities of WT and Tlr9–/– mice using flow cytometry. Unexpectedly, numbers of all cell types were significantly higher in Tlr9–/– mice compared with WT mice before and after CLP (Figure 1, C–G). These data indicate that TLR9 controls the recruitment of not just one specific cell type, but all types of immune cells, into the peritoneal cavity at baseline and during sepsis. Figure 1 TLR9 controls peritoneal immunity at baseline and during sepsis. WT and Tlr9–/– mice were subjected to CLP. PLF was collected at 18 hours after CLP. (A) Percentages of indicated immune cells were measured by flow cytometry. (B) TLR9 expression in indicated peritoneal cells. MFI for TLR9 expression was measured by flow cytometry. (C–G) Peritoneal cell counts of (C) B cells, (D) macrophages, (E) DCs, (F) neutrophils, and (G) T cells in control and after CLP. Data are shown as mean ± SD from 2 separate experiments. Symbols represent individual mice. *P < 0.05; **P < 0.01; ***P < 0.001, unpaired, 2-tailed Student’s t tests. B cells are required for the protective effects of Tlr9–/– mice during sepsis. The above data indicate that B cells are the dominant cell type in the peritoneal cavity at baseline. Furthermore, peritoneal B cells highly express TLR9 before and after CLP. B-1 cells, an innate-like B cell population, predominantly reside in body cavities and spontaneously secrete IgM as part of first-line host defenses against invading microorganisms (25–28). Consistent with the increased peritoneal B cell numbers in Tlr9–/– mice, peritoneal B-1 cell numbers and peritoneal IgM levels were significantly higher in Tlr9–/– mice compared with WT mice at baseline and after CLP (Figure 2, A–C). Upon activation, B-1 cells increase the production of cytokines such as GM-CSF to modulate macrophage and neutrophil functions (29). We observed that circulating and peritoneal GM-CSF levels were not detectable in control mice. However, peritoneal GM-CSF levels were significantly higher in Tlr9–/– mice compared with WT mice after CLP (Figure 2D). Circulating IgM and GM-CSF levels did not significantly differ between WT and Tlr9–/– mice at baseline or after CLP, suggesting that TLR9 had a local regulatory effect on peritoneal B-1 cells (Figure 2, B–D). To determine whether peritoneal B cells are required for the protective effects of TLR9 inhibition in sepsis, peritoneal B cells were depleted with CD19-neutralizing antibodies (Supplemental Figure 3). CD19-neutralizing antibodies significantly increased mortality and peritoneal bacterial load after CLP in Tlr9–/– mice compared with control IgG pretreatment (Figure 2, E and F). Peritoneal IgM levels were inversely correlated to bacterial load (Figure 2G). These results indicate that peritoneal B cells are required for the protective effects resulting from TLR9 deletion in sepsis. Figure 2 B cells are required for the protective effects of Tlr9–/– mice during sepsis. (A–D) WT and Tlr9–/– mice were subjected to CLP. Plasma and PLF were collected at 18 hours after CLP. (A) Peritoneal B-1 cell numbers. (B) Plasma IgM levels. (C) Peritoneal IgM levels. (D) Peritoneal GM-CSF levels. (E–G) Tlr9–/– mice were treated with CD19 neutralizing antibodies (10 mg/mouse) or control IgG (10 mg/mouse) at 24 hours before CLP. PLF was collected at 18 hours after CLP. (E) Seven-day survival after CLP. Data are from 2 separate experiments. n = 10. *P < 0.05, log-rank test. (F) Bacterial clearance in PLF. Data are from 2 separate experiments. Symbols represent individual mice. *P < 0.05, nonparametric Mann-Whitney U test. (G) Peritoneal IgM levels. For A–D and G, data are shown as mean ± SD from 2 separate experiments. Symbols represent individual mice. *P < 0.05; **P < 0.01; ***P < 0.001, unpaired, 2-tailed Student’s t test. TLR9 inhibits peritoneal B cell recruitment via suppressing CXCL13 production. We next tested whether TLR9 regulates B cell recruitment into the peritoneal cavity. CXCL13 is a selective B cell–attracting chemokine (30, 31). Notably, peritoneal CXCL13 levels in Tlr9–/– mice were significantly higher than in WT mice at baseline and after CLP (Figure 3A), suggesting that TLR9 may regulate peritoneal B cell recruitment via modulation of CXCL13 production. To determine whether CXCL13 is necessary for the protective effects of TLR9 in sepsis, WT and Tlr9–/– mice were treated with CXCL13-neutralizing antibodies and subjected to CLP. As expected, treatment with CXCL13-neutralizing antibodies significantly decreased peritoneal B-1 cell numbers and IgM levels in both WT and Tlr9–/– mice (Figure 3, B and C). Consistently, treatment with CXCL13-neutralizing antibodies also significantly impaired bacterial clearance and increased circulating IL-6 levels compared with control IgG treatment (Figure 3, D and E). Notably, treatment with CXCL13-neutralizing antibodies significantly increased mortality in Tlr9–/– mice compared with IgG treatment (Figure 3F). Furthermore, the addition of recombinant CXCL13 significantly increased peritoneal B-1 cell numbers and IgM levels in WT mice after CLP (Figure 3, G and H). Importantly, the addition of CXCL13 in WT mice significantly reduced bacterial load, circulating IL-6 levels, and mortality compared with PBS control treatment (Figure 3, I–K). These results indicate that TLR9 inhibits peritoneal B cell recruitment via the suppression of CXCL13 production during sepsis. Figure 3 TLR9 inhibits peritoneal B cell recruitment via suppressing CXCL13 production. (A) WT and Tlr9–/– mice were subjected to CLP. PLF was collected at 18 hours after CLP. Peritoneal CXCL13 levels were assessed using ELISA. (B–F) WT and Tlr9–/– mice were treated with CXCL13 neutralizing antibodies (10 mg/mouse) or control IgG (10 mg/mouse) immediately after CLP. PLF and plasma were collected at 18 hours after CLP. (B) Peritoneal B-1 cell numbers. (C) Peritoneal IgM levels. (D) Bacterial load in PLF. (E) Plasma IL-6 levels. (F) Seven-day survival. For A–C and E, data are shown as mean ± SD. Symbols represent individual mice. *P < 0.05; **P < 0.01, unpaired, 2-tailed Student’s t tests. For D, symbols represent individual mice. *P < 0.05, nonparametric Mann-Whitney U test. For F, n = 13–19/group as indicated. *P < 0.05 versus Tlr9–/– IgG, log-rank test. (G–K) WT mice were treated with recombinant CXCL13 (10 mg/mouse) or PBS immediately after CLP. (G) Peritoneal B-1 cell number. (H) Peritoneal IgM levels. (I) Bacterial load in PLF. (J) Plasma IL-6 levels. (K) Seven-day survival. For G, H, and J, data are shown as mean ± SD. Symbols represent individual mice. *P < 0.05, unpaired, 2-tailed Student’s t test. For I, symbols represent individual mice. *P < 0.05, nonparametric Mann-Whitney U test. For K, n = 10/group. *P < 0.05, log-rank test. TLR9 in B cells does not account for the detrimental effects of TLR9 observed in sepsis. The above results indicate that B cells are required for the more efficient bacterial clearance observed in Tlr9–/– mice during sepsis. To determine whether TLR9 expressed by B cells is required for either B cell recruitment or function, we generated B cell–specific Tlr9–/– (Cd19-Tlr9–/–) mice. Deletion of Tlr9 in B cells was confirmed using flow cytometry (Supplemental Figure 4). There were no significant differences between Cd19-Tlr9–/– mice and the control Tlr9loxp/loxp (flox) mice in bacterial clearance, peritoneal total cell count, B cell counts, and B-1 cell counts, or systemic and peritoneal IgM levels following CLP (Supplemental Figure 5, A–F). Importantly, Tlr9 deletion in B cells did not affect CLP-induced increases in Cxcl13 production compared with WT mice (Supplemental Figure 5G). To further test the role of TLR9 in B-1 cell function, peritoneal B-1 cells were sorted from WT and Tlr9–/– mice and treated with or without a TLR9 agonist (ODN1585) and/or the TLR4 agonist LPS for 18 hours. We did not observe a significant difference in media IgM levels between WT and Tlr9–/– B-1 cell cultures (Supplemental Figure 5H), suggesting that TLR9 did not regulate IgM secretion from B-1 cells. Together, these data indicate that, while B-1 cells are required for the improved bacterial clearance observed in Tlr9-deficient mice, TLR9 in B cells does not contribute the antimicrobial functions of B-1 cells during peritoneal sepsis. TLR9 inhibits CXCL13 expression in FRCs in mesenteric adipose tissues. The above results indicate that TLR9 inhibits peritoneal B cell recruitment via suppression of CXCL13 production; however, how TLR9 regulates peritoneal CXCL13 levels is unclear. CXCL13 is expressed in multiple cell types other than B cells (32), including DCs (33), macrophages (34), and FRCs in FALCs (9) and lymph nodes (35). We first tested to determine whether TLR9 regulated CXCL13 production from cells in the peritoneal cavity or cells from FALCs in mesenteric adipose tissues. Peritoneal cells and mesenteric adipose tissues were isolated from WT and Tlr9–/– mice before and after CLP. Cxcl13 expression levels, assessed by PCR, in peritoneal cells did not significantly differ between WT and Tlr9–/– mice before or after CLP (Figure 4A). However, the expression of Cxcl13 in mesenteric adipose tissues was significantly higher in Tlr9–/– mice than in WT mice before and after CLP (Figure 4B). These data suggest that TLR9 may regulate CXCL13 production from FALCs in mesenteric adipose tissues. To further identify the cell type in which TLR9 regulated CXCL13 production, mesenteric adipose tissues from WT and Tlr9–/– mice were isolated and subjected to immunofluorescence staining for CXCL13 as well as cell-specific markers (CD45 for hematopoietic cells including macrophages, T cells, B cells, and DCs; CD11c for DCs). CXCL13 rarely colocalized with CD45+ immune cells or CD11+ DCs (Figure 4C), suggesting that nonimmune cells in FALCs were a major source of CXCL13. FRCs, a subpopulation of stromal cells in FALCs, have been shown to express CXCL13 (9). To determine the role of TLR9 in the regulation of CXCL13 expression in FRCs, WT and Tlr9–/– FRCs were isolated from mesenteric adipose tissues and expanded ex vivo (Supplemental Figure 6). We found that FRCs constitutively expressed TLR9 (Supplemental Figure 6). Notably, Cxcl13 expression was significantly downregulated in FRCs after stimulation with all 3 classes of TLR9 agonists (class A, ODN1585; class B, ODN1826; class C, ODN2395) compared with control (Figure 4D), while Cxcl13 expression was not significantly downregulated after LPS (a TLR4 ligand) or Poly I:C (PIC) (a TLR3 ligand) stimulation (Figure 4D). Deletion of Tlr9 in FRCs abrogated the suppressive effects of CpG1585 in Cxcl13 expression (Figure 4E). These data reveal an unrecognized role of TLR9 in the regulation of FRC chemokine production. Figure 4 TLR9 inhibits CXCL13 expression in FRCs in mesenteric adipose tissues. (A–C) WT and Tlr9–/– mice were subjected to CLP. PLF and mesenteric adipose tissue were collected at18 hours after CLP. (A and B) Cxcl13 expression in peritoneal cells (A) and mesenteric adipose tissue (B) were assessed using quantitative PCR. Data are shown as mean ± SD from 2 separate experiments. Symbols represent individual mice. *P < 0.05, 2-tailed Student’s t test. (C) Immunofluorescence staining of CXCL13 (red), CD45 (green), CD11c (white), and nucleus (blue) in mesenteric adipose tissue. Scale bar: 5 μm. (D and E) Cxcl13 expression in mouse FRCs. WT and Tlr9–/– FRCs were isolated from mesenteric adipose tissues and expanded ex vivo. FRCs were stimulated with indicated TLR ligands (ODN1585, 5 μM; ODN1826, 5 μM; ODN2395, 5 μM, LPS, 1 μg/mL; PIC, 20 μg/mL) for 18 hours. Cxcl13 expression was assessed using quantitative PCR. Data are shown as mean ± SD from 1 representative experiment. Experiments were performed 3 times. *P < 0.05; **P < 0.01; ***P < 0.001, 1-way ANOVA with Bonferroni’s post hoc analysis. TLR9 regulates peritoneal immunity via modulation of chemokine expression in FRCs. We next tested whether TLR9 also regulated chemokine expression in FRCs for the recruitment of other cell types in the peritoneal cavity. Cultured WT FRCs were stimulated with ODN1585, LPS, PIC, and ODN1585+LPS for 18 hours. The expression of chemokines in FRCs was assessed using quantitative PCR. Notably, activation of TLR9 signaling in FRCs with ODN1585 significantly reduced the expression of chemokines known to attract neutrophils (Cxcl2 and Cxcl5), monocytes (Cxcl3 and Ccl2), DCs (Ccl19 and Ccl2), and lymphocytes (Cxcl13, Ccl19, and Ccl21) (Figure 5A). The expression of Cxcl13, Cxcl3, and Ccl19 decreased dramatically after the addition of TLR9 agonists (Figure 5A). In contrast, stimulation with LPS increased the expression of Cxcl13, Cxcl5, Cxcl2, Cxcl3, Ccl19, and Ccl2 in FRCs (Figure 5A), while stimulation with PIC increased the expression of Cxcl2, Cxcl3, Ccl19, Ccl21 and Ccl2 in FRCs (Figure 5A). These data suggest that individual TLRs play unique roles in regulating FRC responses to immune stimulators. Surprisingly, addition of ODN1585 suppressed LPS-induced Cxcl5 expression in FRCs in a dose-dependent manner (Figure 5B). Furthermore, addition of ODN1585 suppressed the LPS-induced upregulation of Cxcl13, Cxcl5, Cxcl2, Cxcl3, and Ccl2 expression in FRCs (Figure 5C). These data suggest a dominant role for TLR9 in FRCs that reside within the FALCs in the peritoneal cavity. Figure 5 TLR9 regulates peritoneal immunity via modulation of chemokine expression in FRCs. (A–C) Chemokine expression in mouse FRCs. WT FRCs were isolated from mesenteric adipose tissues and expanded ex vivo. FRCs were stimulated with indicated TLR ligands (ODN: ODN1585, 5 μM; LPS, 1 μg/mL; PIC, 20 μg/mL; ODN+LPS: ODN1585, 5 μM +LPS, 1 μg/mL) for 18 hours. Indicated chemokine expression was assessed using quantitative PCR. Data are shown as mean ± SD from 1 representative experiment. Experiments were performed 3 times. *P < 0.05; **P < 0.01; ***P < 0.001, 1-way ANOVA with Bonferroni’s post hoc analysis. #, not detectable. (D) FALCs in mesenteric adipose tissue were stained with 0.05% Toluidine Blue. Arrows indicate representative FALCs. Scale bar: 1 mm. (E) Total cell counts in mesenteric FALCs were measured using Cellometer. Data are shown as mean ± SD from 2 separate experiments. Symbols represent individual mice. *P < 0.05 vs. WT, 2-tailed Student’s t test. (F) B-1 cell counts in mesenteric FALCs were measured using flow cytometry. Data are shown as mean ± SD from 2 separate experiments. Symbols represent individual mice. *P < 0.05, 1-way ANOVA with Bonferroni’s post hoc analysis. As FRCs have been shown to play essential roles in the formation of FALCs during the activation of host defenses, we next tested to determine whether TLR9 regulated FALC formation. Interestingly, the formation of FALCs as well as FALC total cell count in mesenteric adipose tissue was significantly higher in Tlr9–/– mice compared with WT mice at baseline and after CLP (Figure 5, D and E). It is known that B-1 cells migrate to FALC via CXCL13 during inflammation and thus are retained in the peritoneal cavity (9). Consistently, B-1 cell numbers in FALC increased significantly in both mouse strains after CLP compared with control (Figure 5F). Furthermore, B-1 cell numbers in FALC were significantly higher in Tlr9–/– mice compared with WT mice at baseline and after CLP (Figure 5F). These findings indicate that TLR9 plays critical roles in controlling peritoneal immunity and that the mechanisms are mediated via suppression of chemokine expression in FRCs for immune cell recruitment and FALC formation. Blocking TLR9 signaling in FRCs increases the efficiency of FRC-based therapy for sepsis. A recent study showed that a single adoptive transfer of FRCs (106/mouse) improved survival after CLP (17). Our data indicate that TLR9 negatively regulates the establishment of peritoneal immunity via suppressing chemokine production in FRCs. Therefore, we hypothesized that blocking TLR9 signaling in FRCs may increase the efficiency of FRC-based therapy for sepsis. To test our hypothesis, WT mice were injected i.p. with WT or Tlr9–/– FRCs (2 × 10⁵/ mouse) at an early time point (1 hour) or a late time point (12 hours) after CLP (Figure 6A). Adoptive transfer of this low number of WT FRCs at 1 hour after CLP only slightly reduced peritoneal bacterial load and IL-6 levels compared with PBS control (Figure 6, B and C). Furthermore, there was no significant difference in mortality between mice receiving adoptive transfer of WT FRCs and mice injected with PBS (Figure 6, D and E). Surprisingly, adoptive transfer of the same low number of Tlr9–/– FRCs at 1 hour after CLP significantly reduced peritoneal bacterial load and circulating IL-6 levels compared with PBS control (Figure 6, B and C). Notably, both early (1 hour after CLP) and late (12 hours after CLP) treatment with Tlr9–/– FRCs significantly reduced mortality compared with PBS control (Figure 6, D and E). These results support the idea that blocking TLR9 signaling in FRCs improves the efficiency of FRC-based therapy for sepsis. Figure 6 Blocking TLR9 signaling in FRCs increases the efficiency of FRC-based therapy for sepsis. (A) Schematic timeline of experimental set and analysis for adoptive transfer studies. (B and C) Mice were subjected to CLP. WT or Tlr9–/– FRCs (2 × 10⁵/ mouse) were injected i.p. at 1 hour after CLP. (B) Bacterial load in PLF at 18 hours after CLP. (C) Circulating IL-6 levels at 18 hours after CLP. Data are shown as mean ± SD from 2 separate experiments. *P < 0.05, unpaired, 2-tailed Student’s t test. (D and E) Seven-day survival. (D) Mice were subjected to CLP. PBS, WT, or Tlr9–/– FRCs (2 × 10⁵/ mouse) were injected i.p. 1 hour after CLP. n = 13 in PBS group; n = 19 in WT FRC group; n = 22 in Tlr9–/– FRC group. (E) Mice were subjected to CLP. PBS, WT, or Tlr9–/– FRCs (2 × 10⁵/ mouse) were injected i.p. at 12 hours after CLP. n = 10 in PBS group; n = 14 in WT FRC group; n = 15 in Tlr9–/– FRC group. *P < 0.05 vs. PBS, log-rank test. Data are from 3 separate experiments for D and 2 separate experiments for E. Statistical differences were determined using the log-rank test. TLR9 signaling suppresses chemokine production in human adipose tissue–derived FRCs. The above results indicate that TLR9 signaling regulates peritoneal immunity via suppression of chemokine production in FRCs in a mouse model. To determine whether TLR9 signaling also regulates human FRC functions, we first tested whether FRCs are present in human adipose tissue. We successfully isolated FRCs from lipoaspirates human adipose tissue and expanded these ex vivo (Figure 7A). Human adipose tissue–derived FRCs also expressed TLR9 (Figure 7A). Importantly, we found that chemokine expression in human FRCs was significantly downregulated after class A TLR9 agonist (ODN2216) stimulation (Figure 7B). Therefore, our findings may provide a knowledge foundation for the FRC-based treatment of human sepsis. Figure 7 TLR9 signaling suppresses chemokine production in human adipose tissue–derived FRCs. Human FRCs were isolated from adipose tissue and expanded ex vivo. (A) TLR9 expression in human FRCs. TLR9 expression was assessed using flow cytometry. Numbers indicate percentage of FRCs (CD45–CD31–PDPN+). (B) Chemokine expression in human FRCs. FRCs were stimulated with indicated TLR ligands (ODN2216, 5 μM; LPS, 1 μg/mL; PIC, 20 μg/mL) for 18 hours. Indicated chemokine expression was assessed using quantitative PCR. Data are shown as mean ± SD from 1 representative experiment. Experiments were performed 3 times. *P < 0.05; **P < 0.01; ***P < 0.001, 1-way ANOVA with Bonferroni’s post hoc analysis. Discussion In studies aimed at understanding the detrimental roles of TLR9 in the host response to i.p. sepsis, we uncovered the finding that TLR9 plays critical roles in regulating peritoneal immunity via suppression of chemokine production in FRCs at baseline and during polymicrobial sepsis (Figure 8). Specifically, we discovered that FRCs constitutively express TLR9 and that activation of TLR9 signaling in FRCs suppresses the expression of chemokines, such as Cxcl13, Ccl19, Ccl21, Cxcl2, Cxcl5, Cxcl3, and Ccl2, which are essential for recruiting B cells, T cells, monocytes, and neutrophils into the peritoneal cavity as well as driving the formation of FALCs (Figure 8). The important regulatory role of TLR9 in FRCs was confirmed in FRCs derived from human adipose tissue. Furthermore, our data indicate that adoptive transfer of low numbers of Tlr9–/– FRCs protects mice from sepsis lethality. These findings unravel the mechanisms of protection against sepsis lethality previously observed with TLR9 inhibition and strongly suggest that DNA sensing through TLR9 by FRCs is an important regulatory step in controlling FALC formation and the trafficking of cells into the peritoneal cavity. Figure 8 Schematic representation of TLR9 regulates peritoneal immunity via suppression of chemokine production by FRCs during polymicrobial sepsis. Activation of TLR9 signaling in FRCs suppresses the production of chemokines, which are essential for recruiting B cells, T cells, macrophages, and neutrophils into the peritoneal cavity as well as driving the formation of FALCs. While it has been suspected that one possible mechanism underlying the detrimental roles of TLR9 in sepsis is impaired leukocyte recruitment into the peritoneal cavity (19, 20), we show here that deficiency of TLR9 generally increases the numbers of all peritoneal cell types, including B cells, T cells, neutrophils, macrophages, and DCs, as well as the formation of FALCs before and after CLP. Neutrophils are responsible for early bacterial clearance and, not surprisingly, have been shown to be necessary for the protective effects of TLR9 inhibition in CLP-induced sepsis (20). We show that peritoneal neutrophils express very low levels of TLR9 before and after CLP, which excludes the possibility that TLR9 in neutrophils directly regulates neutrophil function or recruitment. While B cells express abundant TLR9, deletion of Tlr9 specifically in B cells did not mimic the effects of global Tlr9 deletion at baseline or after CLP. DCs have been shown to produce chemokines that regulate neutrophil influx into tissues, including the peritoneum, and are known to express TLR9 (36). A previous study showed that deletion of TLR9 results in a higher number of peritoneal DCs after CLP (20). However, we found no role for TLR9 in the regulation of chemokine production by immune cells inside the peritoneal cavity and showed that DCs were not a major source of CXCL13 in FALC. In the setting of massive infections, as seen during the tissue necrosis and fecal contamination that occurs in the CLP model (as would be seen in gastrointestinal perforations in humans), it is likely that many pathogen-associated molecular patterns (PAMPs) are released, and these should activate other pattern recognition receptors that can drive immune responses in the peritoneum. For example, we have shown that TLR4 activation on DCs induces a robust IL-10 response (37). Our findings point to a dominant role for TLR9 in FRCs that reside with the FALCs in the peritoneal cavity. While TLR9 stimulation suppresses chemokine production by FRC, agonists that activate TLR3 or -4 enhanced chemokine production in these same cells. Notably, activation of the TLR9 signaling pathway markedly suppressed LPS-induced chemokine production by FRCs. Why TLR9 responses take priority within the FRC TLR signaling hierarchy at baseline and during CLP is not clear. Peritoneal B cells, including B-1 cells, express abundant TLR9 and were the dominant cell type in the peritoneal cavity at baseline. B-1 cells are an innate-like B cell population predominantly residing in body cavities. These cells spontaneously produce most of the natural IgM antibodies required for pathogen opsonization and clearance (25–28). Our data indicate that peritoneal B cell and B-1 cell numbers, as well as associated peritoneal IgM levels, were markedly higher in Tlr9–/– mice compared with WT mice, and deletion of B cells reversed the protective effects of TLR9 deletion in CLP sepsis. The impact of TLR9 on B cell trafficking and B-1 cell function was not due to the activation of TLR9 in B cells, but instead mediated through the negative regulation of the critical B cell chemokine CXCL13 in FRCs. This was surprising considering the known roles of TLR9 in the regulation of B cell responses in other disease states, such as autoimmunity (38, 39), but here again, the CLP model results in the massive and acute release of many immune activators locally and systemically that may directly or indirectly regulate B cell responses. Although the numbers of peritoneal B-1 cells in Tlr9–/– mice decreased after CLP, peritoneal IgM levels markedly increased in Tlr9–/– mice after CLP compared with in controls. The decrease of B-1 cell numbers in the peritoneal cavity may be the result of B-1 cell migration to FALCs. B-1 cells are known to migrate to FALCs through CXCL13 and therefore are retained in the peritoneal cavity during inflammation (9). Consistent with this possibility, our data indicate CXCL13 expression in Tlr9–/– mesenteric adipose tissue was markedly higher compared with that in adipose tissue from WT mice after CLP. This was associated with enhanced FALC formation as well as markedly higher total cell numbers and B-1 cell numbers in FALC. The higher B-1 cell numbers in Tlr9–/– FALCs correlate with the higher levels of IgM in peritoneal cavities in Tlr9–/– mice compared with WT mice after CLP. The highly selective and major role for TLR9 on the FRCs in regulating the trafficking of peritoneal cells including B cells is surprising. FRCs are a unique subpopulation of stromal cells that build the scaffolding for lymphoid organs, including lymph nodes and FALCs (7, 8, 13). Recently, FRCs have been recognized as major regulators of both innate and adaptive immunity in response to microbial pathogen invasion through interactions with neighboring immune cells within lymphoid tissues (9, 10, 14) as well as through the production of high levels of inflammatory cytokines and chemokines (7, 8). Mesenteric adipose tissue–derived FRCs have been shown to regulate inflammatory monocyte recruitment as well as the number of antibody-secreting B cells in the peritoneal cavity in a MyD88-dependent manner (14). TLR4 and TLR2 have been implicated in the regulation of immunomodulating functions of FRCs (14). However, the roles of individual TLR signaling in regulating FRC functions are unclear, and differential TLR/MyD88 signaling may have varying and even antagonistic effects (38–41). We observed marked increases in chemokine expression in FRCs after treatment with a TLR4 agonist, which can signal through MyD88 and Trif. Furthermore, we also found that stimulation with a TLR3 agonist (PIC), which signals through Trif, could increase chemokine expression in FRCs. However, activation of TLR9/MyD88 signaling with ODN1585 markedly suppressed chemokine expression in FRCs. The divergence of chemokine expression in response to TLR4 and TLR9 may be due to different signaling pathways downstream of MyD88. Furthermore, our data suggest that TLR9 signaling interacts with TLR4 signaling to control the chemokine production by FRCs. However, details on the TLR4 and TLR9 signaling pathways in FRCs require further study. The benefits to the host for TLR9 signaling to impair chemokine production through endosomal DNA sensing is unclear. However, the strong evidence that this inhibition takes place at baseline and in the absence of infections suggests that the role of TLR9 may be more important to suppressing chemokine production at baseline to prevent an overproduction of chemokines by the stroma in the resting state. The source of the DNA that drives this signaling is not revealed by our work, but could include dying cells or microbes. Stromal cell–based therapy has been shown to have beneficial effects on various immune dysregulation diseases experimentally and clinically (6). However, the quantity of stromal cells required for therapeutic efficacy ranges from 2.5 × 10⁵ cells/mouse to 40 × 106 cells/mouse in mouse sepsis models (6). The large numbers of stromal cells required for achieving therapeutic efficacy are not always available clinically. Therefore, new strategies are needed to improve the efficacy of stromal cell–based therapy. Lymph node–derived FRC transplant (1 × 10⁶/mouse) reduced circulating bacterial load and mortality in murine sepsis, which promises a possible FRC-based therapy for sepsis (17). However, the source of lymph node–derived FRCs is limited. Here we have shown that survival and bacterial clearance are improved in mice receiving adoptive transfer of relatively low numbers of Tlr9–/– FRCs (2 × 10⁵ cells/mouse). Importantly, we identified FRCs in human adipose tissue from lipoaspirates. TLR9 also negatively regulates chemokine expression in human adipose tissue–derived FRCs. Large numbers of adipose FRCs can be easily obtained from lipoaspirates or during abdominal operations on healthy donors and rapidly expanded in vitro to generate a clinically effective number of FRCs. Therefore, adipose-derived FRCs are a potential source of cells for cell-based treatments. In conclusion, we have provided compelling evidence showing that TLR9 plays critical roles in the regulation of peritoneal immunity for host defense. The mechanism underlying the regulation of TLR9 in peritoneal immunity occurs via suppression of chemokine expression in FRCs. These data address knowledge gaps on the mechanisms of TLR9 regulation of FRC pathobiology for host defense during sepsis. Finally, identification of human adipose tissue–derived FRCs and recognition of TLR9 in the regulation of chemokine expression in human FRCs provides a knowledge foundation for translating our findings into therapies for human sepsis. Methods Reagents. LPS-EK (LPS from E. coli K12), PIC low molecular weight (LMW), Mouse TLR9 Agonist Kit, and Human TLR9 Agonist Kit were purchased from InvivoGen. Mouse CXCL13/BLC/BCA-1 antibody, recombinant mouse CXCL13/BLC/BCA-1 protein, and normal goat IgG control were from R&D Systems. Anti-mouse CD19 neutralizing antibody (clone 1D3) and rat IgG2a isotype control (clone 2A3) were obtained from Bio X Cell. Mice. WT C57BL/6 mice and Cd19tm1(cre)Cgn/J mice were purchased from the Jackson Laboratory. Tlr9–/– mice and Tlr9loxp/loxp (Flox) mice (42) on a C57BL/6 background were a gift from Mark J. Shlomchik (Department of Immunology, University of Pittsburgh). Tlr9CpG1/CpG1 mutant mice (43) on a C57BL/6 background were a gift from Bruce Beutler (Center for the Genetics of Host Defense, UT Southwestern Medical Center, Dallas, Texas, USA). Tlr9–/– mice, Tlr9fl/fl mice, and Tlr9CpG1/CpG1 mutant mice were bred in our animal facility. Tlr9fl/fl mice were interbred with heterozygous stud males to generate B cell–specific TLR9-deficient mice (Tlr9loxP/Cd19–cre, Cd19-Tlr9–/–). Transgenic mice used for experiments were confirmed to be the desired genotype via standard genotyping techniques. These animals were bred in our facility. CLP procedure. Sepsis was induced by CLP. Both male and female mice that were 25 to 30 g in weight were used. The skin was disinfected with a 2% iodine tincture. Laparotomy was performed under 2% isoflurane (Piramal Critical Care) with oxygen. For the sublethal model, 50% of the cecum was ligated and punctured twice with a 22-gauge needle. Saline (1 mL) was given subcutaneously for resuscitation immediately after operation. Mice were sacrificed at 18 hours after CLP. For the lethal model, 75% of the cecum was ligated and punctured twice with an 18-gauge needle. Mice were monitored twice daily by personnel experienced in recognizing signs of a moribund state. Mice were euthanized with CO2 when they became moribund or at observation end point (7 days). We used moribundity as the end point for our survival study following the Animal Research Advisory Committee Guidelines from NIH. Isolation and ex vivo expansion of mouse FRCs. Mesenteric adipose tissue was carefully excised from the small intestine, large intestine, and cecum using scissors without rupture of intestines and lymph nodes. Lymph nodes were removed. Adipose tissue was minced in digestion media (low glucose DMEM [Corning, Cellgro], 50 mM HEPES [Corning, Cellgro], 1% fatty acid free BSA [MilliporeSigma], Liberase TL [0.2 mg/mL, MilliporeSigma], DNase I [0.25 mg/mL, MilliporeSigma]) and agitated for 30 minutes at 37°C using magnetic stir bars and a multistirrer platform. Adipose tissue lysate was filtered through a 70 μM filter and spun down at 400 g. The pellet was resuspended in 100 μL of MACS buffer (Miltenyi Biotec). CD45+ immune cells were depleted using mouse CD45 MicroBeads (Miltenyi Biotec) according to the manufacturer’s instructions. The negatively isolated cells were centrifuged at 400 g for 5 minutes. The pellet was resuspended in MesenCult Expansion full media (STEMCELL Technology) and cultured at 37°C with 5% CO2 for 7 days. The purity of FRCs (CD45–CD31–PDPN+) was assessed using flow cytometry. Culture of human FRCs. Human adipose tissue–derived stromal cells were obtained from the adipose stem cell center in the Department of Plastic Surgery at the University of Pittsburgh. Human adipose tissue–derived stromal cells were cultured and expanded in MesenCult Expansion full media (STEMCELL Technology) at 37°C with 5% CO2 for 7 days. The purity of FRCs (CD45–CD31–PDPN+) was assessed using flow cytometry. Adoptive transfer of FRCs. Mesenteric adipose tissue-derived FRCs from WT or Tlr9–/– mice were generated in vitro as described above, and 2 × 10⁵ FRCs were resuspended in PBS and injected i.p. into WT mice at 1 hour or 12 hours after CLP. Bacterial culture. Peritoneal lavage fluid (PLF) and blood for bacterial culture were collected as mice were euthanized at 18 hours after CLP. PLF and blood were subjected to serial 10-fold dilutions and cultured at 37°C overnight in 5% sheep blood agar (Teknova). CFUs were quantified by manual counting. Assessment of cytokine levels. Plasma and PLF samples were analyzed using IL-6, IL-1β, and CXCL13 ELISA kits from R&D Systems as well as an IgM ELISA kit from Invitrogen. Immunofluorescence microscopy. For immunofluorescence staining of mesenteric adipose tissue, the whole animal was perfused with PBS and fixed in 2% paraformaldehyde. Tissue was then placed in 2% paraformaldehyde for 2 hours and then switched to 30% sucrose in distilled water solution for 12 hours. Whole-mount mesenteric adipose tissue was incubated with 2% BSA in PBS for 1 hour, followed by 5 washes with PBS containing 0.5% BSA (PBB). The samples were then incubated overnight with primary antibodies (rat anti-CD45 antibody, catalog 553076, BD Pharmingen; goat anti-CXCL13, catalog AF470, R&D Systems; hamster anti-CD11c, catalog MA11C5, BD Pharmingen). Samples were washed with PBS prior to incubation with secondary antibodies. Imaging conditions were maintained at identical settings within each antibody-labeling experiment, with original gating performed using the primary depletion control. Imaging was performed using a Nikon A1 confocal microscope. Quantification was performed using NIS Elements Software (Nikon). Toluidine blue staining. Mesenteric adipose tissue was placed in 2% paraformaldehyde for 2 hours and then switched to 30% sucrose in distilled water solution for 12 hours. Whole-mount mesenteric adipose tissue was incubated with 0.1% Toluidine Blue (MilliporeSigma) in 1% sodium chloride (MilliporeSigma, pH 2.3) for 5 minutes, followed by 10 washes with PBS. Mesenteric adipose tissue was imaged using an Olympus MVX10 Macroscope stand equipped with a Hamamatsu camera and an Olympus MV PLAPO 2XC objective. Data were acquired with NIS Elements (Nikon) Flow cytometry. Cells were blocked for Fc receptors with anti-mouse CD16/32 (BD Bioscience) for 5 minutes and then were stained with fluorochrome-conjugated antibody (Supplemental Table 1) for 30 minutes, at 4°C in darkness. Data were acquired with a BD FACS LSR Fortessa Flow cytometer (BD Bioscience) and analyzed with FlowJo analytical software (TreeStar). Each experiment was repeated 3 times. Comparative PCR analysis. Total RNA was extracted with the RNeasy Mini Extraction Kit (QIAGEN) according to the manufacturer’s instructions. Two-step, real-time reverse transcription PCR (RT-PCR) was performed as previously described (44) with forward and reverse primer pairs prevalidated and specific for indicated target genes (Supplemental Table 2). All samples were assayed in duplicate and normalized to actin mRNA abundance. Statistics. All data were analyzed using GraphPad Prism software (version 8.11). Unpaired, 2-tailed Student’s t tests were used for comparisons between 2 groups. For multiple comparisons, 1-way ANOVA with Bonferroni’s post hoc test was applied. For measurements of bacterial CFU, groups were compared using nonparametric Mann-Whitney U test. Survival data were analyzed using the log-rank test. A P value of less than 0.05 was considered statistically significant for all experiments. All values are presented as mean ± SD. Study approval. All animal studies were approved by the Institutional Animal Care and Use Committees of the University of Pittsburgh. Author contributions MD and TRB conceived the project and wrote the manuscript. MD supervised the study, designed experiments, performed experiments, and analyzed the data. LX and YL performed experiments and analyzed the data. CY, PL, HL, and RH performed experiments. LX and YL contributed equally to this study. LX initiated this study and therefore is in the first position in the author list. MD and TB contributed equally to supervising this study. MD initiated and led this study and therefore is in the last position in the author list. Supplemental material View Supplemental data Acknowledgments We thank Christine H. Burr for editing the manuscript. This work was supported by NIH grant R35-GM127027 (to TRB). Confocal microscopy performed at the University of Pittsburgh was made possible though NIH grant 1S10OD019973-01 (awarded to Simon C. Watkins). Footnotes Conflict of interest: The authors have declared that no conflict of interest exists. Copyright: © 2019, American Society for Clinical Investigation. Reference information: J Clin Invest. https://doi.org/10.1172/JCI127542. References Carney DE, Matsushima K, Frankel HL. Treatment of sepsis in the surgical intensive care unit. Isr Med Assoc J. 2011;13(11):694–699. View this article via: PubMed Google Scholar Daniels R. Surviving the first hours in sepsis: getting the basics right (an intensivist’s perspective). J Antimicrob Chemother. 2011;66 Suppl 2:ii11–ii23. View this article via: PubMed Google Scholar Rudd KE, et al. The global burden of sepsis: barriers and potential solutions. Crit Care. 2018;22(1):232. View this article via: PubMed CrossRef Google Scholar Vincent JL. Acute kidney injury, acute lung injury and septic shock: how does mortality compare? Contrib Nephrol. 2011;174:71–77. View this article via: PubMed CrossRef Google Scholar Keane C, Jerkic M, Laffey JG. Stem Cell-based Therapies for Sepsis. Anesthesiology. 2017;127(6):1017–1034. View this article via: PubMed CrossRef Google Scholar Laroye C, Gibot S, Reppel L, Bensoussan D. Concise Review: Mesenchymal Stromal/Stem Cells: A New Treatment for Sepsis and Septic Shock? Stem Cells. 2017;35(12):2331–2339. View this article via: PubMed CrossRef Google Scholar Valencia J, et al. Characterization of human fibroblastic reticular cells as potential immunotherapeutic tools. Cytotherapy. 2017;19(5):640–653. View this article via: PubMed CrossRef Google Scholar Malhotra D, et al. Transcriptional profiling of stroma from inflamed and resting lymph nodes defines immunological hallmarks. Nat Immunol. 2012;13(5):499–510. View this article via: PubMed CrossRef Google Scholar Bénézech C, et al. Inflammation-induced formation of fat-associated lymphoid clusters. Nat Immunol. 2015;16(8):819–828. View this article via: PubMed CrossRef Google Scholar Fletcher AL, et al. Lymph node fibroblastic reticular cells directly present peripheral tissue antigen under steady-state and inflammatory conditions. J Exp Med. 2010;207(4):689–697. View this article via: PubMed CrossRef Google Scholar Cremasco V, et al. B cell homeostasis and follicle confines are governed by fibroblastic reticular cells. Nat Immunol. 2014;15(10):973–981. View this article via: PubMed CrossRef Google Scholar Astarita JL, et al. The CLEC-2-podoplanin axis controls the contractility of fibroblastic reticular cells and lymph node microarchitecture. Nat Immunol. 2015;16(1):75–84. View this article via: PubMed CrossRef Google Scholar Fletcher AL, Acton SE, Knoblich K. Lymph node fibroblastic reticular cells in health and disease. Nat Rev Immunol. 2015;15(6):350–361. View this article via: PubMed CrossRef Google Scholar Perez-Shibayama C, et al. Fibroblastic reticular cells initiate immune responses in visceral adipose tissues and secure peritoneal immunity. Sci Immunol. 2018;3(26):eaar4539. View this article via: PubMed CrossRef Google Scholar Brown FD, Turley SJ. Fibroblastic reticular cells: organization and regulation of the T lymphocyte life cycle. J Immunol. 2015;194(4):1389–1394. View this article via: PubMed CrossRef Google Scholar Acton SE, et al. Dendritic cells control fibroblastic reticular network tension and lymph node expansion. Nature. 2014;514(7523):498–502. View this article via: PubMed CrossRef Google Scholar Fletcher AL, et al. Lymph node fibroblastic reticular cell transplants show robust therapeutic efficacy in high-mortality murine sepsis. Sci Transl Med. 2014;6(249):249ra109. View this article via: PubMed CrossRef Google Scholar Hu D, et al. Inhibition of Toll-like receptor 9 attenuates sepsis-induced mortality through suppressing excessive inflammatory response. Cell Immunol. 2015;295(2):92–98. View this article via: PubMed CrossRef Google Scholar Tsuji N, Tsuji T, Ohashi N, Kato A, Fujigaki Y, Yasuda H. Role of mitochondrial DNA in septic AKI via Toll-like receptor 9. J Am Soc Nephrol. 2016;27(7):2009–2020. View this article via: PubMed CrossRef Google Scholar Plitas G, Burt BM, Nguyen HM, Bamboat ZM, DeMatteo RP. Toll-like receptor 9 inhibition reduces mortality in polymicrobial sepsis. J Exp Med. 2008;205(6):1277–1283. View this article via: PubMed CrossRef Google Scholar Balka KR, De Nardo D. Understanding early TLR signaling through the Myddosome. J Leukoc Biol. 2019;105(2):339–351. View this article via: PubMed CrossRef Google Scholar Deguine J, Barton GM. MyD88: a central player in innate immune signaling. F1000Prime Rep. 2014;6:97. View this article via: PubMed Google Scholar Nathan C. Neutrophils and immunity: challenges and opportunities. Nat Rev Immunol. 2006;6(3):173–182. View this article via: PubMed CrossRef Google Scholar Deng M, et al. Lipopolysaccharide clearance, bacterial clearance, and systemic inflammatory responses are regulated by cell type-specific functions of TLR4 during sepsis. J Immunol. 2013;190(10):5152–5160. View this article via: PubMed CrossRef Google Scholar Baumgarth N, Herman OC, Jager GC, Brown LE, Herzenberg LA, Chen J. B-1 and B-2 cell-derived immunoglobulin M antibodies are nonredundant components of the protective response to influenza virus infection. J Exp Med. 2000;192(2):271–280. View this article via: PubMed CrossRef Google Scholar Ochsenbein AF, et al. Control of early viral and bacterial distribution and disease by natural antibodies. Science. 1999;286(5447):2156–2159. View this article via: PubMed CrossRef Google Scholar Haas KM, Poe JC, Steeber DA, Tedder TF. B-1a and B-1b cells exhibit distinct developmental requirements and have unique functional roles in innate and adaptive immunity to S. pneumoniae. Immunity. 2005;23(1):7–18. View this article via: PubMed CrossRef Google Scholar Wang H, Coligan JE, Morse HC. Emerging functions of natural IgM and its Fc receptor FCMR in immune homeostasis. Front Immunol. 2016;7:99. View this article via: PubMed Google Scholar Cook AD, Braine EL, Hamilton JA. Stimulus-dependent requirement for granulocyte-macrophage colony-stimulating factor in inflammation. J Immunol. 2004;173(7):4643–4651. View this article via: PubMed CrossRef Google Scholar Gunn MD, Ngo VN, Ansel KM, Ekland EH, Cyster JG, Williams LT. A B-cell-homing chemokine made in lymphoid follicles activates Burkitt’s lymphoma receptor-1. Nature. 1998;391(6669):799–803. View this article via: PubMed CrossRef Google Scholar Legler DF, Loetscher M, Roos RS, Clark-Lewis I, Baggiolini M, Moser B. B cell-attracting chemokine 1, a human CXC chemokine expressed in lymphoid tissues, selectively attracts B lymphocytes via BLR1/CXCR5. J Exp Med. 1998;187(4):655–660. View this article via: PubMed CrossRef Google Scholar Litsiou E, et al. CXCL13 production in B cells via Toll-like receptor/lymphotoxin receptor signaling is involved in lymphoid neogenesis in chronic obstructive pulmonary disease. Am J Respir Crit Care Med. 2013;187(11):1194–1202. View this article via: PubMed CrossRef Google Scholar Vissers JL, Hartgers FC, Lindhout E, Figdor CG, Adema GJ. BLC (CXCL13) is expressed by different dendritic cell subsets in vitro and in vivo. Eur J Immunol. 2001;31(5):1544–1549. View this article via: PubMed CrossRef Google Scholar Bandow K, Kusuyama J, Shamoto M, Kakimoto K, Ohnishi T, Matsuguchi T. LPS-induced chemokine expression in both MyD88-dependent and -independent manners is regulated by Cot/Tpl2-ERK axis in macrophages. FEBS Lett. 2012;586(10):1540–1546. View this article via: PubMed CrossRef Google Scholar Hähnlein JS, et al. Impaired lymph node stromal cell function during the earliest phases of rheumatoid arthritis. Arthritis Res Ther. 2018;20(1):35. View this article via: PubMed CrossRef Google Scholar Guo Z, Zhang M, Tang H, Cao X. Fas signal links innate and adaptive immunity by promoting dendritic-cell secretion of CC and CXC chemokines. Blood. 2005;106(6):2033–2041. View this article via: PubMed CrossRef Google Scholar Deng M, et al. Toll-like receptor 4 signaling on dendritic cells suppresses polymorphonuclear leukocyte CXCR2 expression and trafficking via interleukin 10 during intra-abdominal sepsis. J Infect Dis. 2016;213(8):1280–1288. View this article via: PubMed CrossRef Google Scholar Christensen SR, Shupe J, Nickerson K, Kashgarian M, Flavell RA, Shlomchik MJ. Toll-like receptor 7 and TLR9 dictate autoantibody specificity and have opposing inflammatory and regulatory roles in a murine model of lupus. Immunity. 2006;25(3):417–428. View this article via: PubMed CrossRef Google Scholar Nickerson KM, et al. TLR9 regulates TLR7- and MyD88-dependent autoantibody production and disease in a murine model of lupus. J Immunol. 2010;184(4):1840–1848. View this article via: PubMed CrossRef Google Scholar Kfoury A, Virard F, Renno T, Coste I. Dual function of MyD88 in inflammation and oncogenesis: implications for therapeutic intervention. Curr Opin Oncol. 2014;26(1):86–91. View this article via: PubMed CrossRef Google Scholar Salcedo R, Cataisson C, Hasan U, Yuspa SH, Trinchieri G. MyD88 and its divergent toll in carcinogenesis. Trends Immunol. 2013;34(8):379–389. View this article via: PubMed CrossRef Google Scholar Garcia-Martinez I, et al. Hepatocyte mitochondrial DNA drives nonalcoholic steatohepatitis by activation of TLR9. J Clin Invest. 2016;126(3):859–864. View this article via: JCI PubMed CrossRef Google Scholar Tabeta K, et al. Toll-like receptors 9 and 3 as essential components of innate immune defense against mouse cytomegalovirus infection. Proc Natl Acad Sci U S A. 2004;101(10):3516–3521. View this article via: PubMed CrossRef Google Scholar Deng M, Loughran PA, Zhang L, Scott MJ, Billiar TR. Shedding of the tumor necrosis factor (TNF) receptor from the surface of hepatocytes during sepsis limits inflammation through cGMP signaling. Sci Signal. 2015;8(361):ra11. View this article via: PubMed CrossRef Google Scholar Version history Version 1 (August 5, 2019): Electronic publication
|
|
Scooped by
Gilbert C FAURE
June 23, 2019 4:06 AM
|
Summary Lymphoid organs guarantee productive immune cell interactions through the establishment of distinct microenvironmental niches that are built by fibroblastic reticular cells (FRC). These specialized immune‐interacting fibroblasts coordinate the migration and positioning of lymphoid and myeloid cells in lymphoid organs and provide essential survival and differentiation factors during homeostasis and immune activation. In this review, we will outline the current knowledge on FRC functions in secondary lymphoid organs such as lymph nodes, spleen and Peyer's patches and will discuss how FRCs contribute to the regulation of immune processes in fat‐associated lymphoid clusters. Moreover, recent evidence indicates that FRC critically impact immune regulatory processes, for example, through cytokine deprivation during immune activation or through fostering the induction of regulatory T cells. Finally, we highlight how different FRC subsets integrate innate immunological signals and molecular cues from immune cells to fulfill their function as nexus between innate and adaptive immune responses. 1 FIBROBLASTIC RETICULAR CELLS UNDERPIN THE STRUCTURE OF LYMPHOID ORGANS The activation of adaptive immune responses depends on the interaction of professional antigen‐presenting cells (APC) with T and B cells in specialized compartments of lymphoid organs. Secondary lymphoid organs (SLO) are strategically positioned at routes of pathogen invasion and thereby increase the likelihood of lymphocytes to encounter their cognate antigens at a particular location and during a certain time window. Lymph nodes are found at convergence points of afferent lymph vessels and surveil extracellular fluids from separate areas of peripheral tissue. Other classical SLO such as Peyer′s patches are located right below the area of the intestinal surface they surveil, while the splenic white pulp provides specialized niches for the development of immune responses against blood‐borne pathogens.1 Nonclassical SLO such as fat‐associated lymphoid clusters (FALC) serve as surveillance hubs of the body cavities by sampling the fluids that are secreted by mesothelial cells.2 Transient lymphoid aggregates that display T‐ and B‐cell zone segregation and that appear in inflamed tissues are referred to as tertiary lymphoid structures (TLS, also known as tertiary lymphoid organs).3 Fluid flow in lymphoid organs is sustained by endothelial stromal cells with blood endothelial cells facilitating the delivery of oxygen and nutrients via blood vessels and lymphatic endothelial cells granting drainage of extracellular liquids via lymphatic vessels. The structural integrity of all lymphoid organs is determined by fibroblastic stromal cells that build, for example, the capsule of lymph nodes or the spleen. In addition, specialized immune‐interacting fibroblasts, generally termed fibroblastic reticular cells (FRC), form the scaffold structures that underpin the distinct microenvironments required for efficient immune cell interactions (Figure 1). FRC crucially contribute to the functioning of the immune system through the secretion of homeostatic chemokines to coordinate the interaction between APC and lymphocytes and provide growth and survival factors that nurture both innate and adaptive lymphocytes.4, 5 Moreover, FRC are equipped with a large range of pattern recognition receptors6-8 that play a crucial role in the control innate immune reactions. The detection of pathogen‐associated molecular signatures by germline‐encoded receptors is a key determinant for the immune system to distinguish harmful molecules of foreign origin from inoccuous self‐molecules.9, 10 Sensing of microbial products by pattern recognition receptors expressed by APC such as dendritic cells and macrophages has been considered as a key step for the activation of the adaptive immune system.9, 11 However, recent studies have revealed that FRC in classical and nonclassical SLO actively shape adaptive immune responses through the integration of innate immunological signals.8, 12 In this review, we will highlight the ability of FRC to generate tissue‐specific microenvironmental niches that orchestrate complex immunological processes and discuss recent work that has revealed the role of FRC as an important nexus of innate and adaptive immune responses. 2 DIVERSITY OF FIBROBLASTIC RETICULAR CELLS IN LYMPHOID ORGANS The most commonly used distinction of endothelial and fibroblastic stromal cells of SLO relies on the expression of the endothelial marker CD31 (platelet endothelial cell adhesion molecule‐1, PECAM‐1) and the fibroblast marker podoplanin (PDPN).13 While PDPN expression captures the majority of FRC in lymph nodes, the expression of this marker in the spleen is restricted mainly to FRC in the T‐cell zone.14 Moreover, PDPN is a surface molecule that is expressed by fibroblasts in nonlymphoid tissues and in tumors15 rendering this marker unsuitable to specifically track lymphoid tissue FRC. In contrast, the promoter activity of the FRC signature genes Ccl19 and Cxcl13 is well‐suited to capture the complexity of the immune‐interacting fibroblasts in SLO.16, 17 Indeed, the Ccl19‐Cre model facilitates targeting of FRC in all relevant microenvironments in lymph nodes,16, 18, 19 in Peyer's patches12 and in the white pulp of the spleen.20 Likewise, the Cxcl13‐Cre/tdTomato transgene targets the majority of FRC in all SLO.17 The combination of such advanced transgenic mouse models with single‐cell RNA‐seq‐based analyses of lymph node7, 21 and splenic white pulp22 FRC will enable a series of novel studies to further explore the functional complexity of FRC in lymphoid organs. 2.1 The many shapes of FRC in classical secondary lymphoid organs While the differentiation trajectories of splenic white pulp FRC from perivascular progenitors have been delineated recently using Ccl19 promoter‐based cell fate mapping22 and lineage tracing,20 the origin of lymph node FRC has not yet been fully elucidated. Nevertheless, the aggregation of Ccl19‐Cre+ and Cxcl13‐Cre+ cells in the vicinity of blood vessels of the lymph node anlage16, 17 strongly suggests that lymph node FRC originate from myofibroblastic progenitors in the perivascular space. It appears that these precursor cells are able to generate the various FRC subsets that underpin the major compartments of the lymph node (Figure 1A). The lymph fluid from peripheral tissues that arrives to the lymph node via the afferent lymph vessels is drained through the subcapsular sinus which is lined by lymphatic endothelial cells and, beneath the subcapsular sinus floor, by several layers of marginal reticular cells (MRC).23 These cells can be distinguished from other FRC subsets in lymph nodes by the expression of mucosal vascular addressin cell adhesion molecule 1 (MAdCAM‐1), receptor activator of nuclear factor kappa‐Β ligand (RANKL, TNFSF11), and CXCL13.23 In the spleen, MRC support immune responsiveness by supporting the capture and delivery of antigens from the marginal zone to B‐cell follicles.24 The expression of RANKL by Ccl19‐Cre+ lymph node MRC has been shown to be critical for the integrity of lymphatic endothelial cells in the subcapsular sinus25 indicating that MRC actively participate in shaping the cellular environment of the lymph node. Likewise, splenic white pulp MRC impact the phenotype of their interacting immune cell partners. For example, Notch 2‐driven differentiation of marginal zone B cells and of Esam+ dendritic cells requires the expression of the Notch ligand Delta‐like (DL)1 in splenic Ccl19‐Cre+ cells,26 while RANK has been shown to maintain myeloid cell populations in the marginal zone to secure initiation of antiviral immune responses.27 As an extension from the MRC layer unfolds the conduit system through the lymph node parenchyma as a fibrillary network formed by FRC.28 Conduits both in lymph nodes and in the splenic white pulp are ensheathed by FRC and consist of a collagen‐rich core that is surrounded by a microfibrillar zone and a basement membrane.29, 30 The conduit system conveys low‐molecular‐weight substances such as chemokines and antigens from the lymph node subcapsular sinus through the T‐cell area toward high endothelial venules.30 A recent report revealed that IgM transiently gains access to the luminal side of the lymph node conduit system to facilitate rapid export of early‐response IgM antibodies out of the lymph node parenchyma.31 In sum, MRC of lymph nodes and the splenic white pulp shape the border region of lymphoid tissues through the dedicated interaction with immune cells and other stromal cells and by maintaining communication channels for rapid distribution of immunologically relevant information. It will be important to fully exploit existing and novel reticular cell targeting approaches (such as the CollagenVI‐Cre model32) to characterize the function of MRC in Peyer's patches. T‐cell zone reticular cells (TRC), ie, the FRC that co‐localize predominantly with T cells and dendritic cells, express PDPN and the signature chemokines CCL19 and CCL21.12-14, 22 It is important to reiterate that PDPN expression in lymph nodes can be found in almost all FRC subsets and that high PDPN expression is associated with maturation into fully immunocompetent FRC,16 while PDPN expression both in Peyer's patches and in the splenic white pulp is mainly found in TRC.12, 22 Both T cells and dendritic cells are in close contact with TRC and move along their projections within the T‐cell area.33 The mobility of dendritic cells is boosted by the ligation of the C‐type lectin‐like receptor 2 (CLEC‐2) with PDPN on TRC.34 Moreover, lymph node TRC are thought to function as the major source of the cytokine IL‐7 to promote T‐cell homeostasis.13 However, since IL‐7 can also be produced by lymphatic endothelial cells within lymph nodes35 and in the afferent lymphatics,36 the specific function of TRC‐derived IL‐7 for T‐cell sustenance and activation remains to be demonstrated. B‐cell follicles harbor distinct FRC subsets that produce CXCL13, the B cell‐attracting chemokine that binds to CXCR5.37 As mentioned above, CXCL13‐expressing MRC extend into the B cell follicle, while the most prominent reticular cell subset that underpins the B‐cell area has been named follicular dendritic cell (FDC).38 Due to their dendritic morphology, FDC have been assumed to be related to conventional dendritic cells, ie, to originate from bone marrow progenitors. Only recently, the progenitor cell of FDC has been revealed as perivascular myofibroblast that is characterized by the expression of platelet‐derived growth factor receptor β (Pdgfrb, CD140b).39 FDC in the B cell follicle can be identified by the expression the complement receptors CD21 and CD35 and can be found both in primary and secondary follicles.40 The main functions of FDC are the retention and presentation of particulate antigen on their surface to B cells using a broad range of FCγ‐receptors (ie, CD16, CD32)41 and the promotion of affinity maturation and somatic hypermutation of B cells in the germinal center reaction.42 FDC and probably other FRC subsets43 in the B‐cell follicle control the survival of B cells via B cell activation factor (BAFF) or transmembrane activator and CAML interactor (TACI).44 It has been suggested that the dark zone of the germinal center harbors a subset of CXCL12‐expressing reticular cells (CRC) that express PDPN and can be lineage‐traced using the Ccl19‐Cre and CD21‐Cre model.18 However, a unique phenotype of CRC could not be revealed using single‐cell RNA‐seq analysis7 indicating that the phenotypical distinction of FRC/FDC subsets underpinning the germinal center is still unclear. A main fraction of FRC express markers that are indicative for their perivascular location such as Itga7 (integrin α7), Pdgfrb (CD140b), and Acta2 (αSMA) in lymph nodes6, 7 and Ly6a (Sca‐1), Pdgfra (CD140a), and Vcam1 (CD106) in the spleen.22 It is likely that the perivascular reticular cell (PRC) fraction harbors the adult progenitor of all FRC subsets.22, 39 Other regions of the lymph node such as the deep cortical area appear to harbor a subset of FRC that is characterized by the expression of CCL21a, CXCL12, and LepR.19 This area of the lymph node is occupied by T cells, dendritic cells, and B cells suggesting that FRC acquire distinct phenotypical properties when they interact with multiple cell types. Indeed, FRC attain yet other properties when they co‐localize in medullary cords with macrophages, NK cells, and plasma cells.19 In this location, medullary reticular cells (medRC) express high levels of CXCL12, IL‐6, and BAFF and facilitate thereby the formation of dedicated niches for plasma cells.45 Single‐cell RNA‐seq analysis has confirmed the existence of at least two FRC subsets that localize in the medullary region indicating that medRC also promote the maintenance of NK cells in this region.7 Clearly, further studies are required to unveil the molecular properties and function of FRC subsets not only in the lymph node B‐cell niches but also in the different microenvironments of classical SLO. 2.2 Limited FRC heterogeneity in nonclassical SLO and TLS While the formation of classical SLO, ie, lymph nodes, splenic white pulp and Peyer's patches, is fully dependent on the presence of the lymphotoxin‐β receptor,46 the generation of nonclassical SLO (eg, FALC) or TLS (eg, inducible bronchus‐associated lymphoid tissue [BALT]) is largely independent of this pathway.2 For example, the formation of FALC requires the activation of stromal cells via the production of inflammatory cytokines such as the tumor necrosis factor (TNF), which are induced through the presence of microbiota in the intestine.47 Interestingly, the highly activated milieu of the intestinal lamina propria does not provide sufficient cytokine‐mediated stimulation to override the dependence of cryptopatch and isolated follicle formation on lymphotoxin‐β receptor signaling,48 indicating that the pathways employed in the generation of nonclassical SLOs are organ‐dependent. Likewise, TLS, which are locally inducible leukocytic aggregates that form in chronically inflamed nonlymphoid tissues,49 can form in different organs in a context‐dependent manner through triggering of inflammatory circuits involving IL‐17, IL‐6, IL‐1β, and/or IL‐22.50-53 In terms of structural organization and FRC content, both nonclassical SLO (Figure 1B) and TLS (Figure 1C) exhibit a reduced complexity when compared to the classical SLO. We will focus our review here on FALC and inducible BALT as examples of nonclassical SLOs and TLS, respectively, to highlight the few knowns and many unknowns of FRC biology in these compartments. FALC are located beneath the mesothelium and are surrounded by adipose tissues. A clear structural segregation of lymphocytes is not recognizable with a dense cluster of B cells being intermingled with CD4+ T cells and CD11b+ myeloid cells.54, 55 The main B cell population within FALC are B1 B cells that patrol body cavities and are the source of natural, low‐affinity immunoglobulin M (IgM) antibodies that bind to pathogenic bacteria.56 FALC also contain innate lymphoid cells (ILC), particularly type 2 ILCs and NKT cells.47, 55 The production of CCL19 and CCL21 by FALC FRC most likely mediates the attraction and retention of naive T cells.54 PDPN‐expressing FRC that underpin FALC structures are highlighted by the Ccl19‐Cre transgene, express PDPN and occupy perivascular niches with a surface marker profile that resembles splenic PRC (ie, PDGFRα+VCAM‐1+ICAM‐1+).8 Although these cells do not display the general phenotype of MRC or FDC, FALC FRC have been shown to produce the B cell‐attractant CXCL13.57 Hence, it appears that the somewhat random mixture of T and B cells in FALC is due to a high versatility of FALC FRC which permits attraction and interaction with B cells, T cells, and myeloid cells. Clearly, FALC FRC—and probably as well the FRC underpinning intestinal isolated lymphoid follicles—can steer both innate and adaptive immune responses without forming distinct microenvironments such as germinal centers. The formation of TLS is frequently associated with chronic inflammatory and autoimmune diseases.3, 58 Importantly, in the context of cancer, the presence of TLS correlates with improved survival in a growing list of human cancers including breast cancer,59 lung cancer,60 oral squamous cell61 and Merkel cell carcinomas,62 and melanoma.63 Hence, it is tempting to speculate that TLS serve as inducible and transient outposts of the immune system to locally cope with ongoing immunological threats. Moreover, it appears that the coordination of immune cell interaction within these structures relies on organizational principles that are comparable to those in the classical SLO (Figure 1C). During tumor formation, TLS undergo a maturation process that has been suggested to start with the segregation of T‐cell and B‐cell areas in the perivascular space and progresses by the appearance of germinal centers.64, 65 The subsequent development of germinal centers in tumor TLS is accompanied by the appearance of CXCL13‐producing, CD21+ FDC networks both in human colorectal cancer65 and in squamous cell carcinoma of the lung.64 The presence of chemokine‐secreting FRC that underpin TLS has been demonstrated in a variety of models of chronic organ inflammation.52, 53, 66 The formation of inducible BALT in the lung has revealed that the activation of the innate immune system via lipopolysaccharide instillation can drive the formation of local TLS in an IL‐17‐dependent fashion,50 while this cytokine is not necessary to induce BALT formation following intranasal infection with a propagation‐deficient virus.67 Nevertheless, viral infection appears to be sufficient to induce highly organized BALT structures that contain B‐cell follicles underpinned by a network of CXCL13‐expressing FDC as well as CXCL12‐producing, yet undefined, reticular stromal cells.66 Furthermore, the bacterial infection with Pseudomonas aeruginosa triggers BALT formation in a TLR‐dependent manner leading to the emergence of CXCL12+ reticular cells that is dependent on γδ T cell‐derived IL‐17, while FDC fail to develop under these conditions.66 Overall, the emerging view is that remodeling and maturation of immune‐stimulating FRC is one of the initiating events in the establishment of an immune‐competent niche capable of recruiting and retaining disease‐relevant lymphocytes in TLS.3 Hence, targeted modulation of FRC differentiation processes within TLS may lead to treatment modalities that either attenuate TLS formation during chronic inflammatory diseases or foster the development of such immune‐activating structures in malignant diseases. 3 IMMUNE CELL‐FRC INTERACTIONS The main function of secondary lymphoid organs is to preempt68 and to deal with1 the encounter of microbial agents and tumor cells. Pathogens and other antigenic material arrive at the antigen‐sampling zone of SLO, eg, the subcapsular sinus region of lymph nodes, where dedicated macrophage/dendritic cell populations take up and transfer antigen to B cells.69, 70 Consequently, disruption of the subcapsular sinus structure results in defective immune responses during secondary infection in mice.71 The cellular infrastructure of the murine splenic marginal zone functions in the same manner and efficiently retains infectious agents.72 Interestingly, it appears that the function of antigen capture and innate immunological sensing in the marginal zone of murine spleens is assigned to CD169‐positive macrophages and/or dendritic cells,69, 72 while in the human spleen MAdCAM1‐positive MRC operate as coordinators of immune cell interaction and drivers of subsequent immune activation.24 Antigens are further dispersed in the lymph node through the lymphatic sinuses that pervade the lymph node parenchyma, and are taken up by distinct dendritic cell subsets for the delivery to CD8+ or CD4+ T cells.73 The interaction of dendritic cells and T cells depends on the infrastructure provided by TRC74 and is regulated by TRC‐derived factors such as CCL2175 or lysophosphatidic acid.76 The efficient interaction of T and B cells at the T‐B border during viral infection depends on the presence of BAFF‐producing FRC.44 Other FRC subsets contribute during the subsequent steps of B‐cell activation in lymph nodes including antigen presentation in the germinal center,42 regulating B‐cell migration during the germinal center reaction,18, 42 and establishing plasma cell competent microenvironments in the medulla.45 FRC can perform these multiple functions because they are able to integrate a variety of signals through sensing of innate immunological stimuli and the differentiation of cellular signals in their immediate environment (Figure 2A). In the following sections, we will summarize how FRC detect and process pathogen‐derived innate immunological signals and illustrate the molecular pathways employed by FRC to regulate adaptive immune responses in lymph nodes, Peyer's patches and FALC. 3.1 Innate immunological sensing by FRC FRC can directly recognize pathogens and their immune‐activating signals using various pattern recognition receptors and particular sets of immune‐activating molecules.6, 7, 77 The activation of in vitro cultivated FRC from SLO12 or FALC8 with various TLR ligands including lipopolysaccharide, poly(I:C), and zymosan leads to upregulation of adhesion molecules ICAM‐1 and VCAM‐1 and the secretion of inflammatory mediators such as CCL2, IL‐6, and TNF. In vivo, lymph node FRC react rapidly to systemic application of lipopolysaccharide with the activation of antigen presentation and type 1 interferon (IFN) pathways and alterations in the generation of extracellular matrix proteins including matrix metalloproteinase‐9, periostin, collagen type VI, and laminin α2.6 Direct ligation of TLR4 on FDC by lipopolysaccharide leads to increased expression of adhesion molecules and promotes the production of antigen‐specific antibodies when FDC are co‐cultured with B cells in vitro.78 Moreover, the activation of FDC by oxidized phospholipids, which function as endogenous TLR4 ligands, can foster the germinal center reaction by promoting higher rates of class‐switch recombination and somatic hypermutation in B cells.79 The formyl peptide receptor 2 that binds microbial products derived from Escherichia coli or Listeria, interacts with the endogenous ligand LL‐37 to enhance CXCL13 and BAFF production by FDC and thereby promotes B‐cell proliferation.80 Viruses can directly infect FRC as demonstrated for the lymphocytic choriomeningitis virus in mice14, 81 and human viruses including Chikungunya virus82 or Ebola virus.83 Complex immune cell interactions are triggered when intracellular viral RNA is recognized by FRC via TLR712 (Figure 2B). The transcriptomic analysis of lymph node FRCs after subcutaneous infection with herpes simplex virus‐1 (HSV‐1) revealed a pronounced activation of type‐I IFN pathway in FRC.77 Virus‐induced inflammation results in FRC proliferation and the induction of a substantial remodeling of the FRC landscape.35, 77 However, excessive activation of TLR7 ligands, eg, through internalization of ribonucleotide proteins complexes via CD21, can result in type 1 IFN production by FDC which supports the long‐lasting maintenance of the germinal center response and sustained production of antinuclear antibodies with perpetuation of a lupus‐like disease in mice.84 Hence, FRC activation through innate immunological pathways requires dedicated control mechanisms to avoid immunopathological sequela. Innate immunological recognition circuits are integrated intracellularly via particular molecular switches such as the myeloid differentiation primary response 88 (MYD88) protein85 and can be amplified by cellular receptors such as the type‐I IFN receptor (IFNAR).86 During infection with the murine cytomegalovirus, blockade of the type‐I IFN pathway leads to a change in viral tropism with a shift from subcapsular macrophages to MRC as the main target cells. The elevated infection rate of MRC leads to the activation and recruitment of NK cells, which efficiently reduce the viral burden in the subcapsular sinus but consequently destroy the reticular cell network of lymph nodes leading to systemic distribution of the virus.87 Overall, it appears that IFNAR signaling in the stromal cell compartment is important to contain viral replication in a broad range of experimental models. However, whether and to which extent IFNAR signaling in FRC directly contributes to the control of a viral infection has not been determined yet. Further FRC innate activation signals can be derived from immune cells that populate their particular microenvironmental niches. For example, in murine FALC, both FRC and hematopoietic cells attracted by FRC can serve as source for TNF8 (Figure 2C). Likewise, human tonsillar FRC respond in vitro to TNF exposure with increased expression of adhesion molecules and enhanced production of inflammatory cytokines.88 Further consequences of innate immunological sensing by FRC include the production of T cell‐activating factors such as IL‐33, which is produced by splenic PDPN+ FRC during vaccination with a recombinant viral vector.89 Single‐cell RNA‐seq analysis has revealed a population of FRC in naive lymph nodes that express high levels of Cxcl9.7 It appears that CXCL9 is mainly provided by stromal cells while CXCL10 is mainly express by murine myeloid cells DC following immunization of mice with dendritic cells that are pulsed with ovalbumin protein and activated with lipopolysaccharide and poly(I:C).90 In sum, FRC actively participate in the earliest phases of developing immune responses through their function as recipients of innate immunological signals and as coordinators of subsequent immune reactions through autocrine and paracrine signal amplification. 3.2 FRC control adaptive immune responses in lymph nodes and Peyer's patches Molecules of the TNF receptor superfamily are not only crucial for the formation of lymphoid organs2, 46, 68, 91 but also profoundly impact the maturation of myofibroblastic progenitors into fully immunocompetent FRC. For example, genetic ablation of lymphotoxin‐β receptor expression on Ccl19‐Cre+ FRC leads to defective FRC maturation with reduced expression of key molecules such as Ccl19, Ccl21, and Il7, that precipitates high susceptibility to viral infection due to impaired activation of T cells.16 While the lymphotoxin‐β receptor appears to affect the maturation of all FRC subsets in lymph nodes, other molecules from the TNF receptor superfamily appear to be required for subset specification. For example, FDC differentiation depends on TNF produced by B cells,92 while CD30 contributes to proper B‐ and T‐cell zone segregation that is associated with reduced PDPN expression on yet undefined FRC subsets.93 The intricate regulatory circuits of FRC‐immune cell interaction that found the basis of protective immune responses is highlighted in a recent study on intestinal Listeria monocytogenes infection in mice.94 Listeria infection induces intestinal epithelial cell proliferation and depletion of goblet cells, while CX3CR1+ myeloid cells in Peyer's patches produce IL‐23 and thereby activate IL‐17‐secreting γδ T cells. The resulting IL‐11 production by PDPN‐expressing cells in Peyer's patches facilitates the activation of enterocytes and limits intestinal villus invasion by Listeria.94 However, such protective FRC‐immune cell interactions may precipitate immunopathological consequences such as a decreased thickness of the mucus barrier that eventually fosters intestinal inflammation.94 Thus, FRC can function both as activating and regulating cellular entities during immune responses. The ability of FRC to negatively impact T‐cell responses has been first noted by the Turley group who demonstrated that FRC in lymph nodes can present peripheral tissue antigens to T cells and thereby attenuate self‐reactivity.95 It has been proposed that the generation of nitric oxide by lymph nodes FRC regulates the expansion and activity of T cells.96, 97 However, since nitric oxide can be produced by other lymph node stromal cells such as lymphatic endothelial cells,96 it remains to be determined, for example, through FRC‐specific ablation of the inducible nitric oxide synthase gene, to which extent FRC regulate T‐cell activity through this mechanism. It is also possible that FRC regulate global immune responsiveness by impacting regulatory T‐cell differentiation. It is generally assumed that dendritic cells are the main cell population that control the differentiation pathway of CD4+ T cells toward the FoxP3+ regulatory T‐cell phenotype.98, 99 However, a recent study suggests that FRC in mesenteric lymph nodes can modulate resident dendritic cells via a bone morphogenic protein‐2‐dependent pathway to foster the induction of regulatory T cells.21 Further studies are warranted to elaborate such direct and indirect pathways of FRC‐dependent immune regulation. Innate lymphoid cells (ILC) regulate immune responsiveness by bridging innate and adaptive immunity. In contrast to T and B cells, ILC lack rearranged antigen receptors and their development and activation is therefore mainly steered via soluble factors and their receptors. Since ILC are particularly abundant at mucosal sites, they are considered as the main cell population that maintains tissue integrity and homeostasis via innate immune mechanisms.100 ILC accumulation at mucosal surfaces relies on the provision of survival factors such as IL‐7 and IL‐15 that can be produced by FRC13, 101 However, ILC also reside in SLO where they are involved in the regulation of adaptive immunity.102, 103 Recently, it has been shown that group 1 ILC are localized in the T cell zones of Peyer's patches and that Ccl19‐Cre+ FRC generate an essential niche for these cells through the provision of IL‐15.12 However, IL‐15 production by PDPN+ FRC in Peyer's patches is rapidly abrogated under excessive inflammatory conditions such as infection with a cytopathic virus. Importantly, the swift cessation of IL‐15 production by FRC in Peyer's patches and mesenteric lymph nodes is dependent on MyD88 signaling which prevents an overshooting activation of NK1.1+ ILC and immunopathological overstimulation of IFN‐γ‐producing Th1 cells (Figure 2B). As a consequence, unrestrained Peyer's patch FRC lacking MyD88 expression permit the rapid clearance of a cytopathic viral infection through boosted ILC1 and Th1 responses which is accompanied by impaired intestinal integrity, bacterial dysbiosis, and chronical intestinal inflammation.12 This study shows that FRC in lymph nodes and Peyer's patches can act as immune rheostats through the regulation of group 1 ILC activity. It will be important to further elaborate the mechanisms that grant FRC in lymphoid organs control over innate and adaptive immune responses. 3.3 FRC‐dependent immune responses in FALC In case of a breach of pathogenic microorganisms into one of the body cavities, protective immunity needs to be mounted swiftly to prevent harm to the internal organs. The adipose tissue underlying the mesothelial surface of the pericardial, pleural and peritoneal cavities harbors variable numbers of FALC.104 In the omentum, a mesothelium‐covered tissue flap that connects stomach, pancreas, colon, and spleen, FALC have been shown to collect fluids and particles from the peritoneal cavity.105 The uptake of inflammation‐inducing substances from the peritoneal cavity such as lipopolysaccharide106 or the lipid‐based antigen zymosan47 induces an increase of omental FALC size and numbers. It has been shown that opsonization of bacterial antigens by natural, low‐affinity IgM antibodies generated by peritoneal B1 B cells can promote the uptake and elimination of bacteria by myeloid cells.107 Moreover, the presence of viral particles in the peritoneal cavity increases the cellularity and size of FALC with concomitant attraction of macrophages from the peritoneal cavity to these structures.108 Other immune cells in the peritoneal cavity such as B‐2 B cells109 or neutrophils110 reach FALC via the blood vasculature. Although FALC lack the compartmentalization observed in classical SLO, their structural foundations support the rapid generation of both T‐ and B‐cell immune responses. For example, intraperitoneal application of antigens such as ovalbumin leads to the initial activation of antigen‐specific CD4+ and CD8+ T cells in omental FALC.54 Similarly, T‐dependent and T‐independent B‐cell responses are generated first in FALC following intraperitoneal antigen application.47 The role of FRC in the initiation of adaptive immune responses in FALC has only recently been clarified. It appears that CXCL13‐expressing FRC in FALC not only support the attraction and retention of B cells,54, 57 but that Ccl19‐Cre+ FALC FRC can directly sense the presence of microbial products via TLR4 and initiate a MyD88‐dependent immune‐amplifying cascade8 (Figure 2C). Following exposure to TLR2 and TLR4 ligands FALC FRC secrete inflammatory cytokines and chemokines including CCL2 to attract CCR2+ inflammatory monocytes from the circulation.8 Inflammatory monocytes establish a crucial crosstalk with FALC FRC that leads to the rapid growth and remodeling of FALC. TNF functions as the main factor that regulates the reciprocal communication between FRC and the myeloid cells and eventually facilitates the generation of humoral immunity within FALC8, 47 (Figure 2C). Interestingly, although FALC lack FDC, the microenvironmental remodeling provided by FRC is sufficient to promote germinal center‐like B‐cell responses with class‐switch recombination and a discrete somatic hypermutation.47, 54 Currently, it remains unknown whether CXCL13+ and CCL19+ FRC represent two distinct cell types or whether a variable expression of the two chemokines represents different functional states. It will be possible to clarify this question by using appropriate cell fate mapping models to track the lineage commitments of FRC subsets within nonclassical SLO. Beyond their prominent function in the initiation and coordination of innate and adaptive immune responses in FALC, FRC present in visceral adipose tissues may also contribute to the maintenance of immune homeostasis and the regulation of the immune‐suppressive environment of adipose tissues under steady‐state conditions. Adipose tissues, including the omental fat favor the accumulation of IL‐10‐producing B cells111 and regulatory T cells.112 Regulatory T cells in adipose tissues are characterized by high expression of the IL‐33 receptor ST2,112 with IL‐33 being one of the main tissue factors that impacts the development and maintenance of regulatory T cells in this compartment.113 Since IL‐33 is mainly produced by FRC‐like cells in FALC,114 it is tempting to speculate that this circuit not only controls B1 B‐cell activation and local IgM production during lung infection and inflammation,114 but that FALC FRC equilibrate immune‐activating and ‐suppressive circuits in these tissues. The regulation of physiological functions by FRC‐derived IL‐33 in the adipose tissue may even extend to other body functions such a thermogenesis.115 Further studies will be required to better understand the molecular processes underlying FRC‐dependent immune activation in FALC. Moreover, it will be important to dissect the relation of FALC FRC to other PDPN expression fibroblasts in visceral adipose tissues and to elaborate the mechanisms employed by FRC that contribute to the maintenance of tissue homeostasis. 4 CONCLUDING REMARKS The translation of innate immune signals into activating or regulating processes that steer adaptive immune responses has been regarded as one of the main roles of professional APC such as dendritic cells. FRC as dedicated immune‐interacting fibroblasts have now entered the stage to be recognized as cells that crucially contribute to the decision‐making within the immune system. The many functions of FRC are accomplished through the generation of specific microenvironmental niches for various types of immune cells. Distinct subsets of FRC form these niches to support immune cell migration, survival, and differentiation. Interestingly, it seems that particular genetic programs are imprinted in the immune‐interacting fibroblasts depending on their anatomical location. The main differentiation switches of FRC differentiation have been identified with the lymphotoxin‐β receptor representing a necessary “signal 1” for FRC maturation in classical SLO.16 However, further research needs to dissect the intercellular communication pathways between FRCs and the various immune cells that impact the differentiation trajectories of FRC in lymphoid and nonlymphoid organs. Indeed, it appears that the intestinal lamina propria of patients suffering from inflammatory bowel disease harbors at least one mesenchymal stromal cell population that closely resembles lymphoid organ FRC and is highlighted by the expression of IL‐33 and Lysyl oxidases.116 Thus, understanding the mechanisms that govern FRC differentiation in SLO and TLS will, for example, open novel avenues to target drugable FRC differentiation pathways in TLS that form during human chronic inflammatory diseases such as rheumatoid arthritis117, 118 or Sjören's syndrome.119 A major challenge that should to be addressed in the future is the lineage relationship of FRC with other mesenchymal cell types such as adipocytes, chondrocytes, or regular tissue fibroblasts. The definition of mesenchymal cell types needs to be coupled to their development origin and their function within a tissue. Hence, a combination of single‐cell transcriptome analysis and faithful in vivo lineage tracing needs to be employed120 to obtain consistent definitions of the cell types that are currently covered by the broad terms “stromal cells” or “mesenchymal cells”. ACKNOWLEDGEMENTS We thank Dr. Natalia Pikor for critical reading of the manuscript. This study received financial support from the Swiss National Science Foundation (grants 166500 and 177208 to BL). The funders had no role in study design, data collection and analysis, decision to publish, or preparation of the manuscript. CONFLICT OF INTEREST The authors declare no conflict of interest. REFERENCES
|
|
Suggested by
Société Francaise d'Immunologie
April 21, 2019 11:51 AM
|
A fundamental question in immunology is how cells decide between distinct T helper, effector or memory differentiation fates. These decisions are paramount to overcome infection and establish long‐lasting protection. The impact of cell location for the determination of T‐cell fate decisions is an emerging field. This review will discuss our current understanding of the migration path that T cells follow, within draining lymph nodes, to steer differentiation down distinct paths of either effector or memory fates. In particular, the regulation of migration and cellular encounters mediated by the chemokine receptor CXCR3 and its ligands will be discussed. The combination of increased antigen density and unique cellular partners play a central role in facilitating the site‐specific differentiation of effector T cells, within the interfollicular regions of draining lymph nodes. Recent advances have applied this knowledge to optimize vaccine design to target antigen to lymph nodes. Increased understanding of the regulation of CXCR3 ligands and how T cells integrate multiple chemokine cues will help further progress in this field and allow additional applications to direct cell differentiation outside the lymph node, to enhance memory residency in peripheral tissues and effector anti‐tumor responses.
|


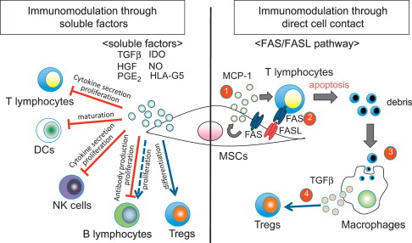


T helper 2 (Th2) responses protect against pathogens while also driving allergic inflammation, yet how large-scale Th2 responses are generated in tissue context remains unclear. Here, we used quantitative imaging to investigate early Th2 differentiation within lymph nodes (LNs) following cutaneous allergen administration. Contrary to current models, we observed extensive activation and “macro-clustering” of early Th2 cells with migratory type-2 dendritic cells (cDC2s), generating specialized Th2-promoting microenvironments. Macro-clustering was integrin-mediated and promoted localized cytokine exchange among T cells to reinforce differentiation, which contrasted the behavior during Th1 responses. Unexpectedly, formation of Th2 macro-clusters was dependent on the site of skin sensitization. Differences between sites were driven by divergent activation states of migratory cDC2 from different dermal tissues, with enhanced costimulatory molecule expression by cDC2 in Th2-generating LNs promoting prolonged T cell activation, macro-clustering, and cytokine sensing. Thus, the generation of dedicated Th2 priming microenvironments through enhanced costimulatory molecule signaling initiates Th2 responses in vivo and occurs in a skin site-specific manner.