Design, Science and Technology
59.4K views | +59 today
Design, Science and Technology
#ideas #design #science #technology #inspiration #media #information
Your new post is loading...
Rescooped by Antonios Bouris from Digital-By-Design
August 19, 2012 12:20 PM
Scoop.it!

What A Difference A Decade Makes - The Internet 2002-2012

What A Difference A Decade Makes - The Internet 2002-2012 | Design, Science and Technology | Scoop.it

A decade -- 10 years. Doesn't sound like much, right?
But a decade ago, the big social networking story was Friendster with a whopping 3 million users. Microsoft's Internet Explorer had 95 percent ...

10 years, 3,652 days, 87,648 hours.

A lot has changed since Apple was touting a new 700 MHz iBook and iPhoto 1.1.

Blockbuster went from $5.5 billion in revenue to a big bloody hole in the ground, and Yahoo went from Internet behemoth to will-Marissa-Mayer-be-able-save-it.

Internet design is an ever evolving field. New and emerging technologies continue to dictate designs across the web. And in just 10 short years, the internet has evolved into a more efficient way of gathering information. And the evolution comes first through smart web design. You may look back at websites from years ago and see blocks of text and blue links, but now, designers have made site navigation a lot more easy and a lot more clear. This Infographic will take you on a journey to the past, where web pages had no pictures (slower internet speeds back then) and where everything looked like it was just copied and pasted onto the website.

In a glorious animated GIF from BestedSites: The change a decade makes in Internet time.


By John Koetsier. http://bit.ly/MFh6yL

Source. http://bit.ly/N9uvQW

Infographic by BestedSites.http://bit.ly/NTdzwn


Via maxOz
Ken Morrison's comment, September 3, 2012 12:38 AM
Thank you for the rescoop. I see that your topic is Free Online Education. Some of my scoops that may fit your topic are under my "open" tag at: http://www.scoop.it/t/new-media-technology?tag=OPEN
Rescooped by Antonios Bouris from Eclectic Technology
August 16, 2012 12:39 PM
Scoop.it!

Infogr.am Lets You Put Videos Into Infographics (FreeTech4Teachers)

Infogr.am Lets You Put Videos Into Infographics (FreeTech4Teachers) | Design, Science and Technology | Scoop.it

Who knew? Infogr.am, a tool that allows you to create infographics, now allows you to include videos in your infographics...with the caveat they must come from YouTube or Vimeo.

For more information check out this post from Richard Byrne!


Via Beth Dichter
No comment yet.
Rescooped by Antonios Bouris from Inspired By Design
August 16, 2012 12:23 PM
Scoop.it!

49 stunning examples of letterpress printing

49 stunning examples of letterpress printing | Design, Science and Technology | Scoop.it

When it comes to printing, whether business cards, posters, greeting cards or invitations, you will invariably be presented with a multitude of mind-boggling options.


Via Brian Yanish - MarketingHits.com
No comment yet.
Rescooped by Antonios Bouris from Culture
August 16, 2012 12:03 PM
Scoop.it!

What Type of Social Media Personality Are You?

What Type of Social Media Personality Are You? | Design, Science and Technology | Scoop.it
The Myers-Briggs Indicator tests psychological traits per individual. Turns out, your specific indicators inform how you use social media.


In 1921, psychologist Carl Jung changed the fundamentals of his field. By distributing a psychometric test called the Myers-Briggs Type Indicator to patients, Jung claimed he could accurately boil down the psychological types of humans into 16 major categories.


This Infographic is based on data by CPP, publishers of the Myers-Briggs personality assessment, details the qualifiers for each of the test’s characteristics, but furthermore, predicts the psychological types most likely to participate on specific social networks. More extroverts reported using Facebook than introverts, for instance. And people with inclinations toward Feeling spend more time browsing and interacting with people on Facebook, rather than those who tend toward Thinking.


Source


Via Brian Yanish - MarketingHits.com, maxOz
Rescooped by Antonios Bouris from Digital-By-Design
August 16, 2012 11:03 AM
Scoop.it!

The Power Of First Impression

The Power Of First Impression | Design, Science and Technology | Scoop.it

Have you ever wondered which elements of your website make the biggest impression?


This Infographic by Webs is based on a recent Eye-Tracking Study conducted by the Missouri University of Science and Technology:

For their research, Sheng and Dahal enlisted 20 Missouri S&T students to view screenshots, or static images, of the main websites from 25 law schools in the U.S. 

The participants spent an average of 20 seconds on each website.


The website sections that drew the most interest from viewers were as follows:

The institution's logo. Users spent about 6.48 seconds focused on this area before moving on. The main navigation menu. Almost as popular as the logo, subjects spent an average of 6.44 seconds viewing the menu. The search box, where users focused for just over 6 seconds. Social networking links to sites such as Facebook and Twitter. Users spent about 5.95 seconds viewing these areas. The site's main image, where users' eyes fixated for an average of 5.94 seconds. The site's written content, where users spent about 5.59 seconds. The bottom of a website, where users spent about 5.25 seconds.


Although use of color was not part of the eye-tracking study, participants indicated that it did influence their impressions of websites.


"Participants recommended the main color and background color be pleasant and attractive, and the contrast of the text color should be such that it is easier to read," Dahal wrote in her master's thesis, titled "Eyes Don't Lie: Understanding Users' First Impressions on Website Design Using Eye Tracking."


The use of images was also an important factor in web design, the subjects of the study said.

 "You must choose your main picture very carefully," Sheng says.

"An inappropriate image can lead to an unfavorable response from viewers."

Colors and images utilized play a vital role when it comes to creating favorable responses


By Webs. http://bit.ly/QEFCw8

Source. http://bit.ly/NGpQUO


Via maxOz

maxOz's comment, August 16, 2012 8:25 PM
Thanks Brian For Sharing x
Scooped by Antonios Bouris
August 12, 2012 11:04 AM
Scoop.it!

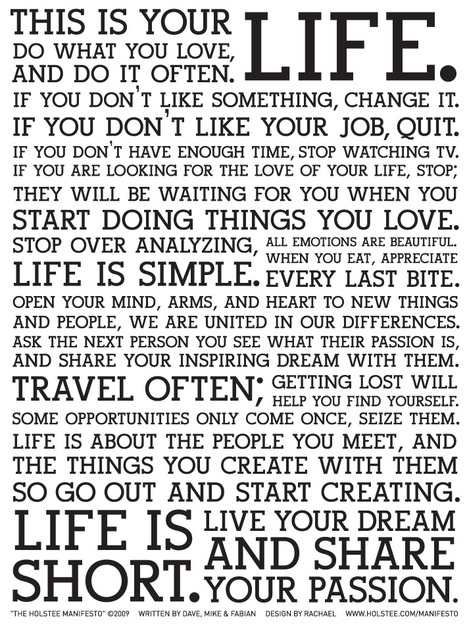
Advice on Living the Creative Life from Neil Gaiman

Advice on Living the Creative Life from Neil Gaiman | Design, Science and Technology | Scoop.it
"Someone on the internet thinks what you're doing is stupid, or evil, or it's all been done before?


JvP: Have you led a creative life? Write a manifesto, draft a commencement speech for the school you (did not) go to.


Claim your wisdom.

No comment yet.
Rescooped by Antonios Bouris from HealthSmart
August 12, 2012 10:59 AM
Scoop.it!

The Physics Of Olympic Bodies

The Physics Of Olympic Bodies | Design, Science and Technology | Scoop.it
Explore the physical laws that shape elite athletes, past and present.

Olympians from the 1912 games seem a bit shorter, a bit scrawnier, a bit more ... average.

Over the past century, elite athletes' bodies have changed a lot, and this evolution has been propelled by the laws of physics.


By NPR. http://bit.ly/NWwAtA

Source. http://n.pr/RC6PDz


Via maxOz

No comment yet.
Scooped by Antonios Bouris
August 11, 2012 7:17 AM
Scoop.it!

Service Design Tools | Communication methods supporting design processes

Service Design Tools | Communication methods supporting design processes | Design, Science and Technology | Scoop.it

An open collection of communication tools used in design processes that deal with complex systems.

No comment yet.
Scooped by Antonios Bouris
August 11, 2012 7:11 AM
Scoop.it!

Customer Journey Map | Service Design Tools

Customer Journey Map | Service Design Tools | Design, Science and Technology | Scoop.it

The customer journey map is an oriented graph that describes the journey of a user by representing the different touchpoints that characterize his interaction with the service.

No comment yet.
Scooped by Antonios Bouris
August 11, 2012 5:58 AM
Scoop.it!

User experience and design thinking - Data Visualization: Modern Approaches | Smashing Magazine

User experience and design thinking - Data Visualization: Modern Approaches | Smashing Magazine | Design, Science and Technology | Scoop.it
Data presentation can be beautiful, elegant and descriptive.
No comment yet.
Scooped by Antonios Bouris
August 10, 2012 10:57 AM
Scoop.it!

Margaret Heffernan: Dare to disagree | Video on TED.com

TED Talks Most people instinctively avoid conflict, but as Margaret Heffernan shows us, good disagreement is central to progress.
No comment yet.
Rescooped by Antonios Bouris from now°
August 10, 2012 3:47 AM
Scoop.it!

Decline and fall of the Italian villa: Haunting images of the forgotten palaces which are now spectacular ruins

Decline and fall of the Italian villa: Haunting images of the forgotten palaces which are now spectacular ruins | Design, Science and Technology | Scoop.it
To document their demise, photographer Thomas Jorion has roamed the north - from Piedmont and Lombardy to Tuscany and Emilia Romagna.

Via Rug360°
No comment yet.
Rescooped by Antonios Bouris from Everything Photographic
August 10, 2012 3:37 AM
Scoop.it!

Black and White Photography by Rodney Harvey

Black and White Photography by Rodney Harvey | Design, Science and Technology | Scoop.it

Via Tiaan Jonker
No comment yet.
Rescooped by Antonios Bouris from Online-Communities
August 19, 2012 12:19 PM
Scoop.it!

I Know What You Did On The Web

I Know What You Did On The Web | Design, Science and Technology | Scoop.it

The sites you frequent are actively tracking information about you.

 Companies have access to your personal data.

Some collect information you expressly give them, like your credit card and telephone numbers. Others gather data based on how and where you use their services. This might include anything from device and browser information to location intelligence.

Depending on the type of information gathered, social networks use data to enhance location services and target advertising.

This Infographic by Baynote, explains why your web browsing and online interactions have become much more personalized based on their paper "The Human Need for Personalization: Psychology, Technology and Science" which defines the psychology, technology and science that underlie a shopper’s desire for a personalized ecommerce experience.

How do you feel having a highly customized experience, knowing it’s your data that’s making the difference?


By Baynote. http://bit.ly/Qdseyx

Download "The Human Need for Personalization: Psychology, Technology and Science" [PDF] http://bit.ly/PGTqv8

Source. http://bit.ly/Oq4XMy


Via maxOz

No comment yet.
Rescooped by Antonios Bouris from Art, Design & Technology
August 16, 2012 12:25 PM
Scoop.it!

Egg Separator by Tommy Hawes

Egg Separator by Tommy Hawes | Design, Science and Technology | Scoop.it

Via Deloste
No comment yet.
Rescooped by Antonios Bouris from Creative Tech
August 16, 2012 12:21 PM
Scoop.it!

Photographer Captures The Secret Life Of Toys

Photographer Captures The Secret Life Of Toys | Design, Science and Technology | Scoop.it


As part of his ongoing photography series ‘ToysRLikeUs’, he takes a 'behind-the-scenes' look at some of our favorite toy characters to 'find out' what they do in their spare time.


Via Duz_Machines
No comment yet.
Rescooped by Antonios Bouris from About Photography
August 16, 2012 11:16 AM
Scoop.it!

Amazing conceptual photography - Make your ideas Art

Amazing conceptual photography - Make your ideas Art | Design, Science and Technology | Scoop.it
Today’s photography (and photographic art since some of them are slightly photoshoped ) is coming to us by the photographers Michel Rajkovic , Julie de Waroquier, Mikko Lagerstedt and Michal Giedrojc!

Via Spyros Thalassinos
No comment yet.
Rescooped by Antonios Bouris from Online-Communities
August 16, 2012 11:02 AM
Scoop.it!

30+ Creative And Useful Infographic Maps For Inspiration

30+ Creative And Useful Infographic Maps For Inspiration | Design, Science and Technology | Scoop.it
Large collection of hand-picked examples of infographical maps for you inspiration and learning...

Infographics are being used more and more to deliver complex and detailed data in a very interactive and easy to consume way.


Today information graphics surround us in all kinds of media, e.g. in printed magazines, in advertising but certainly also online.


Events like Olympics 2012 have been analysed from all angles and described in various Olympics Infographics.


However for Marketers Infographics help deliver a clear message effectively and allow for certain aspects to be highlighted…

One of the most typical uses of Infographics is to present demographic data and map illustrations tend to be really useful.

Here,  Lars Vraa of Tripwire, has found some excellent examples of Infographical Maps for your inspiration. Enjoy!


By Lars Vraa . http://bit.ly/Q2fkn6

Source. http://bit.ly/MzWkAx


Via maxOz

No comment yet.
Rescooped by Antonios Bouris from Social-Business-Marketing
August 12, 2012 11:00 AM
Scoop.it!

The Marketing Paradox

The Marketing Paradox | Design, Science and Technology | Scoop.it

Differentiation vs Amplification

Smart Insights share Seth Godin’s Circles of Marketing blog post because of the simplicity of the message, the focus on the fundamentals, Seth’s strength.

Jeff Seaver produced a slicker PDF version here .


The Marketing Paradox

Seth has described something of a modern marketing paradox and  here it has been expanded and illustrated it further. Believing that the marketing paradox that we face is Differentiation and Longevity vs Amplification and Speed.

Does the marketer seek genuine differentiation or does he or she chase an opportunity to measurably amplify the brand?

The latter is realistically faster, it’s what’s expected, and just maybe you get a bit of luck or already have a great product, in which case amplification can then work for sure.

Yet the inner rings are defensible, considered, harder and longer lasting.

They’re also the base to upon which you can amplify and unfortunately they’re increasingly out of the direct control of many marketers, driven by other stake-holders or business directors.

Inspired by Seth Godin

Seth recommends moving one circle inwards when your marketing isn’t working, it seems obvious, so why do we see even experienced marketers stuck in the outer rings?

Seth reckons it’s amateur marketers, maybe. We could deliberate for days on why, but we feel that it’s quite simply fear.

A fear of changing from “what’s always worked”?

Maybe there’s a pressure from upstairs for marketers to deliver short-term results forcing short-term thinking to demonstrate some form of ROI sooner rather than later?

You have the choice.

Hopefully this  interpretation adds to the original and helps prompts different thinking

Note:  The marketing circles were tweaked slightly from Seth’s, that ‘Story’ and ‘Community’ really warranted their own place.


By Danyl Bosomworth. http://bit.ly/OeBwQ5

Seth's Circles Of Marketing [PDF] http://bit.ly/RAlaAH

Source. http://bit.ly/P7PhN5


Via maxOz
No comment yet.
Scooped by Antonios Bouris
August 12, 2012 10:56 AM
Scoop.it!

Reading Customer Experience Is an Investment, Not a Cost #hbr #tisdt #custsrv

Reading Customer Experience Is an Investment, Not a Cost #hbr #tisdt #custsrv | Design, Science and Technology | Scoop.it
Earlier, I wrote about how "It's Not Who Your Customers Are, It's How They Behave." Demographics aren't interesting in and of themselves — businesses benefit from their customers' (trans)actions.
No comment yet.
Scooped by Antonios Bouris
August 11, 2012 7:13 AM
Scoop.it!

Tyler Tate. Cross-Channel Blueprints: A tool for modern IA

Tyler Tate. Cross-Channel Blueprints: A tool for modern IA | Design, Science and Technology | Scoop.it

The practice of information architecture is undergoing a tectonic shift away from creating individual websites and towards designing cross-channel experiences that span both the digital—from desktop to mobile—and the physical—from print to storefront. While the information architect’s skillset is well-suited for this new challenge, our existing tools are not.

No comment yet.
Scooped by Antonios Bouris
August 11, 2012 5:59 AM
Scoop.it!

11 Reasons a 23-Year-Old Shouldn't Run Your Social Media - TIME

11 Reasons a 23-Year-Old Shouldn't Run Your Social Media - TIME | Design, Science and Technology | Scoop.it

I am, however, trying to make a point: Just because you don't understand social media doesn't mean you should forfeit all common sense and hire your niece, nephew, or any other other...

Judith Van Praag's comment, August 11, 2012 1:40 PM
Right on!
Scooped by Antonios Bouris
August 11, 2012 5:10 AM
Scoop.it!

Customer Experience Is Critical - Huffington Post (blog)

Customer Experience Is Critical - Huffington Post (blog) | Design, Science and Technology | Scoop.it

Outsourcing customer service and just hoping it will work has become passé -- the experience the customer has when interacting with your brand is more important that ever because social networks...

No comment yet.
Rescooped by Antonios Bouris from "iPads, STEM and Making"
August 10, 2012 3:47 AM
Scoop.it!

The History 2.0 Classroom: Back to School App-pack

The History 2.0 Classroom: Back to School App-pack | Design, Science and Technology | Scoop.it

A list of apps structured around specific classroom goals ...


Via David Miller
No comment yet.
Rescooped by Antonios Bouris from UXDesign – Making Sense of Chaos
August 10, 2012 3:40 AM
Scoop.it!

Our Favorite Tools for Sketching - Adaptive Path

Our Favorite Tools for Sketching - Adaptive Path | Design, Science and Technology | Scoop.it

Via Anthony Besnault, Georgia Gibbs Design
No comment yet.