Your new post is loading...

|
Scooped by
Gilbert C FAURE
December 15, 2020 1:52 AM
|
Nowadays, few evidences have shown the possible involvement of autoimmunity in patients affected by Coronavirus disease 2019 (COVID-19). In this study, we elucidate whether severe acute respiratory syndrome (SARS-CoV-2) stimulates autoantibody production and contributes to autoimmunity activation. W …
KEY POINTS
A focused hepatic BCR repertoire is generated during cholestatic liver disease.
Blockade of BAFF reshapes BCR repertoire and reduces autoantibody production.
Depletion of B cells reduces both the hepatic fibrosis and autoantibody production.
Abstract
Defects in biliary transport proteins, MDR3 in humans and Mdr2 in mice, can lead to a spectrum of cholestatic liver disorders. Although B cell disorders and the aberrant Ab production are the leading extrahepatic manifestations of cholestatic liver diseases, the mechanism underlying this phenomenon is incompletely understood. Using mice with deficiency of Mdr2 that progressively develop cholestatic liver disease, we investigated the contributions of BAFF to aberrant IgG autoantibody production and hepatic fibrosis. In Mdr2−/− mice, hepatic B lymphocytes constitutively produced IgG during fibrosis progression, which correlated with elevated serum levels of BAFF, antinuclear Abs (ANA) and immune complexes. The elevated BAFF and ANA titers were also detected in human patients with primary sclerosing cholangitis and hepatobiliary cholangiopathies. Consistent with the higher BAFF levels, liver-specific selection of the focused BCR IgH repertoire was found on hepatic B cells in Mdr2−/− mice. Interestingly, the administration of anti-BAFF mAb in Mdr2−/− mice altered the BCR repertoire on hepatic B lymphocytes and resulted in reduced ANA and immune complex titers. However, anti-BAFF treatment did not attenuate hepatic fibrosis as measured by collagen deposition, hepatic expressions of collagen-1a, α-smooth muscle actin, and mononuclear cell infiltration (CD11b+ Ly-6chi monocytes and CD11b+ Gr1+ neutrophils). Importantly, depletion of B cells by anti-CD20 mAb reduced both hepatic fibrosis and serum levels of ANA and immune complexes. Our findings implicate B cells as the potential therapeutic targets for hepatic fibrosis and targeting BAFF specifically for attenuating the autoantibody production associated with cholestatic liver disease.
Via Krishan Maggon
|
|
Scooped by
Gilbert C FAURE
April 20, 2020 3:05 AM
|
Autoantibody Reversion: Changing Risk Categories in Multiple-Autoantibody–Positive Individuals Michelle So, Colin O’Rourke, Henry T. Bahnson, Carla J.Greenbaum, Cate Speake Diabetes Care Apr 2020,…...
|
|
Scooped by
Gilbert C FAURE
December 1, 2019 5:32 AM
|
Systemic lupus erythematosus (SLE) is an autoimmune disease characterized by excessive autoantibody production and multi-organ involvement. Although the etiology of SLE still remains unclear, recent studies have characterized several pathogenic B cell subsets and regulatory B cell subsets involved...
|
|
Scooped by
Gilbert C FAURE
November 16, 2019 11:49 AM
|
KEY POINTS Anti-C3d mAb 3d-8b blocks in vivo CR2-dependent Ab production to foreign Ags. Anti-C3d mAb 3d-8b is capable of blocking in vivo iC3b/C3d from CR1/CR2. Disruption of the B cell–CR2 costimulatory signal reduces autoantibody production. Abstract Humoral autoimmunity is central to the development of systemic lupus erythematosus (SLE). Complement receptor type 2 (CR2)/CD21 plays a key role in the development of high-affinity Abs and long-lasting memory to foreign Ags. When CR2 is bound by its primary C3 activation fragment–derived ligand, designated C3d, it coassociates with CD19 on B cells to amplify BCR signaling. C3d and CR2 also mediate immune complex binding to follicular dendritic cells. As the development of SLE involves subversion of normal B cell tolerance checkpoints, one might expect that CR2 ligation by C3d-bound immune complexes would promote development of SLE. However, prior studies in murine models of SLE using gene-targeted Cr2−/− mice, which lack both CR2 and complement receptor 1 (CR1), have demonstrated contradictory results. As a new approach, we developed a highly specific mouse anti-mouse C3d mAb that blocks its interaction with CR2. With this novel tool, we show that disruption of the critical C3d–CR2 ligand-receptor binding step alone substantially ameliorates autoimmunity and renal disease in the MRL/lpr model of SLE. Footnotes This work was supported by grants (to V.M.H.) from the Lupus Research Institute (now Lupus Research Alliance) and the National Institutes of Health (R21 AI105717). Received May 30, 2019. Accepted October 21, 2019. Copyright © 2019 by The American Association of Immunologists, Inc. This article is distributed under The American Association of Immunologists, Inc., Reuse Terms and Conditions for Author Choice articles.
|
|
Scooped by
Gilbert C FAURE
November 11, 2019 6:47 AM
|
13th Annual Autoantibody Network Conference The 13th Annual Conference of the Autoantibody Network (AAN) was held September 18-20, 2019 in Mississauga, Ontario and was attended by a group from the Specialty Biochemistry Labs. This conference is a unique practical sharing of many important aspects of autoantibody testing. The conference focused on Autoimmune Neurological Channelopathies, Autoimmune Kidney Disease, Molecular Testing in Autoimmune Disease; Clinical Service, Experience & Automation; Quality Assessment & Case Discussion; other Diagnostic Markers as well as Round Table Discussion. Great talks were given by members of our group, Dr. Liju Yang, Section Head for Clinical Immunology and Trace Elements gave a presentation on “Autoantibody Testing Strategies" and Pam Edmond, Senior Technologist in the Specialty Biochemistry Labs presented “A Streamlined Approach to Anti-Nuclear Antibody and Autoimmune Liver Disease Testing using Immunofluorescence with Reflex Testing to Immunoblot and ELISA Analysis”.
|
|
Scooped by
Gilbert C FAURE
October 16, 2019 2:10 AM
|
Abstract Objective Four autoantigens have been described recently in IgG4‐related disease (IgG4‐RD): prohibitin, annexin A11, laminin 511‐E8, and galectin‐3. However, no external validation has bee...
|
|
Scooped by
Gilbert C FAURE
September 14, 2019 12:24 PM
|
Many autoimmune diseases are hallmarked by autoreactive B and plasma cell responses that are directly or indirectly involved in disease pathogenesis. These B-cell responses show large variability between diseases, both in terms of the secreted autoantibody repertoire and the dynamics and characteristics of the underlying B-cell responses. Hence, different mechanisms have been proposed to explain the emergence of autoreactive B cells in an otherwise self-tolerant immune system. Notably, most mechanistic insights have been obtained from murine studies using models harboring genetic modifications of B and T cells. Given recent technological advances that have rendered autoreactive human B cells accessible for analysis, we here discuss the phenomenon of extensive N-glycosylation of the B-cell receptor (BCR) variable domain of a prototypic human autoreactive B-cell response and its potential role in the generation of autoimmunity. Anti-citrullinated protein antibodies (ACPA) hallmark the most disease-specific autoimmune response in Rheumatoid Arthritis (RA). Remarkably, ACPA-IgG are heavily N-glycosylated in the variable domain due to somatic mutations that generate abundant N-glycosylation consensus sequences. These sites, obtained from full-length BCR sequences of ACPA-expressing B cells from 12 ACPA-positive RA patients, were here analyzed in detail. Sites that required a single nucleotide mutation to be generated were defined as single somatic hypermutation (s-SHM) sites
|
|
Scooped by
Gilbert C FAURE
August 5, 2019 8:43 AM
|
|
|
Scooped by
Gilbert C FAURE
August 5, 2019 2:52 AM
|
PubMed comprises more than 29 million citations for biomedical literature from MEDLINE, life science journals, and online books. Citations may include links to full-text content from PubMed Central and publisher web sites.
|
|
Scooped by
Gilbert C FAURE
July 26, 2019 8:36 AM
|
ABSTRACT An increasing number of movement disorders are associated with autoantibodies. Many of these autoantibodies target the extracellular domain of neuronal surface proteins and associate with ...
|
|
Scooped by
Gilbert C FAURE
July 22, 2019 1:52 PM
|
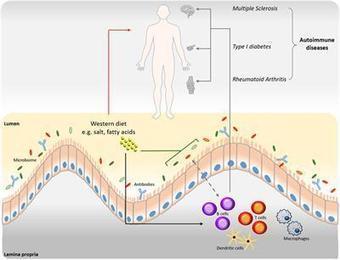
B cells possess a predominant role in adaptive immune responses via antibody-dependent and -independent functions. The microbiome of the gastrointestinal tract is currently being intensively investigated due to its profound impact on various immune responses, including B cell maturation, activation and IgA antibody responses. Recent findings have demonstrated the interplay between dietary components, gut microbiome and autoantibody production. ‘Western’ dietary patterns, such as high fat and high salt diets, can induce alterations in the gut microbiome that in turn affects IgA responses and the production of autoantibodies. This could contribute to multiple pathologies including autoimmune and inflammatory diseases. Here, we summarize current knowledge on the influence of various dietary components on B cell function and (auto)antibody production in relation to the gut microbiota, with a particular focus on the gut-brain axis in the pathogenesis of multiple sclerosis (MS).
|
|
Scooped by
Gilbert C FAURE
June 20, 2019 9:39 AM
|
Abstract CD4+Foxp3+ regulatory T cells (Tregs) are suppressors of immune activation and play a crucial role in the maintenance of peripheral tolerance. Mutations of Foxp3 result in fatal autoimmunity in multiple organs, including the skin, in both humans and mice. Many studies have demonstrated the altered frequency and functions of Tregs, changes in cytokine and chemokine levels related to Tregs and the differences in genetic background regarding Tregs in autoimmune skin disorders. Recent studies have extended our knowledge of certain properties of Tregs, especially skin‐resident Tregs. In addition, some novel therapies have been performed by modulating the number and the function of Tregs. This review focuses on the role of Tregs in some autoimmune skin disorders, including alopecia areata, vitiligo, pemphigoid and pemphigus, and systemic sclerosis, and discusses questions that remain to be addressed. 1 INTRODUCTION Foxp3+ regulatory T cells (Tregs) are potent suppressors of immune activation and play a crucial role in the maintenance of self‐tolerance.1 Treg cells prevent autoreactive T cells that escape clonal deletion in the thymus from activating and expanding at the periphery. Therefore, a balance between Tregs and effector T cells is a key factor for maintaining appropriate peripheral tolerance. Mutations of Foxp3 result in fatal immune dysregulation, polyendocrinopathy, enteropathy, X‐linked (IPEX) syndrome in humans,2 whereas a mutation in Foxp3 leads to the lymphoproliferative syndrome of scurfy mice.3, 4 Tregs are known to highly express CCR45 and CCR7;6 thus, their ligands CCL22 and CCL21 promote Treg homing to tissues. Various mechanisms by which Tregs directly suppress responder T cells have been proposed: the production of suppressor cytokines IL‐10 and TGF‐β; IL‐2 consumption though CD25 (IL‐2 receptor α), which is highly expressed on Tregs; and granzyme‐mediated cytolysis.7 Tregs also express cytotoxic T lymphocyte‐associated antigen‐4 (CTLA‐4), CD39, CD73, programmed cell death protein 1 (PD‐1) and inducible T‐cell co‐stimulator (ICOS), and these suppress T cells and antigen‐presenting cells.8 In terms of humoral immunity, B cells from patients with IPEX syndrome produce large amounts of autoreactive antibodies and cause hyper‐IgE,9 showing that Tregs play an important role in the maintenance of peripheral anergy in autoreactive B cells. Tregs have specific roles in skin, such as the acceleration of wound healing,10 the promotion of immune tolerance to skin commensal microbes11 and the orchestration of stem cell‐mediated hair follicle regeneration.12 Using an ovalbumin‐expressing mouse model, Rosenblum et al13 demonstrated the existence of skin‐resident memory Tregs, which contribute to mitigating skin inflammation upon repeated antigen exposure. Thus, the function of Tregs in maintaining skin homoeostasis is beginning to be elucidated. This review focuses on some representative autoimmune skin disorders including alopecia areata and vitiligo, which are skin‐specific T cell–mediated autoimmunity; pemphigoid and pemphigus, which are skin‐specific autoantibody‐mediated autoimmunity; and systemic sclerosis, which is a systemic autoimmunity, and discusses the role of Tregs in the pathogenesis of those disorders and questions that should be addressed. 2 ALOPECIA AREATA Alopecia areata (AA) is a site‐specific, T cell–mediated autoimmune disease that affects the hair follicles. The loss of immune privilege in hair follicles associated with an attack by CD8+ T cells on the bulb of the follicle may contribute to the pathogenesis. A study has reported reduced serum TGF‐β levels in patients with AA.14 Meanwhile, no significant difference has been reported in serum IL‐10 levels14-16 and in lesional skin IL‐10 levels17 between AA and healthy control. Thus, the results on Treg‐related cytokines in AA are conflicting. The decreased frequency of Foxp3+ lymphocytes in the scalp lesions of patients with AA has also been reported, whereas circulating CD4+CD25+Foxp3+ Treg levels were marginally higher in severe AA than in mild AA.18 The immunosuppressive function of CD4+CD25+ Tregs is impaired in patients with AA, especially in the ophiasis type of AA, as shown by in vitro assay using TCR stimulation.19 Notably, genomewide association studies (GWAS) have demonstrated single nucleotide polymorphisms in genes that are related to the activation and proliferation of Tregs, such as CTLA‐4, IL‐2, CD25 and Eos (IKZF4, a mediator of Foxp3‐dependent gene silencing in Tregs) in patients with AA.20 These findings suggest that Treg dysfunction is relevant to the development of AA. Interestingly, a recent study using a mouse model demonstrated that Tregs promote hair follicle regeneration by augmenting hair follicle stem cell proliferation and differentiation.12 Thus, skin‐resident Tregs play a major role in hair follicle biology. Castela et al21 reported that the subcutaneous injection of low‐dose recombinant IL‐2 increased the number of Tregs in skin specimens from scalp lesions, resulting in partial hair regrowth, suggesting the possibility that the modulation of Treg number could be a therapeutic strategy for AA. 3 VITILIGO Vitiligo is an autoimmune skin disease of depigmentation that results from the loss of functional melanocytes in the skin. Although the exact pathogenesis remains to be elucidated, studies have demonstrated that CD8+ cytotoxic T cells play a crucial role in inducing the destruction of melanocytes in vitiligo.22 The cytotoxic T cells that produce IL‐6 and IL‐13 induce apoptosis in the melanocytes.23 Furthermore, patients with active vitiligo show greater numbers of CD8+ T cells and lower CD4+/CD8+ ratios than patients with stable vitiligo show.24 Therefore, the imbalance between melanocytes‐reactive CD8+ cytotoxic T cells and Tregs has been suspected as a potential pathogenesis of vitiligo. Many studies have addressed the role of Tregs in vitiligo. The serum level of TGF‐β is significantly lower in patients with vitiligo than in controls, suggesting the dysfunction of Tregs in vitiligo.25-27 The number of circulating Tregs is lower in patients with vitiligo than in controls.24, 27, 28 Furthermore, the frequency and counts of Treg were significantly decreased in the peripheral blood of active patients than in stable patients.24 Significant defects in the immunosuppressive function of CD4+CD25+ Tregs in patients with vitiligo on CD4+CD25− T cells or CD8+ T cells have been shown by in vitro assays with TCR stimulation.27, 28 In vitiligo skin, mRNA levels of molecules related to Treg function were decreased in Foxp3,29, 30 CTLA‐4,31 TGF‐β,30 CCL21 (a ligand for chemokine receptor CCR7)30 and CCL22 (a ligand for CCR4).30 Notably, GWAS using 4680 cases of vitiligo and 39 586 controls identified some associated loci related to immunoregulation, such as CTLA‐4, Eos (IKZF4) and CD80 (a binding partner of CTLA‐4 to inhibit T‐cell activation),32 indicating that a genetic background associated with Treg is involved in the pathogenesis of vitiligo. Some therapeutic approaches involving the manipulation of Tregs have been attempted for the treatment of vitiligo. Chatterjee et al33 examined the immunoregulatory mechanism in vitiligo using transgenic mice that carry T cells with HLA‐A2‐restricted human tyrosinase peptide‐reactive TCR and spontaneously develop vitiligo from an early age. The adoptive transfer of CD4+CD25+Foxp3+ Tregs or treatment with rapamycin, which was reported to be an enhancer of Tregs,34 induces increases in the number of Tregs in skin lesions, resulting in a lasting remission of vitiligo.33 Eby et al35 reported that gene gun treatment whereby CCL22 is introduced into vitiliginous skin lesions on a mouse model promotes Treg recruitment to the lesions, decreases melanocyte‐reactive T cells and leads to significantly reduced depigmentation. These findings show that increasing the number of Tregs at an affected site can be a potential therapeutic for vitiligo. 4 PEMPHIGOID AND PEMPHIGUS Autoantibodies in autoimmune bullous diseases target structural proteins of the epidermis and the epidermal basement membrane zone (BMZ), which cause the loss of cell‐cell adhesion or cell‐matrix adhesion and blistering in the skin. Autoantibodies against BP180, a structural protein at the BMZ, induce bullous pemphigoid (BP). Autoantibodies against desmogleins (Dsg) 1 and 3, desmosomal proteins that are expressed on stratified squamous epithelium including the skin and/or oral mucosa, cause pemphigus foliaceus (PF) and pemphigus vulgaris (PV), respectively. Previous studies reported that peripheral T cells from healthy human donors who carry the susceptible HLA class II alleles of pemphigus vulgaris (PV) or bullous pemphigoid (BP) react to autoantigens.36, 37 Peripheral tolerance may prevent those T cells from activating. However, the number and function of circulating CD4+ CD25+ Foxp3+ Tregs from active patients with BP are similar to those from healthy controls.38 The number of Foxp3+ cells in BP lesions is higher than in control skin.39 A recent study also demonstrated the increased frequency of CD4+CD25++CD127− Tregs in the peripheral blood of patients with BP relative to that in healthy controls.40 In contrast, a significant reduction in circulating CD4+CD25brightFoxp3+ Treg frequency was reported in patients with BP.41 The frequencies of Foxp3+ cells and the numbers of IL‐10+ were significantly lower in skin lesions from patients with BP than in skin lesions from psoriasis or patients with AD, suggesting a possible role of the reduction of Tregs in the pathogenesis of BP.42 Most of these studies did not have functional analyses of Tregs. Rensing‐Ehl et al38 compared the immunosuppressive function of sorted CD4+CD25+ Tregs by co‐culturing them with CD4+CD25− responder T cells at an equal ratio and stimulating them with irradiated allogeneic PBMC or tetanus toxoid. Notably, the immunosuppressive function of Tregs from patients with BP was similar to that of Tregs from healthy controls. Thus, the role of Tregs in the pathogenesis of BP remains controversial. Monoclonal antibodies to PD‐1 or CTLA‐4 have recently been applied for the treatment of melanoma and other neoplasms as immune checkpoint inhibitors, and they are known to suppress Tregs.43, 44 Interestingly, several cases of BP after the administration of those antibodies have been reported.45, 46 In addition, a case of pemphigoid nodularis, a BP subtype, was reported in an IPEX patient.47 These findings suggest that, in some individuals, Tregs suppress T cells that are reactive to BP180 and/or BP230, and that the dysfunction of Tregs may induce the production of autoantibodies to those antigens. In PV, desmoglein (Dsg3)‐reactive type 1 regulatory T cells (Tr1) secreting IL‐10 and TGF‐β are more frequently detected in healthy carriers of PV‐associated HLA class II alleles (DRB1*0402 and DQB1*0503) than in patients with PV, and those Tr1 cells suppress the Dsg3‐reactive T cells in healthy carriers.48 The suppressive function of Tregs has also been demonstrated by a study using an active PV mouse model.49 A recent study demonstrated that the induction of Tregs by the superagonistic anti‐CD28 antibody decreases pathogenic IgG autoantibodies against Dsg3 in a HLA‐DRB1*04:02‐transgenic PV mouse model.50 This study suggests that the modulation of the number of Tregs may provide a novel therapeutic approach against PV. 5 SYSTEMIC SCLEROSIS Systemic sclerosis (SSc) is a systemic autoimmune disorder that is characterized by thickened and sclerotic skin associated with specific autoantibodies. The involvement of internal organs such as the lungs, the gastrointestinal tract, the heart and the kidney is occasionally observed. The pathology of SSc involves three pathways: vasculopathy, fibrosis and aberrant immune activation.51 Many studies have investigated the frequency of Tregs in patients with SSc, and both increases and decreases in their frequency have been reported in peripheral blood52, 53 and in skin lesions.54, 55 The compromised function of CD4+CD25highCD127−/low Tregs in active SSc was also reported.52, 53 The frequency of CD4+CD25brightFoxp3+ Tregs correlates with disease activity and severity in SSc.56 These findings suggest that Tregs play a role in the pathogenesis of SSc, although the significance of that role remains largely unclear. It is known that TGF‐β has potent profibrotic activity, and the expression of TGF‐β‐regulated genes is increased in the skin of patients with SSc.57 Interestingly, a treatment with fresolimumab, a high‐affinity neutralizing antibody that targets TGF‐β, decreases TGF‐β‐regulated gene expression and improves clinical symptoms in patients with SSc,57 suggesting the possible harmful effects of TGF‐β‐producing Tregs in the pathogenesis of SSc. 6 FUTURE DIRECTIONS There are still contradictions in the results regarding the numbers and functions of Tregs, as mentioned above. The variations in methodologies for detecting human Tregs, the age of the studied subjects, and the stages and severities of disease may relate to the inconsistent results in previous reports. Miyara et al58 demonstrated that human CD4+Foxp3+ T cells are divisible into three phenotypically and functionally distinct subpopulations: CD4+CD45RA+Foxp3lo resting Tregs (rTregs), CD4+CD45RA−Foxp3hi activated Tregs (aTregs) and cytokine‐secreting CD4+CD45RA−Foxp3lo non‐suppressive T cells (non‐Tregs). Based on this study, the balance of the three Treg subpopulations has been investigated in some skin diseases.59, 60 Of note, although “non‐Tregs” express Foxp3, they have no immunosuppressive function, suggesting that we should carefully choose the method for detecting or isolating Tregs when we analyse the frequency and function of Tregs in patients. Additionally, the study also demonstrated significant differences in the proportion of the three subpopulations between healthy young donors (between 18 and 40 years old) and aged individuals (between 79 and 90 years old).58 Therefore, we must evaluate the frequency of human Tregs using age‐matched controls. It is also important to notice that Tregs in skin are different from those in blood and secondary lymphoid organs. Fox example, skin‐resident Tregs show activated and memory phenotypes including higher levels of CTLA‐4, CD25, ICOS and CD27 compared to Tregs in blood.61 It is known that conventional CD4+ T cells are mostly activated in human tissues and that activated CD4+ T cells also express Foxp3. Therefore, we should be skeptical of the studies that define Tregs in human skin based solely on expression of CD4 and Foxp3. More sophisticated approaches such as multiparameter flow cytometry or multicolour immunofluorescent microscopy are required to differentiate Tregs from conventional T cells in human skin. In previous studies, functional analyses of Tregs have been commonly performed using TCR stimulation with anti‐CD3 and/or anti‐CD28 antibodies or by co‐culturing with irradiated allogeneic PBMCs.27, 28, 38, 60 If the immunosuppressive function of Tregs is broadly (polyclonally) impaired, why do individuals develop single specific autoimmune diseases but not multiple autoimmunity, such as IPEX syndrome? One possibility is that a portion of the individuals have a genetic background for increased susceptibility to certain autoimmune disorders and carry causative autoreactive T cells that are continuously suppressed by corresponding Tregs in steady state, so that when the immunosuppressive function of Tregs broadly decreases for unknown reasons, the harmful T cells are activated and induce autoimmunity (Figure 1). Maeda et al62 demonstrated that healthy individuals carrying HLA‐A2*0201 possess CD8+ T cells specific to Melan‐A, a self‐antigen expressed by normal melanocytes and targeted in vitiligo. Those CD8+ T cells are anergic and highly express CTLA‐4 and CCR7. In vitro experiments demonstrate that those anergic CD8+ T cells are induced by co‐culturing with CD25highCD4+ Tregs upon antigen stimulation. Melan‐A‐specific CD8+ T cells from healthy individuals express CTLA‐4 at higher levels than those from patients with vitiligo. These findings strongly suggest that the Treg‐mediated induction of anergy in autoreactive T cells is crucial for maintaining self‐tolerance.62 Therefore, we should ideally perform suppression assays using isolated antigen‐specific Tregs and by stimulating them with specific autoantigens, although this is still technically challenging. To find candidates for predisposing factors for autoimmune diseases, comprehensive gene analyses, including GWAS, whole‐exome sequencing or whole‐genome sequencing, may be useful. Most previous studies examined the function of patients’ Tregs using Tregs derived from peripheral blood, because such blood is accessible. However, as previously reported,61 skin‐resident memory Tregs may play an important role in suppressing T cell–mediated inflammation in skin. By contrast, in humoral immunity, CD4+ T follicular helper (Tfh) cells have a particular function in providing T cell help to follicular B cells,63 and they are responsible for the production of autoantibodies;64 also, a subset of Tregs, T follicular regulatory cells (Tfregs), control the expansion of Tfh cells in the germinal centres in secondary lymphoid organs.65 Thus, the appropriate tissue or cell subset for analysing the function of Tregs depends on the type of disease. We should pay attention to this when we plan experiments and interpret the data. In summary, Treg dysfunction is known to be associated with the pathogenesis of certain autoimmune disorders in dermatology, and Treg biology has started to be elucidated. Various approaches to regulate the autoimmunity through the manipulation of Tregs have been tried. A further understanding of Treg properties by investigations with optimal experimental methods promises to lead to novel therapeutic strategies for autoimmune skin diseases. ACKNOWLEDGEMENT None. CONFLICT OF INTEREST The authors have no conflict of interests to declare. AUTHOR CONTRIBUTIONS HU designed the study and wrote the manuscript. REFERENCES Citing Literature
|
|
|
Scooped by
Gilbert C FAURE
December 14, 2020 2:50 PM
|
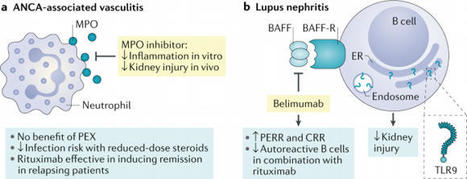
In 2020 a number of clinical trials have provided insights into therapeutic approaches for the treatment of anti-neutrophil cytoplasmic autoantibody (ANCA)-associated vasculitis and lupus nephritis. Moreover, mechanistic insights have potential to open new therapeutic strategies in the future.
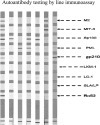
Abnormal liver function tests are frequently seen in patients with multiple sclerosis (MS) and their origin at times is attributed to the possible co-occurrence or the de novo induction of autoimmune liver diseases (AILD), namely autoimmune hepatitis (AIH) and primary biliary cholangitis (PBC), but comprehensive analysis of AILD-related autoantibody has not been carried out. To assess the presence of AILD-related autoantibodies in a well-defined cohort of MS patients, and to assess their clinical significance. 133 MS (93 female) patients (102 RRMS, 27 SPMS, and 5 PPMS), mean age 42.7 ± 11.9 SD years, mean duration of disease 11.2 ± 7.2 years were studied. 150 age and sex-matched healthy individuals were tested as normal controls (NCs).Autoantibody testing was performed by indirect immunofluorescence (IF) using triple tissue and HEp-2, a multiparametric line immunoassay detecting anti-LKM1(anti-CYP2D6), anti-LC1(anti-FTCD), soluble liver antigen/liver-pancreas(anti-SLA/LP), AMA-M2, and AMA-MIT3 (BPO), PBC-specific ANA (anti-gp210, anti-sp100 and anti-PML), and ELISA for anti-F-actin SMA and anti-dsDNA antibodies. Reactivity to at least one autoantibody was more frequent in MS patients compared to NCs (30/133, 22.6% vs 12/150, 8%) NCs (p = 0.00058). SMAs by IIF were more frequent in MS patients (18/133, 13.53%) compared to NCs (6/150, 4%, p = 0.002%). The AIH-1 related anti-F-actin SMA by ELISA were present in 21 (15.8%), at relatively low titres (all but three of the SMA-VG pattern by IF); anti-dsDNA in 3 (2.3%), and anti-SLA/LP in none; AIH-2 anti-LKM1 autoantibodies in 1 (0.8%, negative by IF), and anti-LC1 in none; PBC-specific AMA-M2 in 2 (1.5%, both negative for AMA-MIT3 and AMA by IF) and PBC-specific ANA anti-PML in 6 (4.5%), anti-sp100 in 1 (0.8%) and anti-gp210 in 1 (0.8%). Amongst the 30 MS patients with at least one autoantibody positivity, only 4 (3%) had overt AILD (2 AIH-1 and 2 PBC). Autoantibody positivity did not differ between naïve MS patients and patients under treatment. Despite the relatively frequent presence of liver autoantibodies, tested either by IF or molecular assays, overt AILD is rather infrequent discouraging autoantibody screening strategies of MS patients in the absence of clinical suspicion.
Via Krishan Maggon
|
|
Scooped by
Gilbert C FAURE
February 29, 2020 5:05 AM
|
KEY POINTS Reduced IL-37 was associated with the pathogenesis of MG. Tfh and B cells highly express IL-37 receptor SIGIRR. IL-37 represses the activation of Tfh and B cells via STAT3 signaling. Abstract IL-37 is a newly identified immune-suppressive factor; however, the function, cellular sources, and mechanism of IL-37 in humoral immunity and Myasthenia gravis (MG) are still unclear. In this study, we found IL-37 were substantially downregulated in the serum and PBMCs of MG patients compared with healthy controls. The lower IL-37 was associated with severer disease (quantitative MG score) and higher follicular Th (Tfh)/Tfh17 and B cell numbers. Flow cytometry analysis revealed that IL-37 was mainly produced by CD4+ T cells without overlapping with Th1, Th17, and Tfh subsets in MG patients. Regulatory IL-37+ T cell rarely expressed Foxp3 and CD25 but produced numerous IL-4. Tfh and B cell expressed high levels of SIGIRR, the receptor of IL-37, in MG patients. Mechanically, IL-37 directly bond to SIGIRR, repressed the proliferation, cytokine production of Tfh and B cells, and the secretion of autoantibody via inhibition of STAT3 signaling in Tfh and B cells. Footnotes This work was supported by the National Natural Science Foundation of China (Grants 81701235, 81991514, and 81200876), the Fundamental Research Funds for the Central Universities (Grant 021414380446), the Key Research and Development Program of Jiangsu Province of China (Grant BE2016610), and the Jiangsu Province Key Medical Discipline (Grant ZDXKA2016020). Received September 26, 2019. Accepted January 26, 2020. Copyright © 2020 by The American Association of Immunologists, Inc.
|
|
Scooped by
Gilbert C FAURE
November 17, 2019 5:43 AM
|
BACKGROUND: The incidence of autoimmune encephalitis has risen globally. There are two general categories of disease-associated antibodies that can be tested for: neuronal surface and intracellular. However, testing both groups of autoantibodies are costly. This study aims to identify differences between groups by comparing clinical presentations, radiological findings and CSF profile of patients, and determine if any parameters are indicative of one group of autoantibodies over another. Additionally, we aim to report the local incidence of less common groups of disease-associated antibodies as well. METHODS: Seventy-seven records of autoimmune encephalitis/encephalomyelitis patients admitted to King Chulalongkorn Memorial Hospital, Bangkok, Thailand, between October 2010 and February 2017 were reviewed. Patients with infections or those with classic central nervous system demyelinating features were excluded. RESULTS: Of 77 patients, 40% presented with neuronal surface antibodies and 33% had intracellular antibodies. The most common autoantibody detected in each group was anti-NMDAr antibody (25/31, 81%) and anti-Ri antibody (7/25, 28%) respectively. In the neuronal surface antibody group, behavioral change was the most common complaint (45%), followed by seizures (39%) and abnormal movements (29%). In the latter group, seizure was the most common presenting symptom (32%), followed by motor weakness (20%), behavioural change (16%) and abnormal movements (16%). Patients with neuronal surface antibodies were younger (35 vs 48 years old, p = 0.04) and more likely to present with behavioral change (45% vs 16%, p = 0.02). Mortality rate was higher in the intracellular group (16% vs 3.2%, p = 0.09). No differences were detected in magnetic resonance imaging (MRI) and CSF profile. CONCLUSIONS: In the early stages of the disease, both groups have comparable clinical outcomes. Although there were significant differences in age and percentage of patients with behavioral change, both groups of autoimmune encephalitis still shared many clinical features and could not be distinguished based on MRI and CSF profiles. Therefore, we recommend that patients with features of autoimmune encephalitis should be screened for both the neuronal surface and intracellular antibodies regardless of clinical presentation.
|
|
Scooped by
Gilbert C FAURE
November 13, 2019 8:46 AM
|
Autoantibody production by plasma cells (PCs) plays a pivotal role in the pathogenesis of systemic lupus erythematosus (SLE). The molecular pathways by which B cells become pathogenic PC secreting autoantibodies in SLE are incompletely characterized. Histone deactylase 6 (HDAC6) is a unique cytoplasmic HDAC that modifies the interaction of a number of tubulin- associated proteins; inhibition of HDAC6 has been shown to be beneficial in murine models of SLE, but the downstream pathways accounting for the therapeutic benefit have not been clearly delineated. In the current study, we sought to determine whether selective HDAC6 inhibition would abrogate abnormal B cell activation in SLE. We treated NZB/W lupus mice with the selective HDAC6 inhibitor, ACY-738, for 4 weeks beginning at 20 weeks-of age. After only 4 weeks of treatment, manifestation of lupus nephritis (LN) were greatly reduced in these animals. We then used RNAseq to determine the genomic signatures of splenocytes from treated and untreated mice and applied computational cellular and pathway analysis to reveal multiple signaling events associated with B cell activation and differentiation in SLE that were modulated by HDAC6 inhibition. PC development was abrogated and germinal center (GC) formation was greatly reduced. When the HDAC6 inhibitor-treated lupus mouse gene signatures were compared to human lupus patient gene signatures, the results showed numerous immune, and inflammatory pathways increased in activ
|
|
Scooped by
Gilbert C FAURE
November 8, 2019 1:29 PM
|
Research ArticleAutoimmunityImmunology Free access | 10.1172/JCI127949 Splicing factor SRSF1 controls T cell hyperactivity and systemic autoimmunity Takayuki Katsuyama,1 Hao Li,1 Denis Comte,1,2 George C. Tsokos,1 and Vaishali R. Moulton1 First published September 5, 2019 - More info Abstract Systemic lupus erythematosus (SLE) is a devastating autoimmune disease in which hyperactive T cells play a critical role. Understanding molecular mechanisms underlying the T cell hyperactivity will lead to identification of specific therapeutic targets. Serine/arginine-rich splicing factor 1 (SRSF1) is an essential RNA-binding protein that controls posttranscriptional gene expression. We have demonstrated that SRSF1 levels are aberrantly decreased in T cells from patients with SLE and that they correlate with severe disease, yet the role of SRSF1 in T cell physiology and autoimmune disease is largely unknown. Here we show that T cell–restricted Srsf1-deficient mice develop systemic autoimmunity and lupus-nephritis. Mice exhibit increased frequencies of activated/effector T cells producing proinflammatory cytokines, and an elevated T cell activation gene signature. Mechanistically, we noted increased activity of the mechanistic target of rapamycin (mTOR) pathway and reduced expression of its repressor PTEN. The mTOR complex 1 (mTORC1) inhibitor rapamycin suppressed proinflammatory cytokine production by T cells and alleviated autoimmunity in Srsf1-deficient mice. Of direct clinical relevance, PTEN levels correlated with SRSF1 in T cells from patients with SLE, and SRSF1 overexpression rescued PTEN and suppressed mTORC1 activation and proinflammatory cytokine production. Our studies reveal the role of a previously unrecognized molecule, SRSF1, in restraining T cell activation, averting the development of autoimmune disease, and acting as a potential therapeutic target for lupus. Graphical Abstract Introduction Systemic lupus erythematosus (SLE) is a chronic debilitating multi-system autoimmune disease that disproportionately afflicts women, causing significant morbidity and mortality (1, 2). Failure of the immune system to recognize self-antigens leads to inappropriate immune responses, systemic autoimmunity, and organ damage. The identification of novel molecules and mechanisms underlying the pathogenic immune response in SLE will guide the development of appropriate therapeutic targets. While autoreactive B cells, autoantibodies, and immune complexes are important in disease pathogenesis (3), and elevated type I interferons (IFNs) have been implicated in disease (4, 5), therapeutic strategies targeting B cells and type I IFN signaling in SLE have shown limited success. In this regard, the role of T cells in disease pathogenesis is beginning to be understood, and therapeutic strategies targeting T cells are emerging (6). Aberrantly activated effector T (Teff) cells and cytokines that orchestrate not only germinal center B cell responses for autoantibody production (7–9) but also promote inflammatory infiltration in target organs (10, 11), are critical players in disease pathogenesis. These Teff cells and cytokines are found both in lupus-prone mice and in patients with SLE (12–15), and therefore are potential promising therapeutic targets. Yet the molecules and mechanisms which control the activated T cell phenotype in SLE are poorly understood. A key pathway involved in the activation of T cells is the phosphoinositide-3 kinase (PI3K)/AKT/mechanistic target of rapamycin (mTOR) pathway. The mTOR pathway determines cell fate decisions of T cell activation, differentiation, proliferation, and cell death (16). Resting quiescent T cells have low levels of mTOR activity, while mTOR complex 1 (mTORC1) activation leads to increased proportions of activated/effector cells and a decreased pool of naive cells (17). Recently, mTOR activation has emerged as a central regulator of T cell dysfunction in systemic autoimmune diseases and as a promising therapeutic target for SLE (15, 18). Increased activity of the mTORC1 pathway in T cells is known to promote the aberrant production of cytokines IFN-γ, IL-17, and IL-4 (19, 20), and contribute to systemic autoimmunity (9). Furthermore, activation of mTORC1 is associated with altered aberrantly activated T cell responses in patients with SLE (21, 22). The phosphatase and tensin homolog (PTEN), a lipid phosphatase, negatively regulates the PI3K/Akt signaling pathway (23) and inhibits the activity of the mTOR pathway (24). PTEN-deficient T cells are hyperresponsive to TCR stimulation (25), and Pten deletion in T cells in mice leads to autoimmune lymphoproliferative disease and aberrant production of cytokines (26, 27). PTEN expression is decreased in B cells from patients with SLE and contributes to B cell hyperactivity (28). However, it is still unknown whether PTEN is altered in T cells from patients with SLE and whether it contributes to T cell hyperactivity. Serine arginine-rich splicing factor 1 (SRSF1), previously known as splicing factor 2/alternative splicing factor (SF2/ASF), is the prototype member of the highly conserved serine arginine (SR) family of RNA-binding proteins. SRSF1 controls posttranscriptional gene expression via pre-mRNA alternative splicing, mRNA stability, and translation (29). While SRSF1 is an essential ubiquitous molecule that controls genes involved in cell survival and proliferation (30), little is known of its role in the immune system. T cells from patients with SLE display hyperactive T cell receptor (TCR)/CD3+ signaling and proinflammatory cytokine production (1, 31). This overactive lupus T cell phenotype is associated with a reduced expression of the CD3 zeta (ζ) chain (32), attributed in part to defective alternative splicing of its 3′ UTR (33). Using discovery approaches, we found that SRSF1 binds to the 3′ UTR of the CD3ζ mRNA in human T cells (34, 35). We showed that SRSF1 promotes normal expression of CD3ζ by limiting expression of an unstable isoform of its 3′ UTR (35) and that SRSF1 levels decrease upon T cell activation (36). We demonstrated that SRSF1 expression is aberrantly decreased in T cells from patients with SLE and correlates with severe disease (37)(38). In addition, decreased SRSF1 expression levels have been linked to the defective expression of multiple autoantigen transcripts in the organ-specific autoimmune inflammatory myositis (39). Thus, studies in humans suggest that the reduced expression of SRSF1 correlates with an activated T cell phenotype and the expression of autoimmune disease. However, evidence of a causal in vivo relationship among SRSF1, T cell dysfunction, and autoimmune disease is still lacking. Here we show that mice that lack Srsf1 in mature T cells develop systemic autoimmunity and lupus nephritis with increased proportions of activated/effector T cell populations and proinflammatory cytokine-producing T cells. Mechanistically, we show that T cells from Srsf1-deficient mice exhibit increased mTOR activity and reduced expression of its negative regulator PTEN, whereas rapamycin and overexpression of PTEN normalize the inflammatory cytokine production. Importantly, PTEN levels are reduced in patients with SLE with lower SRSF1 expression and SRSF1 rescues PTEN levels, suppresses mTORC1 activity, and reduces proinflammatory cytokine production by T cells from patients with SLE. Our studies demonstrate that SRSF1 is a previously unrecognized molecule that restrains T cell activation and controls the development of autoimmune disease. Results Srsf1-cKO mice developed autoimmunity and lupus nephritis. Because germline Srsf1 deletion is embryonic lethal (40), we generated conditional distal.Lckcre.Srsf1fl/fl (Srsf1-cKO hereafter) mice to study the role of SRSF1 in T cells (Supplemental Figure 1, A and B; supplemental material available online with this article; https://doi.org/10.1172/JCI127949DS1). At birth, Srsf1-cKO mice were viable with normal external features and body weight (Supplemental Figure 1C). As expected (the distal Lck promoter is expressed late in thymic development and mainly in mature T cells), T cell development was normal in Srsf1-cKO mice (Supplemental Figure 1, C–F). We asked whether the Srsf1-cKO mice develop signs of autoimmunity. We measured autoantibodies in the sera of Srsf1-cKO mice using microarray analyses of serum IgG reactivity against a 128-autoantigen panel, which includes the lupus-associated autoantigens dsDNA, histones, and a number of nuclear, membrane, phospholipid, and cytoplasmic protein autoantigens (Figure 1A). Serum from a lupus-prone MRL/lpr mouse, which spontaneously develops an autoimmune lupus-like disease, was included as positive control. We found that Srsf1-cKO mice develop a wide array of lupus-associated autoantibodies at levels comparable to those seen in MRL/lpr mice (Figure 1A). We confirmed by ELISA the presence of antinuclear (ANA) antibodies in sera from Srsf1-cKO mice (Supplemental Figure 2A). In aged mice (12–18 months), we observed a lymphoproliferative phenotype (Figure 1B and Supplemental Figure 2B). We also found that T cells from Srsf1-cKO mice exhibit increased proliferative capacity as assessed by Ki67 staining (Figure 1C). The kidneys of aged Srsf1-cKO mice showed histopathologic evidence of lupus nephritis with glomerulonephritis, mesangial and endocapillary proliferation, and interstitial inflammatory cell infiltration (Figure 1D) with significantly higher histopathology scores compared with control mice (Figure 1E). Immunohistochemistry staining showed T cell infiltration in kidneys of Srsf1-cKO mice (Supplemental Figure 2C). Srsf1-cKO mice developed significant proteinuria compared with WT mice (Figure 1F). These results demonstrate that the loss of SRSF1 in T cells leads to systemic autoimmunity and lupus-like disease. Figure 1 Srsf1-cKO mice develop systemic autoimmunity and lupus nephritis. (A) Heatmaps show autoantibody microarray data from sera of 12-week-old WT and Srsf1-cKO mice (n = 3 each) and 1 MRL/lpr mouse, analyzed for IgG reactivity against a 128-autoantigen panel. (B) Spleen images from aged (12- to 18-month-old) WT and Srsf1-cKO mice. Data are representative of at least 4 independent experiments. (C) Flow cytometry plots and graphs show Ki67 staining on live-gated CD4+ and CD8+ T cells from spleen of WT and Srsf1-cKO mice (2- to 18-month-old, n = 11 [WT], n = 8 [KO]). (D) Representative light microscopy images of H&E-stained paraffin sections of kidneys from aged (9- to 18-month-old) mice. Original magnification ×40. Arrows represent mesangial and endocapillary proliferation (upper) and interstitial inflammatory cell infiltration (lower). (E) Graph shows semiquantitative scores for kidney histopathology (n = 12 [WT], n = 9 [KO]). (F) Graph shows proteinuria from WT and Srsf1-cKO mice (n = 7 each). Mann-Whitney U test (E); unpaired t test (C and F); *P < 0.05, ***P < 0.005. T cells from Srsf1-cKO mice exhibited a hyperactive phenotype and produced proinflammatory cytokines. Examination of peripheral lymphoid T cells from spleen revealed significantly increased proportions of activated CD69hi cells (Figure 2, A and B), and effector/memory CD44hiCD62Llo and CD44hiCD62Lhi populations in the CD4 and CD8 compartments (Figure 2, C and D). In parallel, we recorded a significant reduction in the naive T cell pool in both CD4 and CD8 compartments (Figure 2E). Further, we found increased proportions of IL-17–, IFN-γ–, and IL-4–producing CD4+ T cells, and IFN-γ–producing CD8+ T cells from Srsf1-cKO mice (Figure 2F). In addition, we found that the frequencies of CD4+ CXCR5+PD1+ T follicular helper (Tfh) cells were increased in Srsf1-cKO mice (Figure 2G). We also detected the increased presence of spontaneous germinal centers in the spleens from Srsf1-cKO mice (Supplemental Figure 2D). We found that the frequencies of GL7+Fas+ germinal center B cells were increased in Srsf1-cKO mice (Supplemental Figure 2E). In addition, IgD– memory/plasma B cells were also increased in Srsf1-cKO mice (Supplemental Figure 2F). There was no difference in the frequencies and absolute numbers of B cells, CD11b+ cells, and CD11c+ cells in spleen of control WT and Srsf1-cKO mice (Supplemental Figure 3, A and B). The frequencies of CD4+CD25+FoxP3+ Treg cells in Srsf1-cKO mice were comparable with those of control mice (Supplemental Figure 4, A and B) and suppressed the proliferation of conventional T (Tconv) cells normally in in vitro Treg suppression assays for 3 days (Supplemental Figure 4, C and D). These results show that loss of SRSF1 induces the development of activated, inflammatory cytokine-producing T cells. Figure 2 T cells from Srsf1-cKO mice have a hyperactive phenotype and produce proinflammatory cytokines. Spleen cells were isolated from WT and Srsf1-cKO mice and analyzed by flow cytometry. (A) Plots show CD69 expression gated on live CD4+ T cells. (B) Graph shows percent of CD69+CD4+ T cells (n = 13 [WT], n = 14 [KO]; < 20-week-old mice). (C) Plots show CD62L and CD44 staining gated on live CD4+ and CD8+ T cells in spleen (D) Graphs show percent of activated effector/ memory subsets (CD44hiCD62Lhi and CD44hiCD62Llo) of CD4+ and CD8+ T cells (CD4+: n = 11 [WT], n = 13 [KO]; CD8+: n = 18 [WT], n = 16 [KO]; < 20-week-old mice). (E) Graphs show percentage of naive (CD44loCD62Lhi) CD4+ and CD8+ T cells (CD4+: n = 11 [WT]; n = 13 [KO]; CD8+: n = 18 [WT], n = 16 [KO]; < 20-week-old mice). (F) Spleen cells were stimulated for 4 hours with PMA, ionomycin with monensin followed by surface and intracellular cytokine staining for flow cytometry. Plots show IL-17, IL-4, and IFN-γ staining gated on live CD4+ and CD8+ T cells. Graphs below show percentage of cytokine-producing CD4+ and CD8+ T cells from spleen (IL-17: n = 8 each; IL-4: n = 6–7; CD4+ IFN-γ: n = 13 each; CD8+ IFN-γ: n = 3–4; CD4+: < 20-week-old mice; CD8+: 9- to 40-week-old mice). (G) Splenocytes from WT or Srsf1-cKO mice were stained for PD1 and CXCR5 by flow cytometry. Plots show cells gated on live CD4+ T cells. Graph below shows percentage of Tfh cells (n = 20 [WT]; n = 21 [KO]; 10- to 28-week-old mice). Unpaired t test, *P < 0.05, **P < 0.005. Transcriptomics analysis of CD4+ Teff cells from Srsf1-cKO mice revealed an elevated T cell activation gene signature. Because the Srsf1-cKO mice develop autoimmune inflammatory disease, and exhibit increased proportions of proinflammatory Teff cells, we asked whether SRSF1 controls the genes and pathways involved in T cell activation and differentiation. We performed transcriptomics analysis by RNA-sequencing of CD4+ Teff cells derived by stimulation of naive CD4+ T cells with anti-CD3 and anti-CD28 for 72 hours, from 7-week-old control WT or Srsf1-cKO mice with 3 mice per group (Figure 3 and Table 1). At the fold change greater than 1, and a P value less than 0.05, 890 genes were upregulated and 1021 genes downregulated in Srsf1-cKO mice compared with control mice, whereas at the fold change greater than 2 cutoff, and a P value less than 0.05, 312 genes were upregulated and 300 genes were downregulated in Srsf1-cKO mice compared with normal mice (Figure 3A). Gene Ontology (GO) enrichment and Kyoto Encyclopedia of Genes and Genomes (KEGG) pathway analyses revealed the top pathways to include genes associated with T cell activation, regulation of protein secretion, cytokine-cytokine receptor interaction, cell cycle, Th17 differentiation, and Th1 and Th2 differentiation (Table 1). Cluster analysis revealed predominantly genes involved in T cell activation, protein secretion, cytokine production, ribosome assembly, cell cycle, and chromatin modifications (Figure 3B). The expression levels of multiple cytokines including Ifng, Il17, Il4, and Il21 were found to be increased (Figure 3C). Because IL-21 is known to play important roles in Tfh differentiation, the increased Il21 expression may contribute to the observed increase in Tfh cells in Srsf1-cKO mice. These data indicate that SRSF1 controls genes involved in T cell activation, differentiation, and cytokine production, and the loss of SRSF1 leads to unrestrained activation and proinflammatory phenotype of T cells. Figure 3 Transcriptomics analysis of CD4+ Teff cells from Srsf1-cKO mice reveals an elevated T cell activation gene signature. (A) CD4+ Teff cells were generated as follows. Naive CD4+ T cells were sorted from spleens of WT and Srsf1-cKO mice (n = 3 each), and stimulated with anti-CD3 (0.5 μg/mL) and anti-CD28 (1.0 μg/mL) for 72 hours. RNA-sequencing data analysis shows differentially expressed (DE) genes with fold change (FC) differences at P < 0.05. (B) GO terms enrichment map of DE genes. The size of the red circles indicates the number of genes within a given pathway, and the color represents the P values relative to the other displayed terms. Outlines (added manually) indicate groups of similar GO terms. (C) Heatmap showing average expression of DE cytokine genes in WT and Srsf1-cKO mice. Table 1 Pathway analysis of RNA-sequencing of CD4+ Teff cells from Srsf1-cKO mice T cells from Srsf1-cKO mice displayed increased activation of the mTORC1 pathway and reduced expression of PTEN. It is known that Pten-deficient mice exhibit features of T cell hyperactivity with increased proinflammatory cytokines and autoimmunity (27). Further, activation of the mTOR pathway is associated with hyperactive T cell responses with inflammatory cytokine production in patients with SLE (15, 21, 22). In our transcriptomics analysis from Srsf1-cKO mice, a number of genes of the PI3K/AKT/mTOR pathway were differentially expressed, and the expression of its repressor PTEN was found to be downregulated (Figure 4A). Given these findings, we examined the activity of the mTOR pathway in the Srsf1-cKO mice. We found increased expression of phosphorylated S6 (pS6) protein levels in CD4+ Teff cells derived by stimulation of naive CD4+ T cells with anti-CD3 and anti-CD28 for 72 hours, indicating an increased activity of the mTORC1 pathway (Figure 4B). It was previously reported that SRSF1 regulates the splicing of S6K1, an mTORC1 downstream signaling molecule, and modulates the mTOR pathway in cell lines (41). We found that deletion of Srsf1 in T cells results in the decrease of the short isoform of S6K1 (Supplemental Figure 5), consistent with previous reports. Although this short isoform of S6K1 associates with activation of the mTORC1 pathway (42), in the present study we found that serine-threonine kinase AKT, upstream of S6K1, is activated in CD4+ Teff cells from Srsf1-cKO mice (Figure 4C). Therefore, we hypothesized that decreased PTEN levels result in the activation of mTOR pathway. We confirmed the decreased mRNA (Figure 4D) and protein (Figure 4E) expression levels of PTEN in T cells from Srsf1-cKO mice. Because SRSF1 controls gene expression at the posttranscriptional level, which is frequently mediated through the 3′ UTR, we investigated the effect of SRSF1 on the 3′ UTR activity of PTEN. Cotransfection of a PTEN 3′ UTR–luciferase construct along with an Srsf1-expression vector in HEK293T cells revealed an increase in PTEN 3′ UTR activity (Figure 4F). Transfection of the PTEN 3′ UTR into freshly isolated total T cells from Srsf1-cKO mice led to decreased 3′ UTR activity, which was rescued by the overexpression of SRSF1 (Figure 4G). These results show that SRSF1 controls the expression of PTEN and loss of SRSF1 leads to reduced PTEN expression and increased activity of the mTOR pathway. Figure 4 T cells from Srsf1-cKO mice exhibit increased activation of the mTORC1 pathway and reduced expression of PTEN. (A) Fold expression of the mTOR pathway genes from RNA-sequencing data. (B–D) Naive CD4+ T cells were isolated from spleens of mice, and stimulated with anti-CD3 (0.5 μg/mL) and anti-CD28 (1.0 μg/mL) for 72 hours. (B) Total protein was immunoblotted for pS6 and total S6. Data are from 1 representative of 3 independent experiments. Graph shows relative densitometry quantitation of pS6 and S6 (n = 3 each). (C) After 72 hours, additional stimulation with anti-CD3 (10 μg/mL) and anti-CD28 (10 μg/mL) for 5 minutes was performed. Total protein was immunoblotted for p-AKT and total AKT. Data are from 1 representative of 4 independent experiments. Graph shows relative densitometry quantitation of p-AKT and AKT (n = 4 each). (D) Total RNA was isolated and reverse transcribed. Pten expression was measured by real-time qPCR and normalized to housekeeping gene cyclophilin A (n = 5 each). (E) Total protein was isolated from total T cells and immunoblotted for PTEN and β-actin. Data are from 1 representative of 4 independent experiments. Graph shows densitometric quantitation of PTEN normalized to β-actin (n = 4 each). (F) HEK293T cells were transfected with a pGL3–PTEN 3′ UTR luciferase plasmid and cotransfected with either a pcDNA3.1 empty vector (EV) or an Srsf1 (pSrsf1) plasmid, and included an internal control pRL-TK luciferase plasmid. Cells were lysed and dual luciferase assays performed. Graph shows relative luciferase units normalized to the internal luciferase control from n = 4 in 4 independent experiments. (G) T cells from spleens of mice were transfected with a PTEN-3′ UTR luciferase plasmid and either EV or pSrsf1 plasmid. Twenty-four hours later, cells were lysed and luciferase activity measured as in F (n = 7). Unpaired t test (B–E); 1-way ANOVA with Bonferroni’s correction (F and G); *P < 0.05, **P < 0.005, ***P < 0.0005; mean ± SEM. Rapamycin treatment reduced proinflammatory cytokine production by T cells and alleviated autoimmunity in Srsf1-cKO mice. Recently, hyperactivity of the mTOR pathway has been associated with aberrant T cell responses in SLE (15, 43), and targeted inhibition of this pathway with the lipophilic macrolide antibiotic rapamycin has led to improved T cell function and shown efficacy in a recent clinical trial in patients with active SLE (44). To assess whether the increased mTORC1 activation of T cells from Srsf1-cKO mice contributes to their proinflammatory phenotype and autoimmune phenotype, we examined the effect of rapamycin. Treatment of spleen cells from Srsf1-cKO mice ex vivo with rapamycin reduced the production of proinflammatory cytokines IL-17 (Figure 5, A and B) and IFN-γ (Figure 5, C and D) from CD4+ T cells. Furthermore, to assess the effects of rapamycin on disease in vivo, we treated Srsf1-cKO mice with rapamycin and evaluated the effect on features of autoimmunity. We observed reduced levels of IL-17 cytokine production ex vivo (Figure 5E), and decreased proportions of CD4+ PD1+CXCR5+ Tfh cells in the spleens from cKO mice (Figure 5F). Importantly, we observed a reduction in the levels of serum dsDNA and histone autoantibodies (Figure 5G). In addition, treatment with rapamycin reduced T cell infiltration into the kidneys (Figure 5H). These data indicate that deficiency of SRSF1 leads to increased activation of the mTOR pathway, the ensuing proinflammatory function of T cells, and systemic autoimmunity, which can be corrected by rapamycin. Figure 5 Rapamycin treatment reduces proinflammatory cytokine production by T cells and alleviates autoimmunity in Srsf1-cKO mice. (A–D) Spleen cells from WT or Srsf1-cKO mice were cultured for 4 hours with PMA plus ionomycin in the presence of monensin. Rapamycin (1 nM or 10 nM) was added for the duration of cultures. Cells were collected, surface stained, fixed, and permeabilized for intracellular cytokine staining. (A and C) Plots show IL-17 and IFN-γ intracellular staining gated on live CD4+ T cells. (B) Graphs show data from n = 8 mice in 7 independent experiments. (D) Graph shows data from n = 15 mice each in 10 independent experiments. (E–H) Rapamycin (2 mg/kg) or PBS was administered to WT and Srsf1-cKO mice by intraperitoneal injection once every 2 days for 4 weeks (F and G) or every day for 1 week (E and H). (E) Spleen cells were cultured with anti-CD3 (2 μg/mL) and anti-CD28 (2 μg/mL) for 24 hours and IL-17A measured in the supernatants by ELISA. Data are shown as fold values normalized to controls (n = 5 mice in 2 independent experiments). (F) Spleen cells were analyzed by flow cytometry, and graph shows the frequency of Tfh cells in spleen (n = 5–6 mice in 2 independent experiments). (G) Serum was collected and autoantibodies measured by ELISA (n = 5–6 mice in 2 independent experiments). (H) Cells from kidneys were analyzed by flow cytometry, and graph shows the frequency of T cells in kidneys (n = 5 mice in 2 independent experiments). One-way ANOVA with Bonferroni correction (B, D, E, and F); 2-tailed unpaired t test (G and H); *P < 0.05, **P < 0.005; mean ± SEM. PTEN overexpression reduced proinflammatory cytokine production by T cells from Srsf1-cKO mice. To confirm that SRSF1 modulates T cell activation via regulation of PTEN expression, PTEN was overexpressed by transient transfections in T cells from WT and Srsf1-cKO mice, followed by stimulation with PMA and ionomycin for 4 hours. We confirmed the overexpression of PTEN at the mRNA and protein levels (Supplemental Figure 6, A and B). We found that cytokine production is decreased by PTEN overexpression in T cells from Srsf1-cKO mice but not in WT T cells (Figure 6, A and B). Of note, transfection by electroporation is toxic to cells and accounts for the overall reduced frequencies of IFN-γ–producing cells (Figure 6) compared with untransfected cells (Figure 5C and Supplemental Figure 6C). These data indicate that deficiency of SRSF1 leads to decreased PTEN expression, increased activation of the mTOR pathway and the ensuing proinflammatory function of T cells (Supplemental Figure 7) which contribute to systemic autoimmune disease. Figure 6 PTEN overexpression reduces proinflammatory cytokine production by T cells from Srsf1-cKO mice. (A) T cells were isolated from spleens of WT or Srsf1-cKO mice and transfected by electroporation with empty vector (EV) or PTEN overexpression plasmid (pPTEN). Sixteen hours later, cells were stimulated with PMA plus ionomycin in the presence of monensin for 4 hours and cells were collected, surface stained, fixed, and permeabilized for intracellular cytokine staining. (B) Graphs show average data from n = 9 mice in 5 independent experiments. Two-tailed paired t test, *P < 0.05, mean ± SEM. PTEN is decreased in T cells from patients with SLE with low SRSF1 levels. Although PTEN expression is decreased and contributes to the hyperactivity of B cells in patients with SLE (28), its role in T cells in SLE has not been studied. Given our findings of increased mTOR activity and the decreased expression and regulatory role of PTEN in T cells from the Srsf1-cKO mice (Figure 4, Figure 5, and Figure 6), we asked whether PTEN expression levels are altered in T cells from patients with SLE. Therefore, we assessed PTEN and SRSF1 protein expression levels in T cells from patients with SLE and compared with age-, race-, and sex-matched healthy control individuals. We found that the expression of PTEN was decreased in T cells from patients with SLE who had decreased expression levels of SRSF1, compared with those from healthy individuals (Figure 7A). Importantly, we observed a linear correlation between PTEN and SRSF1 expression levels in T cells from patients with SLE (R2 = 0.226, P = 0.0163, Figure 7B). These results suggest that the low SRSF1 levels may contribute to the reduced expression of PTEN in T cells from patients with SLE. Figure 7 PTEN is decreased in T cells from patients with SLE and correlates with SRSF1 levels. SRSF1 overexpression increases PTEN, suppresses mTORC1 activity, and reduces proinflammatory cytokine production. (A and B) Peripheral blood T cells were isolated from patients with SLE and normal (N) healthy control individuals. Total protein was immunoblotted for PTEN, SRSF1, and β-actin. (A) Data are from 1 representative of 10 independent experiments. Graph shows relative quantitation by densitometry (n = 14 SRSF1 low and n = 12 SRSF1 normal patients). (B) Graph shows a linear correlation between relative PTEN and SRSF1 expression. (C) Peripheral blood T cells were isolated from patients with SLE and transfected with empty vector (EV) or SRSF1 overexpression plasmid (pSrsf1). At 16 to 18 hours after transfections, SLE T cells were stimulated with anti-CD3, anti-CD28, and crosslinker for 5 minutes. Total protein was immunoblotted for PTEN. Data are from 1 representative of 5 independent experiments (n = 10). Graph shows relative quantitation by densitometry. (D) Total protein was immunoblotted for pS6 and total S6 in stimulated SLE T cells after transfection as described in C. Data are from 1 representative of 4 independent experiments (n = 4). Graph shows relative quantitation by densitometry. (E) At 16 to 18 hours after transfection, cells were stimulated with PMA and ionomycin in the presence of monensin. After 4 hours, cytokine production was analyzed by flow cytometry. Graphs show quantitation of cytokine data (n = 8). Paired t test, *P < 0.05, mean ± SEM. The mTOR pathway via the regulation of PTEN expression. In T cells from KO mice and patients with SLE, reduced SRSF1 levels contribute to reduced PTEN levels and increased activity of the mTOR pathway. Rapamycin blocks the mTORC1 pathway and reduces proinflammatory cytokines. SRSF1 overexpression increased PTEN levels, suppressed mTORC1 activity, and reduced proinflammatory cytokine production in T cells from patients with SLE. To assess whether SRSF1 overexpression would increase PTEN expression and reduce mTORC1 activity and the aberrant cytokine production by T cells from patients with SLE, we transiently transfected T cells from patients with SLE with an Srsf1-expression vector followed by stimulation with anti-CD3 and anti-CD28. We found that SRSF1 overexpression increased PTEN protein levels (Figure 7C), reduced activation of the mTORC1 pathway as evidenced by a reduction in pS6 expression levels (Figure 7D), and led to reduced frequencies of IL-17– and IFN-γ–producing CD4+ T cells (Figure 7E). These findings show that decreased SRSF1 expression contributes to mTORC1 activation and proinflammatory cytokine production in T cells from patients with SLE through the control of PTEN. Discussion In this study, we demonstrate that selective deletion of SRSF1 in T cells in mice leads to aberrantly activated proinflammatory cytokine-producing Teff cells, leading to systemic autoimmunity and lupus nephritis (Figure 1 and Figure 2). We report that SRSF1 controls the expression of genes involved in T cell activation, differentiation, and cytokine signaling (Figure 3). At the mechanistic level, we demonstrate that SRSF1 regulates the 3′ UTR of the mRNA of the mTOR inhibitor PTEN and limits its expression, causing increased mTOR activity (Figure 4). Rapamycin treatment corrects proinflammatory cytokine production in T cells and alleviates autoimmunity in Srsf1-deficient mice (Figure 5). Of clinical relevance is our finding that T cells from patients with SLE with low expression levels of SRSF1 had decreased levels of PTEN, which correlate with decreased expression levels of SRSF1 (Figure 7). Further, restitution of SRSF1 levels corrected the proinflammatory cytokine production by hyperactive SLE T cells (Figure 7). Thus, we uncover SRSF1 as what we believe is a novel molecular brake in the control of T cell hyperactivity and the prevention of autoimmune disease. Our findings highlight an important role for SRSF1 in the immune system and in the control of immune-mediated disease. SRSF1 deficiency unrestrains T cell activation, unleashes the production of proinflammatory cytokines IL-17 and IFN-γ by CD4+ Teff cells, and leads to activation of B cells and inflammatory infiltration in target organs, leading to systemic autoimmunity and organ inflammation. Increased activity of the mTOR pathway contributes to the proinflammatory phenotype, which is rescued by rapamycin administration. The mTOR pathway is a recently emerging crucial therapeutic target in autoimmune diseases, including SLE (15, 43). Increased mTORC1 activity has been demonstrated in T cells from patients with SLE and correlates with expansion of proinflammatory cytokine-producing T cells (21, 22). Treatment of lupus-prone MRL/lpr mice with rapamycin, an inhibitor of mTORC1 signaling, improved disease parameters (45). Importantly, a recent clinical trial of rapamycin in patients with SLE has shown efficacy in patients with active SLE (44). Here, we find that SRSF1 deficiency in mice results in increased activation of mTORC1 pathway, which parallels the observed increased mTORC1 activity (15) and the decreased SRSF1 expression in patients with SLE (37). Although PTEN is known to suppress the mTOR pathway and the expression of PTEN is decreased in B cells from patients with SLE (28), the role of PTEN in T cells from patients with SLE remains unknown. We previously showed that the expression levels of SRSF1 are decreased in SLE T cells and inversely correlate with disease activity, suggesting the important role of SRSF1 in SLE T cells (37). Our current study extends this concept with a number of crucial new findings. Here we show a linear correlation between PTEN and SRSF1 in T cells from patients with SLE, and that patients with lupus with low SRSF1 expression levels exhibit lower expression levels of PTEN. Furthermore, the overexpression of SRSF1 rescues PTEN expression in lupus T cells (Figure 7). This is the first evidence showing the reduction of PTEN in T cells in a subset of patients with SLE. Moreover, the overexpression of SRSF1 in lupus T cells reduces mTOR activity and the production of proinflammatory cytokines, suggesting that the SRSF1-PTEN-mTOR pathway may be a novel therapeutic target in patients with SLE. T cell quiescence is enforced by molecules able to restrain T cell activation, and the expression of such molecules generally subsides upon TCR stimulation to enable effector differentiation programs. These genes include, among others, the Kruppel-like factor (KLF) genes, Schlafen-2, Tsc2, and the Forkhead box (Foxo) family (46). T cells from the Srsf1-cKO mice preferentially expressed genes involved in the Foxo1 signaling pathway, cell cycle, T cell activation, cytokine-cytokine receptor interaction, and Th differentiation programs. Therefore, it appears that SRSF1 may be involved in the maintenance of resting T cell quiescence. In agreement with these findings is our previous finding that high SRSF1 protein levels in resting human T cells decreased following TCR stimulation due to degradation by the ubiquitin-proteasome pathway (36). In contrast, deficiency or decreased expression of SRSF1 as recorded in our Srsf1-cKO mice and in patients with SLE, respectively, contributes to T cell activation, loss of tolerance, autoimmunity, and organ inflammation. Of direct clinical relevance is the observation that T cells from patients with SLE exhibit a hyperactive phenotype and functional defects (13), which are linked mechanistically to decreased SRSF1 expression (37). A limitation of our study is that the T cell–restricted deletion of Srsf1 is under the distal Lck promoter, which is expressed late during thymic development, as opposed to the proximal Lck promoter, which is expressed early in the double-negative thymocytes. Therefore, the role of SRSF1 in early thymic development is bypassed, which may differentially influence T cell physiology and function. Also, Srsf1 is absent from birth and does not address the possibility of altering T cell function should its levels decrease later in life. Deletion of Srsf1 in adult mice may result in differential physiological and pathophysiological outcomes. SRSF1 levels are decreased in T cells from patients with SLE but are not completely absent. Therefore, while the homozygous Srsf1-cKO mice are used in proof-of-concept studies here, the heterozygous (distal.Lckcre.Srsf1flox/wt mice) Srsf1-cKO mice, which also develop some features of T cell activation and signs of autoimmune disease (unpublished observations), may serve as a better model for human disease in future studies. Because SRSF1 regulates target genes via various mechanisms, it is possible that other pathways also contribute to T cell activation and autoimmunity. In addition, although the frequency of Tregs and functional results from short-term in vitro suppression assays are comparable between WT and Srsf1-cKO mice, further studies (including generating Treg conditional Srsf1-cKO mice) are required to assess precisely the role of SRSF1 in Tregs. Furthermore, the differences observed in the distribution of activated/memory T cell populations within the CD4 and CD8 compartments imply a potentially differential role of SRSF1 in CD4+ and CD8+ T cells (Figure 2, C–E). Besides these limitations, our patient numbers in the human studies are small, and a larger cohort of patients with SLE is needed to systematically define the clinical characteristics of patients stratified based on molecular levels of SRSF1 and PTEN. In addition, whether T cells from patients with SLE with and without low SRSF1 expression exhibit differential response to rapamycin needs to be examined. Increased activation of the mTOR pathway is associated with altered metabolism in T cells in mice and in patients with SLE (47, 48). It would be interesting to assess whether Srsf1-deficient T cells exhibit such defects. In conclusion, we have uncovered what we believe is a previously unrecognized role of SRSF1 in T cell physiology and demonstrated the impact of its absence on the expression of autoimmune disease. Loss of SRSF1 limits the expression of the mTOR repressor PTEN, leading to aberrant T cell activation and the expression of systemic autoimmunity. Our results suggest that prevention of the loss of SRSF1 should be of therapeutic value to autoimmune diseases. Methods Human subjects. Patients with SLE, all fulfilling the American College of Rheumatology classification criteria (49), were recruited at the rheumatology clinic at Beth Israel Deaconess Medical Center (BIDMC), Boston, MA (Supplemental Table 1). Age-, race-, and sex-matched healthy individuals were recruited as controls. Peripheral blood was drawn from patients by venipuncture. Mice. C57BL/6J (stock 000664), B6.129S4-Srsf1-flox (stock 018020), and B6.dLck.Cre (stock 012837) mice were purchased from The Jackson Laboratory. In most experiments, sex-matched littermates were used as WT controls. All mice were maintained in the specific pathogen–free animal facility at BIDMC. Antibodies and reagents. The following flow cytometry antibodies were from Biolegend: anti–mouse-CD4 (clone GK1.5), CD8a (clone 53-6.7), CD11b (clone M1/70), CD11c (clone N418), CD19 (clone 6D5), CD25 (clone PC61), CD44 (clone IM7), B220 (clone RA3-6B2), CD62L (clone MEL-14), CD69 (clone H1.2F3), CD90.2 (clone 53-2.1), TCR-β (clone H57-597), IgD (clone 11-26c.2a), IL-4 (clone 11B11), IL-17A (clone JC11-18F10.1), IFN-γ (clone XMG1.2), CXCR5 (clone L138D7), Ki67 (clone 16A8), CD127 (clone A019D5), PD-1 (clone 29F.1A12), GL7 (clone GL7), purified anti–mouse-CD3 (clone 145-2C11), CD28 (clone 37.51), CD16/32 (Fc block), anti–human CD3 (clone OKT3), CD4 (clone OKT4), CD8 (clone SK1), and IFN-γ (clone 4S.B1). Brilliant Violet 421–conjugated streptavidin, Zombie Aqua Fixable Viability kit mouse IL-17A ELISA kit, and carboxyfluorescein succinimidyl ester (CFSE) were also from Biolegend. Anti-mouse Foxp3 (clone FJK-16s) antibody, mouse regulatory T cell staining kit, and anti–human IL-17A antibody (clone eBIO64DEC17) were from eBioscience. Anti–mouse Fas (clone Jo2) antibody, Cytofix/Cytoperm, Perm/Wash buffer, and monensin were from BD Biosciences. ACK lysing buffer was from Thermo Fisher Scientific. SRSF1 rabbit polyclonal antibody for flow cytometry was from LifeSpan Biosciences and monoclonal antibody for Western blot (clone 96) was from Thermo Fisher Scientific. Anti-S6 ribosomal protein phospho-Ser 235 and Ser 236 (clone D57.2 2E), anti-S6 ribosomal protein (clone 5G10), anti-PTEN (clone 138G6), anti–phospho-AKT (Ser473; clone D9E), anti–phospho-AKT (Thr308; clone 244F9), and anti-AKT (clone C67E7) antibodies were from Cell Signaling Technology. Phorbol myristic acid (PMA), ionomycin, mitomycin C, and β-actin antibody (clone AC-74) were from Sigma-Aldrich. Goat anti–rabbit IgG horseradish peroxidase (HRP) and goat anti–mouse IgG HRP antibodies were from Thermo Fisher Scientific. Rapamycin and goat anti–mouse IgG were from Millipore. HEK293T cells were purchased from American Type Culture Collection (ATCC). The pcDNA3.1-SRSF1 expression plasmid was a gift from James Manley (Columbia University, NY), and the pGL3-PTEN 3′ UTR plasmid was a gift from Jeffrey Rosen (Addgene plasmid 28104). The pcDNA3-FLAG PTEN plasmid was a gift from Jaewhan Song (Addgene plasmid 78777). Cell isolation and tissue processing. Spleens and lymph nodes were homogenized using a syringe plunger and mesh cell strainer. After perfusion, kidneys were homogenized and digested in HBSS medium with 1.5 mg/mL collagenase B (Boehringer Mannheim) at 37°C for 30 minutes. RBC lysis was performed with ACK lysing buffer. All cell cultures were in RPMI complete medium (RPMI plus 10% FBS plus penicillin and streptomycin antibiotics). Blood samples from mice were collected by tail vein incision and capillary tube collection, and serum was separated by centrifugation. Urine samples were collected from mice in individual metabolic cages and urine protein was measured by Multistix (Siemens). Human T cells from peripheral blood were isolated using the Rosette Sep human T cell enrichment cocktail (STEMCELL Technologies). For histopathology, tissues were immediately fixed in 10% formalin overnight, processed in an automated tissue processor, embedded into paraffin blocks, and sent to the BIDMC histopathology core for sectioning and slide staining with H&E. Slides were evaluated blind for histopathology scoring, utilizing semiquantitative scoring criteria for lupus nephritis (50). Flow cytometry. Zombie aqua viability dye was used for live/dead cell staining. Surface staining was performed in FACS staining buffer (PBS plus 2% FBS) on ice for 20 minutes with Fc block. For cytokine production, cells from mice were stimulated for 4 hours in culture medium with PMA (100 ng/mL), ionomycin (1 μM), and monensin (1 μL/mL). Human T cells were stimulated with PMA (10 ng/mL), ionomycin (400 ng/mL), and monensin (1 μL/mL) for 4 hours. Cells were surface stained followed by fixation and permeabilization. Appropriate antibodies were used for intracellular staining for cytokines or Foxp3 and Ki67. Flow cytometry data were acquired on a BD LSRII or CytoFLEX LX and analyzed with FlowJo software. All procedures were performed according to the manufacturer’s instructions. Autoantibody detection. Sera from 12-week-old WT and Srsf1-cKO mice and one 16-week-old MRL/lpr mouse (as positive control) were analyzed for the presence of autoantibodies using the Autoantigen Microarray Super Panel (128-antigen panel) at the Genomics and Microarray Core facility at the University of Texas, Southwestern Medical Center (Dallas, TX). Heatmaps were prepared using R software. Antinuclear antibody (ANA) in serum was measured using an ELISA kit (Alpha Diagnostic International) following the manufacturer’s instructions. Briefly, the serum was diluted and assayed for antigen reactivity on precoated plates followed by incubation for 60 minutes. Bound IgG was detected with anti–mouse IgG HRP antibody and developed with a tetramethylbenzidine (TMB) substrate. Plates were read at 450 nm on a spectrophotometer. To detect anti–double stranded (ds)DNA and anti–histone antibodies, Immulon II plates (Dynatech) precoated with BSA were coated individually with 50 μg/mL calf thymus DNA (Sigma-Aldrich) or 50 μg/mL calf thymus histone (Sigma-Aldrich). The serum was diluted (1:500) and assayed for autoantigen reactivity against the antigens described above by incubation overnight at 4°C. Bound IgG was detected with a goat polyclonal HRP–anti-mouse IgG detection antibody (SouthernBiotech) and visualized at 450 nm using a TMB substrate (Sigma-Aldrich). mRNA expression and RT-PCR. Total RNA was isolated using the RNeasy mini kit (Qiagen) and reverse-transcribed into cDNA using the RNA to cDNA premix (Clontech). Real-time PCR amplification was carried out with SYBR Green I using a LightCycler 480 (Roche) and the following program: initial denaturation at 95°C for 5 minutes; 40 cycles of amplification (denaturation at 95°C for 15 seconds, annealing at 60°C for 15 seconds, extension at 72°C for 30 seconds); one cycle of melting curves (95°C for 15 seconds, 65°C for 2 minutes, and 97°C continuous), and a final cooling at 37°C. Threshold cycle values were used to calculate relative mRNA expression by the ΔCt relative quantification method. Primer sequences are listed in Supplemental Table 2. RNA sequencing. Naive CD4+ T cells were isolated from spleens of 7-week-old WT and Srsf1-cKO mice (n = 3 each) and stimulated with anti-CD3 (0.5 μg/mL) and anti-CD28 (1 μg/mL) for 72 hours. Cells were restimulated with PMA (100 ng/mL) and ionomycin (1 μM) for 4 hours. Total RNA was extracted using the RNeasy mini kit (Qiagen) and submitted for sequencing to the Molecular Biology Core Facility (MBCF) at the Dana-Farber Cancer Institute (DFCI). Libraries were prepared using Illumina TruSeq Stranded mRNA sample preparation kits according to the manufacturer’s protocols. Samples were sequenced on an Illumina NextSeq500 run with single-end 75-bp reads. Data analyses were performed by the MBCF at DFCI and the Harvard T.H. Chan School of Public Health Biostatistics Core. The data were deposited in the NCBI Gene Expression Omnibus (GEO) database under accession number GSE 136286. Western blot. To detect pS6, naive CD4+ T cells were isolated from spleens of 9- to 10-week-old WT and Srsf1-cKO mice and stimulated with anti-CD3 (0.5 μg/mL) and anti-CD28 (1 μg/mL) for 72 hours. Human T cells were stimulated with soluble anti-CD3 (5 μg/mL), anti-CD28 (2.5 μg/mL) and cross linker goat anti–mouse IgG (10 μg/mL) for 5 minutes. Cells were lysed with radioimmunoprecipitation assay (RIPA) buffer (Boston Bioproducts). Lysates were electrophoresed on NuPAGE 4%–12% Bis-Tris gels (Life Technologies) and transferred to PVDF membrane. Membranes were blocked with 5% (wt/vol) nonfat milk in Tris-buffered saline with 0.05% Tween 20 (TBS-T) for 1 hour, incubated with primary antibody (1:1000, or 1:10,000 for β-actin antibody) in 5% milk in TBS-T or Hikari solution A (Nacalai Tesque) at 4°C overnight or at room temperature for 2 hours for β-actin antibody. Membranes were washed 3 times with TBS-T, incubated with HRP-conjugated secondary antibody (1:2000 for ECL detection reagents or 1:4000 for ECL prime detection reagents; GE Healthcare) for 1 hour, washed 3 times with TBS-T, developed with ECL reagents, and visualized by a Fujifilm LAS-4000 imager or Bio-Rad ChemiDoc imager. Densitometry was performed using Quantity One software (Bio-Rad). Transfections. HEK293T cells were cultured in DMEM complete medium. One day prior to transfection, 0.3 × 10⁶ cells were seeded in a 12-well plate. Cells were cotransfected with the pGL3-PTEN 3′ UTR luciferase plasmid and either pcDNA3.1 empty vector (EV) or pcDNA3.1-Srsf1 vector using Lipofectamine (Invitrogen). All transfections included a pRL-TK Renilla luciferase plasmid as internal control. Human T cells and mouse T cells were transfected using the Amaxa human T cell nucleofector kit and the mouse T cell nucleofector kit, respectively, following the manufacturer’s instructions. Briefly, 3 × 10⁶ to 6 × 10⁶ cells were resuspended in 100 μL nucleofector solution, plasmid DNA was added, and cells were transferred into a cuvette and electroporated using the U-014 program for human cells or the X-001 program for mouse cells in the nucleofector device. Cells were immediately rescued into prewarmed medium and cultured overnight. Luciferase assays. Cells were transfected as described above. After 24 hours in culture, cells were collected, lysed in passive lysis buffer (Promega), and luciferase activity was quantified on a luminometer using the dual-luciferase assay system (Promega) according to the manufacturer’s instructions. Immunofluorescence and immunohistochemistry staining. For immunofluorescence staining, spleens were embedded in OCT tissue media (Tissue-Tek) and frozen on dry ice. Frozen sections (7-μm thickness) were fixed to slides in ice-cold acetone for 15 minutes and air dried for 30 seconds. The sections were blocked with 10% horse serum for 30 minutes at room temperature, then stained for 30 minutes at room temperature in a humidified chamber with fluorescence-conjugated anti-IgD (catalog 405717; Biolegend), anti-CD4 (catalog 100533; Biolegend), anti-B220 (catalog 103207; Biolegend), and biotinylated PNA (catalog B-1075; Vector Laboratories). Biotinylated PNA was detected using by streptavidin–Alexa Fluor 350 (catalog S-11249; Life Technologies). For immunohistochemistry staining, slides of formalin-fixed, paraffin-embedded kidneys were incubated with purified anti–mouse CD3 antibody (clone 100201; Biolegend) overnight at 4°C after antigen retrieval. The primary antibody was detected with rabbit anti–rat HRP secondary antibody (clone ab6734, Abcam). In vitro suppression assays. Total T cells were isolated from spleens by magnetic assisted cell sorting (MACS), using the Pan T cell isolation kit (Miltenyi Biotech). Conventional CD4+ T cells (Tconv) (CD4+CD25–CD127hi) and Treg cells (CD4+CD25+CD127lo) were sorted by flow cytometry (FACSAria II, BD Bioscience). Tconv cells were labeled with CFSE and cocultured with Treg cells at increasing ratios for 3 days in the presence of mitomycin C–treated splenocytes and anti-CD3 and anti-CD28, and proliferation of Tconv was analyzed by flow cytometry. Rapamycin treatment. Rapamycin was dissolved in DMSO and diluted in PBS. For in vitro culture treatment experiments, a final concentration of 1 nM or 10 nM rapamycin was added for the duration of cell cultures. For in vivo treatment experiments, rapamycin (2 mg/kg dissolved in DMSO, diluted in 150 μL PBS) or PBS (equal volume DMSO in 150 μL PBS) was administered to mice by intraperitoneal injection once every 2 days for 4 weeks. After 4 weeks of treatment, mice were euthanized and spleen cells were analyzed by flow cytometry, and sera was collected to measure autoantibodies by ELISA. In some experiments, mice were treated with rapamycin every day for 1 week. Kidneys were collected to analyze T cell infiltration by flow cytometry. Spleen cells were cultured with anti-CD3 (2 μg/mL) and anti-CD28 (2 μg/mL) for 24 hours and IL-17A was measured in supernatants by ELISA (Biolegend). Statistics. Student’s 2-tailed t test, Mann-Whitney U test, and 1-way ANOVA were used to calculate statistical significance among groups. A P value of less than 0.05 was considered significant. In all graphs, data represent mean ± SEM. Study approval. For human studies, written informed consent was obtained from all participants and all studies were approved by the institutional review board (Committee on Clinical Investigations) at BIDMC. All animal studies were approved by the Institutional Animal Care and Use Committee at BIDMC. Author contributions VRM conceptualized the study. TK, HL, DC, and VRM designed and performed the experiments, and analyzed and interpreted data. TK, HL, GCT, and VRM prepared the manuscript. Supplemental material View Supplemental data Acknowledgments We thank Andrew Gillooly, Michael Mosho, and Melissa Carr-Reynolds for excellent technical assistance; Suzanne Krishfield for recruiting patients with SLE and healthy individuals; Donna Farber and Martin Flajnik for critical reading of the manuscript; and Amir Sharabi and Abel Suarez-Fueyo for helpful discussions. This work was funded by NIH grants K01AR060781 and R01AR068974 to VRM, R01AI42269 to GCT, and an SICPA Foundation grant to DC. Footnotes Conflict of interest: The authors have declared that no conflict of interest exists. Copyright: © 2019, American Society for Clinical Investigation. Reference information: J Clin Invest. https://doi.org/10.1172/JCI127949. References Tsokos GC. Systemic lupus erythematosus. N Engl J Med. 2011;365(22):2110–2121. View this article via: PubMed CrossRef Google Scholar Yen EY, Singh RR. Brief report: lupus-an unrecognized leading cause of death in young females: a population-based study using nationwide death certificates, 2000-2015. Arthritis Rheumatol. 2018;70(8):1251–1255. View this article via: PubMed CrossRef Google Scholar Malkiel S, Barlev AN, Atisha-Fregoso Y, Suurmond J, Diamond B. Plasma cell differentiation pathways in systemic lupus erythematosus. Front Immunol. 2018;9:427. View this article via: PubMed Google Scholar Banchereau J, Pascual V. Type I interferon in systemic lupus erythematosus and other autoimmune diseases. Immunity. 2006;25(3):383–392. View this article via: PubMed CrossRef Google Scholar Crow MK, Olferiev M, Kirou KA. Targeting of type I interferon in systemic autoimmune diseases. Transl Res. 2015;165(2):296–305. View this article via: PubMed CrossRef Google Scholar Lo MS, Tsokos GC. Recent developments in systemic lupus erythematosus pathogenesis and applications for therapy. Curr Opin Rheumatol. 2018;30(2):222–228. View this article via: PubMed CrossRef Google Scholar Caielli S, et al. A CD4+ T cell population expanded in lupus blood provides B cell help through interleukin-10 and succinate. Nat Med. 2019;25(1):75–81. View this article via: PubMed CrossRef Google Scholar Hsu HC, et al. Interleukin 17-producing T helper cells and interleukin 17 orchestrate autoreactive germinal center development in autoimmune BXD2 mice. Nat Immunol. 2008;9(2):166–175. View this article via: PubMed CrossRef Google Scholar Yi W, et al. The mTORC1-4E-BP-eIF4E axis controls de novo Bcl6 protein synthesis in T cells and systemic autoimmunity. Nat Commun. 2017;8(1):254. View this article via: PubMed CrossRef Google Scholar Amarilyo G, Lourenço EV, Shi FD, La Cava A. IL-17 promotes murine lupus. J Immunol. 2014;193(2):540–543. View this article via: PubMed CrossRef Google Scholar Koga T, Ichinose K, Tsokos GC. T cells and IL-17 in lupus nephritis. Clin Immunol. 2017;185:95–99. View this article via: PubMed CrossRef Google Scholar Choi SC, Morel L. B cell contribution of the CD4+ T cell inflammatory phenotypes in systemic lupus erythematosus. Autoimmunity. 2017;50(1):37–41. View this article via: PubMed CrossRef Google Scholar Katsuyama T, Tsokos GC, Moulton VR. Aberrant T cell signaling and subsets in systemic lupus erythematosus. Front Immunol. 2018;9:1088. View this article via: PubMed Google Scholar Moulton VR, Suarez-Fueyo A, Meidan E, Li H, Mizui M, Tsokos GC. Pathogenesis of human systemic lupus erythematosus: a cellular perspective. Trends Mol Med. 2017;23(7):615–635. View this article via: PubMed CrossRef Google Scholar Perl A. Activation of mTOR (mechanistic target of rapamycin) in rheumatic diseases. Nat Rev Rheumatol. 2016;12(3):169–182. View this article via: PubMed CrossRef Google Scholar Chapman NM, Chi H. mTOR links environmental signals to T cell fate decisions. Front Immunol. 2014;5:686. View this article via: PubMed Google Scholar Yang K, Neale G, Green DR, He W, Chi H. The tumor suppressor Tsc1 enforces quiescence of naive T cells to promote immune homeostasis and function. Nat Immunol. 2011;12(9):888–897. View this article via: PubMed CrossRef Google Scholar Perl A. mTOR activation is a biomarker and a central pathway to autoimmune disorders, cancer, obesity, and aging. Ann N Y Acad Sci. 2015;1346(1):33–44. View this article via: PubMed CrossRef Google Scholar Delgoffe GM, et al. The kinase mTOR regulates the differentiation of helper T cells through the selective activation of signaling by mTORC1 and mTORC2. Nat Immunol. 2011;12(4):295–303. View this article via: PubMed CrossRef Google Scholar Yang K, et al. T cell exit from quiescence and differentiation into Th2 cells depend on Raptor-mTORC1-mediated metabolic reprogramming. Immunity. 2013;39(6):1043–1056. View this article via: PubMed CrossRef Google Scholar Kato H, Perl A. Mechanistic target of rapamycin complex 1 expands Th17 and IL-4+ CD4-CD8- double-negative T cells and contracts regulatory T cells in systemic lupus erythematosus. J Immunol. 2014;192(9):4134–4144. View this article via: PubMed CrossRef Google Scholar Lai ZW, et al. Mechanistic target of rapamycin activation triggers IL-4 production and necrotic death of double-negative T cells in patients with systemic lupus erythematosus. J Immunol. 2013;191(5):2236–2246. View this article via: PubMed CrossRef Google Scholar et al. Negative regulation of PKB/Akt-dependent cell survival by the tumor suppressor PTEN. Cell. 1998;95(1):29–39. View this article via: PubMed CrossRef Google Scholar Chi H. Regulation and function of mTOR signalling in T cell fate decisions. Nat Rev Immunol. 2012;12(5):325–338. View this article via: PubMed CrossRef Google Scholar Buckler JL, Walsh PT, Porrett PM, Choi Y, Turka LA. Cutting edge: T cell requirement for CD28 costimulation is due to negative regulation of TCR signals by PTEN. J Immunol. 2006;177(7):4262–4266. View this article via: PubMed CrossRef Google Scholar Di Cristofano A, Kotsi P, Peng YF, Cordon-Cardo C, Elkon KB, Pandolfi PP. Impaired Fas response and autoimmunity in Pten+/- mice. Science. 1999;285(5436):2122–2125. View this article via: PubMed CrossRef Google Scholar Suzuki A, et al. T cell-specific loss of Pten leads to defects in central and peripheral tolerance. Immunity. 2001;14(5):523–534. View this article via: PubMed CrossRef Google Scholar Wu XN, et al. Defective PTEN regulation contributes to B cell hyperresponsiveness in systemic lupus erythematosus. Sci Transl Med. 2014;6(246):246ra99. View this article via: PubMed CrossRef Google Scholar Howard JM, Sanford JR. The RNAissance family: SR proteins as multifaceted regulators of gene expression. Wiley Interdiscip Rev RNA. 2015;6(1):93–110. View this article via: PubMed CrossRef Google Scholar Li X, Manley JL. New talents for an old acquaintance: the SR protein splicing factor ASF/SF2 functions in the maintenance of genome stability. Cell Cycle. 2005;4(12):1706–1708. View this article via: PubMed CrossRef Google Scholar Moulton VR, Tsokos GC. T cell signaling abnormalities contribute to aberrant immune cell function and autoimmunity. J Clin Invest. 2015;125(6):2220–2227. View this article via: JCI PubMed CrossRef Google Scholar Nambiar MP, et al. Reconstitution of deficient T cell receptor zeta chain restores T cell signaling and augments T cell receptor/CD3-induced interleukin-2 production in patients with systemic lupus erythematosus. Arthritis Rheum. 2003;48(7):1948–1955. View this article via: PubMed CrossRef Google Scholar Chowdhury B, et al. Stability and translation of TCR zeta mRNA are regulated by the adenosine-uridine-rich elements in splice-deleted 3’ untranslated region of zeta-chain. J Immunol. 2006;177(11):8248–8257. View this article via: PubMed CrossRef Google Scholar Moulton VR, Kyttaris VC, Juang YT, Chowdhury B, Tsokos GC. The RNA-stabilizing protein HuR regulates the expre
|
|
Scooped by
Gilbert C FAURE
October 1, 2019 1:29 PM
|
Systemic lupus erythematosus (SLE) is an autoimmune disease featuring enhanced expression of type I interferon (IFN) and autoantibody production triggering inflammation of, and damage to, multiple organs.
|
|
Scooped by
Gilbert C FAURE
August 9, 2019 1:26 PM
|
PubMed comprises more than 29 million citations for biomedical literature from MEDLINE, life science journals, and online books. Citations may include links to full-text content from PubMed Central and publisher web sites.
|
|
Scooped by
Gilbert C FAURE
August 5, 2019 2:53 AM
|
PubMed comprises more than 29 million citations for biomedical literature from MEDLINE, life science journals, and online books. Citations may include links to full-text content from PubMed Central and publisher web sites.
|
|
Scooped by
Gilbert C FAURE
August 2, 2019 1:05 PM
|
PDF Review Autoantibody testing in idiopathic inflammatory myopathies Anke Rietveld1, Johan Lim2, Marianne de Visser2, Baziel van Engelen1, Ger Pruijn3, Olivier Benveniste4, Anneke van der Kooi2, Christiaan Saris1 Department of Neurology, Center for Neuroscience Donders Institute for Brain, Cognition and Behaviour, Radboud University Medical Center, Nijmegen, The Netherlands Department of Neurology, Amsterdam UMC, University of Amsterdam, Amsterdam Neuroscience, Amsterdam, The Netherlands Department of Biomolecular Chemistry, Radboud Institute for Molecular Life Sciences and Institute for Molecules and Materials, Nijmegen, The Netherlands Médecine Interne et Immunologie Clinique, Centre de Référence Maladies Neuro-Musculaires, Sorbonne Université, AP-HP, GH Pitié-Salpêtrière, UMR974, Paris, France Correspondence to Dr Anke Rietveld, Department of Neurology, Center for Neuroscience Donders Institute for Brain, Cognition and Behaviour, Radboud University Medical Center, Nijmegen 6500 HB, The Netherlands; Anke.Rietveld{at}radboudumc.nl Abstract The diagnosis and classification of idiopathic inflammatory myopathies are based mainly on clinical and histological features. The discovery of myositis-specific and myositis-associated antibodies has simplified the (sub)classification of inflammatory myopathies. Patients suspected of having an idiopathic inflammatory myopathy should undergo routine antibody testing to gain more insight into distinct phenotypes, comorbidities, treatment response and prognosis. Furthermore, autoantibody testing can help in patients with atypical patterns of weakness or with an unresolved limb-girdle myopathic phenotype, or interstitial lung disease. However, some important technical and methodological issues can hamper the interpretation of antibody testing; for example, some antibodies are not included in the widely available line blots. We aim to provide a practical review of the use of autoantibody testing in idiopathic inflammatory myopathies in clinical practice. View Full Text Statistics from Altmetric.com View Full Text Footnotes Contributors AR and JL wrote the initial version of the manuscript, which was reviewed and partially rewritten by MdV, AvdK, BvE, OB, GP and CS. Funding The authors have not declared a specific grant for this research from any funding agency in the public, commercial or not-for-profit sectors. Competing interests GP and BvE are inventors of a patent (EP20120740236) licensed to Euroimmun AG, and GP received financial support from Euroimmun for his research programme. BvE reports a grant from Prinses Beatrix Spierfonds and personal fees and non-financial support from Fulcrum, personal fees from Facio, and grants from European Union’s Horizon 2020 research and innovation programme (Murab), Netherlands Organisation for Scientific Research (NWO), The Netherlands Organisation for Health Research and Development (ZonMw), Global FSH, Stichting Spieren voor Spieren, Dutch FSHD Foundation, and Association Française contre les Myopathies, outside the submitted work. JL and AvdK report grants from CSL Behring for an interventional study, outside the scope of this review. MdV serves as a consultant for Bristol-Myers Squibb. OB serves as a consultant for Novartis, Neovacs and CSL Behring. Patient consent for publication Obtained. Provenance and peer review Commissioned; externally peer reviewed by Jon Walters, Swansea, UK. Request Permissions If you wish to reuse any or all of this article please use the link below which will take you to the Copyright Clearance Center’s RightsLink service. You will be able to get a quick price and instant permission to reuse the content in many different ways. Copyright information: © Author(s) (or their employer(s)) 2019. No commercial re-use. See rights and permissions. Published by BMJ. Linked Articles Editors’ commentary Phil E M Smith Geraint N Fuller Practical Neurology 2019; 19 277-277 Published Online First: 11 Jul 2019. doi: 10.1136/practneurol-2019-002364 Read the full text or download the PDF: Subscribe Log in

|
Suggested by
Société Francaise d'Immunologie
July 25, 2019 2:25 AM
|
Significance B cells have important antibody-independent functions and are now recognized as key players in autoimmune diseases traditionally thought to be T cell-mediated. The role of B cells as antigen-presenting cells, however, is not well understood. By studying the autoantibody response against the enzyme transglutaminase 2 in celiac disease, we have shown that B cells targeting particular epitopes are selectively activated and that this epitope bias reflects efficient presentation of gluten antigen to T cells. Production of antibodies against the preferred epitope coincided with clinical onset of disease, suggesting that B cells with this specificity can be main antigen-presenting cells for pathogenic gluten-specific T cells. Our study thus provides insight into the mechanisms controlling initiation of a T cell-mediated autoimmune condition. Abstract B cells play important roles in autoimmune diseases through autoantibody production, cytokine secretion, or antigen presentation to T cells. In most cases, the contribution of B cells as antigen-presenting cells is not well understood. We have studied the autoantibody response against the enzyme transglutaminase 2 (TG2) in celiac disease patients by generating recombinant antibodies from single gut plasma cells reactive with discrete antigen domains and by undertaking proteomic analysis of anti-TG2 serum antibodies. The majority of the cells recognized epitopes in the N-terminal domain of TG2. Antibodies recognizing C-terminal epitopes interfered with TG2 cross-linking activity, and B cells specific for C-terminal epitopes were inefficient at taking up TG2-gluten complexes for presentation to gluten-specific T cells. The bias toward N-terminal epitopes hence reflects efficient T-B collaboration. Production of antibodies against N-terminal epitopes coincided with clinical onset of disease, suggesting that TG2-reactive B cells with certain epitope specificities could be the main antigen-presenting cells for pathogenic, gluten-specific T cells. The link between B cell epitopes, antigen presentation, and disease onset provides insight into the pathogenic mechanisms of a T cell-mediated autoimmune condition. Footnotes ↵1To whom correspondence may be addressed. Email: rasmus.iversen{at}medisin.uio.no or l.m.sollid{at}medisin.uio.no. ↵2Present address: Symbiosis School of Biological Sciences, Symbiosis International (Deemed University), Lavale, Mulshi, 412115 Pune, India. Author contributions: R.I., B.R., and L.M.S. designed research; R.I., B.R., J.S., L.S.H., and K.H. performed research; I.R.K.-S. and K.E.A.L. contributed new reagents/analytic tools; R.I., B.R., J.S., L.S.H., K.H., and R.S.N. analyzed data; and R.I. and L.M.S. wrote the paper. The authors declare no conflict of interest. This article is a PNAS Direct Submission. Data deposition: Sequence data have been deposited at the European Genome-phenome Archive, https://www.ebi.ac.uk/ega/home (accession no. EGAS00001003658). Proteomics data have been deposited to the ProteomeXchange Consortium, http://www.proteomexchange.org/ (data set identifier PXD013777). This article contains supporting information online at www.pnas.org/lookup/suppl/doi:10.1073/pnas.1901561116/-/DCSupplemental. Published under the PNAS license. References ↵ O. Chan, M. J. Shlomchik, A new role for B cells in systemic autoimmunity: B cells promote spontaneous T cell activation in MRL-lpr/lpr mice. J. Immunol. 160, 51–59 (1998). ↵ N. Molnarfi et al., MHC class II-dependent B cell APC function is required for induction of CNS autoimmunity independent of myelin-specific antibodies. J. Exp. Med. 210, 2921–2937 (2013). ↵ I. Jelcic et al., Memory B cells activate brain-homing, autoreactive CD4+ T cells in multiple sclerosis. Cell 175, 85–100.e23 (2018).OpenUrlCrossRef ↵ S. Hong et al., B cells are the dominant antigen-presenting cells that activate naive CD4+ T cells upon immunization with a virus-derived nanoparticle antigen. Immunity 49, 695–708.e4 (2018).OpenUrl ↵ L. S. Hoydahl et al., Plasma cells are the most abundant gluten peptide MHC-expressing cells in inflamed intestinal tissues from patients with celiac disease. Gastroenterology 156, 1428–1439.e10 (2019).OpenUrl ↵ W. Dieterich et al., Identification of tissue transglutaminase as the autoantigen of celiac disease. Nat. Med. 3, 797–801 (1997).OpenUrlCrossRefPubMed ↵ L. M. Sollid, O. Molberg, S. McAdam, K. E. Lundin, Autoantibodies in coeliac disease: Tissue transglutaminase: Guilt by association? Gut 41, 851–852 (1997).OpenUrlFREE Full Text ↵ L. W. Vader et al., Specificity of tissue transglutaminase explains cereal toxicity in celiac disease. J. Exp. Med. 195, 643–649 (2002). ↵ B. Fleckenstein et al., Gliadin T cell epitope selection by tissue transglutaminase in celiac disease. Role of enzyme specificity and pH influence on the transamidation versus deamidation process. J. Biol. Chem. 277, 34109–34116 (2002). ↵ O. Molberg et al., Tissue transglutaminase selectively modifies gliadin peptides that are recognized by gut-derived T cells in celiac disease. Nat. Med. 4, 713–717 (1998).OpenUrlCrossRefPubMed ↵ Y. van de Wal et al., Selective deamidation by tissue transglutaminase strongly enhances gliadin-specific T cell reactivity. J. Immunol. 161, 1585–1588 (1998). ↵ L. M. Sollid, S. W. Qiao, R. P. Anderson, C. Gianfrani, F. Koning, Nomenclature and listing of celiac disease relevant gluten T-cell epitopes restricted by HLA-DQ molecules. Immunogenetics 64, 455–460 (2012).OpenUrlCrossRefPubMed ↵ D. M. Pinkas, P. Strop, A. T. Brunger, C. Khosla, Transglutaminase 2 undergoes a large conformational change upon activation. PLoS Biol. 5, e327 (2007).OpenUrlCrossRefPubMed ↵ S. Liu, R. A. Cerione, J. Clardy, Structural basis for the guanine nucleotide-binding activity of tissue transglutaminase and its regulation of transamidation activity. Proc. Natl. Acad. Sci. U.S.A. 99, 2743–2747 (2002). ↵ R. Iversen et al., Transglutaminase 2-specific autoantibodies in celiac disease target clustered, N-terminal epitopes not displayed on the surface of cells. J. Immunol. 190, 5981–5991 (2013). ↵ R. Iversen et al., Strong clonal relatedness between serum and gut IgA despite different plasma cell origins. Cell Rep. 20, 2357–2367 (2017).OpenUrl ↵ R. Iversen, S. Mysling, K. Hnida, T. J. Jørgensen, L. M. Sollid, Activity-regulating structural changes and autoantibody epitopes in transglutaminase 2 assessed by hydrogen/deuterium exchange. Proc. Natl. Acad. Sci. U.S.A. 111, 17146–17151 (2014). ↵ R. Di Niro et al., High abundance of plasma cells secreting transglutaminase 2-specific IgA autoantibodies with limited somatic hypermutation in celiac disease intestinal lesions. Nat. Med. 18, 441–445 (2012).OpenUrlCrossRefPubMed ↵ J. Stamnaes, I. Cardoso, R. Iversen, L. M. Sollid, Transglutaminase 2 strongly binds to an extracellular matrix component other than fibronectin via its second C-terminal beta-barrel domain. FEBS J. 283, 3994–4010 (2016).OpenUrlCrossRef ↵ J. Stamnaes, R. Iversen, M. F. du Pré, X. Chen, L. M. Sollid, Enhanced B-cell receptor recognition of the autoantigen transglutaminase 2 by efficient catalytic self-multimerization. PLoS One 10, e0134922 (2015).OpenUrlCrossRefPubMed ↵ K. Hnida et al., Epitope-dependent functional effects of celiac disease autoantibodies on transglutaminase 2. J. Biol. Chem. 291, 25542–25552 (2016). ↵ M. R. Arbuckle et al., Development of autoantibodies before the clinical onset of systemic lupus erythematosus. N. Engl. J. Med. 349, 1526–1533 (2003).OpenUrlCrossRefPubMed ↵ S. Rantapää-Dahlqvist et al., Antibodies against cyclic citrullinated peptide and IgA rheumatoid factor predict the development of rheumatoid arthritis. Arthritis Rheum. 48, 2741–2749 (2003).OpenUrlCrossRefPubMed ↵ T. T. Salmi et al., Immunoglobulin A autoantibodies against transglutaminase 2 in the small intestinal mucosa predict forthcoming coeliac disease. Aliment. Pharmacol. Ther. 24, 541–552 (2006).OpenUrlCrossRefPubMed ↵ G. Oberhuber, G. Granditsch, H. Vogelsang, The histopathology of coeliac disease: Time for a standardized report scheme for pathologists. Eur. J. Gastroenterol. Hepatol. 11, 1185–1194 (1999).OpenUrlPubMed ↵ O. Snir et al., Analysis of celiac disease autoreactive gut plasma cells and their corresponding memory compartment in peripheral blood using high-throughput sequencing. J. Immunol. 194, 5703–5712 (2015). ↵ R. Li, K. R. Patterson, A. Bar-Or, Reassessing B cell contributions in multiple sclerosis. Nat. Immunol. 19, 696–707 (2018).OpenUrl ↵ J. R. Giles, M. Kashgarian, P. A. Koni, M. J. Shlomchik, B cell-specific MHC class II deletion reveals multiple nonredundant roles for B cell antigen presentation in murine lupus. J. Immunol. 195, 2571–2579 (2015). ↵ J. William, C. Euler, S. Christensen, M. J. Shlomchik, Evolution of autoantibody responses via somatic hypermutation outside of germinal centers. Science 297, 2066–2070 (2002). ↵ M. J. Shlomchik, F. Weisel, Germinal center selection and the development of memory B and plasma cells. Immunol. Rev. 247, 52–63 (2012).OpenUrlCrossRefPubMed ↵ S. Sulkanen et al., Tissue transglutaminase autoantibody enzyme-linked immunosorbent assay in detecting celiac disease. Gastroenterology 115, 1322–1328 (1998).OpenUrlCrossRefPubMed ↵ B. Roy et al., High-throughput single-cell analysis of B cell receptor usage among autoantigen-specific plasma cells in celiac disease. J. Immunol. 199, 782–791 (2017). ↵ D. A. Leffler, D. Schuppan, Update on serologic testing in celiac disease. Am. J. Gastroenterol. 105, 2520–2524 (2010).OpenUrlCrossRefPubMed ↵ K. Lindfors, M. Mäki, K. Kaukinen, Transglutaminase 2-targeted autoantibodies in celiac disease: Pathogenetic players in addition to diagnostic tools? Autoimmun. Rev. 9, 744–749 (2010).OpenUrlCrossRefPubMed ↵ B. Jabri, L. M. Sollid, T cells in celiac disease. J. Immunol. 198, 3005–3014 (2017). ↵BSG Coeliac Disease Guidelines Development Group; British Society of Gastroenterology J. F. Ludvigsson et al.; BSG Coeliac Disease Guidelines Development Group; British Society of Gastroenterology, Diagnosis and management of adult coeliac disease: Guidelines from the British Society of Gastroenterology. Gut 63, 1210–1228 (2014). ↵ M. P. Lefranc et al., IMGT, the international ImMunoGeneTics database. Nucleic Acids Res. 27, 209–212 (1999).OpenUrlCrossRefPubMed ↵ J. Cox, M. Mann, MaxQuant enables high peptide identification rates, individualized p.p.b.-range mass accuracies and proteome-wide protein quantification. Nat. Biotechnol. 26, 1367–1372 (2008).OpenUrlCrossRefPubMed ↵ Y. Perez-Riverol et al., The PRIDE database and related tools and resources in 2019: Improving support for quantification data. Nucleic Acids Res. 47, D442–D450 (2019).OpenUrlCrossRefPubMed
Abstract Type 1 diabetes (T1D) results from the progressive destruction of pancreatic β-cells in a process mediated primarily by T lymphocytes. The T1D research community has made dramatic progress in understanding the genetic basis of the disease as well as in the development of standardized autoantibody assays that inform both disease risk and progression. Despite these advances, there remains a paucity of robust and accepted biomarkers that can effectively inform on the activity of T cells during the natural history of the disease or in response to treatment. In this article, we discuss biomarker development and validation efforts for evaluation of T-cell responses in patients with and at risk for T1D as well as emerging technologies. It is expected that with systematic planning and execution of a well-conceived biomarker development pipeline, T-cell–related biomarkers would rapidly accelerate disease progression monitoring efforts and the evaluation of intervention therapies in T1D. Footnotes This article contains Supplementary Data online at http://diabetes.diabetesjournals.org/lookup/suppl/doi:10.2337/db19-0119/-/DC1. Received February 2, 2019. Accepted April 20, 2019. © 2019 by the American Diabetes Association. http://www.diabetesjournals.org/content/license Readers may use this article as long as the work is properly cited, the use is educational and not for profit, and the work is not altered. More information is available at http://www.diabetesjournals.org/content/license.
Via Krishan Maggon
|