Into the Driver's Seat
453.6K views | +11 today
Follow
Into the Driver's Seat
Building learners' independence through thoughtful technology use
Curated by Jim Lerman
Your new post is loading...
Scooped by Jim Lerman
Scoop.it!

CIA's Cartography Division Shares Declassified Maps

CIA's Cartography Division Shares Declassified Maps | Into the Driver's Seat | Scoop.it

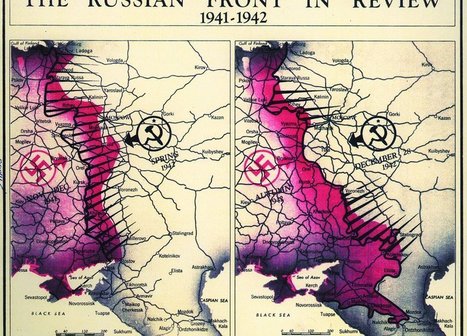
"As much as James Bond is defined by his outlandish gadgets, one of the most important tools for real-life spies is actually much less flashy: maps. Whether used to gather information or plan an attack, good maps are an integral part of the tradecraft of espionage. Now, to celebrate 75 years of serious cartography, the Central Intelligence Agency has declassified and put decades of once-secret maps online.  These days, the C.I.A. and other intelligence agencies rely more on digital mapping technologies and satellite images to make its maps, but for decades it relied on geographers and cartographers for planning and executing operations around the world. Because these maps could literally mean the difference between life and death for spies and soldiers alike, making them as accurate as possible was paramount, Greg Miller reports for National Geographic."


Tags: mapping, geopolitics, maphistorical, map archives

No comment yet.
Scooped by Jim Lerman
Scoop.it!

Old Mexico lives on

Old Mexico lives on | Into the Driver's Seat | Scoop.it
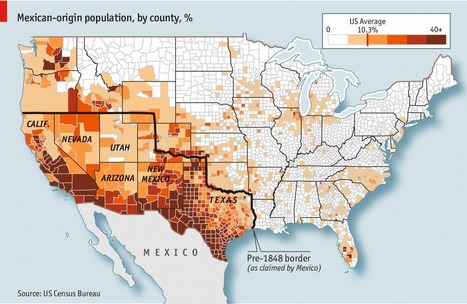
On February 2nd 1848, following a short and one-sided war, Mexico agreed to cede more than half its territory to the United States. An area covering most of present-day Arizona, California, Nevada, New Mexico and Utah, plus parts of several other states, was handed over to gringolandia. The rebellious state of Tejas, which had declared its independence from Mexico in 1836, was recognised as American soil too. But a century and a half later, communities have proved more durable than borders. The counties with the highest concentration of Mexicans (as defined by ethnicity, rather than citizenship) overlap closely with the area that belonged to Mexico before the great gringo land-grab of 1848. Some are recent arrivals; others trace their roots to long before the map was redrawn. They didn’t jump the border—it jumped them.


Tags: culture, demographics, North Americahistorical, colonialism, borders, political.

Alex Smiga's curator insight, August 10, 2017 6:51 AM
I say it all the time, culture does not respect boarders. 
Nicole Canova's curator insight, February 9, 2018 8:15 PM
Up until 170 years ago, a large portion of what is now the United States was actually controlled by Mexico.  Remarkably, this is still reflected in the ethnic makeup of the population of that area, which covers all or part of 8 states (all of California, Nevada, Utah, Arizona, New Mexico, and Texas, and part of Colorado and Wyoming).  Political borders may determine citizenship, but they are by no means a hard division of ethnicity or culture.
Scooped by Jim Lerman
Scoop.it!

Cartograms of the Olympic Games

Cartograms of the Olympic Games | Into the Driver's Seat | Scoop.it
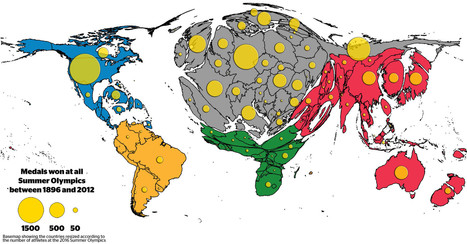
The distribution of medals shows the existing Olympic inequalities: The overall patterns are a reflection of wealth distribution in the world, raising the question whether money can buy sporting success. Besides investment in sports by those countries who can afford it, the medal tables also reflect a battle for global supremacy in political terms.


Tags: sport, popular culture, mapping, historical, cartography.

PIRatE Lab's curator insight, August 15, 2016 8:32 PM
Another very interesting way to present geographic data.
Scooped by Jim Lerman
Scoop.it!

40 Maps That Explain The Middle East

40 Maps That Explain The Middle East | Into the Driver's Seat | Scoop.it
These maps are crucial for understanding the region's history, its present, and some of the most important stories there today.
Alex Vielman's curator insight, November 23, 2015 3:17 PM

Maps like the ones posted in this article, really helps people to understand and break down deeply of understanding the entire region as a whole. Visualization is very important in geography when trying to understand the region people are talking about. this region as goes down to the Mesopotamia Era. It is important to know, how the culture was in this area to how it differentiated during the Ottoman Empire. During the first couple of maps, we can begin to see the division of the entire region. As you go on, we begin to notice the divisions between people, religion, language between states and in-states. There is so much information to know about the Middle East region and it may be even harder to understand due to the tons of changes and separations, but it is important to understand these divisions like the Sunni's and the Shi'ites in order to fully explain the development and the current situations that are occurring in this region as we speak. 

Matt Ramsdell's curator insight, December 7, 2015 5:18 PM

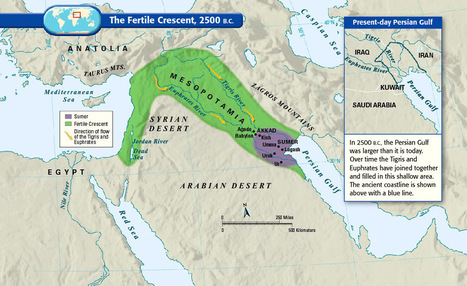
These 40 maps are a very interesting way of showing how people have traveled around and moved about the Earth from the time of the fertile crescent era to the people of today. It shows us the paths that people have taken to move to a new location. How they used the Meditteranean Sea to move from one side to the other. It also shows how the Tigris and Euphrates came together to form a smaller area of the Persian gulf. This led to smalled economic growth because now there is less land for imports and exports.

Kelvis Hernandez's curator insight, December 12, 2018 10:49 PM
Being able to explain any region in just 40 maps is a very bold claim. While no one would be able to do this Vox was able to make a very interesting set of historically, culturally, and politically themed visualizations of this continuously changing part of the world. Some maps show the borders of an empire past, others discuss the many ethnic groups that call the region their home, and yet another discusses the importance of oil and who has it.