Get Started for FREE
Sign up with Facebook Sign up with X
I don't have a Facebook or a X account
 Your new post is loading... Your new post is loading...
 Your new post is loading... Your new post is loading...

Deanna Wiist's curator insight,
September 12, 2017 9:00 PM
Questions to Ponder: What geographic and socioeconomic factors shape mortality rates? What is better about society today then before? Has anything worsened? How come?
Tags: mortality, medical, development, regions, USA, population, statistics.

GTANSW & ACT's curator insight,
December 30, 2016 8:29 PM
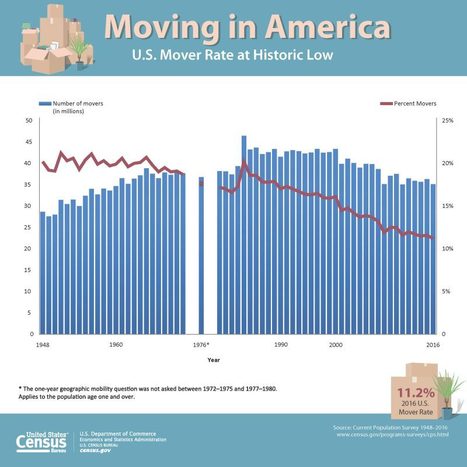
Internal migration in USA can make an interesting comparison with Australia
Syllabus Students investigate reasons for and effects of internal migration in Australia and another country, for example:
Geoworld 9 NSW Chapter 7: Urban settlement patterns Australia and USA
Chapter 8: Migration changes Australia and USA 8.8 Australians are mobile people 8.9 Mobile indigenous populations 8.10 Lifestyle migration 8.11 The power of resources 8.12 Migration changes the USA
|
Isabella Thoulouis's curator insight,
October 6, 2019 1:29 AM
This article is about how Japan's decline in population could be a warning sign to the US. In this article it talks about the different effects of why a population decreases in different regions. It also talks about steps that could be taken to prevent a large negative drop in population, which is what Japan is doing.

Loreto Vargas's curator insight,
February 24, 2017 12:45 PM
It’s a complicated phenomenon but El Niño is not the same as La Niña... Read the article.
|


Prizes are available in US only
https://ammoways.com/product/glock-19-gen-4-slide/
https://ammoways.com/product/hornady-handgun-hunter-9mm/
https://ammoways.com/product/sellier-and-bellot-9mm-124gr/
https://ammoways.com/product/pf940c-frame/
https://ammoways.com/product/federal-hydra-shok-9mm-135-gr-jhp-20rds/
https://ammoways.com/product/winchester-nato-9mm-luger-124-grain-fmj-1000-rounds-ammo-can/
https://ammoways.com/product/9mm-124gr-elite-v-crown-jhp/
https://ammoways.com/product/buy-cci-ammunition-blazer-brass-full-metal-jacket-round-nose-124grain/
https://ammoways.com/product/ppu-mil-spec-brass/
https://ammoways.com/product/winchester-silvertip-9mm-luger-147-grain-ammunition-20-rounds/
https://ammoways.com/product/remington-range-brass-9mm-115-grain-500-rounds-fmj/
https://ammoways.com/product/blazer-brass-9mm-500-rounds-blazer-9mm-500/
https://ammoways.com/product/glock-19-gen-5/
https://ammoways.com/product/glock-19-x-19x-glock/
https://ammoways.com/product/glock-43x-43x/