Your new post is loading...

|
Scooped by
ETF Research & Solutions
May 28, 2016 6:05 PM
|
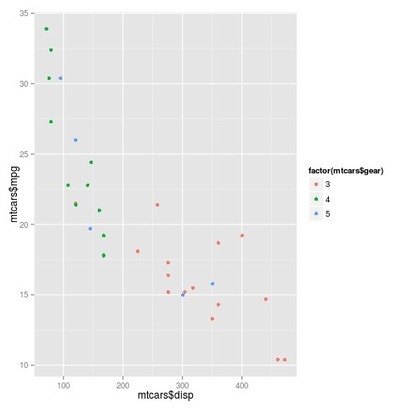
In this new demonstration, you will learn how to use the googleVis package in R to create a some beautiful interactive charts. The charts created here are
|
|
Scooped by
ETF Research & Solutions
May 28, 2016 6:04 PM
|
Machine learning is hard. Some people spend weeks, months, even years trying to learn machine learning without any success. They play around with datasets, buy
|
|
Scooped by
ETF Research & Solutions
October 11, 2015 4:39 AM
|
(This article was first published on Exegetic Analytics » R, and kindly contributed to R-bloggers)
I read Data Mining with Rattle and R by Graham Williams over a year ago. It’s not a new book and I’ve just been tardy in writing up a review.
|
|
Scooped by
ETF Research & Solutions
August 30, 2014 4:09 PM
|
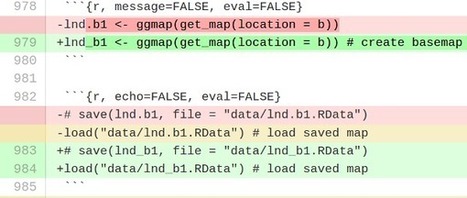
(This article was first published on mages' blog, and kindly contributed to R-bloggers)
In many cases Word is still the preferred file format for collaboration in the office.
|
|
Scooped by
ETF Research & Solutions
August 30, 2014 4:08 PM
|
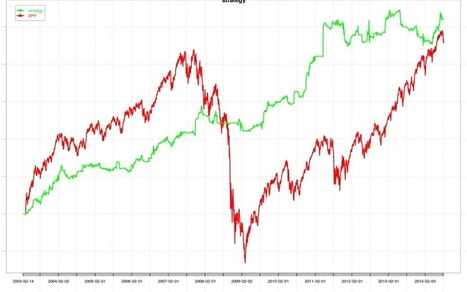
(This article was first published on QuantStrat TradeR » R, and kindly contributed to R-bloggers)
So several weeks ago, I decided to listen on a webinar (and myself will be giving one on using quantstrat on Sep.
|
|
Scooped by
ETF Research & Solutions
August 30, 2014 4:06 PM
|
(This article was first published on Eran Raviv » R, and kindly contributed to R-bloggers)
At least for me, R by faR. MATLAB has its own way of doing things, which to be honest can probably be defended from many angles.
|
|
Scooped by
ETF Research & Solutions
July 22, 2014 1:12 AM
|
(This article was first published on Bartomeus lab » Rstats, and kindly contributed to R-bloggers) I am trying to have better workflows to ensure data quality and two important things for me are first, scripting as much as posible the data...
|
|
Scooped by
ETF Research & Solutions
July 20, 2014 9:52 AM
|
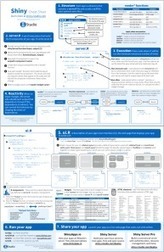
(This article was first published on RStudio Blog, and kindly contributed to R-bloggers)
Shiny v0.10 comes with a quick, handy guide. Use the Shiny cheat sheet as a quick reference for building Shiny apps.
|
|
Scooped by
ETF Research & Solutions
July 20, 2014 9:51 AM
|
(This article was first published on Robin Lovelace - R, and kindly contributed to R-bloggers)
Naming conventions in R are famously anarchic, with no clear winner and multiple conventions in use simultaneously in the same package.
|
|
Scooped by
ETF Research & Solutions
July 20, 2014 9:50 AM
|
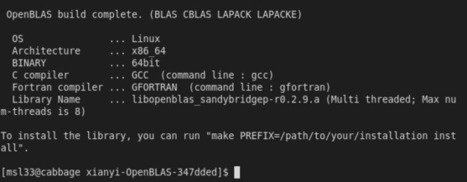
(This article was first published on Lindons Log » R, and kindly contributed to R-bloggers)
This guide is intended to aid any R and Linux user who desires a threaded version of BLAS.
|
|
Scooped by
ETF Research & Solutions
November 1, 2013 6:45 AM
|
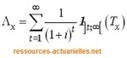
Les évolutions récentes du dispositif prudentiel européen conduisent à passer d'une logique dans laquelle l'exigence de marge est calculée de manière très forfaitaire, cette simplicité s'accompagnant d'un certain nombre de contraintes imposées par...
|
|
Scooped by
ETF Research & Solutions
October 31, 2013 6:48 AM
|
I create supporting pages for two projects I have collaborated with David Varadi in 2013: Proportional Minimum Variance Algorithm Adaptive Shrinkage Method Please check the links to get more info, including supporting blog posts, back-tests, R...
|
|
Scooped by
ETF Research & Solutions
October 31, 2013 6:47 AM
|
(This article was first published on Ecology in silico, and kindly contributed to R-bloggers)
Being in grad school, I do a lot of scholarly writing that requires associated or embedded R analyses, figures, and tables, plus bibliographies.
|
|
|
Scooped by
ETF Research & Solutions
May 28, 2016 6:04 PM
|
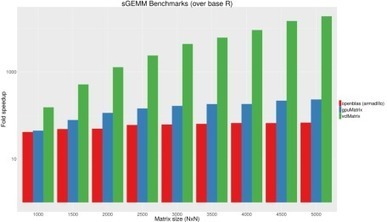
Introduction GPUs (Graphic Processing Units) have become much more popular in recent years for computationally intensive calculations. Despite these gains
|
|
Scooped by
ETF Research & Solutions
October 11, 2015 4:39 AM
|
(This article was first published on DataScience+, and kindly contributed to R-bloggers)
Missing data can be a not so trivial problem when analysing a dataset and accounting for it is usually not so straightforward either.
|
|
Scooped by
ETF Research & Solutions
August 30, 2014 4:09 PM
|
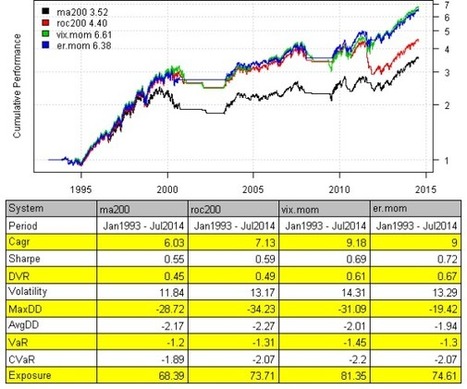
(This article was first published on Systematic Investor » R, and kindly contributed to R-bloggers) David Varadi has published two excellent posts / ideas about cooking with momentum: VIX-Adjusted Momentum Error-Adjusted Momentum I just...
|
|
Scooped by
ETF Research & Solutions
August 30, 2014 4:08 PM
|
(This article was first published on Revolutions, and kindly contributed to R-bloggers) The latest in a series by Daniel Hanson Introduction Correlations between holdings in a portfolio are of course a key component in financial risk...
|
|
Scooped by
ETF Research & Solutions
August 30, 2014 4:07 PM
|
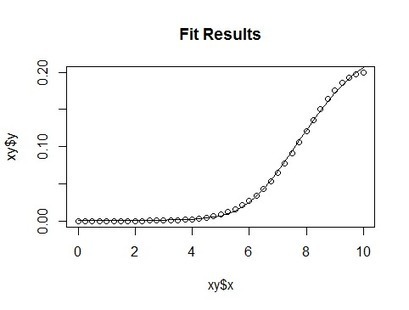
(This article was first published on Odd Hypothesis, and kindly contributed to R-bloggers) I recently discovered a powerful use for R expression()’s Say you are trying to fit some experimental data to the following nonlinear equation:...
|
|
Scooped by
ETF Research & Solutions
July 24, 2014 5:32 AM
|
(This article was first published on Revolutions, and kindly contributed to R-bloggers)
R is a functional language, which means that your code often contains a lot of ( parentheses ).
|
|
Scooped by
ETF Research & Solutions
July 20, 2014 9:53 AM
|
(This article was first published on Revolutions, and kindly contributed to R-bloggers)
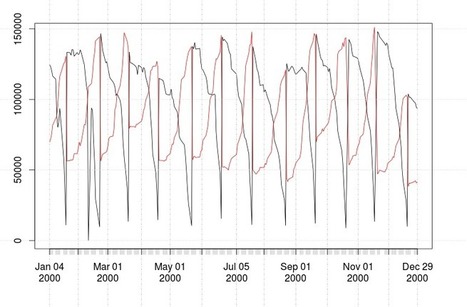
by Ilya Kipnis
In this post, I will demonstrate how to obtain, stitch together, and clean data for backtesting using futures data from Quandl.
|
|
Scooped by
ETF Research & Solutions
July 20, 2014 9:52 AM
|
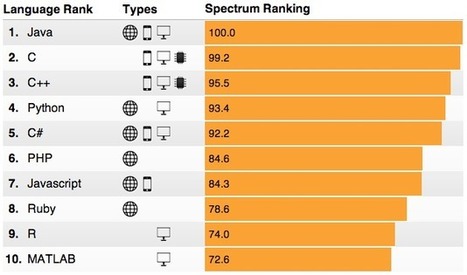
(This article was first published on Revolutions, and kindly contributed to R-bloggers) IEEE — the world's largest professional association for the language of technology — recently published its ranking of the popularity of programming...
|
|
Scooped by
ETF Research & Solutions
July 20, 2014 9:51 AM
|
(This article was first published on Thinking inside the box , and kindly contributed to R-bloggers) A common theme over the last few decades was that we could afford to simply sit back and let computer (hardware) engineers take care of...
|
|
Scooped by
ETF Research & Solutions
November 1, 2013 6:46 AM
|
(This article was first published on Flavio Barros » r-bloggers, and kindly contributed to R-bloggers)
The R language provides tools for modeling and visualization, but is still an excellent tool for handling/preparing data.
|
|
Scooped by
ETF Research & Solutions
October 31, 2013 6:48 AM
|
(This article was first published on Revolutions, and kindly contributed to R-bloggers) Forbes has published an article today on the integration between Alteryx and Revolution R Enterprise, which gives business analysts the ability to drag...
|
|
Scooped by
ETF Research & Solutions
October 31, 2013 6:47 AM
|
(This article was first published on mages' blog, and kindly contributed to R-bloggers)
For most purposes PDF or other vector graphic formats such as windows metafile and SVG work just fine.
|