Your new post is loading...

|
Scooped by
ETF Research & Solutions
October 14, 2013 1:22 PM
|
n this article I'm going to introduce you to some of the basic concepts which accompany an end-to-endquantitative trading system. This post will hopefully serve two audiences. The first will be individuals trying to obtain a job at a fund as a quantitative trader. The second will be individuals who wish to try and set up their own "retail" algorithmic trading business. Quantitative trading is an extremely sophisticated area of quant finance. It can take a significant amount of time to gain the necessary knowledge to pass an interview or construct your own trading strategies. Not only that but it requires extensive programming expertise, at the very least in a language such as MATLAB, R or Python. However as the trading frequency of the strategy increases, the technological aspects become much more relevant. Thus being familiar with C/C++ will be of paramount importance. A quantitative trading system consists of four major components: Strategy Identification - Finding a strategy, exploiting an edge and deciding on trading frequencyStrategy Backtesting - Obtaining data, analysing strategy performance and removing biasesExecution System - Linking to a brokerage, automating the trading and minimising transaction costsRisk Management - Optimal capital allocation, "bet size"/Kelly criterion and trading psychology We'll begin by taking a look at how to identify a trading strategy.
|
|
Scooped by
ETF Research & Solutions
October 10, 2013 11:28 AM
|
(This article was first published on Analytics , Education , Campus and beyond, and kindly contributed to R-bloggers)
This is mostly for my students and myself for future reference.
|
|
Scooped by
ETF Research & Solutions
October 9, 2013 4:32 AM
|
(This article was first published on Timely Portfolio, and kindly contributed to R-bloggers) The new micropolar library from Chris Viau, author of gives us reusable charts with polar coordinates for d3.js. In testament to rCharts design,...
|
|
Scooped by
ETF Research & Solutions
October 8, 2013 10:55 AM
|
(This article was first published on Lindons Log » R, and kindly contributed to R-bloggers)
My office computer recently got a really nice upgrade and now I have 8 cores on my desktop to play with.
|
|
Scooped by
ETF Research & Solutions
October 6, 2013 12:11 PM
|
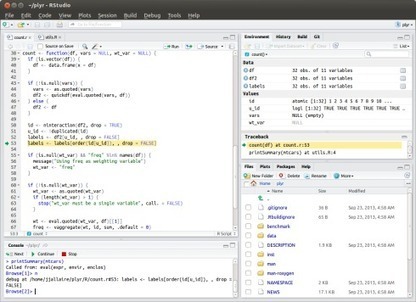
(This article was first published on RStudio Blog, and kindly contributed to R-bloggers)
We’re very pleased to announce that a preview release of RStudio IDE v0.98 is available for download now.
|
|
Scooped by
ETF Research & Solutions
October 6, 2013 12:11 PM
|
(This article was first published on Hyndsight » R, and kindly contributed to R-bloggers)
The following video has been produced to advertise my upcoming course on Forecasting with R, run in partnership with Revolution Analytics.
|
|
Scooped by
ETF Research & Solutions
September 17, 2013 9:57 AM
|
(This article was first published on Memo's Island, and kindly contributed to R-bloggers) Ensuring the quality and correctness of statistical or scientific software in general constitute as one fo the main responsibilities of scientific...
|
|
Scooped by
ETF Research & Solutions
September 4, 2013 11:02 AM
|
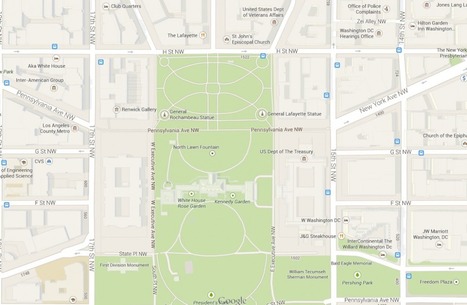
(This article was first published on Jose Gonzalez » R, and kindly contributed to R-bloggers)
This post shows how to use Google Maps‘ API with R.
|
|
Scooped by
ETF Research & Solutions
August 30, 2013 4:29 AM
|
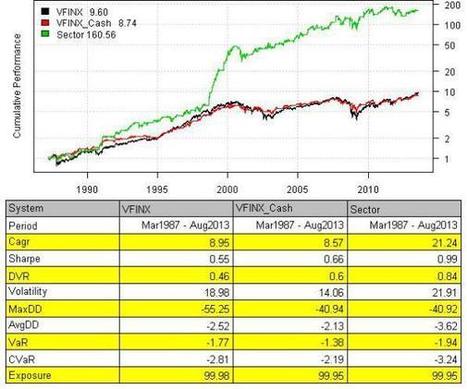
(This article was first published on Systematic Investor » R, and kindly contributed to R-bloggers) I recently came across the Kaeppel’s Sector Seasonality Strategy which is described in Kaeppel’s Corner: Sector Seasonality and updated in...
|
|
Scooped by
ETF Research & Solutions
August 30, 2013 4:28 AM
|
(This article was first published on Mollie's Research Blog, and kindly contributed to R-bloggers)
Importing DatesDates can be imported from character, numeric, POSIXlt, and POSIXct formats using the as.Date function from the base package.
|
|
Scooped by
ETF Research & Solutions
July 15, 2013 5:54 PM
|
(This article was first published on R-statistics blog » RR-statistics blog, and kindly contributed to R-bloggers) Guest post by Marek Hlavac Since its first introduction on this blog, stargazer, a package for turning R statistical output...
|
|
Scooped by
ETF Research & Solutions
June 30, 2013 12:29 PM
|
(This article was first published on Revolutions, and kindly contributed to R-bloggers)
by Joseph Rickert
Late last Saturday afternoon I was reading in my usual spot at the Dana Street Coffee House in Mt.
|
|
Scooped by
ETF Research & Solutions
June 25, 2013 4:30 AM
|
(This article was first published on NERD PROJECT » R project posts, and kindly contributed to R-bloggers) I have asked by a few people lately to help walk them through using twitter API in R, and I’ve always just directed them to the blog post I...
|
|
|
Scooped by
ETF Research & Solutions
October 11, 2013 1:32 AM
|
(This article was first published on Google Open Source Blog, and kindly contributed to R-bloggers) At Google, building, managing and safely securing some of the world’s largest storage systems requires complex analysis of filesystem...
|
|
Scooped by
ETF Research & Solutions
October 10, 2013 11:28 AM
|
(This article was first published on Revolutions, and kindly contributed to R-bloggers)
Tableau, the popular interactive data visualization tool, is coming out with a new 8.1 update, and it will include integration with the R language.
|
|
Scooped by
ETF Research & Solutions
October 8, 2013 10:56 AM
|
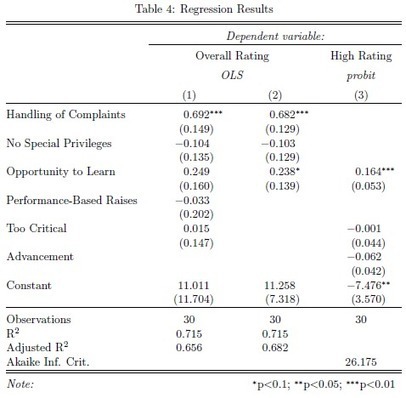
(This article was first published on R is my friend » R, and kindly contributed to R-bloggers) I’ve made quite a few blog posts about neural networks and some of the diagnostic tools that can be used to ‘demystify’ the information contained...
|
|
Scooped by
ETF Research & Solutions
October 7, 2013 11:07 AM
|
(This article was first published on The R Trader » R, and kindly contributed to R-bloggers)
This post lists the sources and types of financial data that is accessible directly from R. I included here free and non free ressources.
|
|
Scooped by
ETF Research & Solutions
October 6, 2013 12:11 PM
|
(This article was first published on Mollie's Research Blog, and kindly contributed to R-bloggers)
Sometimes you might have several data files and want to use R to perform the same function across all of them.
|
|
Scooped by
ETF Research & Solutions
September 19, 2013 11:53 AM
|
As mentioned in FOSS Trading post A New plot.xts yesterday “The Google Summer of Code (2012) project to extend xts has produced a very promising new plot.xts function. Michael Weylandt, the project's student, wrote R-SIG-Finance to request impressions, feedback, and bug reports. The function is housed in the xtsExtrapackage of the xts project on R-Forge.
Please try xtsExtra::plot.xts and let us know what you think. A sample of the eye-candy produced by the code in Michael's email is below. Granted, this isn't a one-liner, but it's certainly impressive! Great work Michael!” and as announced by author Michael Weylandt in https://stat.ethz.ch/pipermail/r-sig-finance/2012q3/010652.html “As the community which makes the most heavy use of xts, I would like to draw your attention to a new set of plotting functions for xts objects available as part of Google Summer of Code 2012. This work represents a major overhaul of previously existing plot.xts and should provide you with the most comprehensive and flexible time series plotting available in R. Features include: "automagic" layout construction and axis alignmentsmart argument recyclingpanel function abilitiesmore attractive candle and bar plots for OHLC objectsscatterplots to view the co-evolution of multiple seriesevent markersregime highlightingtime-oriented barplots via barplot.xts [based on code by Peter Carl]interoperability with all known R time series classes using the xts try/reclass paradigm
|
|
Scooped by
ETF Research & Solutions
September 13, 2013 3:45 AM
|
(This article was first published on Revolutions, and kindly contributed to R-bloggers) Last week, Revolution Analytics' US Chief Scientist Mario Inchiosa gave a presentation on high-performance predictive analytics in R and Hadoop, showing...
|
|
Scooped by
ETF Research & Solutions
August 30, 2013 4:41 AM
|
This tutorial was developped as part of a one-day workshop held within the Ecosystem Informatics PhD-programme at the Philipps University of Marburg. The contents of this tutorial are published under the creative commons license 'Attribution-ShareAlike CC BY-SA'. Further information about this PhD programme can be found here To see what we are usually up to I refer the interested reader to our homepage athttp://www.environmentalinformatics-marburg.de Another resource for creating visualisations using R, more focussed on climatological/atmospheric applications can be found at http://metvurst.wordpress.com I hope you find parts of this tutorial, if not all of it useful. Comments, feedback, suggestions and bug reports should be directed to tim.appelhans {at} staff.uni-marburg.de In this workshop we will learn a few things about handling and preparing our data for the creation of meaningful graphsquickly introduce the two main ways of plot creation in R – base graphics and grid graphicsconcentrate on plot production using grid graphicsbecome familiar with the two main packages for highly flexible data visualisation in R – lattice & ggplot2 (biased towards lattice I have to admit)learn how to modify the default options of these packages in order to really get what we wantlearn even more flexibility using the grid package to create visualisations comprising multiple plots on one page and manipulate existing plots to suit our needssee how spatial data can be represented using the spatial packages available in Rlearn how to save our visualisations in different formats that comply with general publication standards of most academic journals TIP: if you study the code provided in this tutorial closely, you will likely find some additional programming gems here and there which are not specifically introduced in this workshop… (such as the first two lines of code ) In this workshop it is assumed that you already know how to get your data into R (read.table() etc)have a basic understanding how particular parts of your data can be assessed ($, [ - in case you do not know what these special characters mean in an R sense, you might want to start at a more basic level, e.g. here)are familiar the notion of object creation/assignment ( <- )
|
|
Scooped by
ETF Research & Solutions
August 30, 2013 4:28 AM
|
(This article was first published on Climate Change Ecology » R, and kindly contributed to R-bloggers)
I’m interested in Python a lot, mostly because it appears to be wickedly fast.
|
|
Scooped by
ETF Research & Solutions
August 30, 2013 4:27 AM
|
(This article was first published on Data Community DC » R, and kindly contributed to R-bloggers)
Dr.
|
|
Scooped by
ETF Research & Solutions
June 30, 2013 12:30 PM
|
(This article was first published on Adventures in Statistical Computing, and kindly contributed to R-bloggers) On analyticbridge, the question was posed about moving an inner join from Excel (which was taking many minutes via VLOOKUP()) to...
|
|
Scooped by
ETF Research & Solutions
June 30, 2013 12:25 PM
|
(This article was first published on Trestle Technology » R, and kindly contributed to R-bloggers) I’m sharing the slides from the talk I’ll be giving at the Dallas R Users Group on creating R packages (and other techniques for reproducing...
|