Journalisme graphique
142.4K views | +0 today
Follow
Journalisme graphique
La veille de Wedodata, studio de datavisualisations : wedodata.fr
Curated by Karen Bastien
Your new post is loading...
Scooped by Karen Bastien
February 25, 2016 3:24 AM
Scoop.it!

Fifa : quiz "Qui veut gagner des milliards ?"

Fifa : quiz "Qui veut gagner des milliards ?" | Journalisme graphique | Scoop.it
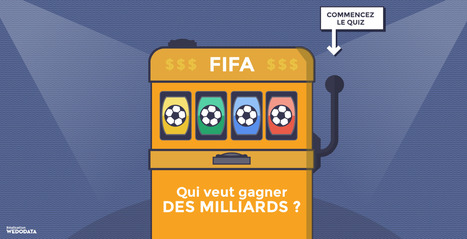
La Fifa est une organisation à but non lucratif... où l'argent coule à flots. Venez tester vos connaissances sur l'ampleur et l'origine de ses gains !
No comment yet.
Scooped by Karen Bastien
February 19, 2016 5:54 AM
Scoop.it!

How China's economic slowdown could weigh on the rest of the world

How China's economic slowdown could weigh on the rest of the world | Journalisme graphique | Scoop.it
China’s faltering economy is the destination for large proportions of many countries’ export sectors, in some cases for substantial proportions of GDP. See which countries stand to lose out if China’s import demand continues to weaken, and what happens if it slows further
No comment yet.
Scooped by Karen Bastien
February 11, 2016 5:57 AM
Scoop.it!

1 Jour en France/Allemagne | 24 heures de data

1 Jour en France/Allemagne | 24 heures de data | Journalisme graphique | Scoop.it
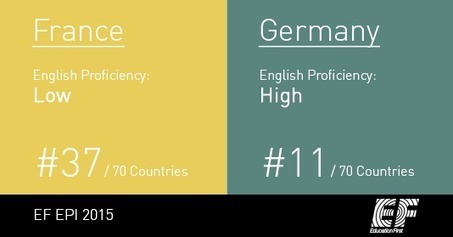
Agriculture, industrie, services, territoire, culture... Partez à la découverte de la France et de l'Allemagne comme vous ne les avez jamais vues !
Karen Bastien's insight:

Projet PixelHunt / WeDoData / Gotoandbuzz pour Arte et Point du jour

No comment yet.
Scooped by Karen Bastien
February 4, 2016 1:43 AM
Scoop.it!

Comment allons-nous mourir ?

Comment allons-nous mourir ? | Journalisme graphique | Scoop.it
FlowingData
No comment yet.
Scooped by Karen Bastien
February 1, 2016 7:53 AM
Scoop.it!

The Quartz Guide to Bad Data

The Quartz Guide to Bad Data | Journalisme graphique | Scoop.it
This guide was written to help Quartz staff identify problems with data they report on. After publishing it on GitHub, we heard from folks in many other industries who also found it helpful, so we’re republishing it here for the benefit of all Quartz readers. The most up-to-date version of this guide can always be […]
No comment yet.
Scooped by Karen Bastien
January 18, 2016 2:50 AM
Scoop.it!

How BuzzFeed News Used Betting Data To Investigate Match-Fixing In Tennis

How BuzzFeed News Used Betting Data To Investigate Match-Fixing In Tennis | Journalisme graphique | Scoop.it
With GIFs...
Vivalist's curator insight, January 18, 2016 3:28 AM

Well?.. he might have found at least one :)

"For one player, I identified 16 matches for which bookmakers revised his odds of winning downward by at least 10 percentage points.

He lost 15 of the 16 matches, including some in which he started as a heavy favorite."
Scooped by Karen Bastien
January 8, 2016 5:01 AM
Scoop.it!

De quoi meurt-on le plus aux Etats-Unis ?

De quoi meurt-on le plus aux Etats-Unis ? | Journalisme graphique | Scoop.it
FlowingData
No comment yet.
Scooped by Karen Bastien
December 28, 2015 10:15 AM
Scoop.it!

Most Common Use of Time, By Age and Sex

Most Common Use of Time, By Age and Sex | Journalisme graphique | Scoop.it
FlowingData
No comment yet.
Scooped by Karen Bastien
December 18, 2015 1:19 PM
Scoop.it!

A quoi ressemblerait une France 100% énergies renouvelables ?

A quoi ressemblerait une France 100% énergies renouvelables ? | Journalisme graphique | Scoop.it
How the world really could phase out fossil fuels and rely on wind, water, light
No comment yet.
Scooped by Karen Bastien
December 13, 2015 3:40 PM
Scoop.it!

Meta-Media : journaliste designer

No comment yet.
Scooped by Karen Bastien
December 5, 2015 4:34 AM
Scoop.it!

How well do you really know your country? Take our quiz

How well do you really know your country? Take our quiz | Journalisme graphique | Scoop.it
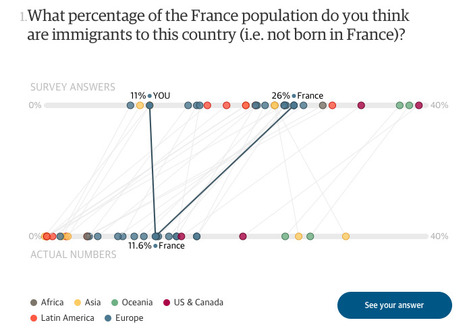
Most people around the world are pretty bad when it comes to knowing the stats behind the news. Ipsos surveyed people in 33 countries around the world on issues ranging from immigration to obesity - how does your knowledge compare to theirs?
No comment yet.
Scooped by Karen Bastien
November 25, 2015 1:14 PM
Scoop.it!

Red Meat Just Joined the 478 Other Things That Might Give You Cancer

Red Meat Just Joined the 478 Other Things That Might Give You Cancer | Journalisme graphique | Scoop.it
How the World Health Organization decides what's a carcinogen and what's not
No comment yet.
Scooped by Karen Bastien
November 20, 2015 2:07 PM
Scoop.it!

Indice de compétences en anglais

Indice de compétences en anglais | Journalisme graphique | Scoop.it
Compare countries and regions by their English skills.
No comment yet.
Scooped by Karen Bastien
February 22, 2016 3:26 AM
Scoop.it!

Ma ville numerique de demain

Ma ville numerique de demain | Journalisme graphique | Scoop.it
Notre dernière étude vient de paraître. "Ville & Numérique", ou comment les étudiants français voient leur vie dans la ville de demain. Sur le modèle des études "Mon bureau de demain" ou "Ma ville de demain"  réalisées par la chaire Immobilier et Développement durable de l'ESSEC, nous avons à nouveau souhaité donner la parole aux étudiants, ceux de la génération Y.…
Vincent Lahondère's curator insight, September 21, 2016 4:54 AM

Un sondage très original "la ville de demain vue par des étudiants

Scooped by Karen Bastien
February 12, 2016 8:20 AM
Scoop.it!

Who Marries CEOs, Doctors, Chefs and Janitors ?

Who Marries CEOs, Doctors, Chefs and Janitors ? | Journalisme graphique | Scoop.it
When it comes to falling in love, it’s not just fate that brings people together
No comment yet.
Scooped by Karen Bastien
February 4, 2016 6:06 AM
Scoop.it!

Criminal justice data

Criminal justice data | Journalisme graphique | Scoop.it

Dig through criminal justice data from across the U.S. with Hall of Justice from Sunlight Foundation.

No comment yet.
Scooped by Karen Bastien
February 2, 2016 11:23 AM
Scoop.it!

How five of the worst schools in Florida wound up in Pinellas County

How five of the worst schools in Florida wound up in Pinellas County | Journalisme graphique | Scoop.it
How this happened, in 24 charts.
No comment yet.
Scooped by Karen Bastien
January 18, 2016 10:38 AM
Scoop.it!

Observatoire des métropoles

Observatoire des métropoles | Journalisme graphique | Scoop.it
Observatoire des métropoles
Karen Bastien's insight:

Les données utilisées proviennent du produit FranceIRIS® développé par Esri France.

Annie Viel-puech's curator insight, January 22, 2016 8:22 AM

Organisation administrative - Métropole

Scooped by Karen Bastien
January 13, 2016 1:31 PM
Scoop.it!

DataBasic, a suite of easy-to-use web tools for beginners

DataBasic, a suite of easy-to-use web tools for beginners | Journalisme graphique | Scoop.it
No comment yet.
Scooped by Karen Bastien
December 29, 2015 4:39 AM
Scoop.it!

Visual Sedimentation

Visual Sedimentation | Journalisme graphique | Scoop.it
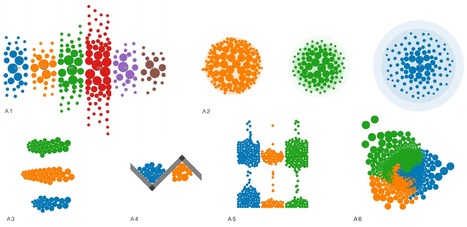
Visual sedimentation is a JavaScript library for visualizing streaming data, inspired by the process of physical sedimentation. Visual Sedimentation is built on
No comment yet.
Scooped by Karen Bastien
December 23, 2015 8:25 AM
Scoop.it!

World Population Data Sheet

World Population Data Sheet | Journalisme graphique | Scoop.it
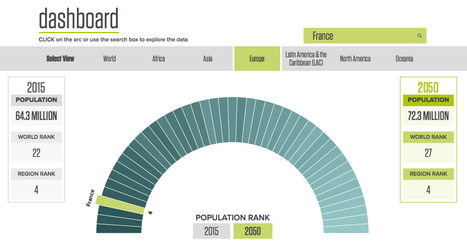
What does world population have to do with women’s empowerment? Share the knowledge with PRB’s latest #worldpopdata
Karen Bastien's insight:

PRB.org

No comment yet.
Scooped by Karen Bastien
December 17, 2015 3:10 AM
Scoop.it!

France Integrity Watch

France Integrity Watch | Journalisme graphique | Scoop.it
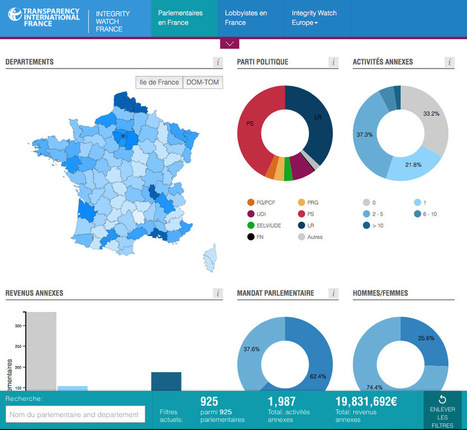
#IntegrityWatch: découvrez l’outil de Transparency International France pour prévenir les conflits d’intérêts au Parlement http://integritywatch.fr/index.html
No comment yet.
Scooped by Karen Bastien
December 11, 2015 11:53 AM
Scoop.it!

Expo murale sur la lutte contre les dérèglements climatiques

Expo murale sur la lutte contre les dérèglements climatiques | Journalisme graphique | Scoop.it
Du 5 novembre au 1er février 2016, l'expo « Dérèglements climatiques : prenons les choses en main ! » habille les...
Karen Bastien's insight:

Energie, alimentation, déchets, transports, habitat : quelles émissions de CO2 en Ile-de-France ? Des réponses chiffrées en photovisualisations, une série inédite conçue par WeDoData et réalisée par Picturetank pour la Région Ile-de-France


Retrouvez-les en exposition murale à Paris, rue de Babylone : http://www.iledefrance.fr/fil-actus-region/expo-murale-lutte-contre-dereglements-climatiques


No comment yet.
Scooped by Karen Bastien
November 29, 2015 4:17 PM
Scoop.it!

Open Budget Data

Open Budget Data | Journalisme graphique | Scoop.it
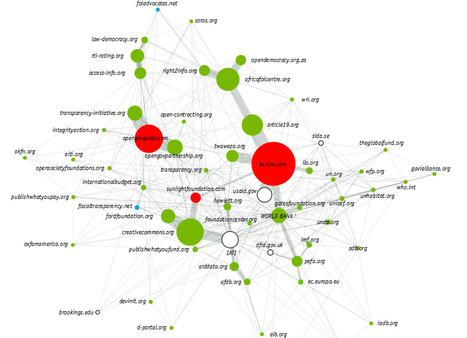
How public money is collected and distributed is one of the most pressing political questions of our time, influencing the health, well-being and prospects of b
No comment yet.
Scooped by Karen Bastien
November 25, 2015 12:18 PM
Scoop.it!

Cancer et publications scientifiques

Cancer et publications scientifiques | Journalisme graphique | Scoop.it
Karen Bastien's insight:
la dynamique des innovations relatives à la prise en charge du cancer de la prostate entre 1980 et 2014, puis calculé leur probabilité de diffusion entre 2015 et 2030. Nos travaux reposent sur une analyse sémantique puis mathématique de dizaines de milliers d’articles scientifiques disponibles sur la Bibliothèque américaine de médecine (Pubmed).

http://datavisualisation.la-metis.fr/app/first

No comment yet.