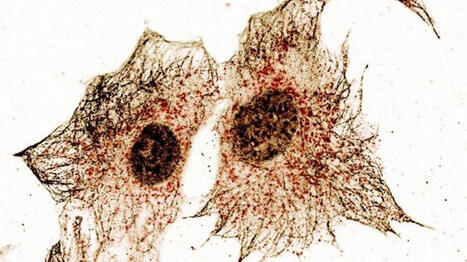
Evolutionary conservation analysis reveals a primordial function of STING as a regulator of lipid metabolism via FADS2 et félicitations à Jenny BERTHELOT (Nguyen).

 Your new post is loading...
 Scoop.it! Evolutionary conservation analysis reveals a primordial function of STING as a regulator of lipid metabolism via FADS2 et félicitations à Jenny BERTHELOT (Nguyen). 
No comment yet.
Sign up to comment
Scoop.it!

The Trigger: DAMPs and Immunogenic Cell Death
Scoop.it!
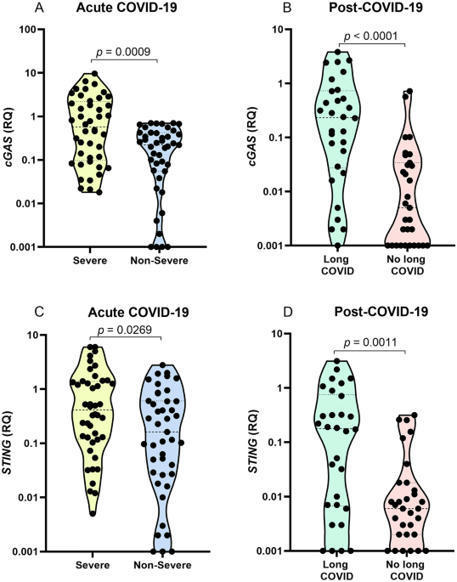
The cGAS-STING pathway appears to contribute to dysregulated inflammation during coronavirus disease 2019 (COVID-19); however, inflammatory factors related to long COVID are still being investigated. In the present study, we evaluated the association of cGAS and STING gene expression levels and plasma IFN-α, TNF-α and IL-6 levels with COVID-19 severity in acute infection and long COVID, based on analysis of blood samples from 148 individuals, 87 with acute COVID-19 and 61 in the post-COVID-19 period. Quantification of gene expression was performed by real-time PCR, and cytokine levels were quantified by ELISA and flow cytometry. In acute COVID-19, cGAS, STING, IFN-α, TNF-α, and IL-6 levels were higher in patients with severe disease than in those with nonsevere manifestations (p < 0.05). Long COVID was associated with elevated cGAS, STING and IFN-α levels (p < 0.05). Activation of the cGAS-STING pathway may contribute to an intense systemic inflammatory state in severe COVID-19 and, after infection resolution, induce an autoinflammatory disease in some tissues, resulting in long COVID.
Scoop.it!

The cGAS-STING pathway is an evolutionarily conserved immune signaling pathway critical for microbial defense. Unlike other innate immune pathways that largely rely on stationary cascades of signaling events, STING is highly mobile in the cell. STING is activated on the ER, but only signals after it …
Scoop.it!
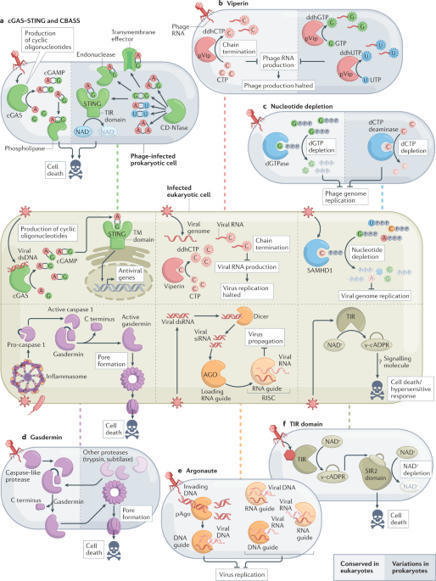
The cell-autonomous innate immune system enables animal cells to resist viral infection. This system comprises an array of sensors that, after detecting viral molecules, activate the expression of antiviral proteins and the interferon response. The repertoire of immune sensors and antiviral proteins has long been considered to be derived from extensive evolutionary innovation in vertebrates, but new data challenge this dogma. Recent studies show that central components of the cell-autonomous innate immune system have ancient evolutionary roots in prokaryotic genes that protect bacteria from phages. These include the cyclic GMP–AMP synthase (cGAS)–stimulator of interferon genes (STING) pathway, Toll/IL-1 receptor (TIR) domain-containing pathogen receptors, the viperin family of antiviral proteins, SAMHD1-like nucleotide-depletion enzymes, gasdermin proteins and key components of the RNA interference pathway. This Perspective details current knowledge of the elements of antiviral immunity that are conserved from bacteria to humans, and presents possible evolutionary scenarios to explain the observed conservation. The cell-autonomous innate immune system has long been considered an evolutionary innovation of metazoans; however, recent evidence challenges this dogma. This Perspective describes the components of antiviral immunity that are conserved from bacteria to humans, and presents potential evolutionary scenarios to explain the observed conservation.
Scoop.it!
|

|
Suggested by
Société Francaise d'Immunologie
April 4, 2019 2:16 PM
|
Scoop.it!

Research ArticleImmunologyInfectious disease Free access | 10.1172/JCI99550 IL-26 contributes to host defense against intracellular bacteria Angeline Tilly Dang,1,2 Rosane M.B. Teles,1 David I. Weiss,1,2 Kislay Parvatiyar,2 Euzenir N. Sarno,3 Maria T. Ochoa,4 Genhong Cheng,2 Michel Gilliet,5 Barry R. Bloom,6 and Robert L. Modlin1,2 First published April 2, 2019 - More info Abstract IL-26 is an antimicrobial protein secreted by Th17 cells that has the ability to directly kill extracellular bacteria. To ascertain whether IL-26 contributes to host defense against intracellular bacteria, we studied leprosy, caused by the obligate intracellular pathogen Mycobacterium leprae, as a model. Analysis of leprosy skin lesions by gene expression profiling and immunohistology revealed that IL-26 was more strongly expressed in lesions from the self-limited tuberculoid compared with expression in progressive lepromatous patients. IL-26 directly bound to M. leprae in axenic culture and reduced bacteria viability. Furthermore, IL-26, when added to human monocyte–derived macrophages infected with M. leprae, entered the infected cell, colocalized with the bacterium, and reduced bacteria viability. In addition, IL-26 induced autophagy via the cytoplasmic DNA receptor stimulator of IFN genes (STING), as well as fusion of phagosomes containing bacilli with lysosomal compartments. Altogether, our data suggest that the Th17 cytokine IL-26 contributes to host defense against intracellular bacteria. Introduction The gene encoding IL-26 was discovered in Herpesvirus saimiri–transformed human T cells, with approximately 25% sequence homology and approximately 47% amino acid similarity to IL-10 (1). As such, IL-26 is considered a member of the IL-10 cytokine family, which includes IL-10, IL-19, IL-20, IL-22, and IL-24 (2, 3). The IL26 gene is located on chromosome 12q15, between IFNG and IL22. IL26 is highly conserved in mammalian species and more weakly similar to nonmammalian species. However, IL26 is absent in rodents, despite the presence of both IL-26 receptor genes (4–6). IL-26 contains 171 amino acids, including lysine or arginine 30 residues, forming 6 highly cationic α-helices (1). Th17 cells are the main producers of IL-26 (7, 8), but some Th1 cells (9) and NK cells (10) are reported to produce this cytokine. Although monocytes (11) and macrophages (12) have been reported to release IL-26, the purity of the cell populations was not clearly stated. The structure of IL-26, including the α-helices, the amphipathic stretches, the clustering of cationic charges, and the formation of multimers, are hallmarks of naturally occurring antimicrobial peptides (13, 14). This led to the discovery that IL-26 is the only known Th17 cytokine with antimicrobial properties, with the ability to kill extracellular bacteria including Pseudomonas aeruginosa, Escherichia coli, Klebsiella pneumoniae, and Staphylococcus aureus that largely reside and replicate outside of cells (3, 9). Similar to other antimicrobial proteins, IL-26 reduced bacterial viability via direct binding to the bacterial cell wall, leading to pore formation and membrane disruption (9). In addition to its direct antimicrobial activity, IL-26 was shown to signal through the IL‑10R2/IL-20R1 heterodimeric receptor, with both subunits simultaneously expressed exclusively and constitutively by epithelial cells (15, 16). Despite sharing homology with the antiinflammatory cytokine IL-10 and a receptor subunit with the IL-10 receptor, the majority of evidence indicates that IL-26 not only initiates inflammation but also propels it (17–19). IL-26 was found to induce the expression of IL-10, TNF-α, and IL-8 in epithelial cells, as well as inhibit their proliferation (20). IL-26 can also drive inflammation by acting as a potent chemoattractant for neutrophils (12), which subsequently can be activated to release inflammatory cytokines, proteases, and antimicrobial peptides (21). One report indicated that, although IL-26 by itself induced cytokine responses in bronchoalveolar lavage (BAL) cells, it inhibited the release of myeloperoxidase from BAL cells and neutrophils by less than 25% (12). In the present study, we investigated whether IL-26 contributes to host defense against the obligate intracellular bacterium by studying human leprosy as a model. The disease, caused by the Mycobacterium leprae, forms a spectrum, in which the clinical presentation correlates with the effectiveness of the immune response. In the self-limited tuberculoid leprosy (T-lep) form, the bacteria are eliminated, whereas, in the disseminated lepromatous (L-lep) form, bacilli-laden macrophages are prominent, indicating an inability to contain the infection. The results provide evidence that IL-26 may act intracellularly as well as extracellularly to kill microbial pathogens. Results IL-26 expression in human leprosy. We mined the gene expression data derived from leprosy lesions (22) to determine whether there was differential expression of IL26 mRNA across the spectrum of disease. This analysis revealed that IL26 mRNA levels were significantly greater in the skin biopsy specimens from T-lep patients compared with those from L-lep patients (Figure 1A), with probe intensities of 408 ± 118 in the gene expression data from T-lep lesions versus 33 ± 11 from L-lep lesions (P < 0.05). In 7 of 10 specimens from T-lep donors, the expression of IL26 mRNA was greater than in the specimens from all the L-lep donors. Figure 1 IL-26 in leprosy lesions. (A) IL26 mRNA probe intensity of skin leprosy lesions was quantified by microarray gene expression. **P < 0.01, by Student’s t test. (B) IL-26 expression in leprosy lesions (T-lep and L-lep). Shown are 2 representative labeled sections from at least 4 individuals. Scale bars: 40 μm. (C) IL-26 expression following saturation of IL-26 Ab with rIL-26, demonstrating Ab specificity. Shown is 1 representative labeled section from 1 of 3 individuals. Scale bars: 20 μm. (D) Ratio of IL-26 and nuclear staining quantified by ImmunoRatio. Data represent the mean ± SEM (n = 4). *P < 0.05, by 2-tailed Student’s t test. We further assessed the differences in IL-26 expression in leprosy lesions by immunohistochemical analysis with an anti–IL-26 monoclonal Ab. IL-26 protein expression was abundant in T-lep lesions, throughout the granuloma, and particularly strong in the vicinity of small lymphoid cells, but was also diffusely present near larger mononuclear myeloid cells (Figure 1B). In contrast, IL-26 expression was sparse throughout the L-lep lesions. We also assessed the specificity of the anti–IL-26 mAb by adding recombinant monomers of IL-26 protein to the Ab prior to tissue staining. Saturation of the mAb by recombinant IL-26 reduced the signal intensity in T-lep lesions, demonstrating specificity of the Ab to the protein (Figure 1C). Anti-CD3 served as a positive control. All isotype controls were consistently negative. Quantification was performed using the online software ImmunoRatio (23) to measure the IL-26 to nuclear staining ratio, which provides a measure of IL-26 expression. This ratio is not intended as a measure of IL-26–expressing cells, as we could not determine whether IL-26 was being produced or taken up by individual cells. The IL-26 to nuclear staining ratio was approximately 10-fold higher in T-lep lesions than in L-lep lesions: 56 ± 8.5 vs. 5.2 ± 3.0 (P < 0.05, Figure 1D). We used confocal laser microscopy to determine the relative localization of IL-26 in relation to T cells and macrophages within leprosy lesions. Again, we observed that IL-26 expression was greater in T-lep lesions than in L-lep lesions, colocalizing more frequently with CD4+ T cells in T-lep versus L-lep lesions (Figure 2, A and B) and, to a lesser extent, with CD8+ T cells (Figure 2, C and D). The frequency of CD4+ T cells that colocalized with IL-26 was greater in T-lep lesions, at 26.7% ± 3.7% compared with 3.2% ± 0.7% in L-lep lesions (P < 0.01, Figure 2B). In addition, the frequency of CD8+ T cells that colocalized with IL-26 was greater in T-lep lesions, at 17.5% ± 1.2%, compared with L-lep lesions, which had 7.2% ± 1.3% colocalization (P < 0.05, Figure 2D). In a simultaneous comparison of the levels of colocalization of IL-26 with the CD4+ and CD8+ T cell markers, we found that IL-26 colocalized significantly more with CD4+ than with CD8+ T cells (P < 0.05, Figure 2E). Additionally, we analyzed the relative location of IL-26 in relation to CD68+ macrophages in leprosy lesions and found that IL-26 was coexpressed with CD68 in both types of lesions (Figure 3A). However, the degree of colocalization between IL-26 and the CD68 marker was also higher in T-lep lesions than in L-lep lesions (16.8% ± 2.1% versus 8.3% ± 1.1%, respectively) (P < 0.05, Figure 3B). We also observed areas in T-lep granulomas in which IL-26 colocalized with both CD4+ and CD68+ cells (Figure 3C). In a simultaneous comparison of the levels of colocalization of IL-26 with the CD4 and CD68 markers, we found that IL-26 colocalized significantly more with CD4+ than with CD68+ (P < 0.05, Figure 3D). These data show the proximity of IL-26 to CD4+ and CD68+ cells, but again, these data define the microanatomic location of IL-26 but cannot distinguish between production versus uptake of the protein. Figure 2 IL-26 colocalization with CD4 and CD8. (A) Immunofluorescence of IL-26 (green), CD4 (red), and nuclei (DAPI, blue) in T-lep and L-lep lesions. Data are representative of 4 individual samples. Original magnification, ×20. Scale bars: 10 μm (enlarged insets). (B) Colocalization of CD4 and IL-26, as determined by ImageJ. Data represent the mean ± SEM (n = 4). **P < 0.01, by 2-tailed Student’s t test. (C) Immunofluorescence of IL-26 (green), CD8 (red), and nuclei (DAPI, blue) in T-lep and L-lep lesions. White arrows indicate colocalization of green and red (yielding yellow). Original magnification, ×20. Scale bars: 10 μm (enlarged insets). (D) Colocalization of CD8 and IL-26, as determined by ImageJ. Data represent the mean ± SEM (n = 4). *P < 0.05, by 2-tailed Student’s t test. (E) Comparison of CD4 or CD8 colocalization with IL-26 in T-lep using ImageJ. Data represent the mean ± SEM (n = 4). *P < 0.05, by 2-tailed Student’s t test. Figure 3 IL-26 colocalization with CD68+ macrophages in leprosy lesions. (A) Immunofluorescence of IL-26 (green), CD68 (red), and nuclei (DAPI, blue) in T-lep and L-lep lesions. White arrows indicate colocalization of IL-26 and CD68. Data are from 5 individual samples. Original magnification, ×20. Scale bars: 10 μm (enlarged insets). (B) Colocalization of IL-26 and CD68 in T-lep and L-lep lesions using ImageJ. Data represent the mean ± SEM (n = 5). *P < 0.05, by 2-tailed Student’s t test. (C) Immunofluorescence of IL-26 (green), CD68 (red), CD4 (cyan), and nuclei (DAPI, blue) in T-lep and L-lep lesions. Data are from 3 individual samples. White arrows indicate colocalization of IL-26 (green) and CD68 (red) (yielding yellow). Original magnification, ×20. Scale bars: 10 μm (enlarged insets). (D) Comparison of CD4 or CD68 colocalization with IL-26 in T-lep using ImageJ. Data represent the mean ± SEM (n = 4). *P < 0.05, by 2-tailed Student’s t test. IL-26 directly reduces the viability of mycobacteria in axenic conditions. As a first step toward defining the role of IL-26 against intracellular M. leprae, we determined whether IL-26 bound to the bacterium. M. leprae was incubated with recombinant IL-26 protein in axenic culture. After 6 hours, IL-26 was detected on the surface of some M. leprae bacilli (Figure 4, A and C). Quantification of confocal images confirmed that the majority of bacilli were bound by IL-26, 89.5% ± 0.5%, leaving 9.5% ± 0.51.1% free bacilli (Figure 4B). Analysis of confocal images using Imaris software revealed that the bacilli that were bound to IL-26 were larger in diameter, as measured by transverse width, compared with media controls. The width of the bacilli increased from 0.359 ± 0.012 μm in media-treated bacteria to 0.528 ± 0.023 μm in 1 μM or 0.591 ± 0.038 μm in 2 μM of IL-26–treated bacteria (P < 0.01, Figure 4D). The increased diameter is consistent with osmotic lysis of the bacteria, one mechanism by which antimicrobial peptides mediate an antimicrobial response. Figure 4 IL-26 binds directly to M. leprae bacilli. (A and C) Confocal microscopic images of Alexa 488–IL-26 (green) cultured with M. leprae (red) for 6 hours. Data shown are representative of 4 independent experiments. Scale bars: 5 μm. (B) Quantification of number of free bacilli or IL-26–bound bacilli (left) and percentage of free or IL-26–bound bacilli of total bacilli counts (right). (D) Measurement of M. leprae bacilli thickness from the confocal microscopy images in C. Media contained Alexa Fluor 488 dye as a control. Data represent the mean ± SEM (n = 50 bacilli for each condition). Data shown are representative of 4 independent experiments. ***P < 0.001, by repeated-measures 1-way ANOVA. Although M. leprae does not grow in culture, it is possible to measure bacterial viability by quantitative PCR (qPCR) using the ratio of M. leprae 16S rRNA to the repetitive element DNA RLEP as a proxy for transcriptional activity, as previously reported (22, 24, 25). We studied the effects of IL-26 in axenic culture to determine whether it further reduced bacterial viability and found that IL-26 treatment of M. leprae for 3 days reduced the viability of the bacteria in a dose-dependent manner (Figure 5A). The observed antimicrobial activity was diminished when IL-26 was denatured prior to addition to M. leprae (Figure 5B). Similarly, IL-26 inhibited the growth of Mycobacterium tuberculosis H37Ra in axenic culture, quantified by a CFU assay (Figure 5C). These findings reveal that IL-26 binds directly to mycobacteria and mediates a reduction in bacteria viability. Figure 5 IL-26 has direct antimicrobial activity against mycobacteria. (A) M. leprae was cultured for 4 days with increasing concentrations of IL-26. Rifampicin (Rif) was used as a positive control. Viability of M. leprae was calculated by the ratio of bacterial 16S rRNA and RLEP DNA detected by qPCR. Relative viability was determined by comparing the treatment ratio with the media ratio. Data represent the mean ± SEM (n = 5). (B) M. leprae (mLEP) was cultured for 4 days with 10 μM native IL-26 or denatured IL-26 (dIL-26). Rifampicin was used as a positive control. Viability of M. leprae was calculated according to the ratio of bacterial 16S rRNA and RLEP DNA detected by qPCR. Relative viability was determined by comparing the treatment ratio with the media ratio. Data represent the mean ± SEM (n = 5). (C) M. tuberculosis (mTB H37Ra) was cultured for 4 days with increasing concentrations of IL-26. Rifampicin was used as a positive control. A CFU assay was performed and numbers quantified after 3 weeks. Data represent the mean ± SEM (n = 5). *P < 0.05 and **P < 0.01, by repeated-measures 1-way ANOVA. IL-26 is taken up by monocyte-derived macrophages and colocalizes with M. leprae. During M. leprae infection, bacilli can be found in a variety of tissues and cell types but are predominantly located in macrophages (26, 27). Although it has been reported that IL-26 concentrations up to 10 μM did not affect the viability of human primary human immune cells (9), we specifically assessed the cytotoxic effects of IL-26 on human monocyte–derived macrophages (MDMs). When we treated MDMs with increasing concentrations of IL-26, we observed some detachment of MDMs from the culture plates with the 2-μM IL-26 treatment. With 5-μM IL-26 treatment, the majority of cells were detached, and the cells that remained showed condensed nuclei and positive staining by TUNEL assay, indicative of cellular apoptosis (Figure 6A). Therefore, we stimulated MDMs with IL-26 at 2 μM or less in all remaining experiments to ensure optimal cell viability. Figure 6 IL-26 is taken up by MDMs and colocalizes with M. leprae. (A) Human MDMs were treated with IL-26 overnight. Cells were washed and fixed, and apoptosis was determined using a TUNEL (green) assay. Nuclei were stained with DAPI (blue). Data shown are from 5 individual donors. Scale bars: 5 μm. (B) Human MDMs were treated with Alexa 488–IL-26 (green) overnight. Cells were washed, fixed, and immunolabeled with anti-LAMP1 Ab (red). Nuclei were stained with DAPI (blue). Data shown are representative of 5 individual donors. Scale bars: 5 μm. Bottom row magnification, ×630. (C) Colocalization of LAMP1 (red) and IL-26 (green) was quantified with ImageJ. Data represent the mean percentage of colocalization ± SEM (n ≥ 50 cells from 3 donors). **P < 0.01, by repeated-measures 1-way ANOVA. (D) Human MDMs were treated with Alexa 488–IL-26 (green) for 30 minutes and infected with M. leprae (red) overnight. Cells were washed and fixed. Nuclei were stained with DAPI (blue). Media contained Alexa Fluor 488 dye as a control. Data shown are from 4 individual donors. Scale bars: 5 μm. Bottom row magnification, ×630. (E) Colocalization of M. leprae (red) and IL-26 (green) was quantified with ImageJ. Data represent the mean percentage of colocalization ± SEM (n ≥ 40 cells from 4 donors). (F) Quantification of M. leprae–infected MDMs following 30 minutes of treatment with IL-26. Data represent the mean percentage ± SEM (n = 4). Because M. leprae is an obligate intracellular organism, IL-26 must gain access to the intracellular compartments in which the bacteria reside in order to exert a direct antimicrobial activity. We therefore evaluated whether IL-26 entered MDMs and could be detected in the endosomal pathway in which M. leprae resides. Overnight treatment of MDMs with Alexa 488–labeled IL-26 resulted in the uptake of IL-26 and colocalization with lysosomal-associated membrane protein 1–positive (LAMP1-positive) compartments (Figure 6B). The colocalization of Alexa 488–labeled IL-26 with LAMP1 was significantly greater than was seen with the addition of Alexa 488 dye alone, increasing from 2.3% ± 0.4% colocalization in dye media alone to 19.6% ± 3.3% in 1 μM and 23% ± 2.3% in 2 μM IL-26 (P < 0.01, Figure 6C). Furthermore, treatment of M. leprae–infected MDMs with Alexa 488–labeled IL-26 revealed colocalization of intracellular bacilli with IL-26 (Figure 6D). The degree of IL-26 colocalization with M. leprae was similar for treatment with the 1-μM and 2-μM concentrations of the cytokine: 11.9% ± 1.5% and 11% ± 0.6%, respectively (Figure 6E). Finally, we assessed whether pretreatment of MDMs with IL-26 affects the levels of infectivity by M. leprae. Although pretreatment of MDMs with IL-26 slightly reduced the infection efficiency of M. leprae, the differences in the percentages of M. leprae–infected MDMs were not statistically significant (Figure 6F). IL-26 induces autophagy and enhances bacterial trafficking to the lysosomes. The process of autophagy is required to overcome the ability of mycobacteria to block phagolysosomal fusion in infected macrophages in order to promote an effective antimicrobial response (28–30). Immunofluorescence data indicated a significant increase in the number of autophagosomes in MDMs following treatment with IL-26 compared with media control, as determined by quantification of LC3 puncta (Figure 7A). In media alone, we observed 8.3 ± 1.3 puncta per cell compared with IL-26 treatment, in which 57.9 ± 5.5 puncta per cell were detected (P < 0.01, Figure 7B). The ability of IL-26 to induce autophagy was confirmed by LC3 I to LC3 II conversion by immunoblotting (Figure 7C). Given that IL-26 has been shown to bind to DNA from dying cells in in vitro cultures and traffic this DNA to activate innate cytoplasmic receptors, e.g., stimulator of IFN genes (STING) (9, 31), we investigated whether IL-26–induced autophagy was STING dependent. We found that IL-26 induced autophagy in WT THP-1 cells but was strikingly diminished in THP-1 cells in which STING was ablated by stable KO. In contrast, rapamycin-induced autophagy was STING independent (Figure 7D). Overall, IL-26–induced autophagy in THP-1 cells, as measured by the number of LC3 puncta per cell, was blocked by approximately 60% by the deletion of STING (Figure 7E). In contrast, only 25% of rapamycin-induced autophagy was STING dependent. Figure 7 IL-26 induces autophagy and enhances bacterial trafficking to the lysosomes. (A) MDMs were cultured with IL-26 or media overnight and then immunolabeled with anti-LC3 Ab (green) and anti-CD68 Ab (red). Nuclei were stained with DAPI (blue). Original magnification, ×63. Scale bars: 5 μm. (B) LC3 puncta per cell ± SEM (n ≥ 50 cells from 4 donors). (C) LC3 I to LC3 II conversion was detected by immunoblotting. Hsp90 was used as an internal control. (D) PMA-treated THP-1 cells were treated with IL-26 (2 μM) for 24 hours and with rapamycin (300 nM) for 6 hours and then immunolabeled with LC3 Ab (green). Nuclei were stained with DAPI (blue). Data shown are representative of 1 of 3 independent experiments for both WT and STING–/– THP-1 cells. Original magnification, ×63. (E) LC3 puncta per cell ± SEM (n ≥ 50 cells from 3 donors for both WT and STING–/– THP-1 cells). (F) Human MDMs were treated with IL-26 for 30 minutes and infected with M. leprae (red) overnight. Cells were washed, fixed, and immunolabeled with anti-LC3 (green) and LAMP-1 (cyan). Nuclei were stained with DAPI (blue). Data shown are representative of 4 individual donors. Inset image is of LC3 (green) and M. leprae (red) overlay, without LAMP1 (cyan). Original magnification, ×63 and x630 (enlarged insets). (G) Colocalization of LC3 and M. leprae and (H) colocalization of LAMP1 and M. leprae were quantified with ImageJ. Data represent the mean percentage of the cellular volume of colocalization ± SEM (n ≥ 30 cells from 4 donors). (I) Human MDMs were treated with Alexa 488–IL-26 (green) for 30 minutes and infected with M. leprae (red) overnight. Cells were washed and immunolabeled with anti-LAMP1 (cyan). Nuclei were stained with DAPI (blue). Media contained Alexa Fluor 488 dye as a control. Data shown are from 4 individual donors. Scale bars: 5 μm. (J) Colocalization of IL-26 and LAMP1 was quantified with ImageJ. Data are represented as the mean percentage of the cellular volume of colocalization ± SEM (n ≥ 40 cells from 4 donors). *P < 0.05 and **P < 0.01, by repeated-measures 1-way ANOVA. Having demonstrated that IL-26 induces autophagy and colocalizes with M. leprae bacilli during infection, we hypothesized that bacteria would localize to autophagosomes following IL-26 stimulation. We observed a significant increase in colocalization of M. leprae with the autophagosome marker LC3 and the lysosome marker LAMP1 (Figure 7F). We observed 5.1% ± 0.7% colocalization between M. leprae and LC3 in the media control–treated MDMs versus 18.9% ± 1.4% and 26% ± 1.9% colocalization in the 1-μM and 2-μM IL-26–treated MDMs, respectively (P < 0.05, Figure 7G). We noted a similar increase in the colocalization of M. leprae and LAMP1 following IL-26 stimulation, with 1.3% ± 0.2% colocalization between M. leprae and LAMP1 in the media control–treated MDMs versus 3.3% ± 0.4% and 6.4% ± 0.8% colocalization in the 1-μM and 2-μM IL-26–treated MDMs, respectively (P < 0.01, Figure 7H). Although treatment with the higher concentration of IL-26 induced more M. leprae colocalization with LAMP1, we observed that IL-26 colocalization with LAMP1 remained comparable following treatment with either 1 μM or 2 μM IL-26 (Figure 7, I and J), consistent with our observations with uninfected MDMs (Figure 6C). This suggests that the mechanism driving the increased traffic of M. leprae to LAMP1 compartments in infected MDMs is not through increased expression of LAMP1 but potentially through IL-26–induced autophagy. IL-26 induces antimicrobial activity against intracellular bacteria. Finally, we sought to determine whether IL-26 treatment during infection would result in antimicrobial activity against M. leprae. Indeed, we found that IL-26 treatment during M. leprae infection significantly reduced the viability of intracellular bacteria compared with media control. The addition of 2 μM IL-26 to the infected MDMs was required to reduce the viability of the intracellular bacteria by approximately 40%, much less than the 10-μM amount needed to have similar effects in axenic culture (P < 0.05, Figure 8A). Antimicrobial activity was dependent on the native structure of IL-26, because denaturing the protein did not produce the same results (P < 0.05, Figure 8B). We observed similar antimicrobial activity against M. tuberculosis (H37Ra) in MDMs (P < 0.05, Figure 8C). We note that in one study, the addition of IL-26 to M. tuberculosis–infected whole blood, albeit at lower concentrations (~700-fold lower than given here), did not result in an antimicrobial response; however, the authors stated that the nature of the whole-blood antimicrobial assay made interpretation of this result difficult (11). Figure 8 IL-26 induces antimicrobial activity against intracellular bacteria. (A) MDMs were treated with IL-26 for 30 minutes and then infected with M. leprae for 4 days. Rifampicin was used as a positive control. Viability of M. leprae was measured by qPCR (n = 6). (B) MDMs were treated with IL-26 or denatured IL-26 and then infected with M. leprae, and bacterial viability was measured as in A (n = 4). (C) MDMs were treated with IL-26 or denatured IL-26 and then infected with M. tuberculosis (H37Ra) as in A. Viability of intracellular M. tuberculosis was determined by CFU assay (n = 3). (D) MDMs were treated with IL-26 for 4 hours and then washed and infected with S. aureus for 4 hours, followed by removal of the extracellular bacteria. After overnight culture, the viability of intracellular S. aureus was determined by CFU assay (n = 5). (E) MDMs were treated with IL-26 with or without wortmannin (Wm) and then infected with M. leprae, and bacterial viability was measured as in A (n = 6). *P < 0.05 and **P < 0.01, by repeated-measures 1-way ANOVA. All data represent the mean ± SEM. To further investigate the ability of IL-26 to mediate an antimicrobial response against intracellular bacteria, we infected MDMs with Staphylococcus aureus, which, when taken up by macrophages, has been reported to inhibit autophagy and acidification of phagolysosomes (32–34). Compared with the media control, we observed that IL-26 treatment of MDMs significantly reduced the viability of intracellular S. aureus (P < 0.05, Figure 8D). Having demonstrated that IL-26 can induce autophagy in MDMs, we sought to determine whether autophagy is required for antimicrobial activity. We used the PI3K inhibitor wortmannin to block IL-26–induced autophagy. The addition of wortmannin prior to IL-26 stimulation significantly reduced antimicrobial activity, which we observed by the increased viability of M. leprae, from 53% ± 7.8% with 2 M IL-26 treatment to 86.7% ± 10.1% with wortmannin (P < 0.05, Figure 8E). In summary, these data demonstrate that IL-26 treatment of infected MDMs leads to autophagy, colocalization of IL-26 with the bacilli in LAMP1 compartments, and an antimicrobial response against intracellular bacteria. Discussion The adaptive T cell response kills intracellular pathogens through direct and indirect mechanisms. For example, CD8+ cytotoxic T cells deliver cytotoxic granule contents including the antimicrobial protein granulysin into infected macrophages, leading to a direct reduction in the viability of intracellular pathogens (35–38). CD4+ Th1 cells release IFN-γ, which triggers an indirect antimicrobial mechanism through activation of endogenous pathways in macrophage microbicidal pathways. Given that CD4+ Th17 cell production of IL-26 provides a direct antimicrobial pathway against extracellular bacteria (9), we explored whether IL-26 can mediate an antimicrobial response against intracellular bacteria. We provide evidence that IL-26 enters bacteria-infected macrophages, induces autophagy, and colocalizes with the pathogen, together resulting in an antimicrobial response. These data identify a role for IL-26 in host defense against intracellular bacteria. We examined the role of IL-26 in leprosy, which provides a unique model, given that the disease presents as a spectrum in which the clinical presentation correlates with the immune response to the pathogen. Measuring mRNA and protein levels at the site of disease, we observed that IL-26 expression was greater in lesions from patients with T-lep than in those with L-lep, correlating with the group of patients with the greatest cell-mediated immunity against the pathogen. IL-26 colocalized with T cells but also with CD68+ macrophages, indicating proximity to the cell type infected by the leprosy bacillus. The colocalization of IL-26 with CD68+ macrophages was significantly (P < 0.05) greater in T-lep than L-lep lesions, even though there are comparable numbers of macrophages in the different forms of leprosy (38). The higher expression levels of IL-26 in T-lep lesions correlate with the lower bacterial load in this form of leprosy (39, 40). In contrast, the relatively lower expression of IL-26 that we observed in L-lep lesions is associated with a higher bacterial load in this form of leprosy. The lack of IL-26 may permit bacterial growth, and/or the bacilli may potentially inhibit the production and secretion of IL-26. For example, expression of IL-4, IL-10, and type I IFN has been reported to be higher in L-lep compared with T-lep lesions, and these cytokines are known to inhibit antimycobacterial pathways (22, 41–44). Accordingly, the type I IFN gene expression profile is also enhanced in the blood of patients with active tuberculosis (45, 46), which may contribute to the lower amount of IL-26 release following M. tuberculosis infection of a monocyte-enriched population from patients with tuberculosis compared with healthy controls (11). IL-26 may contribute to an antimicrobial response against intracellular bacteria in infected macrophages through 2 mechanisms. First, IL-26 had direct antimicrobial activity against intracellular mycobacteria, as shown in axenic culture, and colocalized with M. leprae in infected MDMs. Second, we found that IL-26 induces autophagy in MDMs, which was required for its antimicrobial response against intracellular M. leprae. Since mycobacteria are known to inhibit the phagolysosomal fusion required for intracellular killing (47), and S. aureus is known to subvert acidification of phagolysosomes (32–34), IL-26 may stimulate infected cells to overcome this inhibition, facilitating the antimicrobial response. Additionally, the higher expression of IL-26 we detected in T-lep lesions also correlates with the higher number of autophagosomes detected in this form of leprosy (48). Although autophagy is required for killing of intracellular mycobacteria, some intracellular bacteria evade autophagy-dependent killing (28–30). We found that IL-26–induced autophagy was dependent on the cytoplasmic DNA receptor STING, consistent with the demonstrated ability of IL-26 to bind to DNA from dying cells in in vitro cultures and traffic this DNA to activate STING (9, 31), and the ability of STING activation to trigger autophagy in mycobacteria-infected macrophages (49). Although the IL-26 receptor, a heterodimer composed of IL‑10R2 and IL-20R1, is expressed exclusively and constitutively by epithelial cells (15, 16), human monocytes and macrophages express IL-10R2 but not IL-20R1. One report demonstrated that IL-26 induction of IL-6 from monocytes was blocked by approximately 50% using a polyclonal goat anti–IL-10R2 Ab, thereby triggering IL-10R2 alone or in combination with an undetermined coreceptor (19). It is therefore possible that IL-10R2 in myeloid cells is involved in uptake and/or signaling of IL-26 to induce autophagy. Given that IL-26 is produced by Th17 cells, our data, along with previous studies, suggest the possibility that Th17 cells contribute to host defense in leprosy. Serum IL-17 was lowest in L-lep patients compared with serum levels in all other forms of leprosy (50). Th17 cells were more frequent in both the lesions and M. leprae–stimulated PBMCs in patients with T-lep versus those with L-lep (51). Furthermore, SNPs in IL17F were associated with leprosy susceptibility (52). The related bacterium M. tuberculosis induces IL-23, a key cytokine in Th17 polarization by DCs (53), as well as Th17 cells (54). Yet, IL-17R–/– (55) and IL-23–/– (54) mice were more susceptible to M. tuberculosis infection. In mouse models of tuberculosis, IL-17 was required for the generation of IFN-γ–producing Th1 cells (56), granuloma formation, inflammation (54, 56), and vaccine-induced immunity (57). However, the functional studies of Th17 cells in tuberculosis have utilized mouse models, and, as mentioned, IL-26 is not present in the mouse genome, such that it will be important to determine whether Th17 cells contribute to host defense through mechanisms other than IL-26 release. In addition to mycobacteria, our data indicate that IL-26 has an antimicrobial effect on another cutaneous pathogen, S. aureus, when taken up by macrophages. Previous studies reported that defective Th17 responses in STAT3-deficient patients have been associated with increased susceptibility to S. aureus and Streptococcus pyogenes infections (58, 59), potentially due to reduced STAT3 activation by IL-26 (60). The current immunologic premise holds that Th1 cells defend against intracellular pathogens, whereas Th17 cells are required to defend against extracellular bacteria. In previous work, we demonstrated that Th1 cell release of IFN-γ activates macrophages to kill intracellular mycobacteria (22, 30), while human Th17 cells release IL-26, which kills extracellular bacteria in axenic (i.e., cell-free) cultures (9). Nevertheless, vaccines that induce only Th1 cells are not sufficient to engender protection against intracellular mycobacteria (61). Our data provide evidence that the Th17 cytokine IL-26 can contribute to host defense against intracellular bacteria, identifying one mechanism by which Th17 cells contribute to host defense against such pathogens. Methods Microarray data analysis. The reported gene expression profiles of mRNAs derived from skin biopsy specimens from 16 patients with leprosy (T-lep, n = 10; L-lep, n = 6), as determined using Affymetrix Human U133 Plus 2.0 microarrays, were mined to assess IL26 mRNA expression (22, 62). The gene expression files containing these array data are available in the NCBI’s Gene Expression Omnibus (GEO) database (GEO GSE17763). Generation of MDMs. MDMs were derived from whole blood from healthy donors. PBMCs were isolated using Ficoll (GE Healthcare) gradient centrifugation. CD14+ cells were positively selected from PBMCs using CD14 MicroBeads (Miltenyi Biotec, 130-050-201) and cultured in the presence of macrophage colony-stimulating factor (M-CSF) (50 ng/ml) (R&D Systems) and used on day 5 or 6. We routinely achieved a greater than 90% purity of monocytes by CD14 immunomagnetic selection. Viability of M. leprae by qPCR. Cells were stimulated with various concentrations of IL-26 for 30 minutes and then infected with M. leprae. For autophagy inhibition, MDMs were treated with 500 nM wortmannin prior to IL-26 stimulation. mRNA was isolated from cells using TRIzol Reagent (Invitrogen Life Technologies, Thermo Fisher Scientific) according to the manufacturer’s recommended protocol. The viability of intracellular M. leprae was determined by qPCR and quantified as previously described (19, 22, 23). Briefly, comparison of the bacterial DNA with the mammalian 36B4 levels was used to monitor infectivity between all the conditions in the assay as well as PCR quality. The 16S rRNA and genomic DNA values were calculated using the ΔΔCt analysis, with the bacterial DNA value serving as the housekeeping gene. The primer sequences were as follows: M. leprae 16s RNA, forward, 5′-GCATGTCTTGTGGTGGAAAGC-3′; M. leprae 16s RNA, reverse, 5′-CACCCCACCAACAAGCTGAT-3′; M. leprae RLEP DNA, forward, 5′-GCAGCAGTATCGTGTTAGTGAA-3′; M. leprae RLEP DNA, reverse, 5′-CGCTAGAAGGTTGCCGTAT-3′; H36B4, forward, 5′-CCACGCTGCTGAACATGCT-3′; H36B4, reverse, 5′-TCGAACACCTGCTGGATGAC-3′. M. tuberculosis axenic cultures. Recombinant IL-26 monomers (R&D Systems) were diluted in 10 mM sodium phosphate, pH 7.2. Aliquots of 2.5 × 10⁵ M. tuberculosis (H37Ra) bacteria were added to 100 μl Middlebrook 7H9 medium (BD Biosciences) containing recombinant IL-26 monomers (R&D Systems) or 20 μg/ml (final concentration) rifampicin (Sigma-Aldrich). Cultures were incubated at 37°C for 72 hours, after which 900 μl of 10 mM sodium phosphate, pH 7.2, was added to attain a volume of 1 ml. From the 1-ml suspension, 10 μl was plated onto Middlebrook 7H10 agar plates (Teknova) for 3 weeks, and CFU were enumerated. Infection of MDMs and quantification of M. tuberculosis CFU. Human MDMs were pretreated with IL-26 (R&D Systems) or 1 μg/ml (final concentration) rifampicin (Sigma-Aldrich) in 10% Omega FCS for 30 minutes and infected with M. tuberculosis (H37Ra) at a MOI of 5. The infected cells were harvested after 4 days, pelleted, and lysed with 100 μl of 0.2% saponin in 1× PBS on ice for 20 minutes. PBS 1× (900 μl) was added to bring the cell lysate to a 1-ml final volume. From the 1-ml suspension, 1 μl stock was plated onto Middlebrook 7H10 agar plates (Teknova) for 3 weeks, and CFU were enumerated. IL-26 culture with M. leprae. Recombinant IL-26 monomers (R&D Systems) were diluted in 10 mM sodium phosphate, pH 7.2, and labeled using the Alexa Fluor 488 Microscale Protein Labeling Kit (Molecular Probes, Invitrogen, Thermo Fisher Scientific). Aliquots of 1 × 10⁶ M. leprae bacteria, labeled by PKH-26, were incubated with A488-IL-26 in a 50-μl volume of 10 mM sodium phosphate, pH 7.2, for 6 hours and then mounted onto microscopy slides with ProLong Gold (Invitrogen Life Technologies, Thermo Fisher Scientific). Images were examined using a Leica microscope. M. leprae bacilli diameters were measured using Imaris software. Infection of MDMs and quantification of M. leprae viability. M. leprae bacteria were grown in the footpads of nu/nu mice as described previously (63) and were provided by the National Hansen’s Disease Program. Human MDMs were pretreated with IL-26 (R&D Systems) in 10% Omega FCS for 30 minutes and infected with M. leprae at a MOI of 5. The infected cells were harvested after 4 days. RNA and DNA were isolated from infected cells using TRIzol (Invitrogen, Life Technologies, Thermo Fisher Scientific). cDNA was made from RNA. DNA was treated with RNase to removed residual RNA. The viability of intracellular M. leprae was determined by qPCR and quantified as previously described (22, 24). Briefly, the levels of bacterial 16S rRNA and the genomic DNA element RLEP of M. leprae were measured by qPCR. The 16S rRNA and RLEP DNA values were determined by ΔΔCt analysis, with the DNA value serving as the housekeeping gene. The ratio of RNA to DNA was calculated for each replicate, and the percentage of bacterial viability was calculated relative to the respective media control. The efficiency of infection was determined by confocal microscopy. Approximately 5% to 70% of the cells were infected. Of the total number of cells, more than 95% were viable following the washes and infection. To denature recombinant IL-26, the protein was treated with 5% β-mercaptoethanol (Invitrogen, Thermo Fisher Scientific) and heated at 95°C for 10 minutes. Infection of MDMs and quantification of intracellular S. aureus CFU. Bacteria of the S. aureus strain DU5938 (Hla−Hlb−Hlg−) (64) were grown to the mid-log phase at 37°C with shaking (150 rpm) in brain-heart infusion (BHI) medium and then collected by centrifugation for 10 minutes at 5000 g. For cellular infection, the bacterial suspension was diluted with sterile 1× PBS. The number of viable bacteria was determined by serial dilution and plating onto BHI agar plates (65). Human MDMs (2 × 10⁶ cells) were pretreated with IL-26 for 4 hours, washed, and infected with S. aureus at an MOI of 5 for 4 hours in RPMI with 10% FCS antibiotic-free media. Next, 100 μg/ml gentamycin was added to the wells for 20 minutes to kill extracellular bacteria. Cells were then washed to further remove any remaining extracellular bacteria. Infected cells were cultured overnight at 37°C in a 4% CO2 incubator. To measure intracellular killing of bacteria, cells were pelleted and lysed with 100 μl of 0.2% saponin in 1× PBS on ice for 20 minutes. Next, 1× PBS (900 μl) was added to bring the cell lysate to a final volume of 1 ml, of which 1 μl was plated and CFU determined. Patients and clinical specimens. Patients with leprosy were classified according to the criteria established by Ridley and Jopling (66). The designation of T-lep included patients who were classified clinically as borderline tuberculoid (“BT”), and the designation of L-lep only included patients classified as “LL.” All T-lep and L-lep skin biopsy specimens were taken at the time of diagnosis, prior to the initiation of treatment. Specimens were embedded in OCT medium (Ames), snap-frozen in liquid nitrogen, and stored at –80°C. Tissue immunoperoxidase labeling. Frozen tissue sections were blocked with normal horse serum before incubation 2 hours with mAbs against IL-26 (clone 2A8, IgG2a, Sigma-Aldrich) and CD3 (clone UCHT1, IgG1k, BD Biosciences), followed by incubation with biotinylated horse anti–mouse IgG for 90 minutes. To test Ab specificity, IL-26 Ab was incubated with IL-26 monomers (R&D Systems) for 15 minutes prior to incubation on tissue sections. Slides were counterstained with hematoxylin and mounted in crystal mounting medium (Biomeda) and were visualized using the ABC Elite system (Vector Laboratories). Skin sections were examined with a Leica microscope. Ratios were calculated using ImmunoRatio online software (Jorma Isola and Vilppu Tuominen, Institute of Biomedical Technology, University of Tampere, Tampere, Finland) (23), an automated image analysis application that calculates the percentage of DAB-stained nuclear area per total area. Cell culture immunofluorescence labeling. Recombinant IL-26 monomers (R&D Systems) were labeled using the Alexa Fluor 488 Microscale Protein Labeling Kit (Molecular Probes, Invitrogen, Thermo Fisher Scientific). MDMs were treated with labeled recombinant IL-26 (rIL-26) monomers in RPMI media with 10% FCS for 30 minutes. As a control, MDMs were treated with the Alexa Fluor 488 dye media used for the labeling reaction. Treated MDMs were next infected with live PKH26-labeled M. leprae overnight. Cells were then washed and fixed for 30 minutes with 4% PFA and then washed again. Next, cells were permeabilized with 0.25% saponin for 20 minutes, blocked with serum for 30 minutes, and stained with primary Abs against CD68 (clone Y1/82A, IgG2b, BioLegend), LAMP1 (clone H4A3, IgG1, BioLegend), or LC3 (clone 4E12, IgG1, MBL International) for 2 hours. Following washing, cells were stained with secondary Abs (Molecular Probes, Invitrogen, Thermo Fisher Scientific) for 90 minutes, washed, and mounted with ProLong Gold with DAPI (Invitrogen, Life Technologies, Thermo Fisher Scientific). For the quantification of autophagy, the percentages of LC3 punctated cells were evaluated using fluorescence microscopy. Approximately 100 cells, over 6 different random fields of view, were scored for each condition of each experiment. Rapamycin was used as a positive control for autophagy induction at 300 nM. Immunofluorescence of cell cultures was examined using a Leica TCS-SP MP inverted single confocal laser-scanning microscope and a Leica 2-photon laser microscope at the Advanced Microscopy/Spectroscopy Laboratory and Macro-Scale Imaging Laboratory (California NanoSystems Institute, UCLA). Colocalization quantifications were performed using ImageJ software (NIH) by splitting the final image overlay into individual single channels and selecting the “Colocalization Threshold” option to calculate the percentage of pixel overlap between channels. Culture and treatment of WT and STING-KO THP-1 cells. WT and STING-KO THP-1 dual reporter cell lines were purchased from InvivoGen. The STING-KO THP-1 dual cells were created by stable KO of STING in WT THP-1 dual cells. The cells were cultured according to the manufacture’s protocol. For all experiments, both WT and STING-KO THP-1 cells were passaged no more than 5 times. WT and STING-KO cells were plated at a density of 0.5 × 10⁶ cells/ml on 8-well glass slides and were made adherent by treating with 400 ng/ml PMA for 48 hours. The cells were subsequently treated or not with 2 μM rIL-26 monomers for 24 hours. Rapamycin (300 nM) was added to some wells for 3 hours to serve as a positive control for autophagy induction. Immunofluorescence labeling for LC3 puncta detection was performed as described above in the Cell culture immunofluorescence labeling section, with quantification of the number of LC3 puncta per cell done using ImageJ software. Tissue immunofluorescence labeling. Immunofluorescence was performed by serial incubation of cryostat tissue sections with anti-human mAbs of different isotypes for 2 hours (IL-26, clone 2A8, IgG2a, Sigma-Aldrich; CD4, clone A16A1, IgG2b, BioLegend; CD8, clone HIT8a, IgG1, BioLegend; CD68, clone KP1, IgG1, Abcam), and then washed 3 times with 1× PBS, followed by incubation with isotype-specific fluorochrome A488-, A568-, and A647-labeled goat anti–mouse Ig Abs (Molecular Probes, Invitrogen, Thermo Fisher Scientific) for 90 minutes. Negative controls were stained with matching isotype Abs. Nuclei were stained with DAPI (Invitrogen, Life Technologies, Thermo Fisher Scientific). Immunofluorescence of skin sections was examined using a Leica TCS-SP MP inverted single confocal laser-scanning microscope and a 2-photon laser microscope (Leica) at the Advanced Microscopy/Spectroscopy and Macro-Scale Imaging Laboratory (California NanoSystems Institute, UCLA). Colocalization quantifications were performed using ImageJ software. Immunofluorescence colocalization analysis. The colocalization threshold plugin by ImageJ was used for all colocalization analyses related to confocal images. Briefly, this plugin compares 2 images for correlated pixel intensities, and a positive correlation between 2 images indicates that the signal in 1 channel (green) is observed at the same time as the signal in the other channel (red). The plugin performs a converging search for the image thresholds and reports various metrics on the resulting thresholded images. We used the percentage volume metric. The colocalization colors are: red + green = yellow; red + cyan = magenta; and red + green + cyan = white. TUNEL assay. To evaluate cell death by apoptosis, we used a Roche In Situ Cell Death Detection Kit with fluorescein according to the manufacturer’s protocol. Briefly, human MDMs were differentiated on glass slides and treated with IL-26 or overnight. Cells were then washed, fixed, and labeled with TUNEL reaction mixture. Nuclei were stained with DAPI. Immunofluorescence was assessed using a Leica TCS-SP MP inverted single confocal laser-scanning microscope and a 2-photon laser microscope (Leica) at the Advanced Microscopy/Spectroscopy and Macro-Scale Imaging Laboratory (California NanoSystems Institute, UCLA). Immunoblot analysis. MDMs (2 × 10⁶ cells per condition) were collected in NP-40 lysis buffer (50 mM Tris, pH 7.4, 50 mM NaCl, 5 mM EDTA, 50 mM NaF, 1 mM Na3VO4, 1% NP-40, 0.02% NaN3, and 1 mM PMSF) containing complete protease inhibitors (Roche Applied Science). Total protein from cell lysates was quantified by the Bradford assay. Lysates were separated on a 7.5% nondenaturing gel, followed by immunoblot analysis with anti-HSP90 and anti-LC3, with detection by ECL (Pierce Biotechnology, Thermo Fisher Scientific). Statistics. The statistics reported here cover the entire series of experiments and are described as the mean ± SEM. GraphPad Prism 6 software was used for graphing and statistical analysis. For comparisons among 3 or more groups, we used repeated measures 1-way ANOVA with Greenhouse-Geisser correction, along with Tukey’s multiple comparisons test, with individual variances computed for each comparison. A 2-tailed Student’s t test was used for all other 2-group analyses. For the WT and STING–/– experiments, we used repeated-measures 2-way ANOVA, along with Tukey’s multiple comparisons test. For all experiments, a P value of less than 0.05 was considered statistically significant. Study approval. This study was conducted according to the principles expressed in the Declaration of Helsinki. All donors provided written informed consent for the collection of peripheral blood and skin specimens for subsequent scientific analysis. All patients were recruited with approval from the IRBs of the USC School of Medicine and UCLA and the Institutional Ethics Committee of the Oswaldo Cruz Foundation. Author contributions RLM, ATD, RMBT and DIW designed the experiments, interpreted the data, and drafted the manuscript. BRB assisted with the conceptual framework and writing. ATD performed most of the experiments. DIW, KP, and GC performed the autophagy immunoblotting experiments. RMBT performed microarray analysis and quantified confocal imaging. ENS and MTO provided the clinical samples. MG assisted with the conceptual framework and writing of the manuscript. Acknowledgments We would like to thank M. Schibler (California NanoSystems Institute at UCLA) and B. Andrade (Oswaldo Cruz Foundation), M. Fabri (University of Cologne), and S. Krutzik (David Geffen School of Medicine at UCLA) for their helpful discussions. The live M. leprae was provided by the US National Hansen’s Disease Programs through the support of the American Leprosy Missions and Society of St. Lazarus of Jerusalem. This work was supported in part by grants from the NIH (R01 AI022553, R01 AR040312, and P50 AR063020, to RLM) and the 2015 UCLA Dissertation Year Fellowship (to ATD). Footnotes Conflict of interest: The authors have declared that no conflict of interest exists. Copyright: © 2019, The American Society for Clinical Investigation. Reference information: J Clin Invest. https://doi.org/10.1172/JCI99550. References Knappe A, Hör S, Wittmann S, Fickenscher H. Induction of a novel cellular homolog of interleukin-10, AK155, by transformation of T lymphocytes with herpesvirus saimiri. J Virol. 2000;74(8):3881–3887. View this article via: PubMed CrossRef Google Scholar Kotenko SV. The family of IL-10-related cytokines and their receptors: related, but to what extent? Cytokine Growth Factor Rev. 2002;13(3):223–240. View this article via: PubMed CrossRef Google Scholar Stephen-Victor E, Fickenscher H, Bayry J. IL-26: an emerging proinflammatory member of the IL-10 cytokine family with multifaceted actions in antiviral, antimicrobial, and autoimmune responses. PLoS Pathog. 2016;12(6):e1005624. View this article via: PubMed CrossRef Google Scholar Dumoutier L, Van Roost E, Ameye G, Michaux L, Renauld JC. IL-TIF/IL-22: genomic organization and mapping of the human and mouse genes. Genes Immun. 2000;1(8):488–494. View this article via: PubMed CrossRef Google Scholar Donnelly RP, Sheikh F, Dickensheets H, Savan R, Young HA, Walter MR. Interleukin-26: an IL-10-related cytokine produced by Th17 cells. Cytokine Growth Factor Rev. 2010;21(5):393–401. View this article via: PubMed CrossRef Google Scholar Wang T, Díaz-Rosales P, Martin SA, Secombes CJ. Cloning of a novel interleukin (IL)-20-like gene in rainbow trout Oncorhynchus mykiss gives an insight into the evolution of the IL-10 family. Dev Comp Immunol. 2010;34(2):158–167. View this article via: PubMed CrossRef Google Scholar Wilson NJ, et al. Development, cytokine profile and function of human interleukin 17-producing helper T cells. Nat Immunol. 2007;8(9):950–957. View this article via: PubMed CrossRef Google Scholar Boniface K, et al. Human Th17 cells comprise heterogeneous subsets including IFN-gamma-producing cells with distinct properties from the Th1 lineage. J Immunol. 2010;185(1):679–687. View this article via: PubMed CrossRef Google Scholar Meller S, et al. T(H)17 cells promote microbial killing and innate immune sensing of DNA via interleukin 26. Nat Immunol. 2015;16(9):970–979. View this article via: PubMed CrossRef Google Scholar Hughes T, et al. Stage 3 immature human natural killer cells found in secondary lymphoid tissue constitutively and selectively express the TH 17 cytokine interleukin-22. Blood. 2009;113(17):4008–4010. View this article via: PubMed CrossRef Google Scholar Guerra-Laso JM, Raposo-García S, García-García S, Diez-Tascón C, Rivero-Lezcano OM. Microarray analysis of Mycobacterium tuberculosis-infected monocytes reveals IL26 as a new candidate gene for tuberculosis susceptibility. Immunology. 2015;144(2):291–301. View this article via: PubMed CrossRef Google Scholar Che KF, et al. Interleukin-26 in antibacterial host defense of human lungs. Effects on neutrophil mobilization. Am J Respir Crit Care Med. 2014;190(9):1022–1031. View this article via: PubMed CrossRef Google Scholar Zasloff M. Antimicrobial peptides of multicellular organisms. Nature. 2002;415(6870):389–395. View this article via: PubMed CrossRef Google Scholar Ganz T. Defensins: antimicrobial peptides of innate immunity. Nat Rev Immunol. 2003;3(9):710–720. View this article via: PubMed CrossRef Google Scholar Hör S, et al. The T-cell lymphokine interleukin-26 targets epithelial cells through the interleukin-20 receptor 1 and interleukin-10 receptor 2 chains. J Biol Chem. 2004;279(32):33343–33351. View this article via: PubMed CrossRef Google Scholar Sheikh F, et al. Cutting edge: IL-26 signals through a novel receptor complex composed of IL-20 receptor 1 and IL-10 receptor 2. J Immunol. 2004;172(4):2006–2010. View this article via: PubMed CrossRef Google Scholar Pène J, et al. Chronically inflamed human tissues are infiltrated by highly differentiated Th17 lymphocytes. J Immunol. 2008;180(11):7423–7430. View this article via: PubMed CrossRef Google Scholar Miot C, et al. IL-26 is overexpressed in chronically HCV-infected patients and enhances TRAIL-mediated cytotoxicity and interferon production by human NK cells. Gut. 2015;64(9):1466–1475. View this article via: PubMed CrossRef Google Scholar Corvaisier M, et al. IL-26 is overexpressed in rheumatoid arthritis and induces proinflammatory cytokine production and Th17 cell generation. PLoS Biol. 2012;10(9):e1001395. View this article via: PubMed CrossRef Google Scholar Dambacher J, et al. The role of the novel Th17 cytokine IL-26 in intestinal inflammation. Gut. 2009;58(9):1207–1217. View this article via: PubMed CrossRef Google Scholar Wilgus TA, Roy S, McDaniel JC. Neutrophils and wound repair: positive actions and negative reactions. Adv Wound Care (New Rochelle). 2013;2(7):379–388. View this article via: PubMed CrossRef Google Scholar Teles RM, et al. Type I interferon suppresses type II interferon-triggered human anti-mycobacterial responses. Science. 2013;339(6126):1448–1453. View this article via: PubMed CrossRef Google Scholar Tuominen VJ, Ruotoistenmäki S, Viitanen A, Jumppanen M, Isola J. ImmunoRatio: a publicly available web application for quantitative image analysis of estrogen receptor (ER), progesterone receptor (PR), and Ki-67. Breast Cancer Res. 2010;12(4):R56. View this article via: PubMed CrossRef Google Scholar Martinez AN, et al. Molecular determination of Mycobacterium leprae viability by use of real-time PCR. J Clin Microbiol. 2009;47(7):2124–2130. View this article via: PubMed CrossRef Google Scholar Liu PT, et al. MicroRNA-21 targets the vitamin D-dependent antimicrobial pathway in leprosy. Nat Med. 2012;18(2):267–273. View this article via: PubMed CrossRef Google Scholar Ridley DS. Pathology and bacteriology of early lesions in leprosy. Int J Lepr Other Mycobact Dis. 1971;39(2):216–224. View this article via: PubMed Google Scholar Ridley MJ. The mononuclear cell series in leprosy: an ultrastructural report. Lepr Rev. 1981;52(1):35–50. View this article via: PubMed Google Scholar Sibley LD, Franzblau SG, Krahenbuhl JL. Intracellular fate of Mycobacterium leprae in normal and activated mouse macrophages. Infect Immun. 1987;55(3):680–685. View this article via: PubMed Google Scholar Hagge DA, Ray NA, Krahenbuhl JL, Adams LB. An in vitro model for the lepromatous leprosy granuloma: fate of Mycobacterium leprae from target macrophages after interaction with normal and activated effector macrophages. J Immunol. 2004;172(12):7771–7779. View this article via: PubMed CrossRef Google Scholar Fabri M, et al. Vitamin D is required for IFN-gamma-mediated antimicrobial activity of human macrophages. Sci Transl Med. 2011;3(104):104ra102. View this article via: PubMed Google Scholar Poli C, et al. IL-26 confers proinflammatory properties to extracellular DNA. J Immunol. 2017;198(9):3650–3661. View this article via: PubMed CrossRef Google Scholar Schnaith A, Kashkar H, Leggio SA, Addicks K, Krönke M, Krut O. Staphylococcus aureus subvert autophagy for induction of caspase-independent host cell death. J Biol Chem. 2007;282(4):2695–2706. View this article via: PubMed CrossRef Google Scholar Tranchemontagne ZR, Camire RB, O’Donnell VJ, Baugh J, Burkholder KM. Staphylococcus aureus Strain USA300 perturbs acquisition of lysosomal enzymes and requires phagosomal acidification for survival inside macrophages. Infect Immun. 2016;84(1):241–253. View this article via: PubMed CrossRef Google Scholar Jubrail J, et al. Inability to sustain intraphagolysosomal killing of Staphylococcus aureus predisposes to bacterial persistence in macrophages. Cell Microbiol. 2016;18(1):80–96. View this article via: PubMed CrossRef Google Scholar Stenger S, Rosat JP, Bloom BR, Krensky AM, Modlin RL. Granulysin: a lethal weapon of cytolytic T cells. Immunol Today. 1999;20(9):390–394. View this article via: PubMed CrossRef Google Scholar Ochoa MT, et al. T-cell release of granulysin contributes to host defense in leprosy. Nat Med. 2001;7(2):174–179. View this article via: PubMed CrossRef Google Scholar Walch M, et al. Perforin enhances the granulysin-induced lysis of Listeria innocua in human dendritic cells. BMC Immunol. 2007;8:14. View this article via: PubMed Google Scholar Montoya D, et al. Divergence of macrophage phagocytic and antimicrobial programs in leprosy. Cell Host Microbe. 2009;6(4):343–353. View this article via: PubMed CrossRef Google Scholar Job CK, Jayakumar J, Aschhoff M. “Large numbers” of Mycobacterium leprae are discharged from the intact skin of lepromatous patients; a preliminary report. Int J Lepr Other Mycobact Dis. 1999;67(2):164–167. View this article via: PubMed Google Scholar Van Voorhis WC, et al. The cutaneous infiltrates of leprosy: cellular characteristics and the predominant T-cell phenotypes. N Engl J Med. 1982;307(26):1593–1597. View this article via: PubMed CrossRef Google Scholar Sieling PA, et al. Immunosuppressive roles for IL-10 and IL-4 in human infection. In vitro modulation of T ce

|
Scooped by
Gilbert C FAURE
October 23, 2018 3:49 PM
|
Scoop.it!

Generation of protective immune responses requires coordinated stimulation of innate and adaptive immune responses. An important mediator of innate immunity is stimulator of IFN genes (STING, MPYS, MITA), a ubiquitously but differentially expressed adaptor molecule that functions in the relay of...
|
|
Scooped by
Gilbert C FAURE
April 21, 2017 2:56 PM
|
Scoop.it!
ABSTRACT: IFN regulatory factor (IRF)3 plays a detrimental role in the cecal ligation and puncture (CLP) mouse model of sepsis. However, it is unclear which pathway activates IRF3 in this context. In this report, we investigate two pathways that activate IRF3: the Stimulator of Interferon Genes (STING) pathway (that senses cytosolic DNA) and the TIR-domain-containing adapter-inducing interferon-β (TRIF) pathway (that senses dsRNA and LPS via Toll-like receptor 3 and 4). Initially, we examine the impact of these pathways using a severe CLP model (∼90% mortality). Both STING-KO and TRIF-KO mice are protected from severe sepsis, exhibiting reduced mortality, disease score, hypothermia, and inflammatory cytokines relative to WT counterparts. STING/TRIF-DKO mice exhibit a similar phenotype to each of the single KO strains, suggesting that these pathways have an interrelated function. Subsequently, we examine the impact of these pathways using a moderate CLP model incorporating clinical treatments (Lactated Ringer Solution and antibiotics, ∼36% mortality). In this case, STING-KO mice show a similar phenotype to WT counterparts, while TRIF-KO mice show improved disease score and hypothermia. During sepsis, innate immune receptors recognize bacterial ligands and host-derived danger signals, including cell-free DNA released into the circulation. We show that IRF3 is activated in cultured macrophages treated with bacteria derived from the mouse cecum, dependent on TRIF, and in macrophages treated with mouse genomic DNA/Lipofectamine 2000, dependent on STING. Together, our data demonstrate that both the STING and TRIF pathways can promote sepsis pathogenesis; however, their contribution depends on the severity of the disease model. We show that bacteria are abundant in the peritoneum following both severe and moderate CLP, while cell-free DNA is more highly elevated in the serum following severe CLP compared with sham and moderate CLP. Hence, the presence of bacteria and cell-free DNA may explain the variable phenotypes in our severe CLP model (dependent on TRIF and STING) versus our moderate CLP model (dependent on TRIF only).
|
|
Scooped by
Gilbert C FAURE
February 3, 2016 12:28 PM
|
Scoop.it!
RT @Cancer_Cell: Munn @MCG_AUG & Mellor @StudentsNCL review IDO in the tumor microenvironment https://t.co/X4LZZSgicQ in Trends Immunol.
Indoleamine 2,3-dioxygenase (IDO) has immunoregulatory roles associated with tryptophan metabolism. These include counter-regulation (controlling inflammation) and acquired tolerance in T cells. Recent findings reveal that IDO can be triggered by innate responses during tumorigenesis, and also by attempted T cell activation, either spontaneous or due to immunotherapy. Here we review the current understanding of mechanisms by which IDO participates in the control of inflammation and in peripheral tolerance. Focusing on the tumor microenvironment, we examine the role of IDO in response to apoptotic cells and the impact of IDO on Treg cell function. We discuss how the counter-regulatory and tolerogenic functions of IDO can be targeted for cancer immunotherapy and present an overview of the current clinical progress in this area.
IDO can be induced in the tumor microenvironment by the spontaneous inflammation and T cell activation associated with many tumors; however, IDO may also be induced reactively, in response to inflammation induced by antitumor immunotherapy.
IDO is rapidly induced when mice are challenged with apoptotic cells. Inhibiting or genetically deleting IDO results in loss of self-tolerance to apoptotic cell-associated antigens, and susceptibility to lupus-like autoimmunity.
DNA-containing nanoparticles can induce immunosuppressive IDO via a pathway dependent on the STING sensor of cytosolic DNA.
When Treg cells are activated in the presence of IDO, they upregulate a highly suppressive phenotype driven by the PTEN lipid phosphatase. In vivo, challenge with apoptotic cells triggers IDO-mediated induction of PTEN-expressing Treg cells.
In tumors, IDO induction by apoptotic cells may become relevant as the tumor attempts to inhibit immune responses to dying tumor cells following chemotherapy or immunotherapy.
|
|
Scooped by
Gilbert C FAURE
June 15, 2015 2:17 PM
|
Scoop.it!
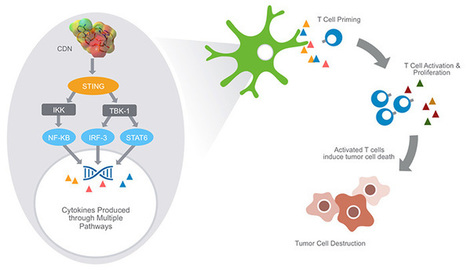
RT @mtmdphd: Aduro – STING (Stimulator of Interferon Genes) Pathway in Cancer Immunology http://t.co/G4R5TuXXhH #ImmunoOnc
The rationale behind the collaboration is to combine STING pathway agonists to fully activate the immune system so that when combined with checkpoint inhibitors (e.g., anti-PD1 – Opdivo and Keytruda; anti-PDL1; LAG3; and TIM3) an enhanced response will be seen. Many cancers are resistant to therapy with checkpoint inhibitors, which cancel anti-cancer immune suppressive responses, because there is an insufficient initial anti-cancer response. STING agonists have the potential to augment, initiate, or awaken the initial anti-cancer response.
Aduro has developed cyclic dinucleotides that precipitate robust STING pathway triggering. Cyclic dinucleotides (CDNs) are small molecules – naturally expressed by bacteria and immune cells – that are known to activate the STING (Stimulator of Interferon Genes) signaling pathway in immune cells. STING is known to be a central mediator of innate immune response and, when stimulated, induces the expression of various interferons, cytokines and T cell recruitment factors that amplify and strengthen immune activity.
|
|
Scooped by
Gilbert C FAURE
February 16, 2015 1:34 PM
|
Scoop.it!

New studies by HHMI scientists show how cells use sophisticated signaling mechanisms to control production of interferon.
Chen explains that each of the three type I interferon-triggering pathways recognizes a particular signal of infection. Invading viruses and bacteria often deliver and replicate their genetic material in the main compartment of the cell known as the cytoplasm, where host DNA is not normally found. A sensor protein called RIG-I detects viral RNA in this cytosolic compartment, which usually indicates the presence of an RNA virus. Cytosolic DNA, which can be introduced by a variety of microbes, including bacteria, DNA viruses, and retroviruses, is detected by a sensor called cGAS, which Chen's lab discovered in 2012. Nucleic acids in membrane-bound compartments called endosomes also indicate viral infection, and are detected by sensors called Toll-like receptors.
Each of these three receptors cooperates with its own adaptor protein to relay its message that an invader is present and interferon is needed. Toll-like receptors work with an adaptor called TRIF, the cGAS receptor works with the adaptor protein STING, and the RIG-I receptor pairs with an adaptor that Chen's lab discovered in 2005 called MAVS.
|
|
Rescooped by
Gilbert C FAURE
from Cancer Immunotherapy Review and Collection
November 23, 2014 2:24 PM
|
Scoop.it!
Highlights•Spontaneous T cell responses against tumors require the host STING pathway in vivo•Tumor-derived DNA can induce type I interferon production via STING•Tumor DNA can be identified in host APCs in the tumor microenvironment in vivo
Summary
Spontaneous T cell responses against tumors occur frequently and have prognostic value in patients. The mechanism of innate immune sensing of immunogenic tumors leading to adaptive T cell responses remains undefined, although type I interferons (IFNs) are implicated in this process. We found that spontaneous CD8+T cell priming against tumors was defective in mice lacking stimulator of interferon genes complex (STING), but not other innate signaling pathways, suggesting involvement of a cytosolic DNA sensing pathway. In vitro, IFN-β production and dendritic cell activation were triggered by tumor-cell-derived DNA, via cyclic-GMP-AMP synthase (cGAS), STING, and interferon regulatory factor 3 (IRF3). In the tumor microenvironment in vivo, tumor cell DNA was detected within host antigen-presenting cells, which correlated with STING pathway activation and IFN-β production. Our results demonstrate that a major mechanism for innate immune sensing of cancer occurs via the host STING pathway, with major implications for cancer immunotherapy.
|
|
Scooped by
Gilbert C FAURE
August 19, 3:12 AM
|
Scoop.it!

One of the biggest threats to human wellbeing are viral infections and the resistance these viruses are able to develop against the human immune system.
It is not for luck that humans among other mammals have been able to survive millions of years always becoming more adaptable and developing new means of resistance towards parasites.
Scietists have found that much of our genetic material necessary for our immune system and the development of efficient resistance against viruses comes from ancient bacterial DNA. These shared forms of immunity include: cGAS–STING, inflammasomes, argonautes and viperin.
With viruses always mutating and developing new strands, one of the main healthcare emergencies is to develop new treatments against viral infections.
But how can you know your degree of immunity? To identify how your genetics may influence immune function, find vulnerabilities, and help you take action against pathogens, subscribe to ENAble —the startup working to create the branch between genetics and personalized health plans.
#Immunity #EnableDNA #GENETICS
#PersonalizedHealthPlan
https://lnkd.in/emyAf95s
|
|
Scooped by
Gilbert C FAURE
August 24, 2022 2:53 AM
|
Scoop.it!
Kessler et al. identify aberrant DNA recognition by cGAS/STING and IFN-I production by inflammatory macrophages as a driver of severe ANCA-associated vasculitis
|
|
Scooped by
Gilbert C FAURE
February 23, 2022 11:19 AM
|
Scoop.it!
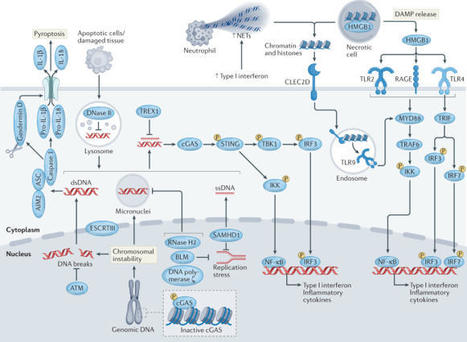
A cell is delimited by numerous borders that define specific organelles. The walls of some organelles are particularly robust, such as in mitochondria or endoplasmic reticulum, but some are more fluid such as in phase-separated stress granules. Either way, all organelles can be damaged at times, leading their contents to leak out into the surrounding environment. Therefore, an elegant way to construct an innate immune defence system is to recognize host molecules that do not normally reside within a particular compartment. Here, we provide several examples where organellar homeostasis is lost, leading to the activation of a specific innate immune sensor; these include NLRP3 activation owing to a disrupted trans-Golgi network, Pyrin activation due to cytoskeletal damage, and cGAS–STING activation following the leakage of nuclear or mitochondrial DNA. Frequently, organelle damage is observed downstream of pathogenic infection but it can also occur in sterile settings as associated with auto-inflammatory disease. Therefore, understanding organellar homeostasis is central to efforts that will identify new innate immune pathways, and therapeutics that balance organellar homeostasis, or target the breakdown pathways that trigger innate immune sensors, could be useful treatments for infection and chronic inflammatory diseases. This Review from Masters and colleagues highlights how damage to intracellular organelles is linked to activation of the innate immune system. The authors propose that a better appreciation of such organellar homeostasis could lead to the identification of novel innate immune pathways and have therapeutic implications.
|
|
Rescooped by
Gilbert C FAURE
from Cancer Immunotherapy Review and Collection
February 25, 2020 9:42 AM
|
Scoop.it!
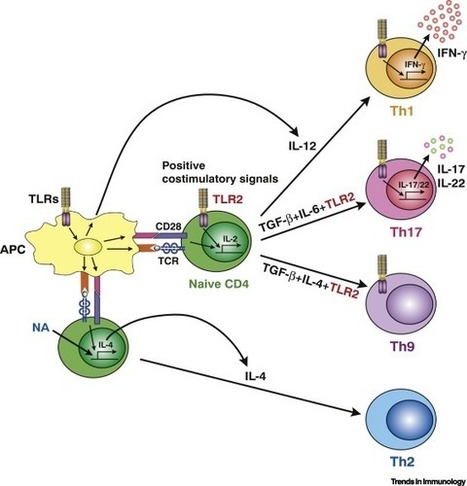
Pattern recognition receptors (PRRs), such as Toll-like receptors (TLRs), NOD-like
receptors (NLRs), and RIG-I-like receptors (RLRs), play a pivotal role in the initiation
of innate immune responses. Certain PRRs are also expressed by CD4+ and CD8+ T cells,
where they function to provide co-stimulatory signals for their activation and differentiation.
Recently, stimulator of interferon genes (STING) was found to be highly expressed
in CD4+ and CD8+ T cells and to modulate T cell function. STING signaling inhibits
cell growth and stimulates type I interferon (IFN-I) responses in T cells through
reciprocal regulation between T cell receptor (TCR) and STING signals.
|
|
Suggested by
Société Francaise d'Immunologie
January 7, 2019 1:31 PM
|
Scoop.it!

Immune evasion strategies employed by intracellular pathogens Pathogens and their hosts co‐evolve, and there are clear signs of selective pressure on host factors such as DNA and RNA sensors on the one hand and pathogen‐encoded immune evasion proteins on the other.65-67 Immunomodulatory proteins and virulence factors are finely tuned to adapt to the host range and life cycle of the pathogen. The precise interplay between host and pathogen factors is often unique, and can differ in different host organisms, cell types and among even closely related pathogens. However, mapping these host–pathogen interactions at a molecular level can provide clues about the importance of host signalling cascades, can help us to understand changes in species specificity and virulence of emerging pathogens, and aid in the design of vaccine vectors. As PRR signalling pathways are being characterized in more molecular detail, the intricate counterstrategies employed by pathogens to evade recognition are also becoming apparent. Some general principles by which intracellular pathogens hide from detection or intercept the cell's signalling cascades are described below. Sequestration of PAMPs Pathogens that reside inside host cells are already sheltered from the immune system to some extent, by avoiding exposure to antibodies or complement components. However, due to the existence of intracellular PRRs, additional camouflage strategies are essential for the establishment of infection. Intracellular bacteria and protozoan parasites often co‐opt vacuoles as a niche for replication, which prevents pathogen‐derived nucleic acids and other PAMPs from being exposed to the cell's PRRs. Hence, detection of intracellular nucleic acids during bacterial infection often requires the presence of bacterial secretion systems. For instance, the type VII secretion system ESX from Mycobacterium tuberculosis is responsible for the exposure of bacterial DNA to cGAS in macrophages, but also secretes virulence factors that interfere with host functions.56, 68 Viruses require greater access to host factors for replication than bacteria, but also try to shield their nucleic acids from detection. Some RNA viruses, including Dengue virus and hepatitis C virus, sequester their genome and replication machinery in membrane‐bound compartments, which function to create locally high concentrations of replication factors, as well as hiding viral RNA genomes from recognition by RIG‐I.69, 70 Human immunodeficiency virus type 1 carries out reverse transcription and replication of its genome inside its capsid, which contains selective pores to allow entry for nucleotides from the host cell, while shielding viral DNA from recognition by cGAS.71 Modification of viral RNA and DNA Many pathogens aim to keep PAMP levels at a minimum: coronaviruses for instance quickly degrade any excessive dsRNA formed during the viral life cycle,72 and Group B streptococcus degrades cyclic di‐AMP using an ectonuclease.73 However, the production of nucleic acid PAMPs cannot be avoided altogether; thus, more sophisticated strategies of camouflage have evolved, so that the pathogen can blend into the cellular environment. As viral RNA polymerases generate RNA species with a 5′ triphosphate moiety, many viruses employ additional strategies to modify their RNA, so that it is not recognized efficiently by RIG‐I. For instance, Picornaviridae, Caliciviridae and Astroviridae covalently attach a protein, Vpg, to the 5′ end of viral RNAs, which prevents RIG‐I‐mediated recognition.15 Processing of the negative‐strand ssRNA genome of members of the Bornaviridae and Bunyaviridae families involves the cleavage of the first nucleotide by a viral endonuclease to generate a monophosphate group at the 5′ end.74 Viruses that transcribe their mRNAs in the nucleus, including the DNA viruses of the Herpesviridae and Papillomaviridae families and retroviruses such as human immunodeficiency virus, co‐opt the cell's own capping machinery to protect the 5′ end of their mRNAs with a 7‐methylguanosine cap, while others, including IAV, use ‘cap snatching’ to remove the capped 5′ ends from cellular mRNAs and incorporate them into viral RNA transcripts.75 Many viruses, including poxviruses and flaviviruses, encode their own capping enzymes that synthesize RNA caps that are indistinguishable from the mammalian cap structure.75 Yellow fever virus in addition recapitulates the 2′ O‐methylation of the first RNA nucleotide next to the cap, which is found in cellular mRNAs and further decreases recognition by RIG‐I.76 Bacteria and protozoa also cap their mRNAs, but not always with 100% efficiency. RNA derived from intracellular bacteria can activate the RNA sensing pathway if it reaches the cytosol, but it remains to be determined whether this is important during infection.77 So far, it is not known whether DNA modifications could prevent recognition by cGAS or other DNA sensors. It has been proposed that IFI16 may be able to distinguish viral DNA from the cell's own genome by recognizing longer (>40 nucleotides) stretches of free DNA,43, 44 and the detection of DNA by cGAS has also been shown to be length‐dependent.78 It remains to be tested whether the assembly of nucleosomes on the genomes of DNA viruses such as herpesviruses and papillomaviruses could be a strategy to limit their detection by intracellular DNA sensors. Degradation and inhibition of host signalling factors All intracellular pathogens encode virulence factors that interfere with the host's signalling cascades. Viral immunomodulatory proteins are usually expressed as immediate early genes, or are even part of the viral particle, so that they are able to inhibit the host's signalling cascades as soon as PAMPs are detected early in infection. Intracellular bacteria employ secretion systems to transport effector proteins through the vacuolar and bacterial membranes into the host cell, whereas protozoans can secrete virulence factors via exosomes or other membrane‐bound vesicles. A vast repertoire of virulence factors that influence the cell's innate immune signalling cascades have been described, particularly in viruses, which often dedicate a large portion of their genome to interfering with the host's innate immune response. Although many viruses encode only a few proteins, these are often multi‐functional and target several key host factors. Large DNA viruses, such as poxviruses and herpesviruses, encode a larger repertoire of dozens of immunomodulatory proteins that interfere with anti‐viral signalling cascades in the cell at multiple points.79, 80 Bacteria and protozoa encode thousands of genes, and so have an even greater capacity to interfere with host functions, but comparatively few immune evasion proteins have been described so far, with many pathogen‐encoded effector proteins still uncharacterized.3, 4, 64 Many pathogens have evolved similar strategies to inhibit the innate immune signalling cascades in the host cell: virulence factors act to either eliminate host signalling factors by degradation, sequester them or block their function in the signalling cascade. As we learn more about the regulation of innate immune signalling cascades that detect pathogens, more examples of counterstrategies employed by pathogens also emerge. Degradation and inhibition of RNA sensors Since the discovery of the intracellular RNA sensing system, many immune evasion proteins that target RLRs or MAVS have been identified (see Fig. 1), mostly in viruses with an RNA genome, for which RIG‐I and/or MDA5 are the key PRRs during infection. Some viral proteases cleave RNA sensors, with several picornaviruses using their 3C protease to cleave RIG‐I, and the 2A protease to cleave MDA5.81-83 The leader protease Lpro from foot‐and‐mouth‐disease virus also cleaves Lpg2, a co‐factor for MDA5 activation.84 Some viruses modify RLRs with K48‐linked poly‐ubiquitin chains, diverting the RNA sensors for degradation by the cell's proteasome. Toscana virus non‐structural proteins and the rotavirus NSP1 protein cause the degradation of RIG‐I,85, 86 whereas West Nile virus NS1 targets both RIG‐I and MDA5.87 RIG‐I mRNA expression and translation can also be inhibited during viral infection: for instance, EBV expresses the virus‐encoded microRNA miR‐BART6‐3p, which targets RIG‐I mRNA,88 and hepatitis B virus induces the cellular microRNA miR146a, which inhibits RIG‐I expression.89 Even under conditions where the expression of RIG‐I and MDA5 is intact, the RNA sensors can be prevented from carrying out their signalling function by viral proteins that bind to them. The HSV‐1 protein UL37 interacts with RIG‐I and causes the de‐amidation of its helicase domain, which renders RIG‐I unable to sense RNA ligands.90 Another HSV‐1 protein, US11 inhibits RNA sensing by associating with the dsRNA binding protein PACT, which potentiates RNA‐induced responses.91, 92 PACT is also targeted by Influenza A virus NS1, the VP35 protein from Ebola virus and the 4a protein from Middle East respiratory syndrome coronavirus.93-95 Many of the PACT‐interacting proteins also bind dsRNA, so they probably shield the viral RNA from detection while at the same time inactivating PACT and RNA sensors. The activity of RIG‐I and MDA5 is tightly regulated in the cell: In the absence of infection, the CARD of the RNA sensors are kept in a phosphorylated state, and activation involves their dephosphorylation catalysed by protein phosphatase 1.96 RIG‐I activity is further enhanced by the assembly of K63‐linked poly‐ubiquitin chains catalysed by the E3 ubiquitin ligases tripartite motif containing 25 (TRIM25) and Riplet, which release RIG‐I from its autoinhibited state.97, 98 Given the importance of these post‐translational modifications, it is not surprising that many viruses have evolved ways of inhibiting these regulatory mechanisms. For instance, measles virus uses an elaborate signalling strategy involving the activation of the C‐type lectin DC‐SIGN to inhibit protein phosphatase 1, thus keeping the RLRs phosphorylated and inactive.99 The E3 ubiquitin ligase Riplet is inhibited by the multifunctional IAV NS1 protein100 and is cleaved by the NS3/4A protease from hepatitis C virus.101 Multiple viruses also inhibit TRIM25, including again IAV NS1, the SARS coronavirus N protein, the V protein from various paramyxoviruses, the large tegument protein BPLF1 from EBV and the E6 protein from human papillomavirus 16.102-107 The subgenomic flavivirus RNA from Dengue virus can also bind and inactivate TRIM25 in an RNA sequence‐specific manner.108 RIG‐I ubiquitylation by TRIM25 is also inhibited by the bacterial quorum sensing molecule cyclo(Phe‐Pro) from the opportunistic pathogen Vibrio vulnificus. Cyclo(Phe‐Pro) specifically binds to RIG‐I and prevents it from being ubiquitylated by TRIM25,109 possibly providing a link between bacterial infection and susceptibility to co‐infection with viruses. A multitude of viral immunomodulators prevent RIG‐I and MDA5 from interacting with its adaptor protein MAVS, so blocking the nucleation event that allows MAVS to form higher‐order signalling assemblies. Dengue virus NS3 binds 14‐3‐3ε to prevent the translocation of RIG‐I to MAVS.110 The interaction between RLRs and MAVS is also disrupted by the picornavirus 3Cpro proteases, the Z and N proteins of some arenaviruses, NS2 from respiratory syncytial virus, NS1 from IAV, NSP1 from rotavirus and US11 from HSV‐1.16, 86, 111-114 MAVS is also targeted directly by many viruses. MAVS‐interacting proteins include the metapneumovirus protein M2‐2,115 the NS4A proteins of Zika and Dengue viruses,116, 117 viral IRF1 from human herpesvirus 8118 and ORF9b from SARS coronavirus.119 MAVS is also diverted for proteasome‐mediated degradation by the hepatitis B virus X protein,120 and is cleaved by the hepatitis C virus protease NS3/4A, which releases it from the mitochondria and other intracellular membranes to disrupt signalling.121-124 The US9 protein from HSV‐1 causes MAVS to leak from the mitochondria by disrupting the mitochondrial membrane potential,125 and the IAV protein PB1‐F2 decreases mitochondrial membrane potential causing mitochondrial fragmentation.126, 127 Disrupting mitochondrial physiology is a common mechanism to block MAVS signalling. Infection with Dengue and Zika viruses causes mitochondrial elongation, which also blocks MAVS function.128 The sustained interferon production caused by MAVS signalling from the peroxisomes is inhibited by the MIA protein from human cytomegalovirus (hCMV) and the VP16 protein from HSV‐1.118, 129, 130 Although there are abundant examples of inhibition of RNA sensing by pathogens, and in particular viruses, there is one instance where a pathogen actually enhances signalling by RIG‐I and MDA5. The food‐borne pathogen Salmonella typhimurium uses its effector protein SopA, an E3 ubiquitin ligase, to ubiquitylate the host proteins TRIM56 and TRIM65, which in turn promote RIG‐I and MDA5 signalling.131, 132 This is an example of subversion, rather than evasion, of the interferon response, in line with the observation that the production of type I interferons can be advantageous to the pathogen, rather than the host, during some bacterial infections.64 Degradation and inhibition of DNA sensors Even though the cGAS/STING DNA sensing pathway was only discovered relatively recently, several viral and bacterial virulence factors that target this pathway have already been discovered, see Fig. 2. The nuclear DNA viruses hCMV, HSV‐1 and Kaposi's sarcoma‐associated herpesvirus all target several key DNA sensing factors to prevent the detection of their genomic DNA. HSV‐1 uses its ICP27 protein to inhibit STING.133 In addition, the E3 ubiquitin ligase ICP0 causes the degradation of IFI16 protein, and the virion host shutoff protein UL41 promotes the turnover of the mRNAs encoding IFI16 and cGAS.42, 134, 135 In addition, the HSV‐1 virion protein VP22 interacts with cGAS and inhibits its enzymatic activity136 and also interacts with AIM2 and blocks its oligomerization.137 HSV‐1 tegument protein UL37, which targets and deamidates RIG‐I, also deamidates cGAS, impairing cGAMP synthesis.138 The deployment of different virulence factors to target several components of the DNA sensing pathway may be necessary to block the pathway more efficiently, and/or to inhibit some non‐overlapping functions of cGAS and IFI16 which have been observed during herpesvirus infection.139 Analogously, several different hCMV proteins inhibit DNA sensing: pUL31 binds to cGAS and dissociates it from DNA,140 pUL83 inhibits both cGAS and IFI16,141-143 pUL82 inhibits STING translocation,144 IE2 causes STING degradation,145 and US9 inactivates both MAVS and STING.125 Furthermore, pUL83 binds AIM2 and facilitates the degradation of AIM2‐driven inflammasomes.146 A similar multi‐pronged approach has also been observed for the gammaherpesvirus Kaposi's sarcoma‐associated herpesvirus.147-150 STING is also inhibited by oncoproteins from the nuclear DNA viruses human adenovirus and human papillomavirus,151 and by vaccinia virus, a DNA virus that resides in the cytosol.152 Vaccinia virus also inhibits DNA‐PK, using its virulence factor C16 to bind the Ku70/Ku80 subunits of the DNA‐PK complex.153 The viral inhibitor of RIP activation (vIRA) from mouse CMV targets another proposed DNA sensor, DAI, to prevent the induction of programmed necrosis upon viral infection.154 Surprisingly, not only DNA viruses but also some RNA viruses have been found to antagonise STING – even though they do not produce DNA or cyclic dinucleotides during their replication cycle. It has been reported that STING can function in a cGAS‐independent manner during the detection of viral membrane fusion, for instance during infection with IAV.155 This non‐canonical STING signalling pathway is antagonized by the IAV fusion peptide.156 Flaviviruses, enveloped viruses with a positive‐stranded ssRNA genome, also inhibit STING‐dependent DNA sensing. Viral NS2B proteases encoded by Dengue virus, Zika virus, West Nile virus and Japanese encephalitis virus cleave human STING protein, but not its mouse orthologue.157, 158 The dengue virus NS2B co‐factor also targets cGAS for degradation.55 This prevents the activation of an innate immune response after the release of mitochondrial DNA, which occurs during Dengue virus infection,55, 159 highlighting the breadth of pathogen classes that can be detected directly or indirectly by the DNA sensing pathway (Fig. 2). While the production of type I interferons is not always an effective strategy to limit bacterial infections, the activation of STING by bacterial DNA or cyclic dinucleotides can also promote autophagy to clear bacteria from the infected cells. For this reason, some intracellular bacteria also inhibit STING.62 For instance, the Shigella effector protein IpaJ inhibits STING translocation from the endoplasmic reticulum to endoplasmic reticulum–Golgi intermediate compartment,38 and the Yersinia YopJ protein also blocks STING trafficking and causes its de‐ubiquitylation.160 Mycobacterium tuberculosis secretes the cyclic di‐nucleotide phosphodiesterase CdnP (also known as Rv2837c), which degrades cGAMP and bacterial cyclic dinucleotides, thus inhibiting both DNA‐ and cyclic‐dinucleotide‐induced STING activation.161 Group A streptococcus, Streptococcus pyogenes, subverts, rather than evades, STING signalling: it uses its M protein to activate STING, resulting in the production of the anti‐inflammatory cytokine interleukin‐10 downstream of type I interferon signalling.162 In this way, the bacterium exploits the reciprocal antagonism between the interferon response and inflammation, and shapes the immune response to favour the pathogen, rather than the host.
|
|
Scooped by
Gilbert C FAURE
August 29, 2018 3:44 PM
|
Scoop.it!

Acute and chronic mitochondrial stress in mice require PINK1 and parkin to restrain STING-mediated innate immunity.
|
|
Scooped by
Gilbert C FAURE
April 10, 2016 3:35 AM
|
Scoop.it!
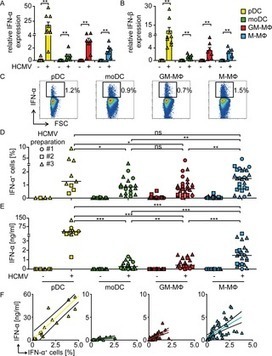
|
|
Scooped by
Gilbert C FAURE
November 27, 2015 9:20 AM
|
Scoop.it!
The rapid detection of microbial agents is essential for the effective initiation of host defence mechanisms against infection. Understanding how cells detect cytosolic DNA to trigger innate immune gene transcription has important implications — not only for comprehending the immune response to pathogens but also for elucidating the causes of autoinflammatory disease involving the sensing of self-DNA and the generation of effective antitumour adaptive immunity. The discovery of the STING (stimulator of interferon genes)-controlled innate immune pathway, which mediates cytosolic DNA-induced signalling events, has recently provided important insights into these processes, opening the way for the development of novel immunization regimes, as well as therapies to treat autoinflammatory disease and cancer.
|
|
Scooped by
Gilbert C FAURE
February 21, 2015 1:36 PM
|
Scoop.it!
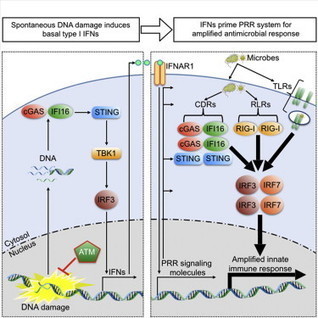
DNA Damage Primes the Type I IFN System via the Cytosolic DNA Sensor STING to Promote Anti-Microbial Innate Immunity http://t.co/ruJhUfjitC
•The DNA repair kinase ATM restrains spontaneous type I IFNs in humans and mice•ATM defects prime the type I IFN system for robust anti-microbial host responses•DNA damage primes the type I IFN system for robust anti-microbial responses via STING•DNA accumulates in cytoplasm upon DNA damage, thereby activating the STING pathway
|
|
Scooped by
Gilbert C FAURE
December 28, 2014 1:03 PM
|
Scoop.it!
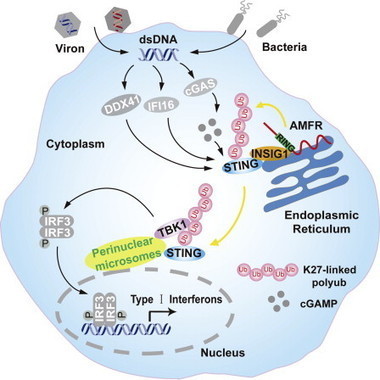
Wang lab show how activated STING recruits TBK1 for innate immune signaling http://t.co/KVGlu0RXuc
STING in focus
•STING signaling is drastically abolished in Amfr−/− cells•AMFR catalyzes K27-linked polyubiquitination of STING, which depends on INSIG1•The K27-linked polyubiquitin on STING facilitates TBK1 recruitment and activation•Myeloid-cell-specific Insig1−/− mice are more susceptible to HSV-1 infection