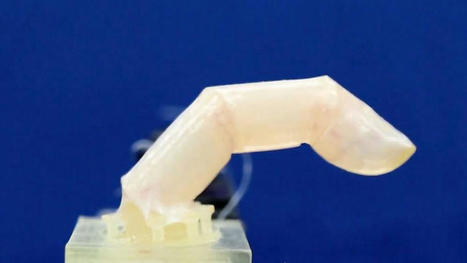
The skin is water-resistant, has self-healing properties, and can move and stretch with the movement of the robotic body parts.
Scientists may have moved us one step closer to creating truly life-like robots, after successfully covering a robotic finger with living skin that can heal when damaged. In a process that sounds like something out of a sci-fi movie, the robotic parts are submerged in a vat of jelly, and come out with living skin tissue covering them. The skin allows for the finger to move and bend like a human finger, and cuts can even be healed by applying a sheet of gel.
It also provides a realism that current silicone skin made for robots cannot achieve, such as subtle textures like wrinkles, and skin-specific functions like moisture retention. The scientists behind the work say it is “the first step of the proof of concept that something could be covered by skin”, although it may still be some time before an entire humanoid is successfully covered.
Previous attempts at covering robots with living skin sheets have only had limited success due to the difficulty of fitting them to dynamic objects with uneven surfaces. The team at the University of Tokyo in Japan may have solved this problem, using a novel method to cover the robotic finger with skin. The finger is submerged in a cylinder filled with the jelly - a solution of collagen and human dermal fibroblasts, the two main components that make up the skin’s connective tissues.
"When Russian forces started their all-out invasion in February, Ukraine has been hailed as an exemplar of how to defend against violent tyranny on the 21st-century battlefield. The country spun up an “IT Army” of volunteer hackers to take down Russian websites, used the Starlink satellite internet system to maintain communications as its own infrastructure was being destroyed, and launched a social media blitzkrieg to win support from around the world.
Browse 1075 short code snippets for all your development needs on 30 seconds of code.
30 seconds of code provides a wide variety of snippet and article collections for all your development needs. Explore individual language collections or browse through collections about specific topics and programming concepts.
Strona www.30secondsofcode.org to platforma, która dostarcza krótkich, użytecznych fragmentów kodu w różnych językach programowania. Głównym celem strony jest udostępnianie prostych i zwięzłych rozwiązań dla często spotykanych problemów programistycznych. Każdy fragment kodu jest krótki, zazwyczaj zajmujący około 30 sekund na przeczytanie, co sprawia, że strona jest łatwa w przeglądaniu. Możliwe jest przeszukiwanie kodu według kategorii, języka programowania lub tematu, co ułatwia znalezienie odpowiednich rozwiązań dla konkretnych wyzwań.
A new database and searchable tool reveals more than 90,000 known materials with electronic properties that remain unperturbed in the face of disruption.
Topology stems from a branch of mathematics that studies shapes that can be manipulated or deformed without losing certain core properties. A donut is a common example: If it were made of rubber, a donut could be twisted and squeezed into a completely new shape, such as a coffee mug, while retaining a key trait — namely, its center hole, which takes the form of the cup’s handle. The hole, in this case, is a topological trait, robust against certain deformations.
In recent years, scientists have applied concepts of topology to the discovery of materials with similarly robust electronic properties. In 2007, researchers predicted the first electronic topological insulators — materials in which electrons that behave in ways that are “topologically protected,” or persistent in the face of certain disruptions.
Since then, scientists have searched for more topological materials with the aim of building better, more robust electronic devices. Until recently, only a handful of such materials were identified, and were therefore assumed to be a rarity. Now researchers at MIT and elsewhere have discovered that, in fact, topological materials are everywhere, if you know how to look for them.
In a paper published today in Science, the team, led by Nicolas Regnault of Princeton University and the École Normale Supérieure Paris, reports harnessing the power of multiple supercomputers to map the electronic structure of more than 96,000 natural and synthetic crystalline materials. They applied sophisticated filters to determine whether and what kind of topological traits exist in each structure.
Overall, they found that 90 percent of all known crystalline structures contain at least one topological property, and more than 50 percent of all naturally occurring materials exhibit some sort of topological behavior. “We found there’s a ubiquity — topology is everywhere,” says Benjamin Wieder, the study’s co-lead, and a postdoc in MIT’s Department of Physics.
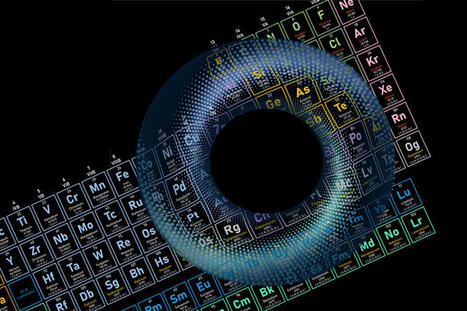
The team has compiled the newly identified materials into a new, freely accessible Topological Materials Database resembling a periodic table of topology. With this new library, scientists can quickly search materials of interest for any topological properties they might hold, and harness them to build ultra-low-power transistors, new magnetic memory storage, and other devices with robust electronic properties.
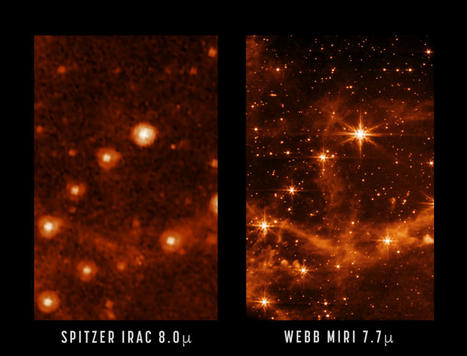
NASA’s James Webb Space Telescope is aligned across all four of its science instruments, as seen in a previous engineering image showing the observatory’s full field of view. Now, we take a closer look at that same image, focusing on Webb’s coldest instrument: the Mid-Infrared Instrument, or MIRI. The MIRI test image (at 7.7 microns) shows part of the Large Magellanic Cloud. This small satellite galaxy of the Milky Way provided a dense star field to test Webb’s performance.
Here, a close-up of the MIRI image is compared to a past image of the same target taken with NASA’s Spitzer Space Telescope’s Infrared Array Camera (at 8.0 microns). The retired Spitzer telescope was one of NASA’s Great Observatories and the first to provide high-resolution images of the near- and mid-infrared universe. Webb, with its significantly larger primary mirror and improved detectors, will allow us to see the infrared sky with improved clarity, enabling even more discoveries.
For example, Webb’s MIRI image shows the interstellar gas in unprecedented detail. Here, you can see the emission from “polycyclic aromatic hydrocarbons,” or molecules of carbon and hydrogen that play an important role in the thermal balance and chemistry of interstellar gas. When Webb is ready to begin science observations, studies such as these with MIRI will help give astronomers new insights into the birth of stars and proto-planetary systems.
In the meantime, the Webb team has begun the process of setting up and testing Webb’s instruments to begin science observations this summer. Today at 11 a.m., Webb experts will preview these next two months of instrument preparations in a teleconference for media. Listen to the audio stream live at nasa.gov/live.
Visualizing your data can be the key to success in projects because it can reveal hidden insights in the data, and improve understanding. The best way to convince people is by letting them see and interact with their data. Despite many visualization packages being available in Python, it is not always straightforward to make beautiful stand-alone and interactive charts that can also work outside your own machine. The key advantage of D3 is that it works with web standards so you don’t need any other technology than a browser to make use of D3. Importantly, interactive charts can help to not just tell the reader something but let the reader see, engage, and ask questions.
This blog outlines how you can build your own stand-alone, interactive force-directed D3 network using Python.Note that the steps are similar to any other D3 chart.If you need a readily working version, the d3graph library is for you!
Sumbangan Pemikiran: Visualisasi Data Interaktif dengan D3.js dan Python Beberapa pemikiran terkait visualisasi data menggunakan D3.js dalam Python, khususnya pada grafik interaktif: Pengalaman Pengguna yang Lebih Baik melalui Interaktivitas: Grafik interaktif tidak hanya menyajikan data, tetapi juga memungkinkan pengguna untuk berinteraksi langsung, seperti memanipulasi node atau memfokuskan pada bagian tertentu dari grafik. Ini membuat pemahaman data lebih mendalam karena pengguna dapat mengeksplorasi pola atau koneksi yang relevan sesuai kebutuhan. Kemudahan Akses dan Penggunaan Web Standar: D3.js, yang berbasis pada standar web, memastikan bahwa visualisasi dapat diakses dari berbagai perangkat hanya dengan menggunakan browser. Hal ini meningkatkan fleksibilitas dan jangkauan penyebaran visualisasi, menjadikannya ideal untuk presentasi atau dashboard publik. Dukungan untuk Visualisasi Jaringan Kompleks: Grafik force-directed sangat cocok untuk visualisasi hubungan dalam data kompleks, seperti jaringan sosial atau data hubungan antar entitas. Grafik ini memungkinkan pemahaman yang lebih baik terhadap struktur jaringan dengan cara yang intuitif dan interaktif. Potensi Integrasi dalam Aplikasi Python: Dengan pustaka d3graph di Python, pengembang dapat mengintegrasikan visualisasi D3 langsung dalam alur kerja Python, yang memudahkan proses analisis dan penyajian data dalam satu platform. Ini sangat berguna bagi ilmuwan data yang bekerja di lingkungan Python dan ingin menghasilkan visualisasi yang menarik tanpa perlu beralih ke platform lain. Penggunaan D3.js untuk visualisasi interaktif membuka banyak peluang untuk menghadirkan data yang kompleks dengan cara yang menarik dan mudah diakses. Hal ini memudahkan pemahaman data, memperluas audiens, serta meningkatkan dampak dari hasil analisis data.
A new study shows that it is possible to use the genetic sequences of a person's antibodies to predict what pathogens those antibodies will target. Reported in the journal Immunity, the new approach successfully differentiates between antibodies against influenza and those attacking SARS-CoV-2, the virus that causes COVID-19.
A team of researchers at Columbia University have developed a new algorithm that could help quantum computers calculate molecular energy and lead to the design of new materials. The algorithm uses the most quantum bits to date to calculate ground state energy, which is the lowest-energy state in a quantum mechanical system.
"For readers enamored with birds all around the world, the Internet Bird Collection (IBC) is an excellent place to spend some time. This nonprofit project describes itself as "an online audiovisual library of videos, photos and sound recordings of the world's birds" created "with the ultimate goal of disseminating knowledge about the world's avifauna." Visitors to the IBC can explore multimedia materials and recordings of thousands of bird species crowdsourced by birdwatchers around the world, with their species identifications cross-checked by trained ornithologists. This vast collection can be searched and filtered by family name (common or scientific), country, keyword, date, and more, and each media entry includes a location map and shows other media recorded nearby. The IBC also has several quizzes for those who enjoy testing their ornithology skills. Begun in 2002, the IBC was created by Lynx Edicons, the publishing house behind the 17-volume Handbook of the Birds of the World Alive, whose staff were inspired by their conversations with other birdwatchers to create a collective repository for multimedia collected by avid birders worldwide. Those interested can contribute their own bird photos, videos, and sound recordings to the IBC by creating a free account. "
The Sun is nothing special when comparing it with other stars, there are stars that are smaller but there are also stars that have unimaginable sizes. Stephenson 2–18 is arguably the largest star known at this time. It lies 18,900 light-years from the Earth. But remember, light travels 1,080 million kilometers per hour or 9.46 trillion kilometers in a year, yes this star is very far away by our standards. How can we visualize the size of Stephenson 2–18 when comparing it to the Sun? This gigantic star has a diameter that is 2,150 times that of the Sun. The Sun has a diameter of 1,392,680 kilometers, so using a simple sum the diameter of Stephenson 2–18 works out at 2,994,262,000 kilometers.
When we use large numbers it becomes difficult for us to comprehend. Replace the Sun with Stephenson 2-18 so it is in the same position in the Solar System, that would be very bad news for all the planets, especially the five closest to the Sun and possibly the sixth planet Saturn, they would all be inside the giant star. In the above image, our sun is only 3 pixels big.
The long-running NASA rover Curiosity imaged twisted Red Planet rock pillars.
A long-running NASA rover imaged twisted Red Planet rock pillars.
TheCuriosityroverspotted(opens in new tab)the sinewy rocks on May 15, according to raw images the mission sends down to Earth. The images were obtained on Sol (Martian day) 3474 of the mission, as Curiosity speeds towards completing its first decade of work onMarson Aug. 6.
Visualize how the demographics and geography of COVID-19 deaths have shifted throughout the pandemic. More than 1 million people, or 1 in every 331 Americans, have died of COVID-19, according to the Centers for Disease Control and Prevention. The virus has not been equally fatal for all Americans. Black people, Native Americans and white people hold a higher percentage of COVID-19 deaths than their share of the US population. Americans 65 and older were more than 80% of all deaths from the virus in the first year of the pandemic. And while the Northeast and Midwest were hit hard by COVID-19 in 2020, deaths from the virus were more evenly distributed around the country since then.
How were COVID-19 deaths different by race or ethnicity?
At the start of the pandemic, Black people were the hardest-hit racial or ethnic group, accounting for 16% of pandemic deaths in 2020 even though they make up 12% of the population. Native Americans are also a higher percentage of COVID-19 deaths than their share of the overall population. While white people in the US had lower death rates from COVID-19 in the first year of the pandemic, that’s no longer the case. From 2021 through May 2022, white people had a higher percentage of COVID-19 deaths than their share of the overall population. Making up less than 60% of the US population, white people made up 65% of all COVID-19 deaths. Black and Native Americans maintained a higher percentage of deaths from the virus throughout the pandemic.
How are COVID-19 deaths different by age group?
One reason for the racial and ethnic differences may be that older Americans — who tend to be more white than the population overall — make up the majority of COVID-19 deaths. In 2020, more than 80% of COVID-19 deaths were from those 65 or older. Since then, the share of deaths among older Americans fell to 75%.
How are COVID-19 deaths different by state or region?
In 2020, the hardest-hit states were in the Northeast and Midwest. About 10% of COVID-19 deaths occurred in New York, even though the state holds 6% of the US population. The latest data shows that New York accounts for 7% of total deaths.
Spurred on by quantum experiments that scramble the ordering of causes and their effects, some physicists are figuring out how to abandon causality altogether.
Quantum researchers now have shown that quantum theory allows for transformations of black boxes that cannot be realized by inserting the input black boxes within a circuit in a pre-defined causal order. The simplest example of such a transformation is the classical switch of black boxes, where two input black boxes are arranged in two different orders conditionally on the value of a classical bit. The quantum version of this transformation-the quantum switch-produces an output circuit where the order of the connections is controlled by a quantum bit, which becomes entangled with the circuit structure. Simulating these transformations in a circuit with fixed causal structure requires either postselection, or an extra query to the input black boxes.
Scientists have known for almost a century that the universe is expanding, meaning the distance between galaxies across the universe is becoming ever more vast every second. But exactly how fast space is stretching, a value known as the Hubble constant, has remained stubbornly elusive.
Now, University of Chicago professor Wendy Freedman and colleagues have a new measurement for the rate of expansion in the modern universe, suggesting the space between galaxies is stretching faster than scientists would expect. Freedman's is one of several recent studies that point to a nagging discrepancy between modern expansion measurements and predictions based on the universe as it was more than 13 billion years ago, as measured by the European Space Agency's Planck satellite.
As more research points to a discrepancy between predictions and observations, scientists are considering whether they may need to come up with a new model for the underlying physics of the universe in order to explain it.
Multiple telescopes, including Chandra, observed the Milky Way's giant black hole simultaneously with the Event Horizon Telescope (EHT). This combined effort gave insight into what is happening farther out than the field-of-view of the EHT.
The main panel of this graphic contains X-ray data from Chandra (blue) depicting hot gas that was blown away from massive stars near the black hole. Two images of infrared light at different wavelengths from NASA's Hubble Space Telescope show stars (orange) and cool gas (purple). These images are seven light years across at the distance of Sgr A*. A pull-out shows the new EHT image, which is only about 1.8 x 10⁻⁵ light years across (0.000018 light years, or about 10 light minutes). (Credit: X-ray: NASA/CXC/SAO; IR: NASA/HST/STScI. Inset: Radio (EHT Collaboration))
As the Event Horizon Telescope collected data for its remarkable new image of the Milky Way's supermassive black hole, a legion of other telescopes including three NASA X-ray observatories in space was also watching.
Astronomers are using these observations to learn more about how the black hole in the center of the Milky Way galaxy — known as Sagittarius A * (Sgr A* for short) — interacts with, and feeds off, its environment some 27,000 light years from Earth.
Do you want to do machine learning using Python, but you’re having trouble getting started? In this post, you will complete your first machine learning project using Python.
In this step-by-step tutorial you will:
Download and install Python SciPy and get the most useful package for machine learning in Python.
Load a dataset and understand it’s structure using statistical summaries and data visualization.
Create 6 machine learning models, pick the best and build confidence that the accuracy is reliable.
If you are a machine learning beginner and looking to finally get started using Python, this tutorial was designed for you.
Sumbangan Pemikiran: Visualisasi Data dalam Machine Learning Visualisasi data adalah elemen penting dalam machine learning, membantu memahami data sebelum analisis lebih lanjut. Berikut beberapa pemikiran penting terkait visualisasi data: Memahami Distribusi Atribut: Univariat plot seperti histogram dan box plot memberikan informasi tentang distribusi setiap variabel. Distribusi ini penting karena dapat memengaruhi algoritma yang dipilih. Sebagai contoh, distribusi Gaussian pada histogram bisa memandu pemilihan algoritma yang sesuai, seperti regresi linear atau diskriminan linier. Mengidentifikasi Hubungan Antar Variabel: Scatter plot matrix sangat berguna untuk mengidentifikasi korelasi antara variabel. Hubungan antar atribut seperti ini dapat membantu memahami struktur dataset, memungkinkan kita mengenali pola yang memengaruhi prediksi. Dalam kasus dataset iris, korelasi tinggi pada scatter plot menunjukkan prediktabilitas yang baik antara fitur. Box Plot untuk Deteksi Outlier: Box plot membantu mendeteksi outlier yang bisa merusak akurasi model. Identifikasi dini outlier memungkinkan pembersihan data yang lebih baik atau penyesuaian model. Visualisasi sebagai Panduan dalam Pemilihan Algoritma: Melalui visualisasi, kita bisa mengenali pola dalam data yang relevan untuk pemilihan algoritma. Misalnya, jika terdapat pola linier antara variabel, model linier bisa efektif, sedangkan jika pola lebih kompleks, metode non-linear mungkin diperlukan. Melalui visualisasi yang tepat, analisis awal menjadi lebih intuitif, memungkinkan keputusan yang lebih baik dalam memilih algoritma machine learning serta mempercepat proses eksplorasi dan pemahaman data.
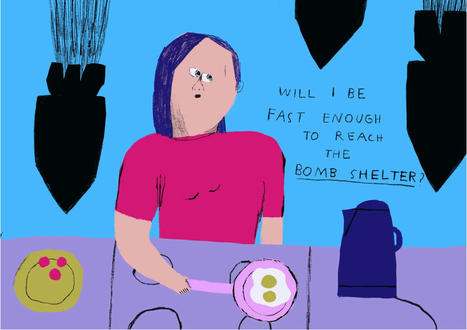
Curated by a team of US-based Eastern European designers, The New Exhibition connects artists caught in the crossfire of war directly with art directors and agencies in the West.
When a team of designers at design company Collins began researching portfolios for an online directory of Ukrainian creatives, they noticed something striking. “The style of many illustrators has completely shifted since Russian tanks rolled across the border into Ukraine,” says the team behind The New Exhibition, launched by Collins. It is but one of many creative revelations that have come out of the research process behind the new project, The New Exhibition – an ongoing online resource that features artists from across the creative world.
Astronomers have identified a rapidly growing black hole in the early universe that is considered a crucial "missing link" between young star-forming galaxies and the first supermassive black holes. They used data from NASA's Hubble Space Telescope to make this discovery. Until now, the monster, nicknamed GNz7q, had been lurking unnoticed in one of the best-studied areas of the night sky, the Great Observatories Origins Deep Survey-North (GOODS-North) field.
Labeling data can be a chore. It's the main source of sustenance for computer-vision models; without it, they'd have a lot of difficulty identifying objects, people, and other important image characteristics. Yet producing just an hour of tagged and labeled data can take a whopping 800 hours of human time. Our high-fidelity understanding of the world develops as machines can better perceive and interact with our surroundings. But they need more help.
Scientists from MIT's Computer Science and Artificial Intelligence Laboratory (CSAIL), Microsoft, and Cornell University have attempted to solve this problem plaguing vision models by creating "STEGO," an algorithm that can jointly discover and segment objects without any human labels at all, down to the pixel.
Perhaps it's a part of what makes us human, to explore the next frontier, to seek out new worlds... Today, we're excited to share a new planet discovered outside of our Solar System by the Cool Worlds Lab - HD 183579b. Join us to hear about the new strategy we developed to find this object, and why this is a particularly valuable planet discovery.
Two of the biggest names in entertainment are coming together to create a virtual space aimed at kids, through a new partnership between Fortnite developer Epic Games and Lego. “We are excited to come together to build a space in the metaverse that’s fun, entertaining, and made for kids and families,” Epic CEO Tim Sweeney said in a statement.
Details are scarce — and the concept of a metaverse remains a murky one — but the companies say that whatever it is they end up building will be designed as a family-friendly virtual space from the beginning. “The Lego Group and Epic Games will combine their extensive experience to ensure that this next iteration of the internet is designed from the outset with the wellbeing of kids in mind,” the companies explained in a press release.
Two of the biggest names in entertainment are coming together to create a virtual space aimed at kids, through a new partnership between Fortnite developer Epic Games and Lego. “We are excited to come together to build a space in the metaverse that’s fun, entertaining, and made for kids and families,” Epic CEO Tim Sweeney said in a statement.
Details are scarce — and the concept of a metaverse remains a murky one — but the companies say that whatever it is they end up building will be designed as a family-friendly virtual space from the beginning. “The Lego Group and Epic Games will combine their extensive experience to ensure that this next iteration of the internet is designed from the outset with the wellbeing of kids in mind,” the companies explained in a press release.
To get content containing either thought or leadership enter:
To get content containing both thought and leadership enter:
To get content containing the expression thought leadership enter:
You can enter several keywords and you can refine them whenever you want. Our suggestion engine uses more signals but entering a few keywords here will rapidly give you great content to curate.


 Your new post is loading...