


Digg has put together a mega compilation of Frank Underwood's most ruthless life lessons from 'House of Cards.'

 Your new post is loading...
 Scoop.it! Digg has put together a mega compilation of Frank Underwood's most ruthless life lessons from 'House of Cards.' 
No comment yet.
Sign up to comment
Scoop.it!

A recent study revealed that 99% of brands are on Twitter. Although small businesses may have paved the way for Twitter marketing success, the world's largest brands are adopting the platform a both a customer service and marketing tool at an increasing rate. Via Lauren Moss

Jeff Gonzalez's curator insight,
February 27, 2014 3:28 PM
I actually really enjoyed this atricle because I use twitter and it was pretty cool to see the bussiness part about it. 
Guillermo García's curator insight,
April 24, 2014 8:04 AM
Which brands rule twitter? Customer service, sales, social commerce, fundraising and authenticity. 
Chris Lee's curator insight,
September 29, 2014 3:33 PM
A visual breakdown of brands which use twitter to engage with their consumers effectively.
Scoop.it!
From
list

Listly List - Book Creator apps for the iPad - Scribble Press - $3.99, Shutterfly Photo Story- FREE, Picturebook - FREE, Bamboo Paper - FREE, Picturebook: School Edition - $3.99, StoryBuddy 2 - $2.99, Paper by FiftyThree - FREE, Mooklet - FREE, My Story - $3.99, Express Books - FREE, TinyTap - FREE, Book Creator- $4.99, Scribble My Story - FREE, StoryKit - FREE, and Story Creator - FREE Via David Miller

CGagliolo's curator insight,
March 1, 2014 9:53 AM
This is a great list of book creators for the iPad. It is missing our favorite, which is Book Creator for iPad.
Scoop.it!

Facebook released new findings on Friday -- Valentine's Day -- that hints when two people are about to change their status to "in a relationship."
Scoop.it!
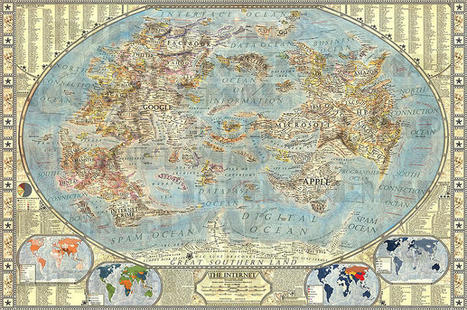
An artist has created a hand-drawn map of the Internet, where Google, Apple, and porn are continents. The world of the Internet mirrors the real-world in myriad ways: there are members (we call them populations), websites (destinations to visit), acquisitions of companies (redrawn political boundaries). So what if the Internet could be visualized like our global politics? That’s exactly what designer Martin Vargic did in this cartographic experiment which treats mega-companies such as Google, Microsoft, HP, and Apple like empires, on a classic world map. To explain the dominance and relationships of these entities, Vargic created a visual hierarchy that gives prominent treatment to companies with the most users (or sites with the most visitors), surrounding them with smaller states and townships named after adjacent businesses.
More details at the link... Via Lauren Moss
Scoop.it!
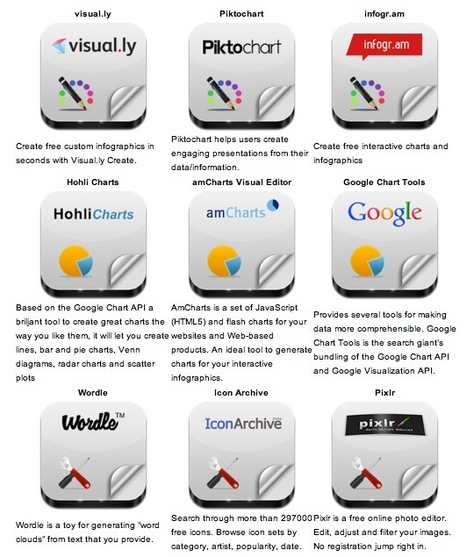
Robin Good: Here is a handy short guide to nine free infographic creation tools that can be utilized to create enticing visuals, word charts and data-based infographics without having special technical skills.
Useful. 8/10
Check them all out: http://www.infographicsarchive.com/create-infographics-and-data-visualization/
(Unearted by Andres Taborga) Via Robin Good

Sahana Chattopadhyay's curator insight,
May 4, 2015 11:59 PM
Infographics are great tools to present curated and focused content from a specific perspective.
Scoop.it!

The colors you see in stores and online aren't there without reason. See how colors affect shopping behaviors and habits and convince you to buy things. Via Levin Chin
Scoop.it!

Have five spare minutes before a meeting? Don't waste them—try one of these productive to-dos instead. Via Barb Jemmott
Scoop.it!

Mike Lemanski (b. 1986) hails from Huddersfield, UK and graduated from the Highlands School or Art and the Bradford School of Arts. Since then, he has been a successful freelance illustrator creating posters, album covers, book and periodical covers and a gorgeous and playfully intricate series of sheet music illustrations.
Scoop.it!

Businesses need to be agile, innovative, social, mobile, totally customer focused and geared to provide a profitable customer promise CMO’s, COO’s, CIO’s and...
Scoop.it!

Twitter is testing a major redesign that's very reminiscent of Facebook and Google+.
Scoop.it!

The amount of information available online has gotten out of hand. Everything about our lives, from where where we went to high school and what we ate for breakfast this morning, can be found on the internet. If you think that's bad, think about children growing up today – their entire lives, from infancy through middle school, are being documented by their parents on Facebook! Privacy just doesn't exist online anymore; it can take drastic measures to delete ourselves from the internet, but here's a step-by-step guide for those who want to do so... Via Lauren Moss
Scoop.it!

“Where people post geotagged photos to Flickr from and geotagged tweets to Twitter from.” via Eric Fischer Red dots are locations of Flickr pictures. Blue dots are locations of Twitter tweets. White dots are locations that have been posted to both. Via Lauren Moss

Patrice Mitrano's curator insight,
February 4, 2014 8:51 AM
voir aussi la page Flickr d'Eric Fischer, l'auteur de ces images spectaculaires : http://www.flickr.com/photos/walkingsf/ |
Scoop.it!

'One of our favorite annual traditions at Shutterstock is sharing our hard-earned design-trend data with the world. For this, our third annual infographic, we used data from our 350 million all-time downloads to explore recent and emerging trends from around the globe. Check out the infographic at the link, and scroll on to view a lightbox featuring images showcased in the design. Via Lauren Moss
Scoop.it!

With how often each of us are online or using our mobile phones, you would think that print advertising is an antiquated artwork that no one pays real [...] Via Alessandro Rea
Scoop.it!


Henrik Safegaard - Cloneartist's curator insight,
February 14, 2014 3:40 AM
Awesome Gallery - they are Brilliant. 
Lee Wise's curator insight,
February 15, 2014 11:33 PM
Some neat pics here. Maybe A Beautiful Moment In Time for you... today? Enjoy.
Scoop.it!

Over here at Paper Leaf Design, we make much ado about communication & process. In our minds, these two elements are key to a successful design project Via Martin (Marty) Smith

Martin (Marty) Smith's curator insight,
February 13, 2014 4:30 PM
I like this infographic of Paper Leaf's design process. Linked artcile is excellent too. My process is less linear. Image little tornadoes of circles at each of those linear steps with bullets bouncing hither and yon and see inside the creative chaos my teams depend on (lol).
Scoop.it!

Robin Good's curator insight,
December 16, 2013 11:44 AM
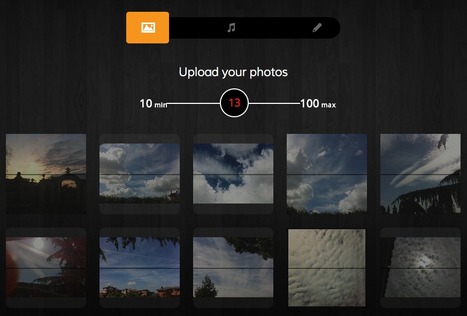
Evver is a free web app which allows you to create music slideshows with extreme ease. You simply select your favorite pictures (from 10 to 100), you pick up a song, among the available soundtracks, and the rest is automatically done for you. You can re-arrange the order in which the photos will be shown in the final video and delete the ones that you don't want to use and you are set to go. Evver edits your pics in sync with the music and creates a music video that can be easily shared on any social media or embedded to your site or blog. My comment: Very, very easy to use. The selection of music tracks that you can use is presently very limited. The final result is good, but - as you can see from my sample - not as good as it could be. Free to use. Try it out now: http://www.evver.com/ Similar tools: http://slide.ly Sample video (created by me): http://www.evver.com/play/49ef08ad6e7f26d7f200e1b2b9e6e4ac
Scoop.it!
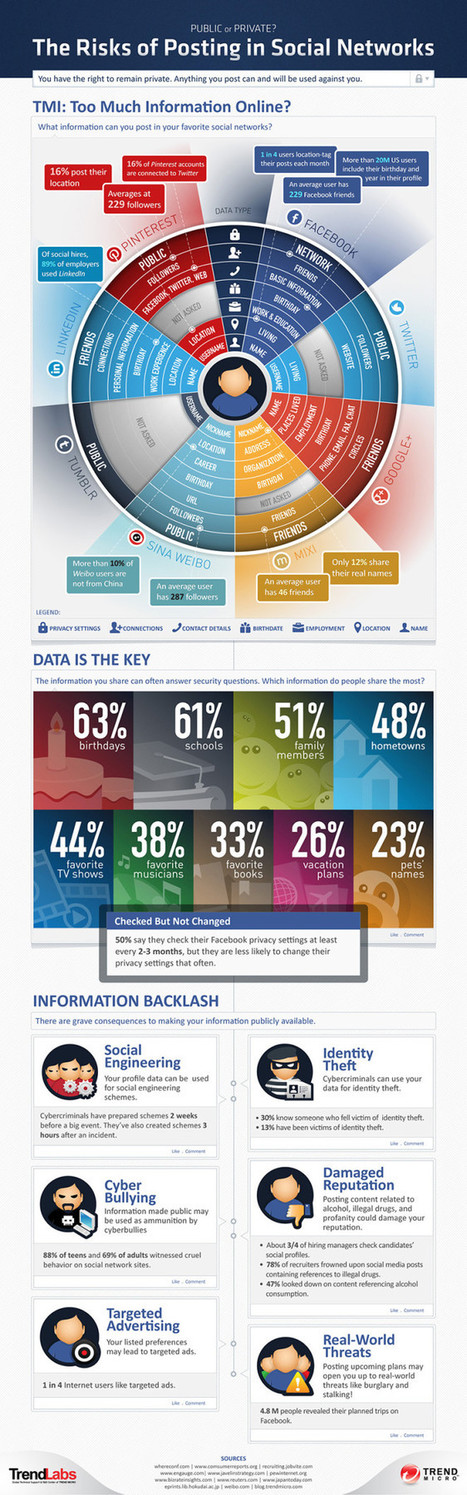
INFOGRAPHIC: The risk of posting in social networks. You have the right to remain private. Anything you post can and will be used against you. Via Lauren Moss

Marissa Sharbell's curator insight,
February 26, 2014 6:33 PM
This helpful infographic displays what can go wrong if you post the wrong content online. It warns about backlash that can happen without monitoring carefully what information is shared online. This advice can apply both professionally and personally, since every one who is online has potential risks when they put themselves out there. 
Gloria Ross Musgrove's curator insight,
March 2, 2014 4:28 PM
Investigating and bringing into laws different Cyber crimes.
Scoop.it!

The London-based studio Hundred Million has created a set of playing cards with graphic designers in mind. Their set is based on the CMYK color model and replaces the standard suits with the four colors of ink commonly used for printed media: cyan, magenta, yellow and black. Via Levin Chin
Scoop.it!
“Bespoken” on iTunes: http://goo.gl/DX8uI1 “Bespoken (Inverted MTB Remix) on iTunes: http://goo.gl/dsHUdV “Bespoken” - A breakdown of selected sound elements:…
Antonios Bouris's insight:
"Composer Johnnyrandom breaks new ground with musical compositions made exclusively from everyday objects. His debut single, “Bespoken”, explores the full potential of sounds generated from bicycles and their components, transcending the role of traditional instrumentation as the accepted method for creating beautiful and thought-provoking music."
Scoop.it!
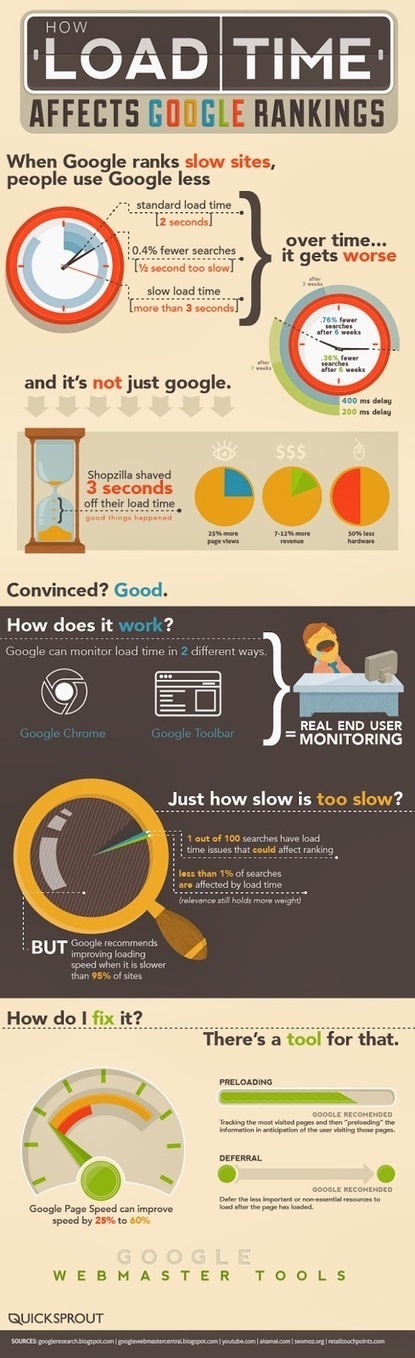
Have you ever been to a slow site and it felt like it took hours to load? You look down at your computer clock and really only 30 seconds have gone by. That's just the user experience on a slow site- the real question is “Does your website speed effect your ranking?” Will your slightly slower site be penalized by Google and other search engines when you clients are even looking for you?In this easy to understand graphic, we see that 1 second makes all the difference in the world. And after just 6 short weeks of poor load times, your site can lose 75% of it’s traffic to that page.If you have a low ranking you might want to follow some of the Google Guidelines to pre-load your most popular pages to increase your site’s overall performance.
Via Lauren Moss

Mr Tozzo's curator insight,
March 4, 2014 8:12 AM
Does Website Speed Affect Your Ranking? (infographic) 
Carlos Polaino Jiménez's curator insight,
March 8, 2014 6:12 AM
SEO SEO, al final todo es KPI's y posicionamiento. 
outofseo's curator insight,
April 4, 2014 5:27 AM
Website speed affects ranking and conversions. Pages load time is an important issue to be fixed if load time is over 3 sec.
Scoop.it!

Business class passengers flying Virgin Atlantic from London Heathrow airport will be greeted by staffers wearing Google Glass or a Sony SmartWatch 2.
Scoop.it!

Understanding mistakes of the past can help guide U.S. transportation policy in the future. Between the 1920s and 1960s, policies adapting cities to car travel in the United States served as a role model for much of Western Europe. But by the late 1960s, many European cities started refocusing their policies to curb car use by promoting walking, cycling, and public transportation. For the last two decades, in the face of car-dependence, suburban sprawl, and an increasingly unsustainable transportation system, U.S. planners have been looking to Western Europe. Via Lauren Moss

Brittany Ortiz's curator insight,
October 27, 2014 2:44 PM
This is very true and fascinating to read. It's obvious how technology and cars can change the way we view the world. When in DR this past summer, there were so many people driving a motorcycle. I didn't really get the reason why other than hearing my dad say "porque no cuesta mucho" which in English is saying "because it doesn't cost as much." It made sense, seeing the conditions outside of the resort and also having the opportunity to visit an elementary school and seeing how many students either walked or went 3 to 4 on a motorcycle to get to school. It makes sense how having a car and paying the taxes contributes in a state fixing something. It's obvious how car dependent United States is. Were so lazy to walk up the street to get milk, that we'll prefer to drive our car there. Its the realization we must all unfortunately come to.
Scoop.it!

This great infographic takes you through the initial engagement stages for new website design work, through research, landing page design, coding, validation onto final launch and search engine optimi Via Martin (Marty) Smith
Martin (Marty) Smith's curator insight,
February 7, 2014 12:06 AM
Cool way to visualize web design process and true to my experience of creating more than 100 websites. 
Katja Tschimmel's curator insight,
February 14, 2014 2:35 PM
Design Thinking applied to Web Sites. Very nice graphic! |









"Shake with your right hand but hold a rock with your left."
"The road to power is paved with hypocrisy and casualties. Never regret."
"When you're fresh meat, kill and throw them something fresher."