


 Your new post is loading...

Comment fonctionne l’évolution – Les scientifiques développent une nouvelle métrique de l’évolution moléculaire
February 20, 2023
-------
NDÉ
D'après la traduction automatique de l'article
"La taupe européenne, équipée de ses formidables pattes antérieures larges en forme de pelles, peut creuser sans effort un tunnel dans la terre. Il en va de même pour la taupe marsupiale australienne. Bien qu’elles résident dans des régions très différentes, les deux espèces ont développé des appendices similaires, parfaitement adaptés à leur mode de vie souterrain.
La science parle d’« évolution convergente » dans de tels cas, lorsque des espèces animales, mais aussi végétales, développent indépendamment des caractéristiques qui ont la même forme et la même fonction. Les exemples sont nombreux : les poissons, par exemple, ont des nageoires, tout comme les baleines, bien que ces dernières soient des mammifères. Les oiseaux et les chauves-souris ont des ailes, et lorsqu’il s’agit d’utiliser des substances toxiques pour se défendre contre les attaquants, de nombreuses créatures, des méduses aux scorpions en passant par les insectes, ont toutes développé le même instrument : le dard venimeux."
(...)
L'étude
- Detecting macroevolutionary genotype–phenotype associations using error-corrected rates of protein convergence | Nature Ecology & Evolution, 05.01.2023
https://www.nature.com/articles/s41559-022-01932-7
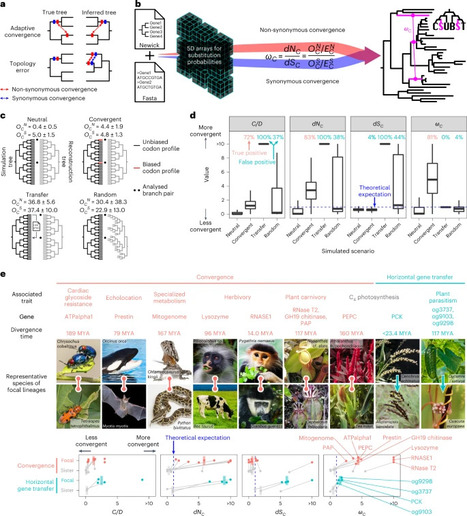
[Image] Challenges and solutions for the detection of molecular convergence.
a, False convergence is caused by tree topology errors. b, The overview of CSUBST. This programme processes substitution probabilities to derive observed (OCN and OCS) and expected (ECN and ECS) numbers of non-synonymous and synonymous convergence and evaluate their rates (dNC and dSC) in branch combinations in a phylogenetic tree. c, Generation of simulated datasets for performance evaluation in different evolutionary scenarios. The numbers of observed non-synonymous and synonymous convergence are indicated above trees (OCN and OCS, respectively; mean ± standard deviation). d, The estimated rates of protein convergence in different scenarios. Each box plot corresponds to the results of 1,000 simulations. Dashed lines indicate the theoretical expectation (= 1.0) except for the ratio of convergence and divergence events (C/D) (refs. 13,17) for which no theoretical expectation is available. Values greater than the 95th percentile in the Neutral scenario are defined as true and false positives in Convergent and other scenarios, respectively, and are indicated at the top of the plot in pink (true) and blue (false). Box plot elements are defined as follows: centre line, median; box limits, upper and lower quartiles; whiskers, 1.5 × interquartile range. e, Performance of convergence metrics in empirical datasets. Known examples of protein convergences and HGTs are analysed with C/D, dNC, dSC and ωC. Median values (bars) are overlaid on individual data points that correspond to gene trees. In trees where convergence occurred in more than two lineages, the median of all focal branch pairs is reported. The branch pairs sister to the focal branches are shown as a control10, except in cases where there is no substitution at all or the sister branches are phylogenetically not independent. Divergence time is according to timetree.org95. The comparison with the background levels for each dataset is shown in Supplementary Fig. 5. The characteristics of the datasets are summarized in Supplementary Table 3. MYA, million years ago. Image credits for panel e: Cenchrus echinatus, Chutima Chaimratana/Shutterstock; Tetraopes tetrophthalmus, Paul Reeves Photography/Shutterstock; Myotis myotis, Agami Photo Agency/Shutterstock; Colobus guereza, Radek Karko/Shutterstock; Alloteropsis semialata Alexey Yakovlev under a Creative Commons license CC BY 4.0; Cuscuta europaea, ChWeiss/Shutterstock; alll other images except for Nepenthes cf. alata and Cephalotus follicularis from freepik.com.


Sur le même sujet