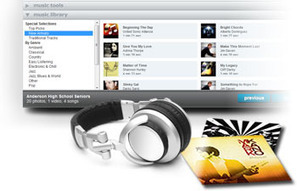
Photodex is slideshows. Create and share HD video slideshows on your desktop or on the web.

 Your new post is loading...
 Your new post is loading...
Your new post is loading...
Photodex is slideshows. Create and share HD video slideshows on your desktop or on the web. 
No comment yet.
Sign up to comment
You've probably seen one of these really cool animated presentation clips on YouTube and thought to yourself: Wow I want one of those….but you soon found out...

Create a flowchart, mind map, network diagram, UML diagram, wireframe and other drawings online with Lucidchart's free flowchart software and diagram tool.
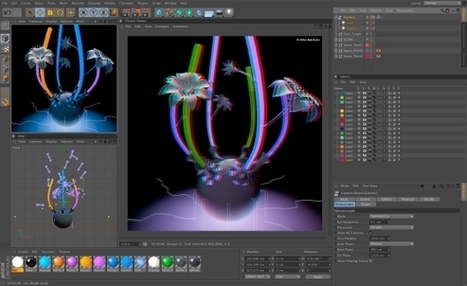
Creating a presentation with attractive designs can sometimes be the difference between a good presentation and a failed one. One of the programs known for its ability to help users create attractive presentations is MS PowerPoint, however, it is only natural that one should use all kind of available resources for creating eye-catching presentations. Adding 3D objects can be a major source of creating attractive presentations by inserting graphs, images and other kinds of 3 dimensional objects. While PowerPoint offers some 3D shapes and designs by default, there are numerous third-party tools and add-ins that are a better alternative. In this post we will explore tools that can be used for creating stunning presentations in 3D.
The heart of the site is a collection of data visualizations. You may want to begin by browsing through these collections—if you'd rather explore than read directions, take a look!

Photosmith 2. This powerful mobile workflow photography app lets you edit, tag, keyword, group, rate, and add metadata on your ipad and sync back to Lightroom.
Lovely Charts is an online diagramming application that allows you to create professional looking diagrams, such as flowcharts, sitemaps, organisation charts, wireframes, and many more... For free.

Adobe Illustrator is a great software that can be very helpful for designers and presenters. Especially if you need to make PowerPoint presentation templates from sketches. Here we will show you how to simply vectorize an image and convert the sketch to a simple vector. Via Baiba Svenca

Business Cards - A gallery and showcase of the most beautiful, cool, and unique business card design.

A collection of anonymously contributed client horror stories from designers.
From
www

stock photography community - browse our huge gallery for high quality stock photos or share yours with others.
|
Sample board is an online, digital mood board editor for the creative industries. Join the creative community at Sampleboard.com where people from around the world create and share mood boards, discuss design and get inspired by each other.

Over 3000 Flash effects, no coding required! Flash text animation effects, image transitions, button effects, filters and spectacular text effects.

From
creately
Easily draw diagrams online using Creately’s online diagramming tool.
DIY Chart is a web-based, simple and powerful online tool to create interactive charts and graphs from static or dynamic data which may be generated using any scripting language...
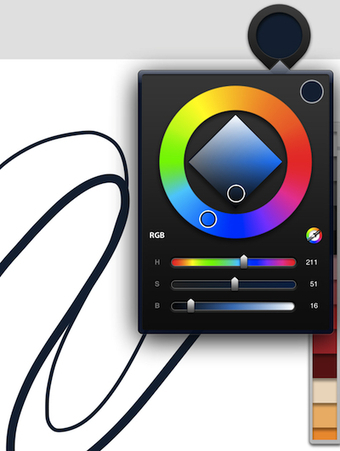
Many of us have been using Sketchbook Pro from AutoDesk to draw and sketch for a very long time.
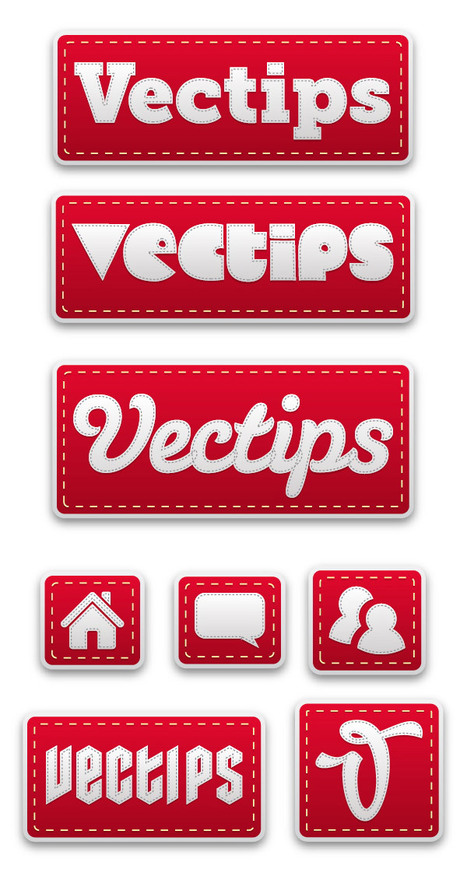
Fuzzy, sketchy, bubbly, viscous, sleek, shiny, retro, futuristic: you can do it all in Adobe Illustrator.
Photoshop user tutorials and education. From 'Photoshop User' magizine.
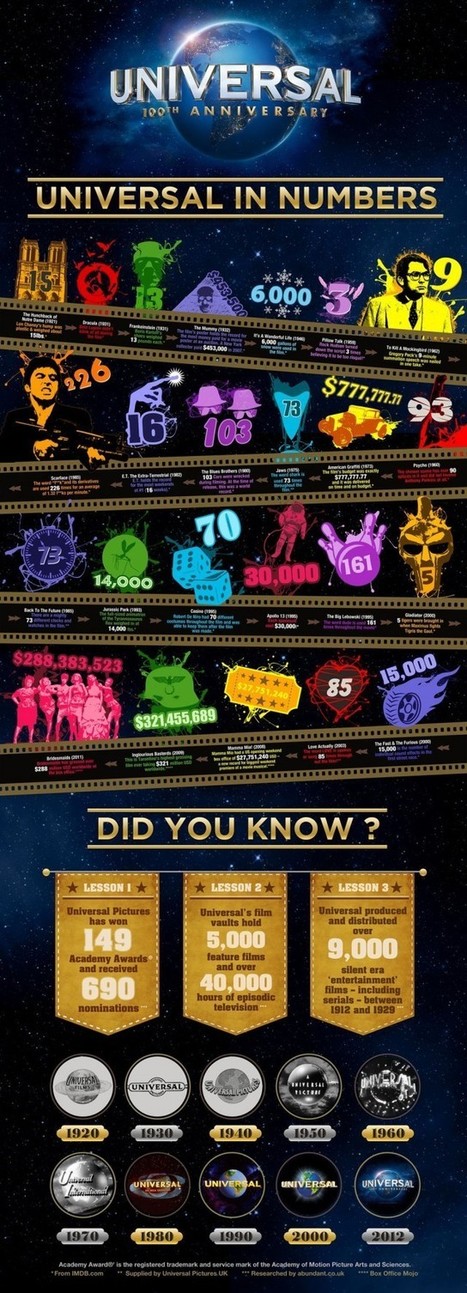
Daily Infographic delivers new infographics every day. From personal finance to bacon consumption, we're your daily one-stop headquarters for new compelling, data-filled illustrations.
From
www
Design, infographics,technology culture, news, business, lifestyle...

Create and enjoy comic strips with fantastic ease. Join the friendly community, making comics has never been this fun.
|