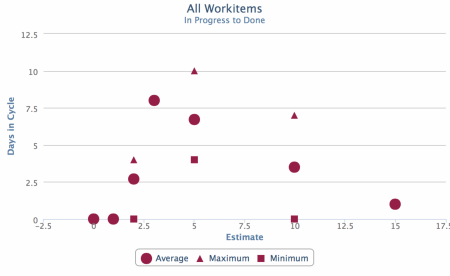
In the Kanban Guide for Scrum Teams and the Professional Scrum with Kanban workshop, we introduce 4 key flow metrics that we believe Scrum teams can use to improve their flow:

 Your new post is loading...
 Scoop.it! In the Kanban Guide for Scrum Teams and the Professional Scrum with Kanban workshop, we introduce 4 key flow metrics that we believe Scrum teams can use to improve their flow: 
No comment yet.
Sign up to comment
Scoop.it!

Having a better understanding of the psychological and behavioral aspects of motivating people, we can eliminate the use of old, vanity metrics and standardize the use of new, agile measures. This presentation combines theoretical background with real-life examples and successfully applied agile metrics. It also gives managers and executives a clear charter for how to use metrics effectively and things they may be focused on that are causing more harm than good.
Scoop.it!
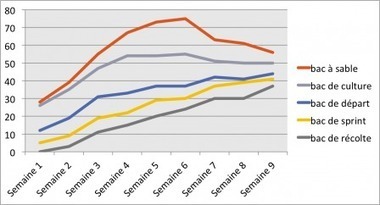
Dans ma présentation sur les bacs à Lean Kanban France puis à Agile Tour Toulouse, et aussi dans le chapitre 15 de la 3ème édition de mon livre, je montre un diagramme de bac
Scoop.it!

What We Learned
Mickael Ruau's insight:
Scoop.it!

From
plan

If you’re working on a complex project, whether it’s a mobile app, website redesign, or product, there’s really no better way to manage your team and your time than with Scrum. N
Mickael Ruau's insight:
According to Kamlesh Ravlani, a certified scrum master and coach at Agile for Growth, there are dozens of metrics used by Agile teams, including:
Scoop.it!
This session will walk you through a practical framework for implementing measurement and tracking of your DevOps efforts and software delivery performance that will provide you with data you can act on! These KPIs include metrics related to your software delivery pipeline and technical progress, as well as cultural indicators and business impact. In addition, we will cover common use cases and real world examples for implementing these metrics to drive DevOps success, as well as best practices for how to address certain challenges and problematic areas along your process that these metrics may bring to light.
Scoop.it!
Hyper-Productive metrics are designed to help Scrum Masters carefully tune their teams into a hyper-productive state. Hyper-Productivity is defined as a 400% increase in Velocity over the baseline Velocity with corresponding quality. The baseline Velocity (100%) is established for a team during their first Sprint.
Scoop.it!

La vélocité est souvent un indicateur mal utilisé sur des projets Agile. Il est souvent confondu avec le temps consommé sur un sprint et est utilisé par le management pour contrôler la productivité des équipes Scrum. L’objectif de cet article est de comprendre la notion de vélocité et de l’utiliser correctement sur vos projets.
Scoop.it!

Today we begin Part 3 of Daniel S. Vacanti’s Actionable Agile Metrics for Predictability: An Introduction (buy a copy today) with Chapter 10 which is titled, Introduction to Cycle Time Scatterplots. Scatterplots take us beyond the analysis of average cycle time (or even approximate average cycle time). Scatterplots provide a visual representation of the data so we can begin to use the data to predict the future.
Scoop.it!

Scoop.it!

Encore aujourd’hui, l’Agilité est généralement reliée au travail des équipes de développement. On remarque parfois une lacune au niveau de l’alignement du travail des équipes et des objectifs de l’entreprise. Aussi, les dirigeants peuvent tenir pour acquis que leurs volontés sont claires, connues et partagées; ce n’est pas toujours l
Scoop.it!
OGSM - WikipediaObjectives, goals, strategies and measures ( OGSM) is a strategic planning process that provides clear goals and identifies the strategic choices to achieve them. It defines the measures that will be followed to assure that goals are met and helps groups work together toward common objectives, across functions, geographical distance and throughout the organization.
Scoop.it!

In this team, we valued getting metrics about our own performance. Similar to what is described in the Kanban Guide for Scrum Teams. We also measured a metric that we didn’t have a name for. It was the ratio of the time we spent working on a story to the total time it took to get the story in production. Our ratio was horrible (0,7%). This was astonishing to us because we thought of ourselves as one of the most productive teams in the department.
|
Scoop.it!

One technique I use is to assign “value points”, which, like estimating points, are relative measures of the value returned by each story. But what do these points mean?
Scoop.it!
Scrum & Management teams require understanding of the following ten vital aspects to understand the progress made and the issues requiring correction. Here are ten metrics that can help Scrum & Management teams to answer the above questions to develop and sustain high performance—Velocity Increase, Work Capacity, Focus Factor, Percentage of Adopted Work, Percentage of Found Work, Accuracy of Estimation, Accuracy of Forecast, Total Business Value, Success at Scale, and the Ratio of Successful Sprints of the Team. Scrum teams should be encouraged to apply metrics to their Scrum processes, after all, the numbers tell the tale. In this whitepaper we provided a lightweight and understandable set of metrics that can be used to track a Scrum team’s performance. This simple s of metrics are easy to implement and have a powerful effect on the performance of Scrum Teams.
Scoop.it!
Qu'est-ce que l'OKR ? L'OKR pour Objectifs et Key Results, est une approche de gestion des objectifs utilisée par des entreprises comme Google, Twitter
Scoop.it!
The session and paper will provide practical advice on how to visualize and interpret the metrics, how they relate to each other, how they influence behaviour and decision-making, and how you can use them to see the underlying patterns and stories in your system.
Scoop.it!
Mickael Ruau's insight:
Ci dessous une proposition de métriques type avec la cible potentielle : Organisation, Projet, Equipe PBI Cycle time How much calendar time does it take on average from a PBI is fully refined (ready for development) until it is deployed to produc X X PBI Lead time How much calendar time does it take on average from a PBI has been added to the Product Backlog until it is being added to a Sp X X No. of defects How many defects are found on average per week/month in QA or Production (that is, outside a Sprint) X Innovation rate How much of the development team’s capacity is spent on new features vs. defect resolution? X X X Release frequency How often happens production deployments? X X Release stabilization From the development team checks in their code changes, how long does it take until those changes are deployed to production X X PBIs Status How many PBIs are Done, Not Done, In Progress x x No. of tests How many (automated + manual) test cases do we have? X Tests Run Results How many Tests passed successfully vs Failed and Not Run Tests x x x Code coverage How large a portion of the application(s) is covered by tests? X Static code analysis How many static code analysis errors/warnings does the code contain? X Code metrics How many Code metrics violations (these have to be defined) does the code contain? X Employee satisfaction How happy are the project team members? (Survey) X X X Client satisfaction How happy are the client project team members / stakeholders / end users? (Survey) X X Business Value How much Business Value has been delivered on average per Sprint? Velocity & Historical Velocity How many PBIs (story points) are completed on average per Sprint? X X Build failures How often do the automated builds fail (due to coding errors)? X X Feature usage How much of the application functionality is used by the intended end users? X X Sprint Burndown Chart How the remaining work progress throughout a Sprint x x Release Burndown Chart How the project is progressing according to the Forecast x x x Number of Open Impediments How many obstacles are impeding teams to achieve the Sprint Goals and affect the Productivity x x Agile Earned Value Metrics Cost Performance Index and Schedule Performance Index of the Agile project x x MetricsDescriptionOrg.Proj.Team
Scoop.it!
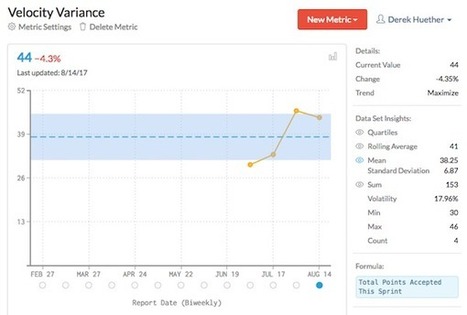
Metrics should capture the changing environment of your business so you can make informed decisions.
Scoop.it!

These results show that there isn’t just a single metric that everyone uses. Different organizations, types of management, and teams need different metrics.
Mickael Ruau's insight:
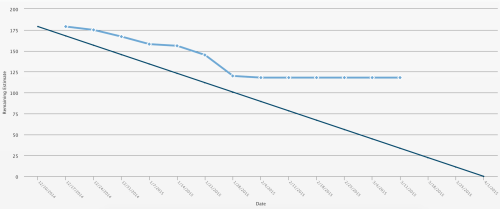
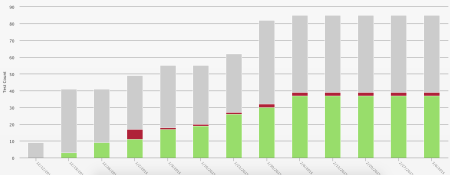
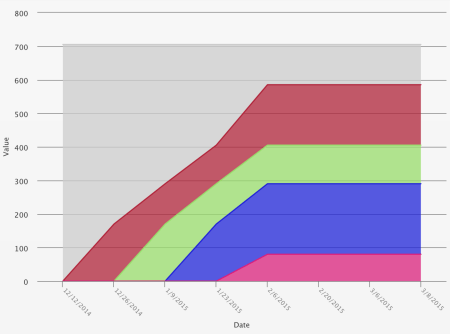
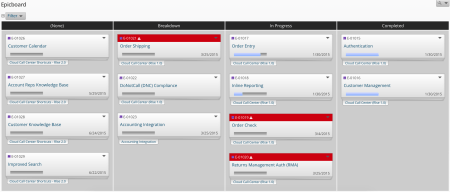
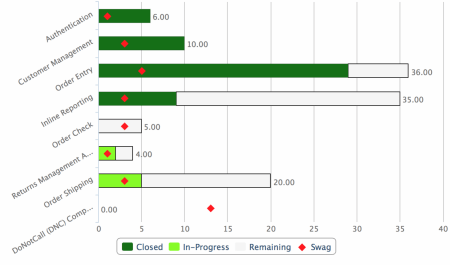
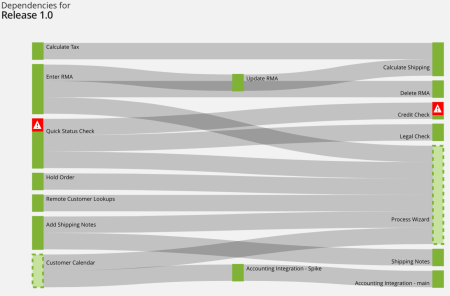
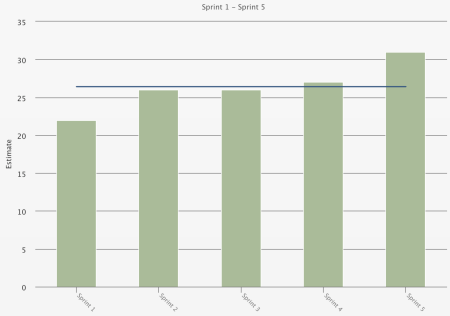
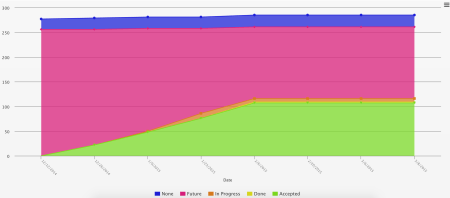
#1 On-Time DeliveryAccording to the State of Agile survey, 58% of the respondents* said they measured the success of their agile initiatives by on-time delivery. With agile, our schedule is fixed and our scope is flexed. What does that mean for on-time? Well, time just happens, so theoretically, we are always on time. But, on-time is generally measured in context with the expectations about what will be delivered. To measure and have visibility of what is being delivered, we may look to the out-of-the box metrics of the burndown or the burnup. For instance, in this VersionOne burndown chart you can see progress as the team heads toward an expected end date. This burnup chart, on the other hand, allows you to see the trend of getting stuff done, as well as the impact of scope changes. #2 Product QualityA total of 48% of the respondents to the survey said they measured the success of their agile initiatives through product quality. Quality is often measured in multiple ways, including looking at the customer satisfaction, revenue growth, and the technical aspects of testing conducted throughout the development life cycle. With agile software development teams, we’ll look at our velocity of completing working software with quality built in. We tightly couple continuous testing and inspection throughout the lifecycle of the development, so we’ll constantly be monitoring testing trends as well as constantly inspecting build and code health. For instance, in this testing trend chart you can see the cumulative progress around testing activities. Ultimately you want to see all green, but a large amount of red along the line might reflect some issues in the code base or process. #3 Customer/User SatisfactionThe survey found that 44% of respondents measured the success of their agile initiatives by customer or user satisfaction. As with all these benefits, there are multiple ways to measure the outcomes. In the case of customer/user satisfaction, these include looking at the Net Promoter score, sales figures, number of support calls vs. number of features delivered in a time period, or usage statistics of product or site capabilities. #4 Business ValueApproximately 44% of the respondents to the State of Agile survey stated that they measured the success of their agile initiatives by business value. And several of the principles of the Agile Manifesto recognize the importance of delivering business value. Measuring business value is very explicit when we know that there’s a contract for work to complete or a compliance need and fines if we don’t finish the work. On the other hand, sometimes measuring value is prospective or speculative in the sense that the market inputs drive decisions and the value is often a best guess. Having a business value score applied to the features to be delivered can measure value. Here’s a sample epic cumulative flow chart based on value. This helps you see the delivery of anticipated business value as features and other large stories are completed. #5 Product Scope (Features, Requirements)Another 39% of the respondents answered that they measured the success of their agile initiatives with product scope. Setting a goal around what to get done over the next three months, then tracking status, and getting it completed is hugely rewarding. Actually having real-time feedback as to the progress of work is valuable to everyone on the team, from the engineers to the program managers. With agile software development projects, you can always rely on the burndown charts, or just visualize the progress of the cards moving from left-to-right on the project kanban board. Here’s an epicboard in VersionOne that helps the team track and visualize the progress of features at a program level. Or if you’re using Scaled Agile Framework® (SAFe®), you can see progress at the release train level. #6 Project VisibilityProject visibility was the measure of choice for 30% of respondents to the survey. One of the best ways to build trust is transparency. That means having the plans out in the open and making progress visible to all. Sharing progress at multiple dimensions provides the different stakeholders with information that makes sense from their point of view. Metrics that show feature or overall progress against a targeted plan can provide great insights. In this chart you can visualize progress on a feature and known work. The red diamond represents what was actually anticipated, so it’s easy to gauge whether you are above or under the anticipated scope. The other reason visibility is important is because we need to have alignment among internal teams so they can best manage their work in relation to component or service dependencies. Understanding the impact of one team’s work on another team is critical. By looking at the dependency chart below, it’s easy to identify the stories at risk. #7 ProductivityAccording to the State of Agile survey, 29% of the respondents said they measured the success of their agile initiatives through productivity. The concept of productivity in an agile world is a measure of outcomes, not output. So looking at burnup for a product or based on value is hugely impactful. Simply looking at a burnup of count of stories or features over time is a great way to understand how much the team is actually delivering. #8 PredictabilityApproximately 25% of the respondents from the survey said they measured the success of their agile initiatives by predictability. A predominant metric used to assess predictability is velocity trend. For a three- to four-month period, this shows how much work has been completed at a sustainable pace on average. A velocity that wildly fluctuates might reflect a team that is changing, work that is unpredictable, or simply a team that is still getting used to defining work small enough to complete in an iteration. A velocity trend chart like the one below not only helps you see performance, but also gives you visibility into whether or not the team’s output is at a predictable state – as this one shows. You can always try to assess velocity based simply on the count of story cards completed every week. This is usually the best indicator of predictability. #9 Process ImprovementAnother 23% of the respondents said they measured the success of their agile initiatives by process improvement. A core tenet of all lean and agile mindsets is continuous improvement – constantly getting better. But how do you know you are getting better unless you are measuring the outcomes? There are all the metrics above that help, but there’s also the extremely helpful cumulative flow chart which shows how well work is flowing through the lifecycle. With this team level cumulative flow chart, you can see where bottlenecks or slowdowns may exist. Also, there’s cycle time – which helps us with planning and predictability. Cycle time is a great metric to view over time to see if process tweaks and adjustments are having an impact on productivity. For instance, in this cycle time report, you can see the level of variability and performance across the various estimated pieces of work. #10 Don’t KnowJust 11% of the State of Agile survey respondents said they didn’t know! Well, if you don’t know the benefits, try to start looking at the metrics above. You’ll see improvements in delivered value, better quality around what is produced, a more predictable cadence, and ultimately happier customers.
Scoop.it!
Discover a framework for evaluating any metric, a Hall of Shame covering some of the worst most popular benchmarks, and one true guide to point you to the very best metrics of all. See some great examples of visualization that make metrics sing, and leave with several concrete measures you can begin tracking as soon as you get back to your desk.
Scoop.it!
Percentage in proper agile product management are not so necessary. Job is either done or not done. That is the only real status of an agile requirement.
Scoop.it!
 Tableau de bord prospectif - WikipédiaLe tableau de bord prospectif ( TBP), ou tableau de bord équilibré (en anglais, Balanced Scorecard ou BSC), est une méthode lancée en 1992 par Robert S. Kaplan et David Norton, visant à mesurer les activités d'une entreprise en quatre perspectives principales :
Scoop.it!
OKR - WikipediaThe development of OKRs is generally attributed to Andy Grove the "Father of OKRs", who introduced the approach to Intel during his tenure there and documented this in his 1983 book "High output management". Grove explained his simple but effective concept thus: "The key result has to be measurable.
|