From
youtu

 Your new post is loading...
 Scoop.it! 
No comment yet.
Sign up to comment
Scoop.it!
💫 Inventory in Your Zip Code: https://bit.ly/3TJ91z9
Scoop.it!

We talk housing affordability crisis and a new generation of boardin
Scoop.it!

U.S. News & World Report, the global authority in consumer advice, today announced the 2025 Best Senior Living communities ratings.
Scoop.it!
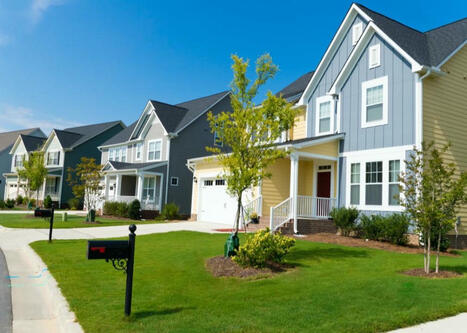
Stacker compiled a list of cities with the most expensive homes in the Lake Havasu City metro area using data from Zillow.
Scoop.it!

The life of ministry wasn’t quite what Todd imagined. As God changed his perception, a sweet community emerged.
Scoop.it!
🏡 Instant Home Value: https://bit.ly/afreehomevaluation
Scoop.it!
|

|
Scooped by
AZ Mountain Lake Realty
April 11, 2025 9:48 AM
|
Scoop.it!
"Funny, factual, and informative!" Enjoy one of my trademark, data-driven briefings on the state of the industry and the power of manipulating information to tell whatever story you want. Presented at Inman Connect New York 2025.
|
|
Scooped by
AZ Mountain Lake Realty
April 18, 2025 2:38 PM
|
Scoop.it!

Median Home Price: As of early 2025, the median home price in Scottsdale is around $800,000, though this varies significantly by neighborhood. Luxury homes (typically those over $1M) remain highly competitive, especially in areas like North Scottsdale, Grayhawk, and Gainey Ranch.
Market Type: Scottsdale is considered a seller’s market, with low inventory and high demand. The market has been tight for several months, with listings often seeing multiple offers.
Homes for Sale: Active listings in Scottsdale have been lower than normal, contributing to the increase in home prices. New listings are still coming on the market, but they tend to sell quickly due to the competitive demand.
Days on Market: Homes in Scottsdale typically spend an average of 30-40 days on the market, but highly desirable properties, especially in prime locations, may sell in a matter of days.
Buyers are still highly interested in Scottsdale due to its proximity to Phoenix, excellent schools, golf courses, and high-end amenities.
Many buyers are moving from out of state, particularly from California, due to the city’s lower taxes, beautiful weather, and lifestyle offerings.
Luxury Market: There has been a steady demand for luxury properties, with many affluent buyers attracted to Scottsdale’s upscale communities and second-home market.
Appreciation: Home prices have been appreciating steadily, with slight moderation expected in the coming months as the market adjusts. However, demand is still expected to outpace supply in the near term.
Luxury Home Prices: The luxury market has seen a 5-10% increase in prices over the past year, especially in areas like DC Ranch, Silverleaf, and Troon North.
Scottsdale also has a strong rental market, driven by seasonal demand and the popularity of the area among vacationers, especially in the winter months.
Short-term rentals are a popular investment option, especially in areas near Old Town Scottsdale, where demand for vacation properties remains high.
Scottsdale’s real estate market is likely to remain stable but competitive through 2025, especially given the area's appeal to both retirees and high-net-worth individuals looking for a vacation home or primary residence.
There is a potential for slight cooling in home price appreciation as interest rates fluctuate and the economy stabilizes, but strong demand from both in-state and out-of-state buyers should keep the market robust.
|
|
Scooped by
AZ Mountain Lake Realty
April 18, 2025 7:10 AM
|
Scoop.it!
Southern Arizona Real Estate Market Update: Buyer's Market Continues. We talk about the real estate market in Southern Arizona, where 732 new homes came onto the market, 392 were closed, and 389 went active contingent. The big news is that 865 homes dropped their prices in the last week, indicating that this is still a buyer's market that is likely to continue until mid-June. We encourage buyers to take advantage of this market by providing assistance with down payments, closing costs, and home inspections, allowing them to get into a home for as little as $500 to $1,000 out of pocket. #RealEstate #SouthernArizona #BuyersMarket #DownPaymentAssistance #realestate
|
|
Scooped by
AZ Mountain Lake Realty
April 16, 2025 7:16 PM
|
Scoop.it!

PadSplit offers clean, modern furnished rooms for rent to community members at an affordable weekly fee, including utilities, WiFi, laundry access, 24/7 telemedicine service and more. See available homes today.
|
|
Scooped by
AZ Mountain Lake Realty
April 16, 2025 7:10 AM
|
Scoop.it!
KTAR News' housing highlight series continues with reporter Balin Overstolz speaking with real estate experts from around the Valley to explain where housing growth is happening the most in Arizona.
Who was left behind as affordable options dried up?: https://ktar.com/arizona-real-estate/phoenix-housing-market-today/5692858/
Subscribe to the KTAR Daily Newsletter: https://bit.ly/45MmM3G
Read articles from KTAR News: https://ktar.com/
Download the KTAR app: https://ktar.com/the-ktar-newstalk-app/
Sign up for texts from KTAR: https://bit.ly/3EoCmGV
Listen live to KTAR: https://ktar.com/listen-to-ktar-92-3-fm-anywhere/
Watch live: ktar.com/watch-live
KTAR SOCIAL MEDIA
Facebook: https://www.facebook.com/KTARNews
X: https://x.com/KTAR923
TikTok: https://www.tiktok.com/@ktarnews
Instagram: https://www.instagram.com/ktarnews/
KTAR PODCASTS: https://bit.ly/45Ox5nX
Video: Jeremy Schnell and Felisa Cárdenas/KTAR News
Photo: Mario Tama/Getty Images
|
|
Scooped by
AZ Mountain Lake Realty
April 14, 2025 1:02 PM
|
Scoop.it!

Buyers and renters of all ages were left behind as affordable options dried up. How did the metro Phoenix housing market get to this point?
|
|
Scooped by
AZ Mountain Lake Realty
April 14, 2025 9:48 AM
|
Scoop.it!

We’ve built the first nationwide database of evictions. Use our map tool to see eviction rates in your community, view rankings for places across the country, and learn about the causes and effects of residential instability.
|
|
Scooped by
AZ Mountain Lake Realty
April 14, 2025 7:31 AM
|
Scoop.it!

Even among respondents planning to hire agents, only 70% said they trust them, the report noted, marking a decline from 81% in the prior year.
|
|
Scooped by
AZ Mountain Lake Realty
April 13, 2025 3:22 PM
|
Scoop.it!
👉Get my weekly newsletter.http://eepurl.com/h0A7B1
If you are thinking about locating to the Phoenix area we'd love to =
🌟Search the MLS for Phoenix homes for sale: https://link.flexmls.com/1tpbamapeghp,12
👉#1 Recommended Credit System:
#airizonarealestate #homesinarizona #Phoenixhomes
|
|
Scooped by
AZ Mountain Lake Realty
April 13, 2025 7:16 AM
|
Scoop.it!
The average U.S. mortgage rate has fluctuated significantly since 1971, largely influenced by economic conditions like inflation, the Federal Reserve's policies, and the overall state of the housing market. Here’s a general breakdown of the average 30-year fixed mortgage rates by decade:
1970s: The average mortgage rate was around 8-9%, but it began rising towards the end of the decade due to inflation and oil crises.
1980s: Rates peaked in the early 1980s, reaching a high of around 18% in 1981 due to aggressive monetary policies to combat inflation. They eventually came down to the 10-12% range by the mid and late 1980s.
1990s: Mortgage rates dropped significantly throughout the decade, averaging around 7-8%, with some fluctuations.
2000s: Early in the decade, rates were relatively low, around 6-7%, but they dropped further in the mid-2000s to around 5-6%. However, in the latter part of the decade, leading into the Great Recession, rates fell as low as 4-5%.
2010s: Rates stayed low, with averages ranging from 3.5-5%, especially after the financial crisis of 2008 and the Federal Reserve’s measures to stimulate the economy. In 2012, rates hit record lows, around 3.3%.
2020s: In the wake of the COVID-19 pandemic, mortgage rates dropped to historic lows, falling as low as 2.6% in 2020. However, they began rising again in 2022 and 2023 due to inflation and tightening monetary policies, often averaging around 6-7% in 2023 and early 2024.
Here’s a more detailed year-by-year average of the 30-year fixed mortgage rates from 1971 to the present:
1971: ~7.3%
1972: ~7.3%
1973: ~8.0%
1974: ~9.2%
1975: ~9.0%
1976: ~8.9%
1977: ~8.9%
1978: ~9.6%
1979: ~12.0%
1980: ~13.7%
1981: ~18.5% (peak of the early 80s due to high inflation and Federal Reserve actions)
1982: ~16.0%
1983: ~13.5%
1984: ~13.9%
1985: ~12.4%
1986: ~10.2%
1987: ~10.1%
1988: ~10.3%
1989: ~10.3%
1990: ~9.9%
1991: ~8.5%
1992: ~7.4%
1993: ~7.3%
1994: ~8.4%
1995: ~7.9%
1996: ~7.7%
1997: ~7.6%
1998: ~6.9%
1999: ~7.4%
2000: ~8.1%
2001: ~6.9%
2002: ~6.5%
2003: ~5.8%
2004: ~5.8%
2005: ~5.9%
2006: ~6.5%
2007: ~6.4%
2008: ~6.1% (leading into the financial crisis)
2009: ~5.0% (falling due to the financial crisis)
2010: ~4.7%
2011: ~4.5%
2012: ~3.7% (historic low after the 2008 crisis)
2013: ~4.0%
2014: ~4.2%
2015: ~3.8%
2016: ~3.7%
2017: ~3.9%
2018: ~4.5%
2019: ~3.9%
2020: ~3.1% (historically low due to COVID-19 and economic stimulus)
2021: ~3.1%
2022: ~5.1% (rates started to rise as the Fed acted to control inflation)
2023: ~6.4%
2024: ~6.5% (approximate early 2024 rates, though they can fluctuate)
|
|
Scooped by
AZ Mountain Lake Realty
April 12, 2025 8:22 AM
|
Scoop.it!

View today's current mortgage rates with our national average index, calculated daily to bring you the most accurate data when purchasing or refinancing your home. Follow our daily market analysis with Mortgage Rate Watch and we'll tell you where and why rates are moving.